 Benjamin R. Gilbert1
 Zane R. Thornburg1
 Troy A. Brier1
 Jan A. Stevens2
 Fabian Grünewald2
 John E. Stone3,4
 Siewert J. Marrink2
 Zaida Luthey-Schulten1,4,5*
- 1Department of Chemistry, University of Illinois at Urbana-Champaign, Urbana, IL, United States
- 2Molecular Dynamics Group, Groningen Biomolecular Sciences and Biotechnology Institute, University of Groningen, Groningen, Netherlands
- 3NVIDIA Corporation, Santa Clara, CA, United States
- 4NIH Center for Macromolecular Modeling and Bioinformatics, Beckman Institute, University of Illinois at Urbana-Champaign, Urbana, IL, United States
- 5NSF Center for the Physics of Living Cells, Department of Physics, University of Illinois at Urbana-Champaign, Urbana, IL, United States
Computational models of cells cannot be considered complete unless they include the most fundamental process of life, the replication and inheritance of genetic material. By creating a computational framework to model systems of replicating bacterial chromosomes as polymers at 10 bp resolution with Brownian dynamics, we investigate changes in chromosome organization during replication and extend the applicability of an existing whole-cell model (WCM) for a genetically minimal bacterium, JCVI-syn3A, to the entire cell-cycle. To achieve cell-scale chromosome structures that are realistic, we model the chromosome as a self-avoiding homopolymer with bending and torsional stiffnesses that capture the essential mechanical properties of dsDNA in Syn3A. In addition, the conformations of the circular DNA must avoid overlapping with ribosomes identitied in cryo-electron tomograms. While Syn3A lacks the complex regulatory systems known to orchestrate chromosome segregation in other bacteria, its minimized genome retains essential loop-extruding structural maintenance of chromosomes (SMC) protein complexes (SMC-scpAB) and topoisomerases. Through implementing the effects of these proteins in our simulations of replicating chromosomes, we find that they alone are sufficient for simultaneous chromosome segregation across all generations within nested theta structures. This supports previous studies suggesting loop-extrusion serves as a near-universal mechanism for chromosome organization within bacterial and eukaryotic cells. Furthermore, we analyze ribosome diffusion under the influence of the chromosome and calculate in silico chromosome contact maps that capture inter-daughter interactions. Finally, we present a methodology to map the polymer model of the chromosome to a Martini coarse-grained representation to prepare molecular dynamics models of entire Syn3A cells, which serves as an ultimate means of validation for cell states predicted by the WCM.
1 Introduction
The goal of computational modeling of a single cell is to create whole-cell models (WCMs) that propagate the state of an entire cell through time, where the propagation is governed by the chemical and physical interactions within the cell and between the cell and its environment (Karr et al., 2012; Goldberg et al., 2018; Macklin et al., 2020; Marucci et al., 2020; Luthey-Schulten et al., 2022; Maritan et al., 2022; Thornburg et al., 2022). To model any cell in 3D, configurations and dynamics of the chromosome(s) are critical in defining the spatial heterogeneity of gene expression over the course of a cell-cycle (Llopis et al., 2010). While there are several existing models that can simulate entire bacterial chromosomes (Buenemann and Lenz, 2010; Messelink et al., 2021; Wasim et al., 2021), relatively few are at spatial resolutions less than hundreds to thousands of base pairs (bp) per particle (Hacker et al., 2017; Goodsell et al., 2018; Gilbert et al., 2021). Here, we introduce a computational model to simulate the 3D dynamics of the chromosome of a genetically minimal bacterium, JCVI-syn3A, at 10-bp resolution including replicating chromosome states (Cooper and Helmstetter, 1968; Bremer and Dennis, 2008; Youngren et al., 2014) and loop-extrusion by structural maintenance of chromosomes (SMC) protein complexes (Hirano, 2006; Alipour and Marko, 2012; Ganji et al., 2018; Lioy et al., 2020; Davidson and Peters, 2021; Lee et al., 2021).
JCVI-syn3A is a minimal bacterial cell with a chemically synthesized 543 kbp genome composed of 493 genes (Breuer et al., 2019). The SynX-series of organisms began with JCVI-syn1.0, which was created by transplanting a chemically synthesized Mycoplasma mycoides genome into living Mycoplasma cells (Gibson et al., 2010). JCVI-syn3.0 was subsequently created by synthetically reducing the 1,079 kbp genome of Syn1.0 until what was considered a genetically minimal bacterium with a 531 kbp genome, stripped of all but the necessary components to continue proliferating, was achieved (Hutchison et al., 2016). Finally, Syn3A was created by re-introducing 19 genes from Syn1.0 back into Syn3.0’s genome. While this produced an arguably less-minimal bacterium, it increased the growth rate (180 min doubling-time in Syn3.0 to 110 min doubling-time in Syn3A) (Breuer et al., 2019) and restored a regular spherical morphology to the cells (Pelletier et al., 2021).
With a genome and physical size approximately one-tenth the size of the model bacterium Escherichia coli, Syn3A is ideally suited for whole-cell modeling due to the corresponding reduction in complexity. Syn3A′s initial cell state was defined through experimental charactizations of its biochemical components — genome-wide gene-essentiality and proteomics (Breuer et al., 2019), metabolomics (Haas et al., 2022), lipidomics (Thornburg et al., 2022), and cellular architecture from cryo-electron tomography (cryo-ET) (Gilbert et al., 2021). Systematic investigations of the interactions amongst Syn3A′s biochemical components were undertaken — defining the metabolic map (Breuer et al., 2019), genetic information processes (Thornburg et al., 2019), and reaction kinetics of coupled metabolic/genetic information processes (Thornburg et al., 2022). By combining these with hybrid stochastic-deterministic methods leveraging GPU-accelerated simulation software (Roberts et al., 2012; Hallock et al., 2014; Bianchi et al., 2018), a well-stirred WCM (WS-WCM) and 3D spatially resolved WCM (4D-WCM) that predict time-dependent Syn3A cell states were created (Thornburg et al., 2022).
However, due to the methodology used to model the chromosome (Gilbert et al., 2021), the existing 4D-WCM was limited to the part of the cell-cycle prior to the onset of DNA replication (Thornburg et al., 2022). This study resolves that issue by transitioning from a lattice polymer model to a continuum polymer model (Figure 1A) of the chromosome, while retaining the previous model’s strengths; namely, the ability to fold chromosomes within cellular architectures dictated by cryo-ET and a high spatial resolution (10 bp per monomer) that enables modeling of the hetergeneous diffusion of macromolecular complexes due to excluded-volume interactions with the chromosome. Furthermore, the new method allows for progressive DNA replication of the chromosome to reach nontrivial replication states (Cooper and Helmstetter, 1968; Bremer and Dennis, 2008; Youngren et al., 2014; Khan et al., 2016; Wasim et al., 2021; Pountain et al., 2022) and for the segregation of daughter chromosomes (Goloborodko et al., 2016a; Gogou et al., 2021) under the influence of known essential components (Breuer et al., 2019), SMC-complexes (Ganji et al., 2018; Lee et al., 2021) and topoisomerases (Wang, 1991; McKie et al., 2021; Sutormin et al., 2021; Conin et al., 2022). These nontrivial replication states have Ori:Ter ratios greater than 2:1 (Figure 2), where Ori is the origin of replication and Ter is the terminus of replication, and were predicted in Syn3A by WS-WCM simulations and measured by experimental quantitative-PCR (qPCR) (Thornburg et al., 2022). These new capabilities lay the groundwork for the extension of the 4D-WCM to the full cell-cycle. Additionally, by using a binary tree model (Figure 2A) the full spectrum of replication of states for a circular chromosome can be explored and in silico chromosome contact maps resolving inter-daughter interactions can be calculated (Figure 3A).
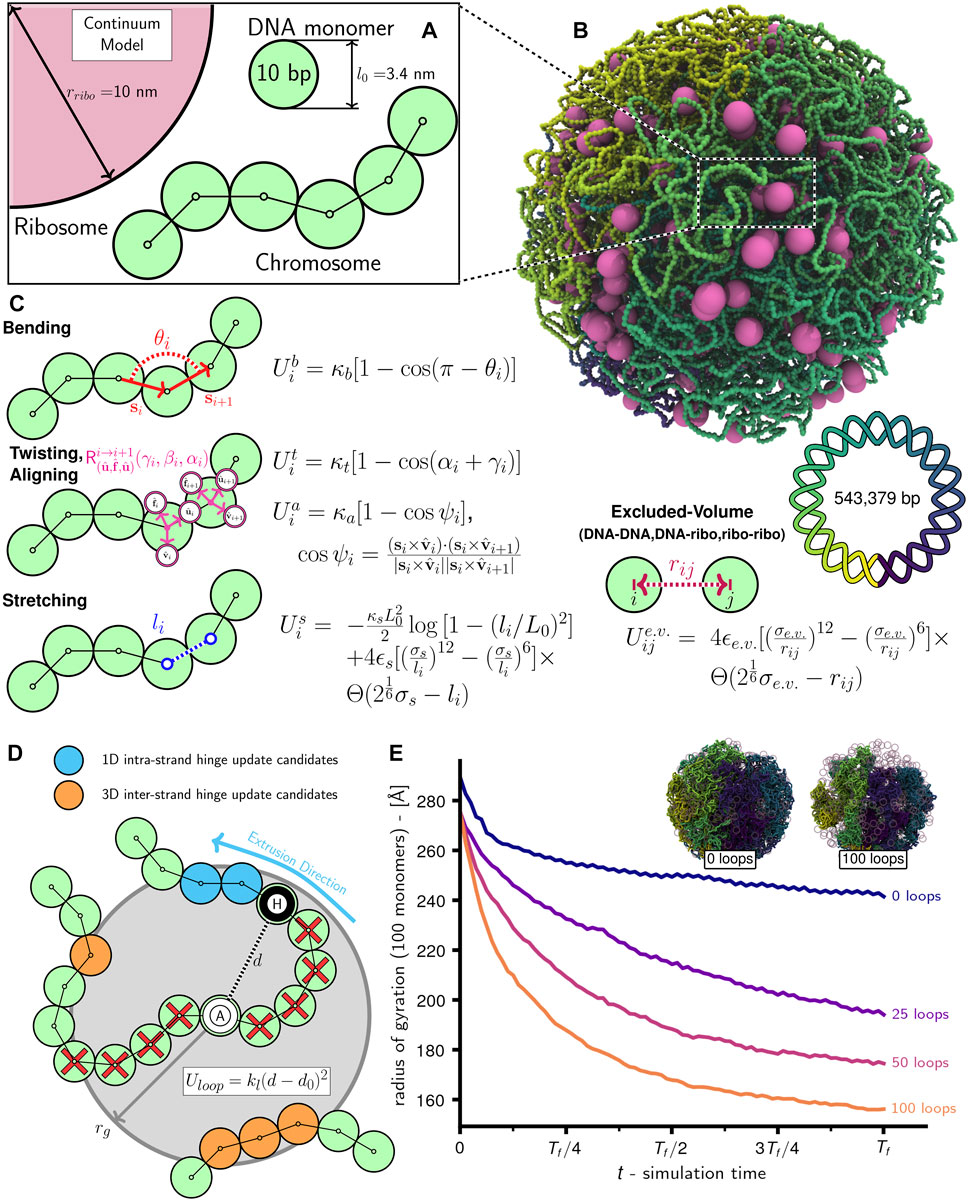
FIGURE 1. Schematic of chromosome modeling protocol: (A) Diagram of system with ribosomes and chromosome comprised of 10 bp DNA monomers. (B) Snapshot of system with an unreplicated 54,338 monomer Syn3A chromosome and 500 ribosomes in a 200 nm radius cell. (C) Bending
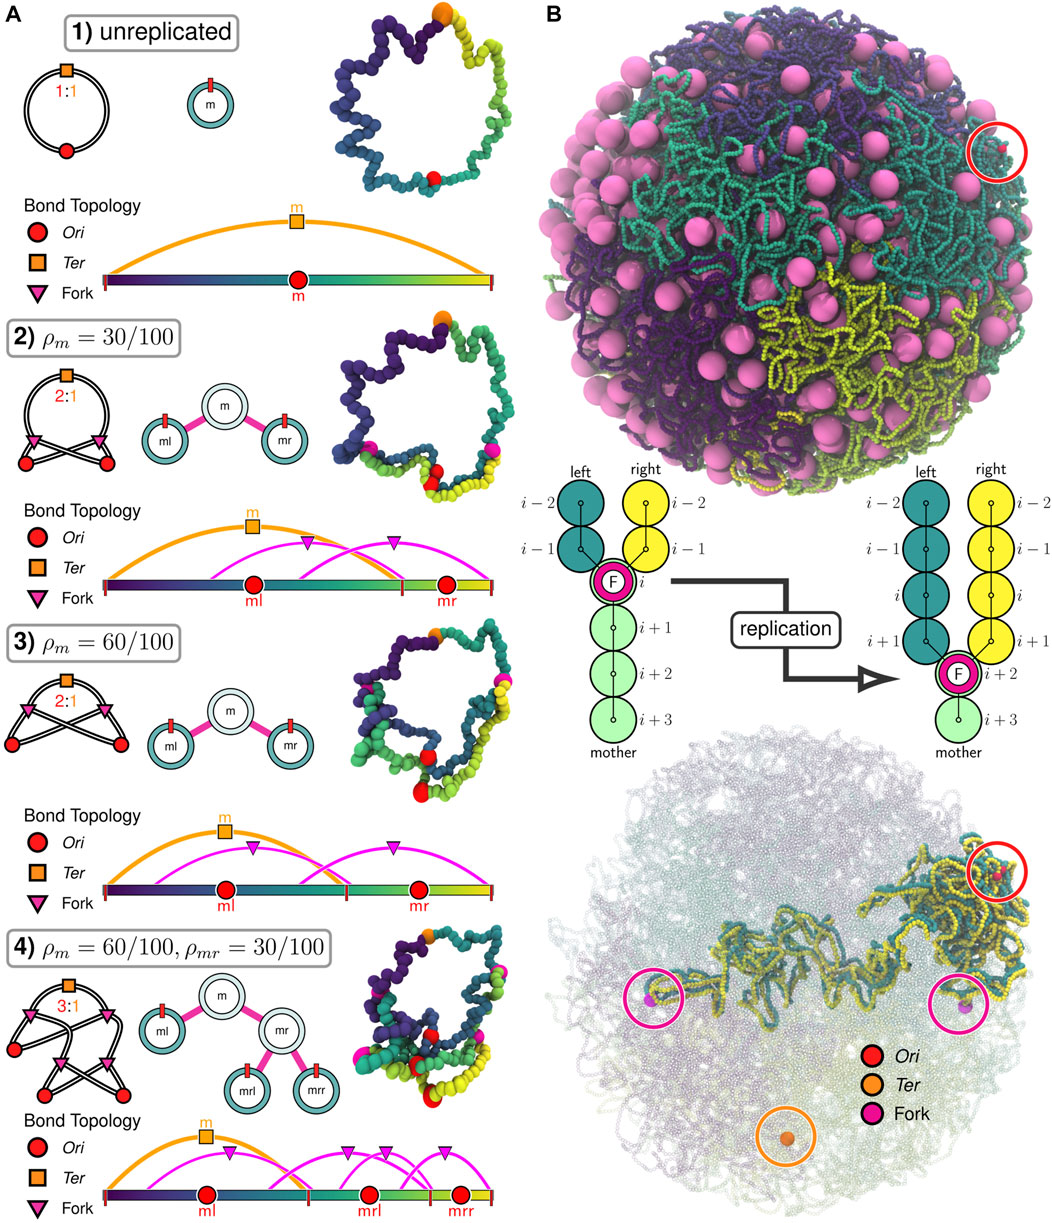
FIGURE 2. Replication of chromosomes in polymer model: (A) Progressive replication
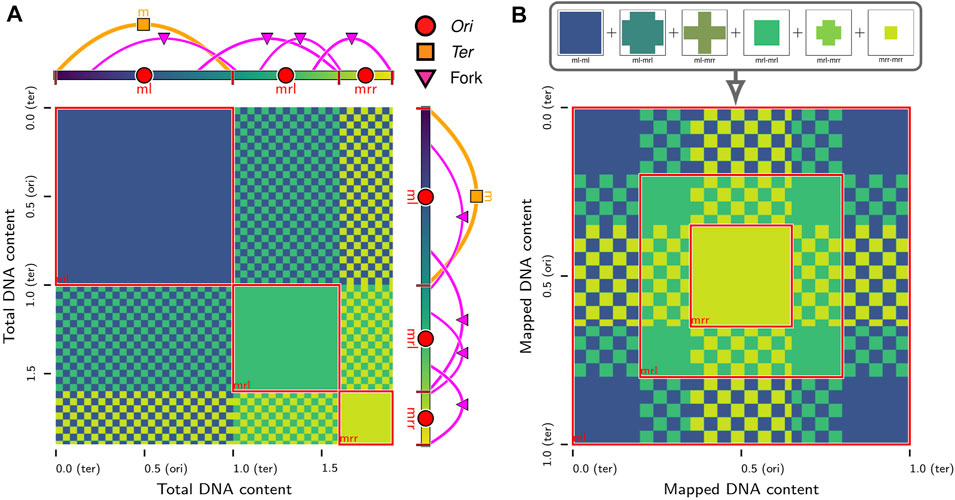
FIGURE 3. In silico contact calculations for replicating chromosomes: (A) The true contact map,
Beyond the information stored in the sequence of the genome, the 3D organization of eukaryotic (Kempfer and Pombo, 2019) and bacterial (Dame et al., 2019; Lioy et al., 2021) genomes plays a role in cellular behavior (Dekker and Mirny, 2016). While imaging techniques such as DNA-FISH (Giorgetti and Heard, 2016) provide insights about targeted interactions, the wide-spread accessibility of next-generation sequencing (Goodwin et al., 2016) catalyzed the proliferation of sequence-based techniques that assess genome-wide interactions such as DNA-protein binding using CHIP-seq (Park, 2009) and DNA-DNA proximity using chromosome conformation capture (3C) (Dekker et al., 2002). Following the creation of 3C, many variations have been developed (Denker and de Laat, 2016; Goel and Hansen, 2020), the most well-known of which is perhaps Hi-C (Lieberman-Aiden et al., 2009). Although researchers have a stunning breadth of experimental data characterizing interactions throughout the genome, computational models (Rosa and Zimmer, 2014; Tiana and Giorgetti, 2019) are required to solve the inverse problem of determining 3D genome organization (Di Pierro et al., 2017; Messelink et al., 2021; Shi and Thirumalai, 2023) and provide mechanistic insights (Sanborn et al., 2015; Fudenberg et al., 2016; Banigan et al., 2020; Fiorillo et al., 2021).
Syn3A is a compelling system for a systematic study of bacterial chromosomes (Birnie and Dekker, 2020), including but not limited to their replication and segregation, and the bacterial cell cycle (Olivi et al., 2021) because the protein functions encoded by its remaining essential genes hypothetically represent the minimal ingredients necessary for successful proliferation of bacterial cells. Based on what is known of chromosome organizing elements, key among these minimal ingredients should be at least one creating DNA loops (DNA regions distant in sequence but constrained in close spatial proximity) (Davidson and Peters, 2021) and one resolving DNA knots and catenanes (McKie et al., 2021). Syn3A′s genome encodes the prokaryotic condensin complex, SMC-scpAB (Table 1), whose Saccharomyces cerevisiae homolog extrudes DNA loops at rates of hundreds of bp per second (Ryu et al., 2021), along with two type-II topoisomerases that allow strand-passage of dsDNA (Liu et al., 1980), DNA-gyrase (gyrase) and topoisomerase-IV (topo-IV) (Table 1) — all of these genes were found to be essential by transposon mutagenesis (Breuer et al., 2019). We compare Syn3A′s proteomics counts of SMC-scpAB and type-II topoisomerases with respect to the model bacteria E. coli and B. subtilis on the basis of their counts relative to the total DNA content of the genome, as the DNA is what these proteins manipulate. After accounting for the 4:2:4 stoichiometry (Lee et al., 2021) of E. coli′s SMC complex, MukBEF, we find that the densities of SMC core proteins per bp of genome are ranked in decreasing order as 1) E. coli, 2) Syn3A, 3) B. subtilis (Table 1). However, the difference between E. coli and B. subtilis is only one order-of-magnitude and we can conjecture that this might be due to Syn3A and E. coli compensating for their lack of a parABS system (Livny et al., 2007; Badrinarayanan et al., 2015) that preferentially loads SMC complexes onto the chromosome (Marbouty et al., 2015; Tran et al., 2017). We find similar trends among the densities of the two type-II topoisomerases (Table 1). Given the comparable densities of these chromosome-manipulating proteins between Gram-positive (Syn3A and B. subtilis) and -negative (E. coli) bacteria, we feel that Syn3A is a suitable system in which to study the dynamics of bacterial chromosome organization.
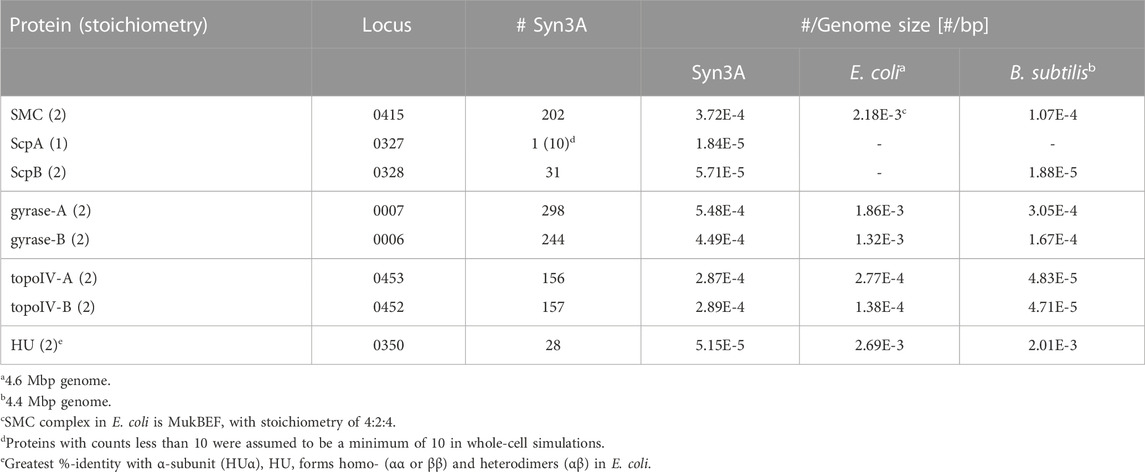
TABLE 1. Comparative proteomics of proteins in Syn3A that are known to interact with bacterial chromosomes (SMC-scpAB, DNA-gyrase, topoisomerase-IV, and HU). Values were taken from Supplementary Table S1 of (Thornburg et al., 2022).
As was noted in a previous study (Gilbert et al., 2021), unlike many bacteria Syn3A codes for a single nucleoid-associated protein (NAP) (Dame, 2005; Lioy et al., 2018; Verma et al., 2019; Lioy et al., 2021), HU (JCVISYN3A_0350), which is known to have two binding modes: 1) low-affinity binding to linear DNA and 2) high-affinity binding to structurally deformed DNA (Kamashev, 2000; Verma et al., 2023). One result of HU binding is the stabilization of supercoiling (Le et al., 2013; Lioy et al., 2018; Strzałka et al., 2022). Curiously, while the HU gene was found to be essential by transposon mutagenesis, the proteomics count is so vastly lower than that of E. coli, B. subtilis, and related-organism Mesoplasma florum (Gilbert et al., 2021) that its genome-wide influence (Pelletier et al., 2012) is likely to be negligible. Furthermore, chromosome contact maps from 3C-seq libraries of Syn3A do not exhibit chromosome interaction domains (CIDs) (Gilbert et al., 2021), which are known to be a result of persistent supercoiling (Le et al., 2013; Trussart et al., 2017; Lioy et al., 2018). Given these considerations, we hypothesize that HU’s lingering essentiality in Syn3A is a reflection of it only acting through an interaction specific to the high-affinity binding mode. In E. coli, HU is known to interact with replication initiator protein DnaA (Chodavarapu et al., 2007), HUα/DNA stoichiometry has been shown to increase for faster-growing E. coli cells (Abebe et al., 2017), and experimental evidence suggests a mechanism of HU promoting duplex unwinding at the oriC replication origin (Yoshida et al., 2023). Additionally, HU is essential for replication initiation in Gram-positive B. subtilis (Karaboja and Wang, 2022; Schramm and Murray, 2022), whose replication origin is similarly a DnaA-based oriC. Based on these results in other bacteria and HU’s enhanced binding to dsDNA repair and recombination intermediates (Kamashev, 2000), we believe a small number of HU was retained to fulfill an essential role during replication initiation using a DnaA-based oriC in Syn3A (Thornburg et al., 2019), but do not expect it to influence chromosome-scale organization with its reduced proteomics count, and therefore exclude HU from our model of the chromosome.
Given the absence of NAPs structuring Syn3A′s chromosome into bacterial chromatin (Dame and Tark-Dame, 2016), we chose to model the chromosome of essentially naked dsDNA as a twistable and elastic worm-like chain (Klenin et al., 1998; Brackley et al., 2014; Maffeo and Aksimentiev, 2020). The polymer is comprised of 3.4 nm diameter spherical monomers containing 10 bp of chromosomal DNA (Figure 1A), 54,338 such monomers bonded in a circle are used to create Syn3A′s 543,379 bp circular chromosome (Figure 1B). Adjacent monomers interact through stretching, bending, and twisting potentials (Figure 1C) that reproduce the tensile, bending, and torsional stiffness of dsDNA (Cocco et al., 2002; Brackley et al., 2014), and are parameterized by linear (45 nm) (Manning, 2006; Geggier et al., 2010; Mantelli et al., 2011) and twist (85 nm) (Mosconi et al., 2009) persistence lengths. The monomers are subject to non-bonded interactions that prevent strand-crossings and cause them to avoid ribosomes modeled as 20 nm diameter spherical particles (Figure 1C). We chose to neglect electrostatics and hydrodynamic interactions in this current model. The complete system of chromosomes and ribosomes is simulated using a Brownian dynamics (Snook, 2007) integrator for aspherical particles in LAMMPS (Thompson et al., 2022). To explore the influence of loop-extruding SMC complexes and strand-crossing type-II topoisomerase in this framework, we have developed algorithms to selectively introduce and remove additional terms in the energy function that emulate their effects.
While the computational methodologies described in this paper are tailored to reaching the longer-timescales necessary for WCMs that include fundamental processes of bacterial life such as chromosome replication and segregation, returning to the near-atomic scale provides the ultimate means of validation and reveals additional insights. Researchers have previously completed molecular dynamics (MD) simulations of representative volumes of bacterial cytoplasm (Yu et al., 2016; Rickard et al., 2019; Heo et al., 2022), but only recently has it become possible to prepare a MD simulation of an entire bacterium (Stevens et al., 2023). We will describe how our polymer model for the chromosome can be directly mapped to a coarse-grained Martini model (Marrink et al., 2022) of dsDNA that is ready to be simulated using Gromacs-2023 (Páll et al., 2020; Abraham et al., 2023).
2 Materials and methods
2.1 Twistable polymer model
The chromosome is modeled under the assumption that due to the low density of NAPs in Syn3A, the vast majority of the chromosome is essentially naked dsDNA in a good solvent (Breuer et al., 2019; Szatmári et al., 2020; Thornburg et al., 2022). The naked dsDNA is represented as a twistable and elastic worm-like chain of spherical monomers, each of which contain 10 bp of DNA and have a radius (rDNA) of 1.7 nm. We model the 10 bp monomers as spheres rather than 3.4 nm cylindrical segments with diameters equal to that of a dsDNA helix (2 nm) because using isotropic pair potentials for spherical particles is less computationally intensive. We consider the spherical monomer approximation acceptable for our chromosome-scale model because relative to a cylindrical segment the excluded volume is overestimated by less than a factor of two and the translational damping (Section 2.2) is overestimated by only 15% (Supplementary Analyses). Monomers interact through the energy function from Brackley et al. (Brackley et al., 2014) — the monomers are bonded using finitely extensible nonlinear elastic (FENE) potentials (li in Figure 1C), the bending stiffness of dsDNA is implemented using a cosine potential whose argument is the angle (θi in Figure 1C) between (i − 1)-, i-, and (i + 1)-th monomers, and the torsional stiffness of dsDNA is implemented using a cosine potential whose argument is the sum of Euler angles parameterizing the rotation matrix describing the transformation between the local coordinate systems,
The chromosome as a whole is modeled as a homopolymer and all monomers, including those representing the Oris, Ters, and forks, have an identical radius of rDNA. The ribosomes are modeled as spheres with a radius (rribo) of 10.0 nm. Not pictured in Figure 1 are boundary particles with a radius (rbdry) of 5rDNA that create the closed membrane shape. All non-bonded particles interact through purely repulsive Weeks-Chandler-Andersen (WCA) pair potentials (Figure 1C), which serve to prevent dsDNA strand-crossings (Supplementary Video SV1), create the excluded-volume interactions between the chromosome and ribosomes, and confine all DNA monomers and ribosomes within the surface comprised of boundary particles.
The total potential energy function for the chromosome/ribosome system is
where the details of the energy functions may be found in Figure 1A. Soft pair potentials of the form
are used to reduce overlaps during energy minimizations (replacing
during the initial energy minimizations to prevent over-stretching. Excluding the SMC looping interactions, which are described in greater detail in Section 2.3, all energetic parameters for the potential energy function are listed in Table 2.
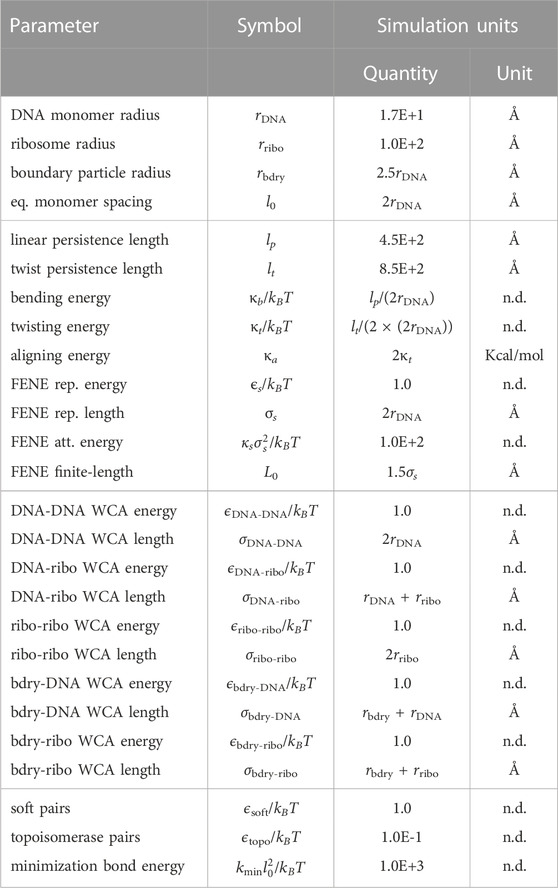
TABLE 2. Potential energy parameters for the chromosome and ribosome system. All simulation units are using “units real” in LAMMPS (Thompson et al., 2022).
2.2 Brownian dynamics
The time-integration was carried out using an OpenMP-accelerated version of the Brownian dynamics integrator for aspherical particles (Delong et al., 2015; Ilie et al., 2015) in LAMMPS (Thompson et al., 2022). The Brownian equation of motion
approximates the overdamped limit of the Langevin equation
and is only an accurate approximation if the inertial forces are insignificant compared to the viscous forces (Snook, 2007). The mass of the 10 bp monomers is sequence-independent and was calculated as the molar mass of an average 10 bp sequence from Syn3A′s genome (Breuer et al., 2019). We model only complete 70S ribosomes with an assumed mass of 2,700 KDa (Yamamoto et al., 2006). Both ribosomes and DNA monomers are assumed to behave as spherical particles undergoing normal Brownian motion in a Newtonian fluid. In the case of the ribosomes, their characteristic size is 20 nm when we do not include polysomes (multiple ribosomes translating a single mRNA) (Xue et al., 2022), and their motion should be decoupled from metabolic activity due to falling below a 30 nm size threshold (Parry et al., 2014). Although the chromosome is a cytoplasmic component with size well in excess of this threshold, we model the DNA monomers under the same simplifying assumption of normal Brownian motion. In reality, bacterial chromosome dynamics are a result of ATP-dependent motion (Weber et al., 2012), and part of this motion originates from loop-extrusion by SMC (Hirano, 2006), which is addressed by another part of our computational model (Section 2.3). The damping coefficients for the translational and rotational motion of DNA monomers and ribosomes are listed in Table 3. Translational damping constants,
with the dynamic viscosity used previously in the 4D-WCM (Thornburg et al., 2022). Rotational damping constants,
the timestep, Δt = 0.1 ns, was selected such that it satisfies the conditions of the overdamped limit of the Langevin equation,
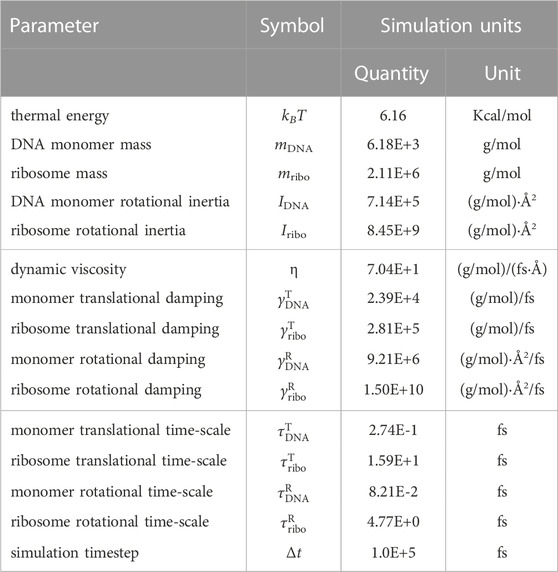
TABLE 3. Time-integration parameters for the Brownian dynamics simulations. All simulation units are using “units real” in LAMMPS (Thompson et al., 2022).
2.3 SMC-induced DNA loops
The 3D loop-extruding action of SMC protein complexes are simulated using the methodology of Bonato and Michieletto (Bonato and Michieletto, 2021; Ryu et al., 2021), which simulates the action of SMC heads associating with the DNA and then translocating the DNA between the head and the hinge (Nunez et al., 2019). DNA loops are created by adding harmonic bonds between “anchor” and “hinge” monomers (Figure 1D)
rather than explicitly simulating the conformational changes of SMC protein complexes (Higashi et al., 2021; Nomidis et al., 2022). Due to physical considerations of the bending stiffness of dsDNA, the anchor and hinge monomers of all loops are required to be separated by a minimal loop length, Lmin, in units of bonded monomer distance (Figure 1D). Loops are initialized by first identifying regions of the chromosome accessible to loops by determining contiguous series of bonded monomers that are partitioned by replication forks at either end. Anchors are then randomly assigned to each of the regions with a probability proportional to the number of monomers in the region relative to the total number of looping accessible monomers across all regions. The region-assigned anchors are distributed uniformly within their respective regions. Finally, for each anchor a matching hinge is selected in a random direction along the polymer, and at a distance of bonded monomers that is equal to the minimal loop length.
Loop extrusion is simulated by periodically pausing the time-integration and updating the positions of the hinges while leaving the anchors fixed. There are two possible events during these hinge-update steps (Bonato and Michieletto, 2021) — 1) intra-strand motion in which the hinge advances in 1D along the current strand in the previously assigned direction or 2) inter-strand motion in which the hinge unbinds from the current strand with probability punbind and rebinds to a new strand within a 3D spherical volume centered about the anchor (Figure 1D). For this study we made the simplifying assumption that only intra-strand motion is permitted (punbind = 0), which has been used in other studies (Ryu et al., 2021), but the software is capable of simulating inter-strand motion. For both types of updates, only monomers whose distance from the anchor monomer is less than the grab radius, rg, and in the case of intra-strand updates, whose bonded monomer distance on the current strand is greater than the minimal loop length, are considered as viable update candidates (Figure 1D). The grab radius is chosen to be 50 nm based on the coiled-coil structure of SMC protein complexes (Diebold-Durand et al., 2017). Based on results showing that eukaryotic SMC complexes can traverse one-another to form Z-loops (Kim et al., 2020), we do not include any interactions between hinge and anchors that are not paired.
If the first case of intra-strand motion is selected with probability 1 − punbind, the update monomer is selected from the set of intra-strand candidates by sampling a Poisson distribution with mean Lext-avg and truncated at Lext-max. Based on step-size distributions measured with magnetic tweezers (Ryu et al., 2021) and analytical calculations (Takaki et al., 2021), we chose these to be Lext-avg = 20 monomers (68 nm) and Lext-max = 30 monomers (102 nm). Should there be no intra-strand candidates, the hinge will remain at its current monomer. If the second case of inter-strand motion is selected with punbind, the update monomer is selected from the set of inter-strand candidates with equal probability. Should there be no inter-strand candidates following an unbinding, the hinge will remain unbound until there are inter-strand candidates in a subsequent hinge update step. The pseudocode for this process is presented in Supplementary Algorithm S1.
The length-scale of the grab radius is much greater than that of pairwise interactions between non-bonded DNA monomers, we therefore make the simplifying assumption that the DNA monomers available as hinge update candidates have a nearly uniform distribution within the spherical volume of radius rg centered about any anchor. Under such conditions, the average separation distance,
the loop will then perform on average the amount of work,
given that each extrusion event (emulated by hinge updates and subsequent pulling in this case) was measured to complete approximately 4kBT of work (Ryu et al., 2021) and ATP hydolysis is sufficient to provide this, we estimate the spring constant in our model to be
all spatial, energetic, and probabilistic parameters for the loop-extrusion model are listed presented in Table 4.
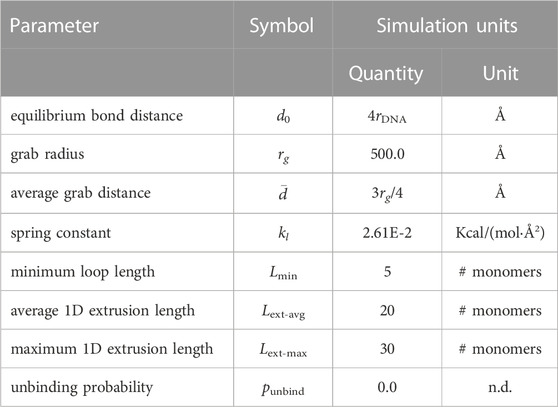
TABLE 4. Energetic, spatial, and probabilistic parameters for SMC loops. All simulation units are using “units real” in LAMMPS (Thompson et al., 2022).
2.4 Polymer model simulation protocols
2.4.1 Simulation software
All polymer model simulations were performed using the C++ program btree_chromo (Supplementary Table S1), which implements the binary tree model of replication states, replication within the chromosome system using the train-track model, and Brownian dynamics simulations that include the effects of SMC complexes and topoisomerases by calling LAMMPS as a library (Thompson et al., 2022). This program is executed from the command-line and takes a single input script of program directives that it then parses into commands and parameters before executing in sequence. Additionally, a number of metacommands are included that allow for sections of the script to be repeated within loops and other similar functions that aid in defining simulation protocols. All directives are documented within the project’s repository (Supplementary Table S1). Spatial, energetic, and temporal parameters for the model and subroutines that are regularly performed during the course of simulations are stored within a separate directory as a set of LAMMPS input scripts that are fed into the LAMMPS simulation object. The directory containing LAMMPS input scripts can be redefined, allowing the user to systematically test alternate chromosome models or change models on-the-fly within a simulation. Walltimes for a representative selection of the simulations presented in this study are included in Supplementary Table S2.
2.4.2 Generating initial conditions
Initial configurations of the chromosome are generated using an algorithm based on a midpoint-displacement approach (Fournier et al., 1982) that builds three-dimensional, closed curves resembling Koch curves (von Koch, 1904) out of spherocylinder segments (i.e., cylinders with hemispherical caps) that overlap about the centerpoint of the caps (Supplementary Figure S1A). Given a spherical cell containing a known spatial distribution of ribosomes, the initially unrelaxed configuration of the continuum model is placed within the confines of the spherical cell by growing a circular and self-avoiding chain of spherocylinders. The freely-jointed chain of spherocylinders uses a series of decreasing cylinder lengths during the growth process to generate a chromosome configuration organized as a fractal globule (Lua et al., 2004) with clearly-defined chromosomal territories (Lieberman-Aiden et al., 2009; Sanborn et al., 2015), which is consistent with our previous lattice methodology (Gilbert et al., 2021). This is accomplished using an iterative procedure in which a specified number of spherocylinder segments are added. Self- and ribosome-avoidance are imposed at every stage between the spherocylinder segments and the spherical ribosomes. Furthermore, tracking the crossing of the spherocylinders during segment addition steps was used to prevent the introduction of knots. In the final step, spherical monomers with radii equal to the spherocylinder radii (17.0 Å) are then interpolated along the spherocylinders and any remaining monomers are inserted using an equivalent midpoint-displacement method. The model of an unreplicated Syn3A chromosome is comprised of 54,338 monomers, each containing 10 bp. This method creates suitable chromosome configurations for both the small and large Syn3A cell geometries and ribosome distributions reconstructed from cryo-ET (Gilbert et al., 2021) (Supplementary Figures S1B–C) and has been further extended to fill cell geometries with multiple circular chromosomes simultaneously (Supplementary Figure S2).
2.4.3 Standard polymer model simulations
At the start of any polymer model simulation and before any Brownian dynamics steps are taken, potential particle overlaps are relaxed by running the following sequence of minimizations and short runs (Table 5): 1) minimize_soft_harmonic, 2) run_soft_harmonic, 3) minimize_hard_harmonic, 4) run_hard_harmonic, and 5) minimize_hard_FENE. The stopping criteria and maximum number of iterations for each of these are defined within the directory of input scripts. This is sufficient to relax the initial structure without significantly altering it, while remaining tolerant to the insertion of new monomers, ribosomes, or reshaping of the boundary. Brownian dynamics integration then proceeds using run_hard_FENE to simulate the system with stretching, bending, and twisting of the dsDNA polymer while preventing strand-crossings. Following replication using the train-track model (Figure 2B), the system is relaxed using the previously mentioned protocol to resolve particle overlaps that may have resulted from the addition of new monomers.
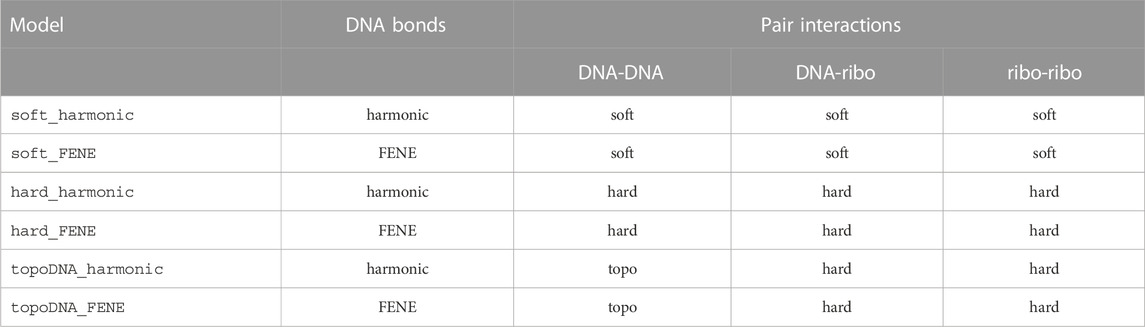
TABLE 5. Models used during energy minimizations (minimize_“bonds_pairs”) and Brownian dynamics time-integrations (run_“bonds_pairs”) of the system. Hard-pair interactions are used between boundary particles and all other particles for every model.
2.4.4 Simulations with SMC-looping and topoisomerases
Given that SMC complexes and topoisomerases were identified to be essential in Syn3A by transposon mutagenesis, we developed a simulation method to describe their interaction with the DNA at the scale of the full chromosome. Simulations of systems that include SMC-looping and the action of topoisomerases are performed using an algorithm that iteratively alternates between updating loop locations, minimizing the now non-equilibrium system’s energy, and performing Brownian dynamics steps (Supplementary Algorithm S2). We chose to use this approach because the small timesteps (Δt = 0.1 ns) used to prevent strand-crossings of the 10 bp monomers would otherwise prevent us from running Brownian dynamics over timescales required for multiple loop-extrusion steps that occur on the order of seconds (Ryu et al., 2021). Intermittently, this process is stopped to run a set of Brownian dynamics steps with DNA-DNA pair interactions replaced by soft potentials permitting strand-crossings, run_topoDNA_FENE (Table 5). This and similar approaches have been used in previous studies to model the net effect of topoisomerases (Goloborodko et al., 2016a; Mitra et al., 2022b). We note that this better emulates topo-IV rather than gyrase, but we feel this is appropriate given that topo-IV is known to primarily decatenane replication products (Zechiedrich et al., 1997; Cebrián et al., 2015). The number of loops, duration of loop simulations before updates (Δtloops), frequency of topoisomerase runs (Ttopo), and duration of topoisomerase runs (ΔTloops) are specified by the user. For the simulations in this study we used the following values in units of timesteps: Δtloops = 10,000, Ttopo = 50,000, Δtloops = 50,000. Additionally, this algorithm was restarted every 100,000 timesteps to sample new locations for the loop anchors. Simulations show that increased loop numbers lead to greater chromosome compaction (Figure 1E), with 100 loops reducing the windowed radius of gyration by approximately 35% relative to the case with 0 loops.
2.5 Replication states
Beyond the configurational state of the chromosome, we wish to consider the replication state of the chromosome system. We will use a binary tree model (Taylor and Garnier, 2009) (Figure 2A), where the replication state is described by the extent of replication for each of the possible Oris. The Oris are labeled by their lineage relative to the mother chromosome (m), i.e., the root of the tree. For example, replication of the mother chromosome produces two new daughter Oris, a left daughter (ml) and a right daughter (mr). This pattern continues for subsequent generations, i.e., the mother’s right daughter (mr) will create the daughter Oris labeled mrl and mrr when it undergoes replication (Figure 2A). Aside from the initial mother chromosome, we uniformly refer to Oris represented as leaves in the binary tree (Figure 2A) as “daughters” and use the label to describe the generation, i.e., a daughter (ml) vs. a granddaughter (mrl).
If we assume the mother is the zero-th generation, we can write the space of labels for the q-th generation as Iq = {I0, I1, …, Iq−1, Iq}, where I0 = m and Ij ∈ (l, r) for all j > 0. This is essentially a q-dimensional vector of binary values (the zero-th element is trivially constant), but for clarity we will write it as a list of labels selecting the left/right daughters at each generation. If we have a chromosome in the q-th generation with the label iq, then we denote the labels of its daughters in the (q + 1)-th generation as iql and iqr. Conversely, if we have a chromosome in the q-th generation with label iq, then we denote the label of its mother in the (q − 1)-th generation as
The genomic content of any daughter chromosome is determined by the extent of replication of its mother. i.e., the genomic content of the chromosome labeled iq is determined by the extent of replication, ρ, of the chromosome labeled
where
The replication microstates are subject to two constraints. First, the extent of replication of the daughter chromosome with label is may not exceed that of its mother with label
this constraint is included because it is physically impossible for a daughter to replicate DNA sequences that do not yet exist. Second, the total replication extent,
these two constraints guarantee that only physically realistic replication states are permitted by the model. A change in replication microstate is denoted as
where only the forks with a nonzero change are included. Changes that lead to replication states not satisfying the two constraints are instead completed up to the maximum extent at which the constraints are still satisified.
We have previously presented a formal definition of replication microstates, we now turn to characterizing replication macrostates using state variables that correspond to experimental measurements. We begin this by defining a number of quantities that are measurable by experiments for the replication microstates. The total DNA content of a replication microstate relative to the DNA content of a single, unreplicated chromosome is given by
and corresponds to experimental measurements of the DNA content, such as fluorescent intensity of stained DNA. The number of Oris in a replication microstate is given by
where Θ is again the Heaviside step-function. The number of Ters in a replication microstate is given by
the ratio of the most-replicated region to the least-replicated region in a replication microstate is the number of Oris divided by the number of Ters and is given by
and corresponds to experimental measurements comparing the relative quantities of target sequences, such as qPCR. Given experimental measurements of the DNA content, Gexp. and ϒexp., in a population of cells, and a maximum possible generation, p, we wish to determine the distribution of replication microstates,
are satisfied.
2.6 Train-track model of replication
In the “train-track” model of bacterial DNA replication (Gogou et al., 2021), the replisomes are thought to independently traverse the opposite arms of the mother chromosome while replicating the DNA (Dingman, 1974). Recent work has provided additional evidence for the train-track model by imaging independently moving replisomes using fluorescently labeled β-clamps (DnaN) in E. coli cells with synchronized replication initiation (Japaridze et al., 2020). We assume that DNA replication in Syn3A obeys the train-track model due to the aforementioned experimental evidence and the absence of multi-protein regulatory systems coded for in the minimized genome (Breuer et al., 2019; Thornburg et al., 2022).
In our implementation of the train-track model, monomers are added to the left and right daughter chromosomes following replication events by creating pairs of additional monomers centered about the location of the mother’s corresponding monomer (Figure 2B). For convenience, we will denote the spatial coordinates of the i-th monomer of mother, left daughter, and right daughter as
where
This method is applicable to nontrivial replication states (Figure 2A), efficiently replicates the chromosome in crowded environments (Figure 2B), and can occur mid-simulation (Supplementary Video SV2). Additionally, because this method is based on the binary tree model, it can be applied for replication events involving multiple forks (e.g.,
For the purposes of this model, we neglect to include the difference in the leading-versus lagging-strands, and model the fork itself as a standard DNA monomer. We add a harmonic angle potential of the form
between the following triplets of particles formed by the fork (f) and three bonded monomers, mother (m), left (l), and right (r): (m-f-l), (m-f-r), and (l-f-r). The parameters are θ0 = 2π/3 radians and kfork × (1 radian)2 = κb. Additionally, there are no torsional interactions between (f-m), (f-r), or (f-l).
2.7 Chromosome segregation calculations
Given a pair of replication forks producing left and right daughters, each of which may themselves be potentially undergoing replication, the sets of Nl and Nr replicated monomers belonging to the left and right daughters are
2.7.1 Disentanglement
The number of monomers belonging to the same (s) daughter within a radius, R, of the i-th replicated monomer of the left/right (l/r) daughter are
and the number of monomers belonging to the opposite (o) daughter within that radius are
the fraction of monomers on the same daughter within the radius about the i-th monomer is
the average fraction for each daughter is
and the degree of disentanglement (DoD) is a function of these
we use the harmonic mean for this function as it provides a conservative estimate, then shift and scale the result such that the range of the degree of disentanglement is [0,1]
using this definition, 0 corresponds to a fully entangled system that overlaps everywhere and 1 corresponds to a disentangled system whose constituent parts are separated by at least a distance R. When calculating the DoD for our system we use R = 4rDNA.
2.7.2 Partitioning
We evaluate the extent to which the daughter chromosomes are partitioned by calculating the distance between their centers of mass (CoM)
where
the dCoM was then compared to a length-scale characteristic of what we will refer to as an “ideal partitioning”. In an ideal partitioning, we assume the daughters will occupy volumes that are proportional to their relative sizes, Nl and Nr, in units of monomers and share a planar interface with minimal surface area. Given a radius of the spherical confinement, r, we then determine the distance between their centers of mass in this ideal scenario, which we will refer to as Lpartition(Nl, Nr, r) (Supplementary Material).
2.8 Intra- and inter-daughter contact calculations
While the interactions between equivalent loci on daughter chromosomes are distinguishable in the in silico model, they are indistinguishable to most sequence-based experimental techniques, such as 3C methods. However, efforts have been made to resolve these interactions in eukaryotic systems with sister-chromatid-sensitive Hi-C (Mitter et al., 2020) and bacterial systems with recombinase assays (Lesterlin et al., 2012; Espinosa et al., 2020; Oomen et al., 2020). We extend our methodology for in silico contact maps (Supplementary Material) to the case of replicating chromosomes by using the relative position within the bond topology (Figure 2A) of the monomer identified as the Ori to determine equivalent loci containing identical DNA sequences on daughter chromosomes (Figure 3A). If
2.9 Martini model preparation
Simulating a Martini model of the Syn3A chromosome requires CG starting coordinates and a CG topology that specifies all the bonded and non-bonded interactions of the DNA model (Uusitalo et al., 2015). In traditional protocols, both are generated by forward mapping an all-atom structure to Martini resolution (Uusitalo et al., 2015; 2017; Kroon et al., 2022). However, given the size of the chromosome, this approach becomes infeasible. Thus we follow a strategy that splits the generation of topology and coordinates into two separate steps. First, we generate starting coordinates at Martini resolution directly from the polymer model’s coordinates using a new backmapping protocol. In the second step, the chromosome topology is generated from the genome sequence. Both steps are implemented in a Python package, Polyply, which focuses on facilitating the setup of MD simulation of complex polymer systems (Grünewald et al., 2022).
2.9.1 Generation of the starting coordinates
The protocol for constructing coordinates for the chromosome at Martini resolution starts with interpolating the 10 bp per monomer polymer model generated as previously described (Figure 4, step 1). To this end, a periodic B-spline, m(s), is fitted to the monomer positions, {xi}, which represents the chromosome’s helical axis (Dierckx, 1996; Virtanen et al., 2020). Along the helical axis, the bp positions, {mj}, are sampled such that each segment of the curve between monomer centers contains 10 bp spaced equidistantly. Next, we align bp template coordinates at the Martini level using the resulting bp positions. To properly align the templates, we have to define the internal coordinates
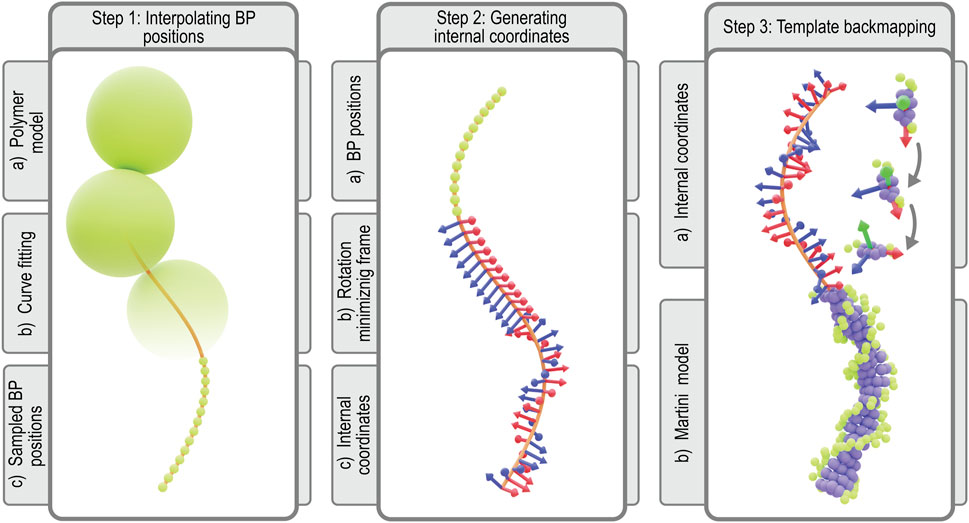
FIGURE 4. Martini backmapping protocol: Schematic depicting the steps in the protocol used to generate coordinates in the Martini representation. By backmapping a dsDNA polymer model, the protocol efficiently creates a near-atomistic model of the entire chromosome. In the final output Martini model at the far-right, each bp is represented by 7 purple beads for the nucleobases (3 per pyrimidine, 4 per purine) and 3 green beads for each backbone (2 per sugar, 1 per phosphate), for a total of 13 Martini beads per bp (Uusitalo et al., 2015).
In order to construct these internal coordinates, we use a rotation minimizing frame (RMF). An RMF is a reference frame that does not rotate around the instantaneous tangent of the curve m(s), which is defined continuously along any B-spline. The stability of an RMF is ideal for our application since discontinuities in the orientation of consecutive bases will lead to an unrealistic chromosome geometry. The RMF is constructed along the sequence of bp positions, {mj}, using the double reflection method outlined by (Wang W. et al., 2008). The paper describes a simple and fast algorithm for approximating our chromosome’s RMF with a global error in the order of
To apply the double reflection method and construct the RMF, we first calculate the instantaneous tangent
In order to transform the RMF to the internal coordinates of the chromosome, we must apply two additional transformations to the RMF. Since Syn3A′s chromosome is circular, the additional boundary condition that has to be satisfied is the continuity between the first and last bp’s internal coordinates. This condition is realized by applying an additional twist per bp, i.e., a rotation over
2.9.2 Generation of the chromosome topology
The topology at the Martini level comprises the bead-type assignments (i.e., non-bonded interactions), the bonded interactions, and possibly structural biases such as an elastic network. The typical frameworks for generating topology files at the Martini level take an all-atom structure as input (Brooks et al., 1983; Liwo et al., 1997; Case et al., 2005; Phillips et al., 2005; de Jong et al., 2013; Machado and Pantano, 2016; Kroon et al., 2022; Abraham et al., 2023). Subsequently, a connectivity graph is generated from the distance matrix and valency-based rules. From this graph, using the all-atom to Martini correspondence defined in the mapping of the nucleobases, the Martini topology is created. This process is called resolution transformation. Using the complete all-atom connectivity graph makes procedures invariant to molecular topology and allows the identification of chemical modifications (e.g., methylation) on the fly. However, the underlying subgraph isomorphism is an NP-complete problem. Thus, while this procedure is very rigorous, it is not very efficient.
Instead, we extended the multiscale graph matching protocol implemented in Polyply to dsDNA. In essence, the protocol performs a resolution transformation from the residue graph to target resolution, in this case, Martini. Utilizing the residue graph gives the needed speed-up to handle polymers of the size of the chromosome. Even though the algorithm still uses a subgraph isomorphism, it is faster since it only works on the residue graph instead of the full molecule graph. Using this algorithm, the molecule topology is generated in two steps: 1) From a set of provided building blocks, all bonded interactions and bead-type assignments are determined for the individual nucleobases (i.e., intra-residue). 2) Bonded interactions, which span multiple residues, are assigned by finding all valid subgraph isomorphisms between graph fragments that describe these inter-residue interactions and the target graph at the residue level. For each match, the bonded interactions are added to the topology. Furthermore, the bead-types are also modified to account for the links between residues where needed. The second strand is generated in the same way by running the algorithm on the complementary single-strand sequence.
The intra- and inter-residue graph fragments, referred to as blocks and links, need to be provided to Polyply as input files. Thus we have extended the Polyply library with data files that describe DNA parameters for Martini2 (Uusitalo et al., 2015). Furthermore, for convenience, Polyply was extended with a parser for .fasta and .ig data files that describe DNA sequences. Most importantly, an automatic recognition of circular DNA is possible when provided with an .ig data file.
Finally, we note that all Martini DNA needs a secondary structure stabilization (i.e., elastic network). Informed by the generated starting coordinates of the Martini chromosome, an elastic network connects nearby beads with harmonic bonds. A simple auxiliary script was used to add the elastic network to the already existing topology generated with Polyply.
2.9.3 Additional structural components
In addition to modeling the intrinsic dynamics of the chromosomal DNA, the polymer model also captures the DNA interacting with the cell membrane and ribosomes. For our Martini chromosome model, these contributions can also explicitly be taken into account with the same near-atomistic resolution. To model the ribosomes, we use a bacterial homolog previously published by (Uusitalo et al., 2017). Initially, we attempt to align the ribosomes with their counterparts in the polymer model. In this step, steric clashes with the chromosome can occur, which we resolve by applying small random rigid body transformations to the ribosomes. The translation length in this transformation acts as a fudge factor, which slowly increases per failed iteration. Lastly, a realistic cell membrane is constructed using the TS2CG tool, including both a realistic lipid composition and a representative membrane protein density (Pezeshkian et al., 2020).
3 Results
3.1 Diffusion of ribosomes and DNA monomers
The spatial heterogeneity of macromolecules and complexes within the cell and the need for them to encounter one another via diffusion strongly contribute to the stochastic nature of gene expression. For example, a RNA polymerase (RNAP) must diffuse to a gene to perform transcription and a mRNA and ribosome must diffuse to one another to perform translation. Some of these reactions can become coupled with one another, such as multiple ribosomes reading the same mRNA (polysomes) or a ribosome reading a nascent mRNA that is still being transcribed from a RNAP (expressomes - coupled transcription and translation) (O’Reilly et al., 2020). These couplings have been observed to varying extents in multiple bacteria. The proportion of ribosomes found in polysomes in E. coli has been reported as high as 80% (Bremer and Dennis, 2008), and the proportion in an organism related to Syn3A, Mycoplasma pneumoniae, has been reported as 26% (Xue et al., 2022). Expressomes have been observed to a lesser extent, the proportion of ribosomes participating in one only being 3% of ribosomes in M. pneumoniae (O’Reilly et al., 2020). Based on cryo-ET we estimated the proportion of ribosomes in polysomes in Syn3A is 25%–40% and from prior simulations we estimate the proportion of ribosomes in close enough proximity to the DNA to form an expressome to be roughly 20% (Gilbert et al., 2021). In the WS-WCM of Syn3A, polysomes were shown to be a critical factor in accurately doubling the proteome over the course of a cell cycle (Thornburg et al., 2022). Before we try to quantify how the effects of these coupled mechanisms affect the spatial organization and diffusion of the chromosome and ribosomes (Mondal et al., 2011), here we quantify how the chromosome and complete, intact ribosomes affect the diffusion of one another at the scale of a whole Syn3A cell.
Simulations were performed on 50 replicate systems of representative Syn3A cells with a radius of 200 nm, each of which contained 500 uniformly distributed ribosomes and a randomly-generated configuration of a single unreplicated chromosome. Following an initial energy minimization of the standard polymer model of the chromosome, bond
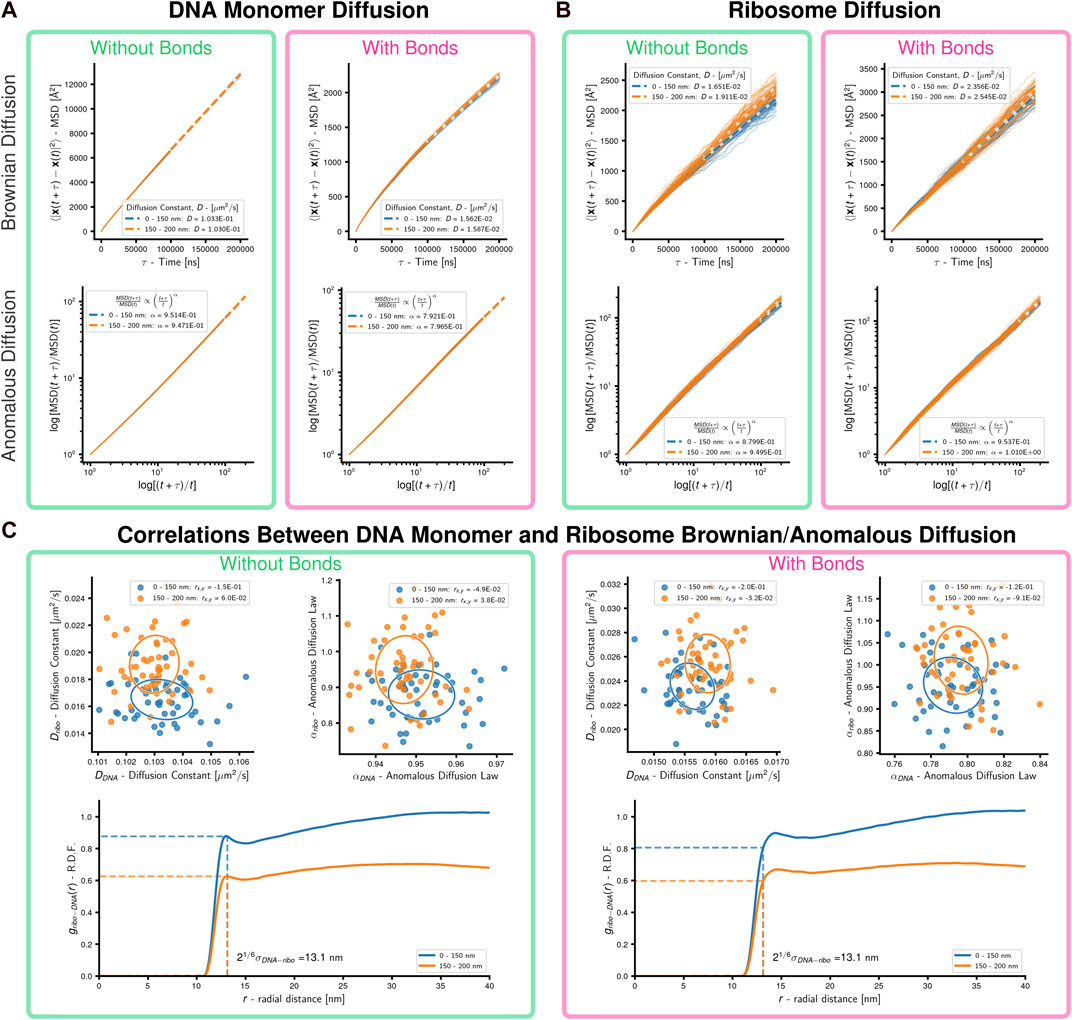
FIGURE 5. Cell-scale diffusion of ribosomes and DNA monomers: 50 replicates of a system with an unreplicated 54,338 monomer chromosome in 200 nm radius cell containing 500 uniformly distributed ribosomes were simulated. (A) Brownian and anomalous diffusion of DNA monomers with and without bonds forming DNA polymer. For the two concentric spherical shells, dashed lines are the least-squares fits for the Brownian diffusion constant (linear-linear) and anomalous diffusion power-law (log-log), respectively. (B) Brownian and anomalous diffusion of ribosomes with and without bonds forming DNA polymer. For the two concentric spherical shells, dashed lines are the least-squares fits for the Brownian diffusion constant (linear-linear) and anomalous diffusion power-law (log-log), respectively. (C) Correlations between DNA and ribosome diffusion with and without bonds forming DNA polymer. Above are scatter plots with covariance ellipses for Brownian and anomalous diffusion, Pearson correlation coefficients are reported in the legends. Below are estimates of the radial distribution function of DNA monomers about ribosomes, the dashed lines indicate the cutoff for WCA interactions. Results are shown for the two concentric spherical shells.
In the absence of bonds, the DNA monomers move following nearly Brownian diffusion. Bonding the monomers causes their motion to become sub-diffusive with α ≈ 0.79 for both inner and outer regions (Figure 5A). Sub-diffusive motion is an expected result for monomers within polymers, but Rouse dynamics predict α = 0.5 for times shorter than the relaxation time (Doi and Edwards, 1988). Our result agrees with theoretical predictions (α = 0.75) for short-time segmental motion in stiff worm-like chains with contour lengths much longer than their persistence length (Berg, 1979) and experimental measurements (α = 0.75) of large (relative to void) particle diffusion in networks of stiff filaments (Amblard et al., 1996). We repeated similar simulations using systems whose initial conditions were generated without ribosomes to probe the origin of DNA monomers’ sub-diffusive behavior in our model. In the scenario without ribosomes the DNA monomers are less sub-diffusive with α ≈ 0.85 (Supplementary Figure S4), which suggests sub-diffusive motion is a result of the confined chromosome forming a stiff polymer network. Our model’s deviation from observed sub-diffusive behavior (α = 0.4) of chromosomal loci in E. coli (Weber et al., 2010a) is likely a result of neglecting the viscoelastic nature of the bacterial cytoplasm (Weber et al., 2010b). These results for the DNA are observed for both the inner and outer regions.
Ribosomes move sub-diffusively within the inner region of the system without bonds and approach Brownian diffusion in the outer region of the system without bonds, where the DNA density is lower. When bonds are added to the system the ribosomes in the inner region undergo motion closer to Brownian diffusion. Comparing the radial distribution functions (Patrone and Rosch, 2017) of DNA monomers about the ribosomes (Figure 5C; Supplementary Material), we determined that this was a result of the system with bonds creating a polymer mesh with persistent voids (Sorichetti et al., 2020; Xiang et al., 2021) for the ribosomes to diffuse within, in contrast to the case without bonds where the DNA monomers rapidly diffuse and are closely crowded around the ribosomes. It should be noted that the asymptotic approach of the radial distribution functions in the outer shell approaching a value less than one is expected due to the cutoff radius including empty volumes outside the boundaries of the cell. The Brownian diffusion constants of ribosomes in systems with bonds is within the range of experimental measurements in other bacteria (Bakshi et al., 2012; Sanamrad et al., 2014). No significant correlations between the Brownian/anomalous diffusion of the DNA monomers and ribosomes were observed, as can be seen by the covariance ellipsoids and Pearson correlation coefficients reported in the legends (Figure 5C). These were not repeated for the case of chromosomes with loops and topoisomerase due to the non-equilibrium nature of those simulations.
3.2 Chromosome segregation
There is experimental evidence of chromosome segregation during replication (Nielsen et al., 2006), and furthermore, segregation of replicating chromosomes in nontrivial replication states in E. coli (Youngren et al., 2014). For the purposes of this study, we separate chromosome segregation into two effects: A) the disentanglement of daughter chromosomes and B) the partitioning of the daughter chromosomes’ centers of mass into different regions of the mother cell. Both chromosome disentanglement through the influence of compaction (Goloborodko et al., 2016b) caused by DNA-looping (Marko, 2009; 2011; Goloborodko et al., 2016a; Brahmachari and Marko, 2019) and the partitioning of chromosomes through entropic repulsion of polymer topologies within confinements (Jun and Mulder, 2006; Jung and Ha, 2010; Jung et al., 2012; Junier et al., 2013; Wasim et al., 2021; Mitra et al., 2022a) have been previously been studied in computational settings.
We probed chromosome segregation using a toy system approximately one-tenth the volume of a Syn3A cell with similar number densities (90 nm radius, a single unreplicated 50,000 bp chromosome, and 50 ribosomes). We carried out a series of simulations to probe the essential nature of proteins hypothesized to be necessary for simultaneous chromosome segregation during replication. Over the course of the simulations, the 5,000 monomer chromosome was replicated and the Ori to Ter ratio changed in the following sequence I) 1:1, II) 2:1, III) 3:1, and IV) 4:2 (Figure 6A). The final replication state is that of two fully replicated daughter chromosomes, each of which are themselves in the process of replication (Figure 6B), where the DNA content has more than tripled to 16,000 monomers (160,000 bp). The number of loops present in the systems were varied between 0, 10, and 20, and these systems were then simulated with and without the action of topoisomerases, for a total of six cases (i-vi in Figure 6C). Five independently generated initial conditions were used to prepare five replicate simulations per case, for a total of thirty simulations. Each simulation was run until the final time of Tf = 2.0E+7 timesteps using the looping and topoisomerase algorithm and parameters described in Section 2.4, which corresponds to 2,000 extrusion events for each loop present in the system. At every timestep, we used the binary tree model to group monomers into left/right daughters and their descendants, each with Nl and Nr monomers, respectively, and used those groupings to analyze the disentanglement and partitioning of the daughter chromosomes about each set of replication forks (m,ml,mr). We have completed an equivalent proof-of-concept simulation on the full system with 54,338 monomers in a 200 nm cell containing 500 ribosomes (Supplementary Video SV2).
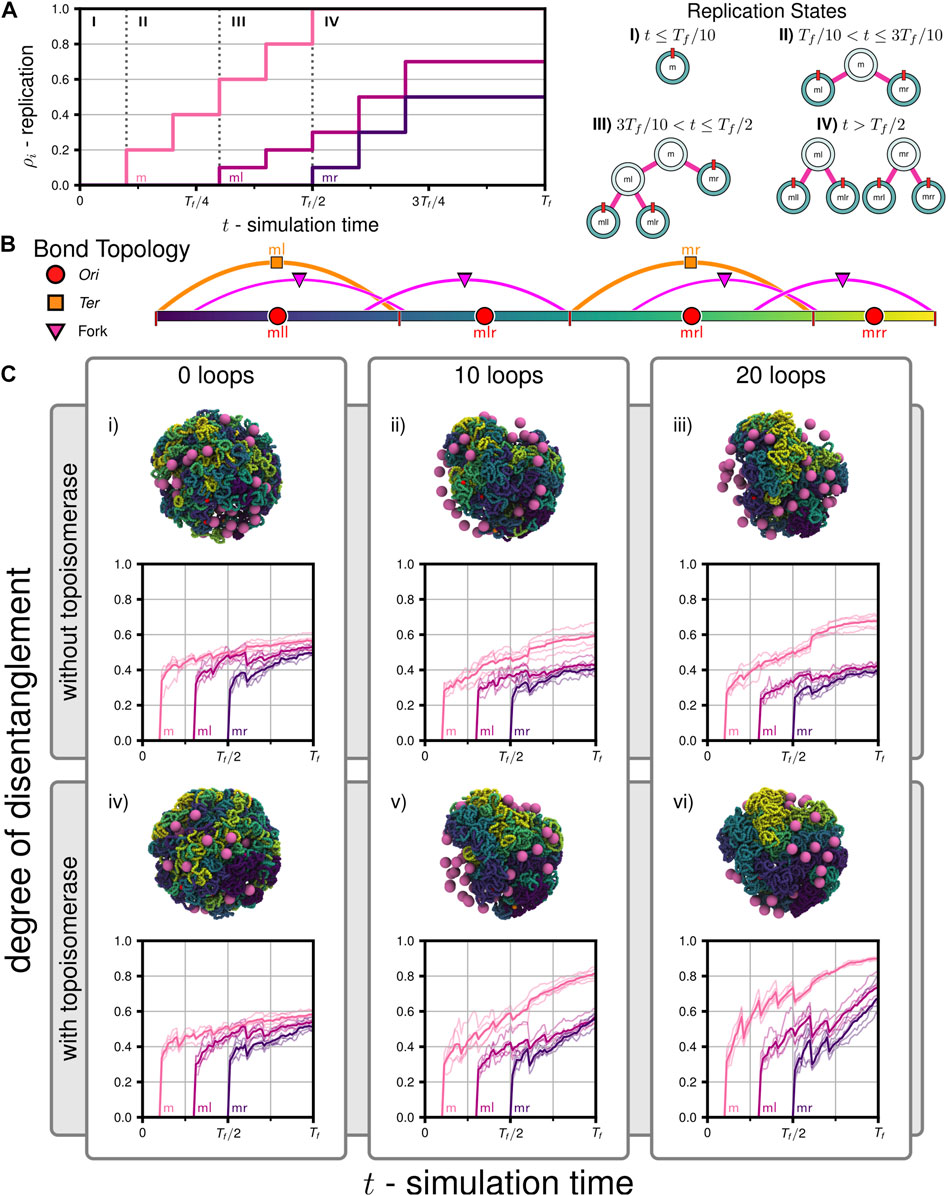
FIGURE 6. Disentanglement of daughter chromosomes during replication: (A) Replication progress
3.2.1 Disentanglement of daughter chromosomes
We calculated a metric describing the relative number of contacts between different daugther chromosomes, which we will refer to as the degree of disentanglement, as a function of simulation time (Figure 6C) for all six cases. First, we note that for all cases the degree of disentanglement exhibits abrupt decreases when portions of the chromosome are replicated, i.e., each abrupt decrease is a result of the step-wise increases in the replication state (Figure 6A). This result was anticipated because daughter chromosomes are in close spatial proximity as they are generated using the train-track model (Figure 2B) and is consistent with experimental observations of daughter(/sister) chromosome cohesion due to precatenanes in the wake of the replication fork (Wang X. et al., 2008; Cebrián et al., 2015). This effect would be less-pronounced if a smaller fraction of the genome was replicated in each step. We find that both topoisomerase and loop-extruding SMC protein complexes are necessary for daughter chromosomes to be disentangled as replication occurs. In cases i-iii without topoisomerases, topological constraints cannot be resolved and the system remains entangled (Figure 6C). Interestingly, while adding loops in cases ii and iii assists in disentangling ml and mr about fork m, the presence of loops increases the entanglements of mll with mlr about fork ml and mrl with mrr about fork mr, respectively (Figure 6C). Within our model, looping in the absence of topoisomerases is deletrious for subsequent rounds of replication because enhanced compaction increases the likelihood that topological constraints are introduced during replication. However, including solely topoisomerase in case iv is not effective at disentangling the chromosome (Figure 6C). We hypothesize that this is because diffusive motion is insufficient to cross strands when the soft potential emulating topoisomerases in our model is active and that loop-extrusion assists to isolate possible strand-crossings before completing the crossings in subsequent extrusion steps to resolve topological constraints. In cases v and vi, we find the greatest degrees of disentanglement (Figure 6C). When comparing the disentanglement of ml and mr about fork m between cases ii-iii and v-vi, we find that a plateau is reached in cases ii-iii when the topological constraints cannot be resolved (Figure 6C). In summary, we find that systems require both topoisomerase and loops to simultaneously disentangle all daughter chromosomes as they are being replicated. Furthermore, increasing the number of loops increases the rate of disentaglement, as seen in case vi versus v. The trends quantified by the degree of disentanglement can also be qualitatively observed in the snapshots of the final configurations at t = Tf (Figure 6C). The degree of disentanglement was calculated for the proof-of-concept simulation of the full chromosome (Supplementary Video SV2) and shows the same behavior as the cases (v and vi) with both SMC and topoisomerase (Supplementary Figure S8).
3.2.2 Partitioning of daughter chromosomes
We calculated the Euclidean distance separating the daughters’ centers of mass relative to an ideal partitioning, Lpartition(Nl, Nr, Rsphere), to assess the extent to which the daughter chromosomes had been partitioned to different volumes within the cytoplasmic space (Figure 7). If the daughters and their descendants have an equal number of monomers (Nl = Nr), ideal partitioning would correspond to them occupying identical hemispherical volumes (Supplementary Figure S2). The daughters’ centers of mass would then be found at the centroids of the hemispheres and separated by 3Rsphere/4. The functional dependence of the ideal partitioning on Nl and Nr accounts for possible asymmetries in nontrivial replication states, such as states III and IV (Figure 6A). Similar to the results of the degree of disentanglement (Figure 6C), we find that partitioning was the most complete in case vi with topoisomerase and the greatest number of loops (Figure 7). However, over the timescales simulated, the distance separating the daughters’ centers of mass is still relatively insignificant as compared to the size of the confining volume. This can be observed qualitatively in the manner in which the compacted globules of the disentangled daughters are folded around one another (Figure 6C). Based on this, we conclude that disentanglement is necessary for partitioning to occur, and due to the necessity of topoisomerase and loops for disentanglement, successful partitioning is also dependent on topoisomerase and loops. However, absent a regulatory system introducing a spatial heterogeneity or active force, the partitioning in our model proceeds over a much longer time-scale than the disentanglement. This can be seen in case vi, where the degree of disentanglement about fork m is reaching a plateau near one, indicating that all that remains is an interface between the now disentangled daughters (Figure 6C), while the extent of partitioning has yet to reach half of the ideal distance, Lpartition (Figure 7).
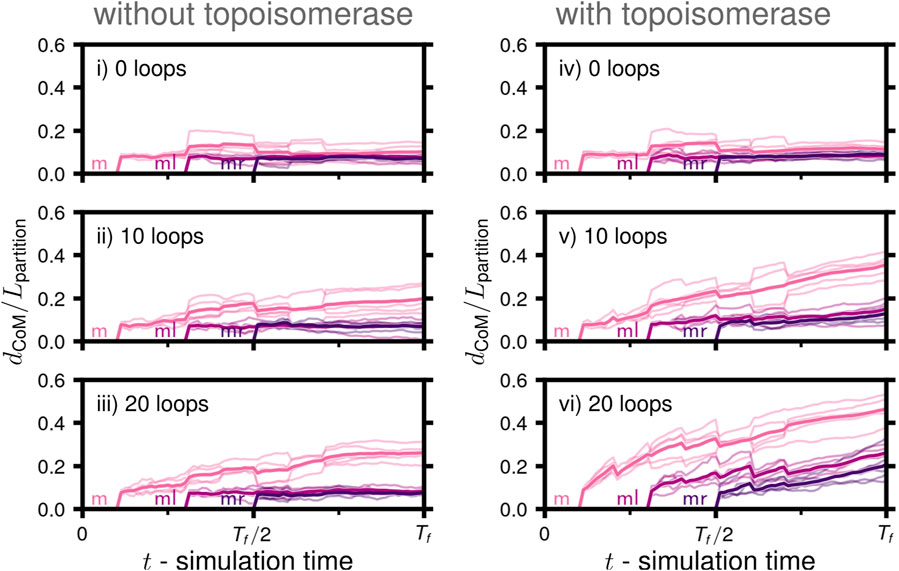
FIGURE 7. Partitioning of daughter chromosomes during replication: Mean separation of daughters’ centers of mass (dCoM) relative to the length-scale of ideal partitioning, Lpartition(Nl, Nr, Rsphere), in a spherical volume of daughters with Nl and Nr monomers as a function of simulation time for the six cases (i-vi) considered (solid line), five replicate systems were simulated for each case (faint lines). The trace labeled m corresponds to the separation of ml and its descendents (mll,mlr) with mr and its descendents (mrl,mrr), ml corresponds to the separation of the replicated region of ml, i.e., the regions of mll and mlr connected by forks, and ml corresponds to the separation of the replicated region of mr, i.e., the regions of mrl and mrr connected by forks (Figure 6B).
3.2.3 Contact maps between daughter chromosomes
Chromosome segregation was also investigated using chromosome contact maps of the same replicating chromosome systems. Contact maps were calculated at 250 bp resolution using the configurations from 3Tf/4 ≤ t ≤ Tf (i.e., when the replication state is constant) averaged over the five replicates for each case. We will denote the true contact maps for cases iii (Figure 8A) and vi (Figure 8B) as
respectively. The average loci self-interactions in sequence-equivalent maps
respectively.
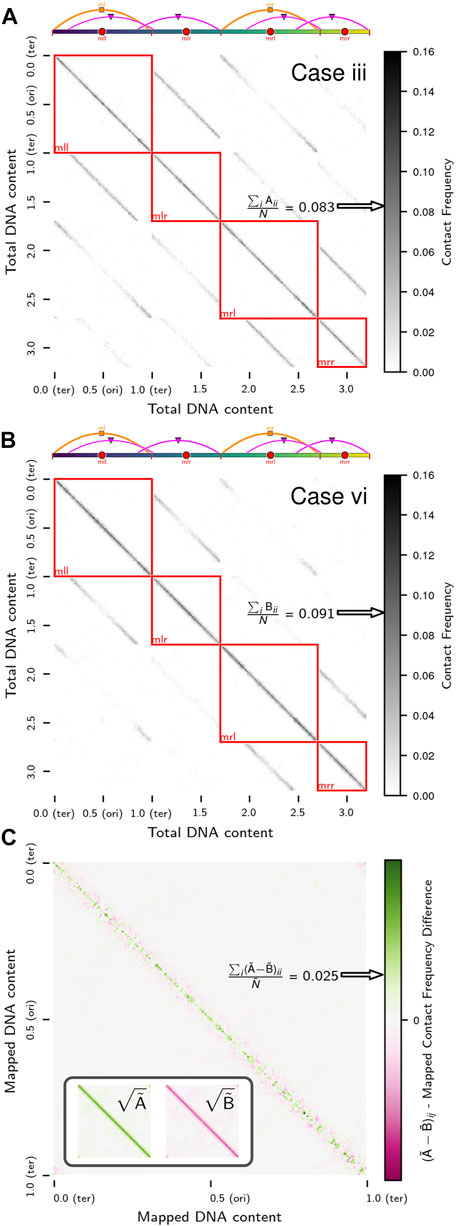
FIGURE 8. Contact maps of replicating chromosomes: (A) True contact map,
Confoundingly, while one might anticipate a higher rate of loci self-interactions in
3.3 Martini model
Using our new backmapping protocol, a Martini model of the Syn3A′s chromosome is constructed (Figure 9). With the aim of performing a molecular dynamics (MD) simulation, both starting configuration and topology are generated based on the previously described polymer model and the genome’s sequence. The resulting Martini model contains around 7 million Martini beads, representing the 34 million atoms constituting the chromosome.
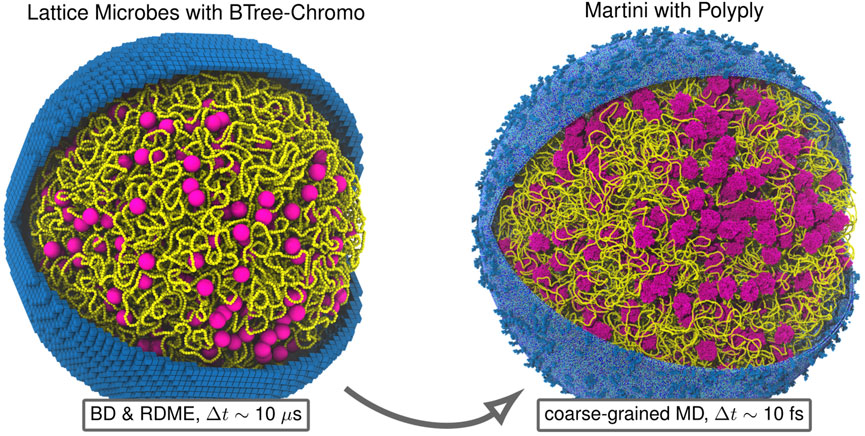
FIGURE 9. Backmapping Martini model of entire Syn3A cell: Example backmapping of polymer model of 200 nm radius Syn3A cell with a single unreplicated chromosome to near-atomistic resolution Martini representation using Polyply. For both representations we show the chromosome (yellow), ribosomes (magenta), and membrane (blue). The membrane in the Lattice Microbes representation is shown using the 8 nm cubic subvolumes used for reaction-diffusion master equation (RDME) simulations and the membrane in the Martini representation, which includes the lipid composition and membrane proteins of Syn3A (Thornburg et al., 2022), was generated using TS2CG (Pezeshkian et al., 2020). The two representations are complementary in that the combined polymer-RDME model resolves cell-wide chemical transformations over timescales comparable to the cell-cycle by neglecting detailed physical interactions among particles, while the Martini model alternatively resolves these detailed physical interactions among macromolecules over shorter timescales.
The chromosome model is energy minimized in vacuum using Gromacs-2023 (Abraham et al., 2023). However, running an MD simulation, additionally requires the solvation and charge neutralization of the model. This step dramatically increases the number of particles in the simulation to over 500 million Martini beads. At the current stage, Gromacs can not handle systems of this size, which restrains us from further exploring the dynamics of the system.
However, to illustrate our DNA backmapping protocol, we model and simulate the previously described toy chromosome system of approximately one-tenth the size of the Syn3A. Before applying our chromosome modeling protocol to this toy model, we first sample an artificial 50 kbp sequence with the same relative nucleobase frequency as the Syn3A genome. The resulting Martini model is solvated in a 185 nm cubic box, neutralized, and subsequently, a physiological salt concentration of 0.15 M NaCl is added to the system. To incorporate the confinement effect of the membrane on the chromosome, an additional spherical boundary potential with a radius of 90 nm is added to the model. Note that in the Martini version of the toy system, we omitted to model the ribosomes.
The final simulation consists of approximately 50 million Martini beads, representing over 500 million atoms (Figure 10A). First, we energy minimize and equilibrate the system before starting the production simulation, which is stable at a 20 fs timestep. In total, the system is simulated for 50 ns We note that on this short timescale, the chromosome will not fully equilibrate. Nevertheless, we have the ability to confirm that our backmapped model is consistent with the intended structure and observed sub-diffusive motion (α ≈ 0.87) of 10 bp segments of the Martini dsDNA (Supplementary Figure S5) that is consistent with the Brownian dynamics simulations of the full chromosome in the absence of ribosomes (Supplementary Figure S4).
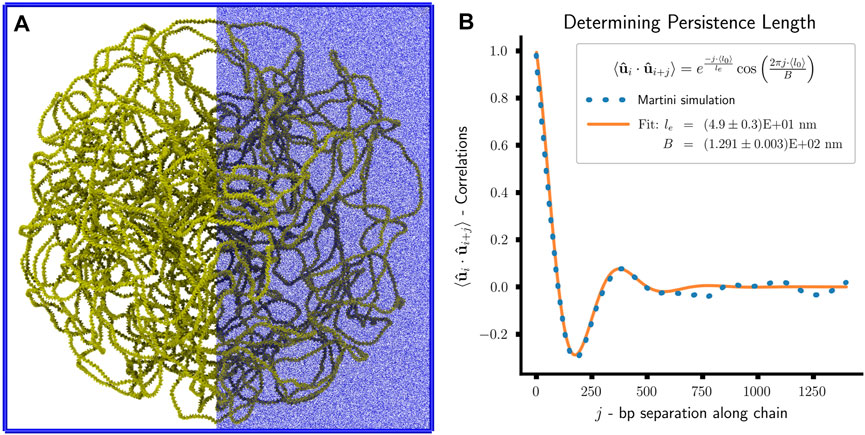
FIGURE 10. Martini simulation of toy system: (A) Snapshot of Martini simulation of toy system. The system consists of approximately 50 million Martini beads—chromosome 650,000 (yellow), water 50,528,240 (not shown), chloride ions 571,949 (blue), and sodium ions 671,949 (blue). The ions are only displayed on the right-half to enhance visual clarity. (B) Plot of bond vector correlations as a function of bp separation along the polymer chain and the least-squares fit of the effective persistence length, le, and confinement length scale, B.
A direct comparison between the polymer and Martini simulations is possible by analyzing the models’ persistence lengths, lp. For the Martini simulation, we determine the persistence length of the chromosomal DNA by calculating the orientational correlation of the bond vectors,
However, calculating the bond vector correlations for the last 25 ns of the Martini simulation (Figure 10B) reveal a clear deviation from this idealized model. An additional oscillatory contribution is observed in the decay of the bond vector correlations, which can be attributed to the geometric confinement of the chromosome by the cell wall (Liu and Chakraborty, 2008; Cifra and Bleha, 2010; Castro-Villarreal and Ramírez, 2021). The resulting decay trend is well-captured by
where le is the effective persistence length of the DNA, and B is a length scale related to the confinement size (Liu and Chakraborty, 2008). By performing a least-squares fit of the model to our simulation, we find le = (4.9 ± 0.3)E+01 nm and B = (1.291 ± 0.003)E+02 nm. Considering the 45 nm persistence length of the polymer model, which is a chosen model parameter, we observe a qualitative agreement between the two models. The quantitative deviation can be attributed to the confinement reducing the chromosome’s conformational space and increasing its effective rigidity. In general, the measured le will be greater than or equal to lp under confinement. However, the small amplitude of the fluctuations in the measured bond vector correlations indicates a moderate confinement regime, suggesting that le and lp are comparable (Liu and Chakraborty, 2008).
4 Discussion
4.1 Study overview and methods
We developed a computational framework to investigate the minimal required components for chromosome replication and segregation in a genetically minimal bacterium, Syn3A. This framework is built around six major components: 1) a method to fold chromosomes around ribosome distributions originating from cryo-ET or other experimental measurements (Supplementary Figure S1), 2) an implementation of a 10 bp per monomer polymer model of dsDNA that includes its intrinsic mechanical properties (bending and twisting stiffness) and can be simulated using Brownian dynamics (Figures 1A–C), 3) algorithms that emulate the effect of known essential proteins that manipulate the chromosome — DNA-looping SMC complexes and strand-crossing type-II topoisomerases (Figure 1D; Supplementary Algorithms S1, S2), 4) a binary tree model to systematically describe nontrivial replication states and create accompanying 3D physical structures obeying the polymer model (Figure 2), 5) in silico chromosome contact maps of replicating chromosomes that capture intra- and inter-daughter interactions (Figure 3), and 6) a procedure mapping the chromosome to equivalent higher-resolution Martini whole-cell models using Polyply (Figure 9).
4.2 Key findings
Using the binary tree model of replication states, we have created a means to systematically describe nontrivial replication states that are known to be present in bacteria (Cooper and Helmstetter, 1968; Bremer and Dennis, 2008; Youngren et al., 2014). Previous simulations of replicating chromosomes have used either a set of fixed replication states (Wasim et al., 2021; 2023; Mitra et al., 2022b) or a pre-defined replication protocol (Mitra et al., 2022a). Our software implementation of this model enables users to create physical models of these states with the bond topology of nested theta structures (Figure 2A) and modify the states using computational equivalents of biological processes (Figure 2B). Furthermore, the aspects of the program used to create, manipulate (replicate asymmetrically at specific forks, replicate under well-stirred assumption), query (export bond topology, loci for true and sequence-equivalent maps, counts of genomic regions, etc.), and save replication states may be used independently from simulations of a physical model, which allows other researchers to use the program as a tool.
By combining the binary tree model with the Brownian dynamics model of the chromosomal dsDNA, we have developed a method to generate physics-based models of replicating chromosomes at 10 bp resolution, and simulate their time-evolution while undergoing diffusive motion and non-equilibrium replication events. Cryo-ET of Syn3A demonstrated that the ribosome distribution is near-uniform and the cytoplasm appears denser than other bacteria (Gilbert et al., 2021) and the chromosome itself, through excluded volume interactions with other macromolecular complexes (Dersch et al., 2022) and spatially localized transcription (Llopis et al., 2010), potentially represents the greatest influence on spatially heterogeneous reaction-diffusion processes within simulations of Syn3A (Thornburg et al., 2022).
After folding chromosomes organized as a fractal globule around ribosomes positions from cryo-ET (Gilbert et al., 2021), we measured the diffusion of complete 70S bacterial ribosomes. We find that configurations of the chromosomes create polymer meshworks that have voids containing ribosomes. Within these voids the ribosomes undergo nearly Brownian motion with diffusion constants lower than those observed in E. coli (Bakshi et al., 2012). We find that non-specific DNA-looping in the absence of a parABS system compacts the chromosome, with the assumed number of loops based on proteomics of SMC-scpAB components (Table 1) reducing the radius of gyration of 100-monomer segments by approximately 35% (Figure 1E). Although this compaction is substantial, the chromosome can be still be replicated using our implementation of the train-track model without issues.
In the context of our model, we find that both DNA-looping and strand-crossings are necessary for the segregation of daughter chromosomes during and after replication, which is in agreement with Syn3A′s gene essentiality data for SMC-complexes and type-II topoisomerases from transposon mutagenesis experiments (Breuer et al., 2019). We analyzed the time-course of chromosome segregation in a toy system by dividing it into two processes, disentanglement of the daughter chromosomes (Figure 6) and partitioning of the daughter chromosomes into distinct volumes (Figure 7). The system cannot be disentangled when no loops are present. Increasing the number of loops leads to disentanglement of the first generation of daughters, but that process will stall if topoisomerase is absent and the topological restraints cannot be resolved (Figure 6C), which is in agreement with experiments (Wang X. et al., 2008). Additionally, if there are loops and no topoisomerase, subsequent generations will be even more entangled due to replication occurring in the daughters already compacted by loops (Figure 6C). This coordinated role between SMC complexes and topo-IV has been observed in E. coli (Zawadzki et al., 2015; Nolivos et al., 2016; Mäkelä and Sherratt, 2020). Identical behavior is observed in the partitioning of the daughters (Figure 7), but the partitioning occurs over a slower timescale than the disentanglement, with the partitioning less than 50% complete on average in case vi, where the daughters are almost completely disentangled. Based on this, successful disentanglement is necessary in our model for partitioning to proceed. It is qualitatively clear that partitioning lags behind disentanglement in the proof-of-concept simulation of the full chromosome undergoing simultaneous replication and segregation (Supplementary Video SV2), but we are encouraged by the preliminary result for the degree of disentanglement demonstrating that SMC complexes and topo-IV are sufficient at the chromosome-scale (Supplementary Figure S8).
Overall, these findings regarding the influence of SMC complexes and topoisomerases on chromosome segregation are consistent with computational studies of eukaryotic sister chromatids (Goloborodko et al., 2016a) and show that the same mechanisms are capable of segregating nested theta structures in bacteria. While we model the chromosome as a homopolymer rather than a heteropolymer, the energy landscape picture of proteins within a funnel (Bryngelson et al., 1995; Onuchic et al., 1997) is relevant when interpreting the process of chromosome segregation. The ATP-consuming process of loop-extrusion isolates knots and causes the system to approach energetic barriers representing these topological restraints within the system. Our model’s periodic action of topoisomerases then lowers the barriers and loop-extrusion drives the system over the lowered barriers. We found that neither of these effects is sufficient in isolation, and the combination of ATP-consuming driving forces and lowered barriers enable the departure from a local energy minimum with a more-knotted topology into a new energy minimum with a less-knotted topology, which is consistent with previous computational studies on knotted chromosome topologies (Racko et al., 2018; Orlandini et al., 2019). These processes are akin to the role of protein-folding chaperones in resolving kinetically trapped misfolded proteins in a rugged energy landscape (Todd et al., 1996; Thirumalai et al., 2019).
Previous studies have calculated in silico chromosome contact maps of replicating bacterial chromosomes (Wasim et al., 2021; 2023), but to the best of our knowledge, did not include inter-daughter contacts. Using our model, we have created a procedure to calculate true maps that include inter-daughter contacts and convert those maps extending over the full DNA content of the replicating chromosome system back to the sequence-equivalent maps that would be measured by experimental 3C methods (Figure 3). This not only elucidates variations in the sequence-equivalent maps due to differing spatial organization of chromosomes in identical replication states (Figure 8), but also enables the comparison of maps originating from chromosomes in different replication states and the creation of maps representing a mixture of replication states. Features in contact maps that are attributed to processes during replication and chromosome segregation have been previously reported in synchronized Caulobacter crescentus cells (Le et al., 2013) and E. coli topo-IV knockout studies (Conin et al., 2022).
Using Polyply, we showed that we can obtain a starting structure of the entire Syn3A chromosome at near-atomic resolution, ready for subsequent sampling of its configuration space using molecular dynamics. Previous dynamics simulations of entire chromosomes are either based on simplified (1-2 bead per bp) models or are restricted to simulating smaller, viral genomes and nanostructures (Maffeo and Aksimentiev, 2020; Sengar et al., 2021).
4.3 Limitations
There is no sequence-specificity in the homopolymer model of replicating chromosomes beyond specific landmark monomers such as Oris and Ters, and there is no means to represent ssDNA. This limitation precludes us from modeling the unique molecular structures of the bubble during replication initation (Shimizu et al., 2016) and replisome during replication (Maffeo et al., 2022). The essentiality of HU in Syn3A despite its reduced proteomics count and high-affinity for structurally deformed DNA (Kamashev, 2000) suggests a role in DNA replication, which is further supported by the Ori:Ter ratio of B. subtilis being reduced upon HU deletion (Karaboja and Wang, 2022). However, in contrast to E. coli where HU/IHF has a well-defined role of stabilizing bent dsDNA in DnaA-based replication at an oriC (Yoshida et al., 2023), there is a lack of clarity regarding HU’s role in Syn3A′s more minimalistic oriC (Richardson et al., 2019; Thornburg et al., 2019). In a similar vein, although the binary tree model fully describes topologies of nontrivial replication states that may be undergoing asymmetric replication, the absence of ssDNA prevents us from making the distinction between leading and lagging strands, which would be at the extreme end in opposite directions (clockwise vs. counter-clockwise) on the left and right daughters.
In the chromosome-scale polymer model, we neglected hydrodynamic interactions and did not directly include electrostatics beyond the parameterization of the persistence length, we feel the ability to backmap the system to a Martini representation with near-atomistic detail helps resolve this deficiency by providing information about the effect of neglecting those interactions. In particular, to address the viscoelastic nature of the medium, which was neglected in the Brownian dynamics model, one could simulate the polymer model using dissipative particle dynamics (DPD) (Español and Warren, 2017), where the memory function encoding non-Markovian dynamics due to the medium is constructed (Klippenstein et al., 2021) from whole-cell Martini simulations (Stevens et al., 2023). The Brownian dynamics timesteps (Δt = 0.1 ns) are much smaller than the timescales of loop-extrusion events (
4.4 Future directions
Now that we have created a computational model of Syn3A′s chromosome that includes replication and segregation of nontrivial replication states, we intend to integrate it with the 4D-WCM of Syn3A (Thornburg et al., 2022) to extend its predictive capabilities to the full cell-cycle. Information concerning the spatial coordinates of the replicating genome will be sent to the 4D-WCM and information regarding reaction events will be returned, similar approaches have been used by other researchers (Popov et al., 2016). Two immediate applications are the modeling of DnaA filamentation leading to formation of the replication bubble and the dynamic formation of polysomes based on translational activity. Given the absence of regulatory elements in Syn3A, an open-question is if the arrangement of genes can serve as a means of regulation (Chatterjee et al., 2021; Geng et al., 2022) as a result of the mechanochemical coupling between transcription and supercoiling (Chong et al., 2014; Kim et al., 2019). Following transcription events in the 4D-WCM, dynamically applying torsional strain to the chromosome model would enable local configurational changes in genes, thereby modulating their transcriptional propensity.
While the methods described in this study enable us to calculate in silico chromosome contact maps whose Ori:Ter ratio matches experimental qPCR measurements of 3.4 (Thornburg et al., 2022) by using a mixture of replication states with different ratios, there is a lack of clarity about relative weights of these states. Furthermore, there are a vast multitude of compatible replication microstates for each Ori:Ter ratio. Given that we now have a means to generate sequence-equivalent in silico contact maps of chromosomes in different replication states, this motivates the development of a protocol to deconvolve experimental maps generated from populations of unsynchronized cells (Junier et al., 2015; Sefer et al., 2016; Carstens et al., 2020; Zhou et al., 2021; Rowland et al., 2022) to determine the subpopulations of cells in different replication states. The respective replication states would then be found by an inversion of subpopulation contact maps (Supplementary Figures S6, S7) from their sequence-equivalent form to the true contact maps (Figure 3). We note that this proposed methodology faces two challenges: 1) the solution requires knowledge of sequence-equivalent contact maps for replication microstates and 2) even with that information, the problem likely remains underdetermined if only subject to the example set of constraints (Section 2.5) and not more informative constraints such as DNA abundance distributions (Bhat et al., 2022). Assuming further performance improvements of the simulation software, this study helps to address the first issue, but the second issue will need to be resolved.
All simulations of chromosome segregation in this study used a spherical confinement reflecting the observed morphology of SynX-series (Gilbert et al., 2021; Pelletier et al., 2021) and M. mycoides (Rideau et al., 2022) cells. Varying confinement over the cell-cycle will allow us to test entropic segregation in shapes with long aspect-ratios (Jun and Mulder, 2006; Jung and Ha, 2010; Jung et al., 2012; Youngren et al., 2014).
Simulations with the Martini model are limited in the description of DNA strand hybridization. To keep the strands together, an elastic network is used. Ongoing efforts are directed to include additional (virtual) bead types that provide a more accurate description of the directed hydrogen bonds that give rise to specific base pairing. Another challenge is to capture the replicating chromosome when creating whole-cell Martini models of different stages of the cell cycle. To this end, a Martini model of a complete replisome has to be constructed and integrated into our chromosome modeling protocol. As part of our DNA backmapping algorithm, we plan to support the incorporation of protein-DNA complexes, thereby facilitating the construction of complete replication forks.
Data availability statement
All software used for simulations and analysis in this study is open-source and listed in Supplementary Table S1. Software used for visualization is publicly available and listed in Supplementary Table S1.
Author contributions
BG: conceptualization, methodology, software, formal analysis, writing—original draft. ZT: methodology, validation, visualization. TB: methodology, validation. JAS: methodology, software, formal analysis, writing—original draft. FG: methodology, software. JES: visualization. SM: conceptualization, resources, writing—review and editing, funding acquisition. ZL-S: conceptualization, resources, writing—review and editing, funding acquisition. All authors contributed to the article and approved the submitted version.
Funding
BG, ZT, TB, and ZL-S: we acknowledge partial support from NSF MCB 1818344 and 2221237, and “The Physics of Living Systems Student Research Network” NSF PHY 2014027. JAS, FG, and SM: we acknowledge funding from the ERC with the Advanced grant 101053661 (“COMP-O-CELL”) and from NWO through the NWA grant “The limits to growth: The challenge to dissipate energy” and BaSyc (“Building a Synthetic Cell”) consortium. JES: Visual Molecular Dynamics (VMD) was developed by the NIH Center for Macromolecular Modeling and Bioinformatics at the Beckman Institute at UIUC, with support from NIH P41-GM104601 and R24-GM145965.
Acknowledgments
We would like to thank Christopher Maffeo and Tyler Earnest for insightful discussions.
Conflict of interest
JES was employed by the company NVIDIA Corporation.
The remaining authors declare that the research was conducted in the absence of any commercial or financial relationships that could be construed as a potential conflict of interest.
Publisher’s note
All claims expressed in this article are solely those of the authors and do not necessarily represent those of their affiliated organizations, or those of the publisher, the editors and the reviewers. Any product that may be evaluated in this article, or claim that may be made by its manufacturer, is not guaranteed or endorsed by the publisher.
Supplementary material
The Supplementary Material for this article can be found online at: https://www.frontiersin.org/articles/10.3389/fcell.2023.1214962/full#supplementary-material
References
Abebe, A. H., Aranovich, A., and Fishov, I. (2017). HU content and dynamics in escherichia coli during the cell cycle and at different growth rates. FEMS Microbiol. Lett. 364, fnx195. doi:10.1093/femsle/fnx195
Abraham, M., Alekseenko, A., Bergh, C., Blau, C., Briand, E., Doijade, M., et al. (2023). Gromacs 2023 source code. doi:10.5281/ZENODO.7588619
Alipour, E., and Marko, J. F. (2012). Self-organization of domain structures by DNA-loop-extruding enzymes. Nucleic Acids Res. 40, 11202–11212. doi:10.1093/nar/gks925
Amblard, F., Maggs, A. C., Yurke, B., Pargellis, A. N., and Leibler, S. (1996). Subdiffusion and anomalous local viscoelasticity in actin networks. Phys. Rev. Lett. 77, 4470–4473. doi:10.1103/physrevlett.77.4470
Badrinarayanan, A., Le, T. B., and Laub, M. T. (2015). Bacterial chromosome organization and segregation. Annu. Rev. Cell. Dev. Biol. 31, 171–199. doi:10.1146/annurev-cellbio-100814-125211
Bakshi, S., Siryaporn, A., Goulian, M., and Weisshaar, J. C. (2012). Superresolution imaging of ribosomes and RNA polymerase in live escherichia coli cells. Mol. Microbiol. 85, 21–38. doi:10.1111/j.1365-2958.2012.08081.x
Banigan, E. J., van den Berg, A. A., Brandão, H. B., Marko, J. F., and Mirny, L. A. (2020). Chromosome organization by one-sided and two-sided loop extrusion. eLife 9, e53558. doi:10.7554/elife.53558
Barkai, E., Garini, Y., and Metzler, R. (2012). Strange kinetics of single molecules in living cells. Phys. Today 65, 29–35. doi:10.1063/pt.3.1677
Berg, O. G. (1979). Brownian motion of the wormlike chain and segmental diffusion of DNA. Biopolymers 18, 2861–2874. doi:10.1002/bip.1979.360181114
Bhat, D., Hauf, S., Plessy, C., Yokobayashi, Y., and Pigolotti, S. (2022). Speed variations of bacterial replisomes. eLife 11, e75884. doi:10.7554/elife.75884
Bianchi, D. M., Peterson, J. R., Earnest, T. M., Hallock, M. J., and Luthey-Schulten, Z. (2018). Hybrid CME–ODE method for efficient simulation of the galactose switch in yeast. IET Syst. Biol. 12, 170–176. doi:10.1049/iet-syb.2017.0070
Birnie, A., and Dekker, C. (2020). Genome-in-a-box: Building a chromosome from the bottom up. ACS Nano 15, 111–124. doi:10.1021/acsnano.0c07397
Bonato, A., and Michieletto, D. (2021). Three-dimensional loop extrusion. Biophysical J. 120, 5544–5552. doi:10.1016/j.bpj.2021.11.015
Brackley, C. A., Morozov, A. N., and Marenduzzo, D. (2014). Models for twistable elastic polymers in brownian dynamics, and their implementation for LAMMPS. J. Chem. Phys. 140, 135103. doi:10.1063/1.4870088
Brahmachari, S., and Marko, J. F. (2019). Chromosome disentanglement driven via optimal compaction of loop-extruded brush structures. Proc. Natl. Acad. Sci. U.S.A. 116, 24956–24965. doi:10.1073/pnas.1906355116
Bremer, H., and Dennis, P. P. (2008). Modulation of chemical composition and other parameters of the cell at different exponential growth rates. EcoSal Plus 3, 1–48. doi:10.1128/ecosal.5.2.3
Breuer, M., Earnest, T. M., Merryman, C., Wise, K. S., Sun, L., Lynott, M. R., et al. (2019). Essential metabolism for a minimal cell. eLife 8, e36842. doi:10.7554/elife.36842
Brooks, B. R., Bruccoleri, R. E., Olafson, B. D., States, D. J., Swaminathan, S., and Karplus, M. (1983). Charmm: A program for macromolecular energy, minimization, and dynamics calculations. J. Comput. Chem. 4, 187–217. doi:10.1002/jcc.540040211
Bryngelson, J. D., Onuchic, J. N., Socci, N. D., and Wolynes, P. G. (1995). Funnels, pathways, and the energy landscape of protein folding: A synthesis. Proteins Struct. Funct. Genet. 21, 167–195. doi:10.1002/prot.340210302
Buenemann, M., and Lenz, P. (2010). A geometrical model for DNA organization in bacteria. PLoS ONE 5, e13806. doi:10.1371/journal.pone.0013806
Carstens, S., Nilges, M., and Habeck, M. (2020). Bayesian inference of chromatin structure ensembles from population-averaged contact data. Proc. Natl. Acad. Sci. 117, 7824–7830. doi:10.1073/pnas.1910364117
Case, D. A., Cheatham, T. E., Darden, T., Gohlke, H., Luo, R., Merz, K. M., et al. (2005). The amber biomolecular simulation programs. J. Comput. Chem. 26, 1668–1688. doi:10.1002/jcc.20290
Castro-Villarreal, P., and Ramírez, J. E. (2021). Semiflexible polymer enclosed in a 3d compact domain. Front. Phys. 9. doi:10.3389/fphy.2021.642364
Cebrián, J., Castán, A., Martínez, V., Kadomatsu-Hermosa, M. J., Parra, C., Fernández-Nestosa, M. J., et al. (2015). Direct evidence for the formation of precatenanes during DNA replication. J. Biol. Chem. 290, 13725–13735. doi:10.1074/jbc.m115.642272
Chatterjee, P., Goldenfeld, N., and Kim, S. (2021). DNA supercoiling drives a transition between collective modes of gene synthesis. Phys. Rev. Lett. 127, 218101. doi:10.1103/physrevlett.127.218101
Chodavarapu, S., Felczak, M. M., Yaniv, J. R., and Kaguni, J. M. (2007). Escherichia coli DnaA interacts with HU in initiation at the e. coli replication origin. Mol. Microbiol. 67, 781–792. doi:10.1111/j.1365-2958.2007.06094.x
Chong, S., Chen, C., Ge, H., and Xie, X. S. (2014). Mechanism of transcriptional bursting in bacteria. Cell. 158, 314–326. doi:10.1016/j.cell.2014.05.038
Cifra, P., and Bleha, T. (2010). Shape transition of semi-flexible macromolecules confined in channel and cavity. Eur. Phys. J. E 32, 273–279. doi:10.1140/epje/i2010-10626-y
Cocco, S., Marko, J. F., and Monasson, R. (2002). Theoretical models for single-molecule DNA and RNA experiments: From elasticity to unzipping. Comptes Rendus Phys. 3, 569–584. doi:10.1016/s1631-0705(02)01345-2
Conin, B., Billault-Chaumartin, I., Sayyed, H. E., Quenech’Du, N., Cockram, C., Koszul, R., et al. (2022). Extended sister-chromosome catenation leads to massive reorganization of the E. coli genome. Nucleic Acids Res. 50, 2635–2650. doi:10.1093/nar/gkac105
Cooper, S., and Helmstetter, C. E. (1968). Chromosome replication and the division cycle of escherichia coli. J. Mol. Biol. 31, 519–540. doi:10.1016/0022-2836(68)90425-7
Dame, R. T., Rashid, F.-Z. M., and Grainger, D. C. (2019). Chromosome organization in bacteria: Mechanistic insights into genome structure and function. Nat. Rev. Genet. 21, 227–242. doi:10.1038/s41576-019-0185-4
Dame, R. T., and Tark-Dame, M. (2016). Bacterial chromatin: Converging views at different scales. Curr. Opin. Cell. Biol. 40, 60–65. doi:10.1016/j.ceb.2016.02.015
Dame, R. T. (2005). The role of nucleoid-associated proteins in the organization and compaction of bacterial chromatin. Mol. Microbiol. 56, 858–870. doi:10.1111/j.1365-2958.2005.04598.x
Davidson, I. F., and Peters, J.-M. (2021). Genome folding through loop extrusion by SMC complexes. Nat. Rev. Mol. Cell. Biol. 22, 445–464. doi:10.1038/s41580-021-00349-7
de Jong, D. H., Singh, G., Bennett, W. F. D., Arnarez, C., Wassenaar, T. A., Schäfer, L. V., et al. (2013). Improved parameters for the martini coarse-grained protein force field. J. Chem. Theory Comput. 9, 687–697. doi:10.1021/ct300646g
Dekker, J., and Mirny, L. (2016). The 3d genome as moderator of chromosomal communication. Cell. 164, 1110–1121. doi:10.1016/j.cell.2016.02.007
Dekker, J., Rippe, K., Dekker, M., and Kleckner, N. (2002). Capturing chromosome conformation. Science 295, 1306–1311. doi:10.1126/science.1067799
Delong, S., Usabiaga, F. B., and Donev, A. (2015). Brownian dynamics of confined rigid bodies. J. Chem. Phys. 143, 144107. doi:10.1063/1.4932062
Denker, A., and de Laat, W. (2016). The second decade of 3c technologies: Detailed insights into nuclear organization. Genes. & Dev. 30, 1357–1382. doi:10.1101/gad.281964.116
Dersch, S., Rotter, D. A., and Graumann, P. L. (2022). Heterogeneity of subcellular diffusion in bacteria based on spatial segregation of ribosomes and nucleoids. Microb. Physiol. 32, 177–186. doi:10.1159/000526846
Di Pierro, M., Cheng, R. R., Aiden, E. L., Wolynes, P. G., and Onuchic, J. N. (2017). De novo prediction of human chromosome structures: Epigenetic marking patterns encode genome architecture. Proc. Natl. Acad. Sci. 114, 12126–12131. doi:10.1073/pnas.1714980114
Diebold-Durand, M.-L., Lee, H., Avila, L. B. R., Noh, H., Shin, H.-C., Im, H., et al. (2017). Structure of full-length SMC and rearrangements required for chromosome organization. Mol. Cell. 67, 334–347.e5. doi:10.1016/j.molcel.2017.06.010
Dierckx, P. (1996). Monographs on numerical analysis. repr edn. Oxford: Clarendon.Curve and surface fitting with splines
Dingman, C. W. (1974). Bidirectional chromosome replication: Some topological considerations. J. Theor. Biol. 43, 187–195. doi:10.1016/s0022-5193(74)80052-4
Doi, M., and Edwards, S. F. (1988). “The theory of polymer dynamics,” in International series of monographs on physics (Oxford, England: Clarendon Press).
Dorman, C. J. (2019). DNA supercoiling and transcription in bacteria: A two-way street. BMC Mol. Cell. Biol. 20, 26. doi:10.1186/s12860-019-0211-6
Español, P., and Warren, P. B. (2017). Perspective: Dissipative particle dynamics. J. Chem. Phys. 146, 150901. doi:10.1063/1.4979514
Espinosa, E., Paly, E., and Barre, F.-X. (2020). High-resolution whole-genome analysis of sister-chromatid contacts. Mol. Cell. 79, 857–869.e3. doi:10.1016/j.molcel.2020.06.033
Fiorillo, L., Musella, F., Conte, M., Kempfer, R., Chiariello, A. M., Bianco, S., et al. (2021). Comparison of the hi-c, GAM and SPRITE methods using polymer models of chromatin. Nat. Methods 18, 482–490. doi:10.1038/s41592-021-01135-1
Fournier, A., Fussell, D., and Carpenter, L. (1982). Computer rendering of stochastic models. Commun. ACM 25, 371–384. doi:10.1145/358523.358553
Fudenberg, G., Imakaev, M., Lu, C., Goloborodko, A., Abdennur, N., and Mirny, L. A. (2016). Formation of chromosomal domains by loop extrusion. Cell. Rep. 15, 2038–2049. doi:10.1016/j.celrep.2016.04.085
Ganji, M., Shaltiel, I. A., Bisht, S., Kim, E., Kalichava, A., Haering, C. H., et al. (2018). Real-time imaging of DNA loop extrusion by condensin. Science 360, 102–105. doi:10.1126/science.aar7831
Geggier, S., Kotlyar, A., and Vologodskii, A. (2010). Temperature dependence of DNA persistence length. Nucleic Acids Res. 39, 1419–1426. doi:10.1093/nar/gkq932
Geng, Y., Bohrer, C. H., Yehya, N., Hendrix, H., Shachaf, L., Liu, J., et al. (2022). A spatially resolved stochastic model reveals the role of supercoiling in transcription regulation. PLOS Comput. Biol. 18, e1009788. doi:10.1371/journal.pcbi.1009788
Gibson, D. G., Glass, J. I., Lartigue, C., Noskov, V. N., Chuang, R.-Y., Algire, M. A., et al. (2010). Creation of a bacterial cell controlled by a chemically synthesized genome. Science 329, 52–56. doi:10.1126/science.1190719
Gilbert, B. R., Thornburg, Z. R., Lam, V., Rashid, F.-Z. M., Glass, J. I., Villa, E., et al. (2021). Generating chromosome geometries in a minimal cell from cryo-electron tomograms and chromosome conformation capture maps. Front. Mol. Biosci. 8, 644133. doi:10.3389/fmolb.2021.644133
Giorgetti, L., and Heard, E. (2016). Closing the loop: 3c versus DNA FISH. Genome Biol. 17, 215. doi:10.1186/s13059-016-1081-2
Goel, V. Y., and Hansen, A. S. (2020). The macro and micro of chromosome conformation capture. WIREs Dev. Biol. 10, e395. doi:10.1002/wdev.395
Gogou, C., Japaridze, A., and Dekker, C. (2021). Mechanisms for chromosome segregation in bacteria. Front. Microbiol. 12, 685687. doi:10.3389/fmicb.2021.685687
Goldberg, A. P., Szigeti, B., Chew, Y. H., Sekar, J. A., Roth, Y. D., and Karr, J. R. (2018). Emerging whole-cell modeling principles and methods. Curr. Opin. Biotechnol. 51, 97–102. doi:10.1016/j.copbio.2017.12.013
Goloborodko, A., Imakaev, M. V., Marko, J. F., and Mirny, L. (2016a). Compaction and segregation of sister chromatids via active loop extrusion. eLife 5, e14864. doi:10.7554/elife.14864
Goloborodko, A., Marko, J. F., and Mirny, L. A. (2016b). Chromosome compaction by active loop extrusion. Biophysical J. 110, 2162–2168. doi:10.1016/j.bpj.2016.02.041
Goodsell, D. S., Autin, L., and Olson, A. J. (2018). Lattice models of bacterial nucleoids. J. Phys. Chem. B 122, 5441–5447. doi:10.1021/acs.jpcb.7b11770
Goodwin, S., McPherson, J. D., and McCombie, W. R. (2016). Coming of age: Ten years of next-generation sequencing technologies. Nat. Rev. Genet. 17, 333–351. doi:10.1038/nrg.2016.49
Grünewald, F., Alessandri, R., Kroon, P. C., Monticelli, L., Souza, P. C. T., and Marrink, S. J. (2022). Polyply; a python suite for facilitating simulations of macromolecules and nanomaterials. Nat. Commun. 13, 68. doi:10.1038/s41467-021-27627-4
Guo, M. S., Kawamura, R., Littlehale, M. L., Marko, J. F., and Laub, M. T. (2021). High-resolution, genome-wide mapping of positive supercoiling in chromosomes. eLife 10, e67236. doi:10.7554/elife.67236
Haas, D., Thamm, A. M., Sun, J., Huang, L., Sun, L., Beaudoin, G. A. W., et al. (2022). Metabolite damage and damage control in a minimal genome. mBio 13, e0163022. doi:10.1128/mbio.01630-22
Hacker, W. C., Li, S., and Elcock, A. H. (2017). Features of genomic organization in a nucleotide-resolution molecular model of the escherichia coli chromosome. Nucleic Acids Res. 45, 7541–7554. doi:10.1093/nar/gkx541
Hallock, M. J., Stone, J. E., Roberts, E., Fry, C., and Luthey-Schulten, Z. (2014). Simulation of reaction diffusion processes over biologically relevant size and time scales using multi-GPU workstations. Parallel Comput. 40, 86–99. doi:10.1016/j.parco.2014.03.009
Heo, L., Sugita, Y., and Feig, M. (2022). Protein assembly and crowding simulations. Curr. Opin. Struct. Biol. 73, 102340. doi:10.1016/j.sbi.2022.102340
Higashi, T. L., Pobegalov, G., Tang, M., Molodtsov, M. I., and Uhlmann, F. (2021). A brownian ratchet model for DNA loop extrusion by the cohesin complex. eLife 10, e67530. doi:10.7554/elife.67530
Hirano, T. (2006). At the heart of the chromosome: SMC proteins in action. Nat. Rev. Mol. Cell. Biol. 7, 311–322. doi:10.1038/nrm1909
Hutchison, C. A., Chuang, R.-Y., Noskov, V. N., Assad-Garcia, N., Deerinck, T. J., Ellisman, M. H., et al. (2016). Design and synthesis of a minimal bacterial genome. Science 351, aad6253–aad6253–11. doi:10.1126/science.aad6253
Ilie, I. M., Briels, W. J., and den Otter, W. K. (2015). An elementary singularity-free rotational brownian dynamics algorithm for anisotropic particles. J. Chem. Phys. 142, 114103. doi:10.1063/1.4914322
Japaridze, A., Gogou, C., Kerssemakers, J. W. J., Nguyen, H. M., and Dekker, C. (2020). Direct observation of independently moving replisomes in escherichia coli. Nat. Commun. 11, 3109. doi:10.1038/s41467-020-16946-7
Jun, S., and Mulder, B. (2006). Entropy-driven spatial organization of highly confined polymers: Lessons for the bacterial chromosome. Proc. Natl. Acad. Sci. 103, 12388–12393. doi:10.1073/pnas.0605305103
Jung, Y., and Ha, B.-Y. (2010). Overlapping two self-avoiding polymers in a closed cylindrical pore: Implications for chromosome segregation in a bacterial cell. Phys. Rev. E 82, 051926. doi:10.1103/physreve.82.051926
Jung, Y., Jeon, C., Kim, J., Jeong, H., Jun, S., and Ha, B.-Y. (2012). Ring polymers as model bacterial chromosomes: Confinement, chain topology, single chain statistics, and how they interact. Soft Matter 8, 2095–2102. doi:10.1007/s00726-011-0946-7
Junier, I., Boccard, F., and Espéli, O. (2013). Polymer modeling of the e. coli genome reveals the involvement of locus positioning and macrodomain structuring for the control of chromosome conformation and segregation. Nucleic Acids Res. 42, 1461–1473. doi:10.1093/nar/gkt1005
Junier, I., Spill, Y. G., Marti-Renom, M. A., Beato, M., and le Dily, F. (2015). On the demultiplexing of chromosome capture conformation data. FEBS Lett. 589, 3005–3013. doi:10.1016/j.febslet.2015.05.049
Kamashev, D., and Rouviere-Yaniv, J. (2000). The histone-like protein HU binds specifically to DNA recombination and repair intermediates. EMBO J. 19, 6527–6535. doi:10.1093/emboj/19.23.6527
Karaboja, X., and Wang, X. (2022). HBsu is required for the initiation of DNA replication in bacillus subtilis. J. Bacteriol. 204, e0011922. doi:10.1128/jb.00119-22
Karr, J. R., Sanghvi, J. C., Macklin, D. N., Gutschow, M. V., Jacobs, J. M., Bolival, B., et al. (2012). A whole-cell computational model predicts phenotype from genotype. Cell. 150, 389–401. doi:10.1016/j.cell.2012.05.044
Kempfer, R., and Pombo, A. (2019). Methods for mapping 3d chromosome architecture. Nat. Rev. Genet. 21, 207–226. doi:10.1038/s41576-019-0195-2
Khan, S. R., Mahaseth, T., Kouzminova, E. A., Cronan, G. E., and Kuzminov, A. (2016). Static and dynamic factors limit chromosomal replication complexity in escherichia coli, avoiding dangers of runaway overreplication. Genetics 202, 945–960. doi:10.1534/genetics.115.184697
Kim, E., Kerssemakers, J., Shaltiel, I. A., Haering, C. H., and Dekker, C. (2020). DNA-loop extruding condensin complexes can traverse one another. Nature 579, 438–442. doi:10.1038/s41586-020-2067-5
Kim, S., Beltran, B., Irnov, I., and Jacobs-Wagner, C. (2019). Long-distance cooperative and antagonistic RNA polymerase dynamics via DNA supercoiling. Cell. 179, 106–119.e16. doi:10.1016/j.cell.2019.08.033
Klenin, K., Merlitz, H., and Langowski, J. (1998). A brownian dynamics program for the simulation of linear and circular DNA and other wormlike chain polyelectrolytes. Biophysical J. 74, 780–788. doi:10.1016/s0006-3495(98)74003-2
Klippenstein, V., Tripathy, M., Jung, G., Schmid, F., and van der Vegt, N. F. A. (2021). Introducing memory in coarse-grained molecular simulations. J. Phys. Chem. B 125, 4931–4954. doi:10.1021/acs.jpcb.1c01120
Kos, P. I., Galitsyna, A. A., Ulianov, S. V., Gelfand, M. S., Razin, S. V., and Chertovich, A. V. (2021). Perspectives for the reconstruction of 3d chromatin conformation using single cell hi-c data. PLOS Comput. Biol. 17, e1009546. doi:10.1371/journal.pcbi.1009546
Kroon, P. C., Grünewald, F., Barnoud, J., van Tilburg, M., Souza, P. C. T., Wassenaar, T. A., et al. (2022). Martinize2 and vermouth: Unified framework for topology generation. arXiv. doi:10.48550/ARXIV.2212.01191
Le, T. B. K., Imakaev, M. V., Mirny, L. A., and Laub, M. T. (2013). High-resolution mapping of the spatial organization of a bacterial chromosome. Science 342, 731–734. doi:10.1126/science.1242059
Lee, H., Noh, H., and Ryu, J.-K. (2021). Structure-function relationships of SMC protein complexes for DNA loop extrusion. BIODESIGN 9, 1–13. doi:10.34184/kssb.2021.9.1.1
Lesterlin, C., Gigant, E., Boccard, F., and Espéli, O. (2012). Sister chromatid interactions in bacteria revealed by a site-specific recombination assay. EMBO J. 31, 3468–3479. doi:10.1038/emboj.2012.194
Lieberman-Aiden, E., van Berkum, N. L., Williams, L., Imakaev, M., Ragoczy, T., Telling, A., et al. (2009). Comprehensive mapping of long-range interactions reveals folding principles of the human genome. Science 326, 289–293. doi:10.1126/science.1181369
Lioy, V. S., Cournac, A., Marbouty, M., Duigou, S., Mozziconacci, J., Espéli, O., et al. (2018). Multiscale structuring of the e. coli chromosome by nucleoid-associated and condensin proteins. Cell. 172, 771–783.e18. doi:10.1016/j.cell.2017.12.027
Lioy, V. S., Junier, I., and Boccard, F. (2021). Multiscale dynamic structuring of bacterial chromosomes. Annu. Rev. Microbiol. 75, 541–561. doi:10.1146/annurev-micro-033021-113232
Lioy, V. S., Junier, I., Lagage, V., Vallet, I., and Boccard, F. (2020). Distinct activities of bacterial condensins for chromosome management in pseudomonas aeruginosa. Cell. Rep. 33, 108344. doi:10.1016/j.celrep.2020.108344
Liu, L. F., and Wang, J. C. (1987). Supercoiling of the DNA template during transcription. Proc. Natl. Acad. Sci. 84, 7024–7027. doi:10.1073/pnas.84.20.7024
Liu, L., Liu, C., and Alberts, B. (1980). Type II DNA topoisomerases: Enzymes that can unknot a topologically knotted DNA molecule via a reversible double-strand break. Cell. 19, 697–707. doi:10.1016/s0092-8674(80)80046-8
Liu, Y., and Chakraborty, B. (2008). Shapes of semiflexible polymers in confined spaces. Phys. Biol. 5, 026004. doi:10.1088/1478-3975/5/2/026004
Livny, J., Yamaichi, Y., and Waldor, M. K. (2007). Distribution of centromere-like parS sites in bacteria: Insights from comparative genomics. J. Bacteriol. 189, 8693–8703. doi:10.1128/jb.01239-07
Liwo, A., Ołdziej, S., Pincus, M. R., Wawak, R. J., Rackovsky, S., and Scheraga, H. A. (1997). A united-residue force field for off-lattice protein-structure simulations. i. functional forms and parameters of long-range side-chain interaction potentials from protein crystal data. J. Comput. Chem. 18, 849–873. doi:10.1002/(sici)1096-987x(199705)18:7<849::aid-jcc1>3.0.co;2-r
Llopis, P. M., Jackson, A. F., Sliusarenko, O., Surovtsev, I., Heinritz, J., Emonet, T., et al. (2010). Spatial organization of the flow of genetic information in bacteria. Nature 466, 77–81. doi:10.1038/nature09152
Lua, R., Borovinskiy, A. L., and Grosberg, A. Y. (2004). Fractal and statistical properties of large compact polymers: A computational study. Polymer 45, 717–731. doi:10.1016/j.polymer.2003.10.073
Luthey-Schulten, Z., Thornburg, Z. R., and Gilbert, B. R. (2022). Integrating cellular and molecular structures and dynamics into whole-cell models. Curr. Opin. Struct. Biol. 75, 102392. doi:10.1016/j.sbi.2022.102392
Machado, M. R., and Pantano, S. (2016). SIRAH tools: Mapping, backmapping and visualization of coarse-grained models. Bioinformatics 32, 1568–1570. doi:10.1093/bioinformatics/btw020
Macklin, D. N., Ahn-Horst, T. A., Choi, H., Ruggero, N. A., Carrera, J., Mason, J. C., et al. (2020). Simultaneous cross-evaluation of heterogeneous e. coli datasets via mechanistic simulation. Science 369, eaav3751. doi:10.1126/science.aav3751
Maffeo, C., and Aksimentiev, A. (2020). MrDNA: A multi-resolution model for predicting the structure and dynamics of DNA systems. Nucleic Acids Res. 48, 5135–5146. doi:10.1093/nar/gkaa200
Maffeo, C., Chou, H.-Y., and Aksimentiev, A. (2022). Single-molecule biophysics experiments in silico: Toward a physical model of a replisome. iScience 25, 104264. doi:10.1016/j.isci.2022.104264
Mäkelä, J., and Sherratt, D. J. (2020). Organization of the escherichia coli chromosome by a MukBEF axial core. Mol. Cell. 78, 250–260.e5. doi:10.1016/j.molcel.2020.02.003
Manning, G. S. (2006). The persistence length of DNA is reached from the persistence length of its null isomer through an internal electrostatic stretching force. Biophysical J. 91, 3607–3616. doi:10.1529/biophysj.106.089029
Mantelli, S., Muller, P., Harlepp, S., and Maaloum, M. (2011). Conformational analysis and estimation of the persistence length of DNA using atomic force microscopy in solution. Soft Matter 7, 3412. doi:10.1039/c0sm01160f
Marbouty, M., Gall, A. L., Cattoni, D. I., Cournac, A., Koh, A., Fiche, J.-B., et al. (2015). Condensin- and replication-mediated bacterial chromosome folding and origin condensation revealed by hi-c and super-resolution imaging. Mol. Cell. 59, 588–602. doi:10.1016/j.molcel.2015.07.020
Maritan, M., Autin, L., Karr, J., Covert, M. W., Olson, A. J., and Goodsell, D. S. (2022). Building structural models of a whole mycoplasma cell. J. Mol. Biol. 434, 167351. doi:10.1016/j.jmb.2021.167351
Marko, J. F. (2009). Linking topology of tethered polymer rings with applications to chromosome segregation and estimation of the knotting length. Phys. Rev. E 79, 051905. doi:10.1103/physreve.79.051905
Marko, J. F. (2011). Scaling of linking and writhing numbers for spherically confined and topologically equilibrated flexible polymers. J. Stat. Phys. 142, 1353–1370. doi:10.1007/s10955-011-0172-4
Marrink, S. J., Monticelli, L., Melo, M. N., Alessandri, R., Tieleman, D. P., and Souza, P. C. T. (2022). Two decades of martini: Better beads, broader scope. WIREs Comput. Mol. Sci. 13. doi:10.1002/wcms.1620
Marucci, L., Barberis, M., Karr, J., Ray, O., Race, P. R., de Souza Andrade, M., et al. (2020). Computer-aided whole-cell design: Taking a holistic approach by integrating synthetic with systems biology. Front. Bioeng. Biotechnol. 8, 942. doi:10.3389/fbioe.2020.00942
McKie, S. J., Neuman, K. C., and Maxwell, A. (2021). DNA topoisomerases: Advances in understanding of cellular roles and multi-protein complexes via structure-function analysis. BioEssays 43, 2000286. doi:10.1002/bies.202000286
Messelink, J. J. B., van Teeseling, M. C. F., Janssen, J., Thanbichler, M., and Broedersz, C. P. (2021). Learning the distribution of single-cell chromosome conformations in bacteria reveals emergent order across genomic scales. Nat. Commun. 12, 1963. doi:10.1038/s41467-021-22189-x
Mitra, D., Pande, S., and Chatterji, A. (2022a). Polymer architecture orchestrates the segregation and spatial organization of replicating E. coli chromosomes in slow growth. Soft Matter 18, 5615–5631. doi:10.1039/d2sm00734g
Mitra, D., Pande, S., and Chatterji, A. (2022b). Topology-driven spatial organization of ring polymers under confinement. Phys. Rev. E 106, 054502. doi:10.1103/physreve.106.054502
Mitter, M., Gasser, C., Takacs, Z., Langer, C. C. H., Tang, W., Jessberger, G., et al. (2020). Conformation of sister chromatids in the replicated human genome. Nature 586, 139–144. doi:10.1038/s41586-020-2744-4
Mondal, J., Bratton, B. P., Li, Y., Yethiraj, A., and Weisshaar, J. C. (2011). Entropy-based mechanism of ribosome-nucleoid segregation in e. coli cells. Biophysical J. 100, 2605–2613. doi:10.1016/j.bpj.2011.04.030
Mosconi, F., Allemand, J. F., Bensimon, D., and Croquette, V. (2009). Measurement of the torque on a single stretched and twisted DNA using magnetic tweezers. Phys. Rev. Lett. 102, 078301. doi:10.1103/physrevlett.102.078301
Muñoz-Gil, G., Volpe, G., Garcia-March, M. A., Aghion, E., Argun, A., Hong, C. B., et al. (2021). Objective comparison of methods to decode anomalous diffusion. Nat. Commun. 12, 6253. doi:10.1038/s41467-021-26320-w
Nagano, T., Lubling, Y., Stevens, T. J., Schoenfelder, S., Yaffe, E., Dean, W., et al. (2013). Single-cell hi-c reveals cell-to-cell variability in chromosome structure. Nature 502, 59–64. doi:10.1038/nature12593
Nielsen, H. J., Li, Y., Youngren, B., Hansen, F. G., and Austin, S. (2006). Progressive segregation of the escherichia coli chromosome. Mol. Microbiol. 61, 383–393. doi:10.1111/j.1365-2958.2006.05245.x
Nolivos, S., Upton, A. L., Badrinarayanan, A., Müller, J., Zawadzka, K., Wiktor, J., et al. (2016). MatP regulates the coordinated action of topoisomerase IV and MukBEF in chromosome segregation. Nat. Commun. 7, 10466. doi:10.1038/ncomms10466
Nomidis, S. K., Carlon, E., Gruber, S., and Marko, J. F. (2022). DNA tension-modulated translocation and loop extrusion by SMC complexes revealed by molecular dynamics simulations. Nucleic Acids Res. 50, 4974–4987. doi:10.1093/nar/gkac268
Nunez, R. V., Avila, L. B. R., and Gruber, S. (2019). Transient DNA occupancy of the SMC interarm space in prokaryotic condensin. Mol. Cell. 75, 209–223.e6. doi:10.1016/j.molcel.2019.05.001
Oliveira, F. A., Ferreira, R. M. S., Lapas, L. C., and Vainstein, M. H. (2019). Anomalous diffusion: A basic mechanism for the evolution of inhomogeneous systems. Front. Phys. 7. doi:10.3389/fphy.2019.00018
Olivi, L., Berger, M., Creyghton, R. N. P., Franceschi, N. D., Dekker, C., Mulder, B. M., et al. (2021). Towards a synthetic cell cycle. Nat. Commun. 12, 4531. doi:10.1038/s41467-021-24772-8
Onuchic, J. N., Luthey-Schulten, Z., and Wolynes, P. G. (1997). Theory of protein folding: The energy landscape perspective. Annu. Rev. Phys. Chem. 48, 545–600. doi:10.1146/annurev.physchem.48.1.545
Oomen, M. E., Hedger, A. K., Watts, J. K., and Dekker, J. (2020). Detecting chromatin interactions between and along sister chromatids with SisterC. Nat. Methods 17, 1002–1009. doi:10.1038/s41592-020-0930-9
O’Reilly, F. J., Xue, L., Graziadei, A., Sinn, L., Lenz, S., Tegunov, D., et al. (2020). In-cell architecture of an actively transcribing-translating expressome. Science 369, 554–557. doi:10.1126/science.abb3758
Orlandini, E., Marenduzzo, D., and Michieletto, D. (2019). Synergy of topoisomerase and structural-maintenance-of-chromosomes proteins creates a universal pathway to simplify genome topology. Proc. Natl. Acad. Sci. 116, 8149–8154. doi:10.1073/pnas.1815394116
Páll, S., Zhmurov, A., Bauer, P., Abraham, M., Lundborg, M., Gray, A., et al. (2020). Heterogeneous parallelization and acceleration of molecular dynamics simulations in GROMACS. J. Chem. Phys. 153, 134110. doi:10.1063/5.0018516
Park, P. J. (2009). ChIP–seq: Advantages and challenges of a maturing technology. Nat. Rev. Genet. 10, 669–680. doi:10.1038/nrg2641
Parry, B. R., Surovtsev, I. V., Cabeen, M. T., O’Hern, C. S., Dufresne, E. R., and Jacobs-Wagner, C. (2014). The bacterial cytoplasm has glass-like properties and is fluidized by metabolic activity. Cell. 156, 183–194. doi:10.1016/j.cell.2013.11.028
Patrone, P. N., and Rosch, T. W. (2017). Beyond histograms: Efficiently estimating radial distribution functions via spectral Monte Carlo. J. Chem. Phys. 146, 094107. doi:10.1063/1.4977516
Pelletier, J. F., Sun, L., Wise, K. S., Assad-Garcia, N., Karas, B. J., Deerinck, T. J., et al. (2021). Genetic requirements for cell division in a genomically minimal cell. Cell. 184, 2430–2440.e16. doi:10.1016/j.cell.2021.03.008
Pelletier, J., Halvorsen, K., Ha, B.-Y., Paparcone, R., Sandler, S. J., Woldringh, C. L., et al. (2012). Physical manipulation of the Escherichia coli chromosome reveals its soft nature. Proc. Natl. Acad. Sci. 109, E2649–E2656. doi:10.1073/pnas.1208689109
Pezeshkian, W., König, M., Wassenaar, T. A., and Marrink, S. J. (2020). Backmapping triangulated surfaces to coarse-grained membrane models. Nat. Commun. 11, 2296. doi:10.1038/s41467-020-16094-y
Phillips, J. C., Braun, R., Wang, W., Gumbart, J., Tajkhorshid, E., Villa, E., et al. (2005). Scalable molecular dynamics with NAMD. J. Comput. Chem. 26, 1781–1802. doi:10.1002/jcc.20289
Popov, K., Komianos, J., and Papoian, G. A. (2016). Medyan: Mechanochemical simulations of contraction and polarity alignment in actomyosin networks. PLOS Comput. Biol. 12, e1004877. doi:10.1371/journal.pcbi.1004877
Pountain, A. W., Jiang, P., Yao, T., Homaee, E., Guan, Y., Podkowik, M., et al. (2022). Transcription-replication interactions reveal principles of bacterial genome regulation. bioRxiv. doi:10.1101/2022.10.22.513359
Racko, D., Benedetti, F., Goundaroulis, D., and Stasiak, A. (2018). Chromatin loop extrusion and chromatin unknotting. Polymers 10, 1126. doi:10.3390/polym10101126
Ramani, V., Deng, X., Qiu, R., Gunderson, K. L., Steemers, F. J., Disteche, C. M., et al. (2017). Massively multiplex single-cell hi-c. Nat. Methods 14, 263–266. doi:10.1038/nmeth.4155
Richardson, T. T., Stevens, D., Pelliciari, S., Harran, O., Sperlea, T., and Murray, H. (2019). Identification of a basal system for unwinding a bacterial chromosome origin. EMBO J. 38, e101649. doi:10.15252/embj.2019101649
Rickard, M. M., Zhang, Y., Gruebele, M., and Pogorelov, T. V. (2019). In-cell protein–protein contacts: Transient interactions in the crowd. J. Phys. Chem. Lett. 10, 5667–5673. doi:10.1021/acs.jpclett.9b01556
Rideau, F., Villa, A., Belzanne, P., Verdier, E., Hosy, E., and Arfi, Y. (2022). Imaging minimal bacteria at the nanoscale: A reliable and versatile process to perform single-molecule localization microscopy in mycoplasmas. Microbiol. Spectr. 10, e0064522. doi:10.1128/spectrum.00645-22
Roberts, E., Stone, J. E., and Luthey-Schulten, Z. (2012). Lattice microbes: High-performance stochastic simulation method for the reaction-diffusion master equation. J. Comput. Chem. 34, 245–255. doi:10.1002/jcc.23130
Rosa, A., and Zimmer, C. (2014). “Computational models of large-scale genome architecture,” in International review of cell and molecular Biology (Elsevier), 275–349. doi:10.1016/b978-0-12-800046-5.00009-6
Rowland, B., Huh, R., Hou, Z., Crowley, C., Wen, J., Shen, Y., et al. (2022). Thunder: A reference-free deconvolution method to infer cell type proportions from bulk hi-c data. PLOS Genet. 18, e1010102. doi:10.1371/journal.pgen.1010102
Ryu, J.-K., Rah, S.-H., Janissen, R., Kerssemakers, J. W. J., Bonato, A., Michieletto, D., et al. (2021). Condensin extrudes DNA loops in steps up to hundreds of base pairs that are generated by ATP binding events. Nucleic Acids Res. 50, 820–832. doi:10.1093/nar/gkab1268
Sanamrad, A., Persson, F., Lundius, E. G., Fange, D., Gynnå, A. H., and Elf, J. (2014). Single-particle tracking reveals that free ribosomal subunits are not excluded from the escherichia coli nucleoid. Proc. Natl. Acad. Sci. 111, 11413–11418. doi:10.1073/pnas.1411558111
Sanborn, A. L., Rao, S. S. P., Huang, S.-C., Durand, N. C., Huntley, M. H., Jewett, A. I., et al. (2015). Chromatin extrusion explains key features of loop and domain formation in wild-type and engineered genomes. Proc. Natl. Acad. Sci. 112, E6456–E6465. doi:10.1073/pnas.1518552112
Schramm, F. D., and Murray, H. (2022). HU knew? bacillus subtilis HBsu is required for DNA replication initiation. J. Bacteriol. 204, e0015122. doi:10.1128/jb.00151-22
Sefer, E., Duggal, G., and Kingsford, C. (2016). Deconvolution of ensemble chromatin interaction data reveals the latent mixing structures in cell subpopulations. J. Comput. Biol. 23, 425–438. doi:10.1089/cmb.2015.0210
Sekelja, M., Paulsen, J., and Collas, P. (2016). 4d nucleomes in single cells: What can computational modeling reveal about spatial chromatin conformation? Genome Biol. 17, 54. doi:10.1186/s13059-016-0923-2
Sengar, A., Ouldridge, T. E., Henrich, O., Rovigatti, L., and Šulc, P. (2021). A primer on the oxDNA model of DNA: When to use it, how to simulate it and how to interpret the results. Front. Mol. Biosci. 8, 693710. doi:10.3389/fmolb.2021.693710
Shi, G., and Thirumalai, D. (2023). A maximum-entropy model to predict 3d structural ensembles of chromatin from pairwise distances with applications to interphase chromosomes and structural variants. Nat. Commun. 14, 1150. doi:10.1038/s41467-023-36412-4
Shimizu, M., Noguchi, Y., Sakiyama, Y., Kawakami, H., Katayama, T., and Takada, S. (2016). Near-atomic structural model for bacterial DNA replication initiation complex and its functional insights. Proc. Natl. Acad. Sci. 113, E8021–E8030. doi:10.1073/pnas.1609649113
Śmigiel, W. M., Mantovanelli, L., Linnik, D. S., Punter, M., Silberberg, J., Xiang, L., et al. (2022). Protein diffusion in escherichia coli cytoplasm scales with the mass of the complexes and is location dependent. Sci. Adv. 8, eabo5387. doi:10.1126/sciadv.abo5387
Snook, I. (2007). “Langevin and generalised Langevin dynamics,” in The Langevin and generalised Langevin approach to the dynamics of atomic, polymeric and colloidal systems (Elsevier), 107–132. doi:10.1016/b978-044452129-3/50007-9
Sorichetti, V., Hugouvieux, V., and Kob, W. (2020). Determining the mesh size of polymer solutions via the pore size distribution. Macromolecules 53, 2568–2581. doi:10.1021/acs.macromol.9b02166
Stevens, J. A., Grünewald, F., van Tilburg, P. A. M., König, M., Gilbert, B. R., Brier, T. A., et al. (2023). Molecular dynamics simulation of an entire cell. Front. Chem. 11, 1106495. doi:10.3389/fchem.2023.1106495
Strzałka, A., Kois-Ostrowska, A., Kędra, M., Łebkowski, T., Bieniarz, G., Szafran, M. J., et al. (2022). Enhanced binding of an HU homologue under increased DNA supercoiling preserves chromosome organisation and sustains Streptomyces hyphal growth. Nucleic Acids Res. 50, 12202–12216. doi:10.1093/nar/gkac1093
Sutormin, D. A., Galivondzhyan, A. K., Polkhovskiy, A. V., Kamalyan, S. O., Severinov, K. V., and Dubiley, S. A. (2021). Diversity and functions of type II topoisomerases. Acta Naturae 13, 59–75. doi:10.32607/actanaturae.11058
Szatmári, D., Sárkány, P., Kocsis, B., Nagy, T., Miseta, A., Barkó, S., et al. (2020). Intracellular ion concentrations and cation-dependent remodelling of bacterial MreB assemblies. Sci. Rep. 10, 12002. doi:10.1038/s41598-020-68960-w
Takaki, R., Dey, A., Shi, G., and Thirumalai, D. (2021). Theory and simulations of condensin mediated loop extrusion in DNA. Nat. Commun. 12, 5865. doi:10.1038/s41467-021-26167-1
Thirumalai, D., Lorimer, G. H., and Hyeon, C. (2019). Iterative annealing mechanism explains the functions of the GroEL and RNA chaperones. Protein Sci. 29, 360–377. doi:10.1002/pro.3795
Thompson, A. P., Aktulga, H. M., Berger, R., Bolintineanu, D. S., Brown, W. M., Crozier, P. S., et al. (2022). Lammps - a flexible simulation tool for particle-based materials modeling at the atomic, meso, and continuum scales. Comput. Phys. Commun. 271, 108171. doi:10.1016/j.cpc.2021.108171
Thornburg, Z. R., Bianchi, D. M., Brier, T. A., Gilbert, B. R., Earnest, T. M., Melo, M. C., et al. (2022). Fundamental behaviors emerge from simulations of a living minimal cell. Cell. 185, 345–360.e28. doi:10.1016/j.cell.2021.12.025
Thornburg, Z. R., Melo, M. C. R., Bianchi, D., Brier, T. A., Crotty, C., Breuer, M., et al. (2019). Kinetic modeling of the genetic information processes in a minimal cell. Front. Mol. Biosci. 6, 130. doi:10.3389/fmolb.2019.00130
Tiana, G., and Giorgetti, L. (Editors) (2019). Modeling the 3D conformation of genomes (Boca Raton, FL: CRC Press). doi:10.1201/9781315144009
Todd, M. J., Lorimer, G. H., and Thirumalai, D. (1996). Chaperonin-facilitated protein folding: Optimization of rate and yield by an iterative annealing mechanism. Proc. Natl. Acad. Sci. 93, 4030–4035. doi:10.1073/pnas.93.9.4030
Tran, N. T., Laub, M. T., and Le, T. B. (2017). SMC progressively aligns chromosomal arms in caulobacter crescentus but is antagonized by convergent transcription. Cell. Rep. 20, 2057–2071. doi:10.1016/j.celrep.2017.08.026
Trussart, M., Yus, E., Martinez, S., Baù, D., Tahara, Y. O., Pengo, T., et al. (2017). Defined chromosome structure in the genome-reduced bacterium mycoplasma pneumoniae. Nat. Commun. 8, 14665. doi:10.1038/ncomms14665
Uusitalo, J. J., Ingólfsson, H. I., Akhshi, P., Tieleman, D. P., and Marrink, S. J. (2015). Martini coarse-grained force field: Extension to DNA. J. Chem. Theory Comput. 11, 3932–3945. doi:10.1021/acs.jctc.5b00286
Uusitalo, J. J., Ingólfsson, H. I., Marrink, S. J., and Faustino, I. (2017). Martini coarse-grained force field: Extension to RNA. Biophysical J. 113, 246–256. doi:10.1016/j.bpj.2017.05.043
Verma, S. C., Harned, A., Narayan, K., and Adhya, S. (2023). Non-specific and specific DNA binding modes of bacterial histone, HU, separately regulate distinct physiological processes through different mechanisms. Mol. Microbiol. 119, 439–455. doi:10.1111/mmi.15033
Verma, S. C., Qian, Z., and Adhya, S. L. (2019). Architecture of the escherichia coli nucleoid. PLOS Genet. 15, e1008456. doi:10.1371/journal.pgen.1008456
Virtanen, P., Gommers, R., Oliphant, T. E., Haberland, M., Reddy, T., Cournapeau, D., et al. (2020). SciPy 1.0: Fundamental algorithms for scientific computing in python. Nat. Methods 17, 261–272. doi:10.1038/s41592-019-0686-2
von Koch, H. (1904). On a continuous curve without a tangent, obtained by an elementary geometrical construction. Ark. Mat. Astron. Fys. 1, 681–702.
Wang, J. C. (1991). DNA topoisomerases: Why so many? J. Biol. Chem. 266, 6659–6662. doi:10.1016/s0021-9258(20)89545-3
Wang, W., Jüttler, B., Zheng, D., and Liu, Y. (2008a). Computation of rotation minimizing frames. ACM Trans. Graph. 27, 1–18. doi:10.1145/1330511.1330513
Wang, X., Reyes-Lamothe, R., and Sherratt, D. J. (2008b). Modulation of Escherichia coli sister chromosome cohesion by topoisomerase IV. Genes. & Dev. 22, 2426–2433. doi:10.1101/gad.487508
Wasim, A., Gupta, A., Bera, P., and Mondal, J. (2023). Interpretation of organizational role of proteins on e. coli nucleoid via hi-c integrated model. Biophysical J. 122, 63–81. doi:10.1016/j.bpj.2022.11.2938
Wasim, A., Gupta, A., and Mondal, J. (2021). A hi–c data-integrated model elucidates e. coli chromosome’s multiscale organization at various replication stages. Nucleic Acids Res. 49, 3077–3091. doi:10.1093/nar/gkab094
Weber, S. C., Spakowitz, A. J., and Theriot, J. A. (2010a). Bacterial chromosomal loci move subdiffusively through a viscoelastic cytoplasm. Phys. Rev. Lett. 104, 238102. doi:10.1103/physrevlett.104.238102
Weber, S. C., Spakowitz, A. J., and Theriot, J. A. (2012). Nonthermal ATP-dependent fluctuations contribute to the in vivo motion of chromosomal loci. Proc. Natl. Acad. Sci. 109, 7338–7343. doi:10.1073/pnas.1119505109
Weber, S. C., Theriot, J. A., and Spakowitz, A. J. (2010b). Subdiffusive motion of a polymer composed of subdiffusive monomers. Phys. Rev. E 82, 011913. doi:10.1103/physreve.82.011913
Xiang, Y., Surovtsev, I. V., Chang, Y., Govers, S. K., Parry, B. R., Liu, J., et al. (2021). Interconnecting solvent quality, transcription, and chromosome folding in escherichia coli. Cell. 184, 3626–3642.e14. doi:10.1016/j.cell.2021.05.037
Xue, L., Lenz, S., Zimmermann-Kogadeeva, M., Tegunov, D., Cramer, P., Bork, P., et al. (2022). Visualizing translation dynamics at atomic detail inside a bacterial cell. Nature 610, 205–211. doi:10.1038/s41586-022-05255-2
Yamamoto, T., Izumi, S., and Gekko, K. (2006). Mass spectrometry of hydrogen/deuterium exchange in 70s ribosomal proteins from e. coli. FEBS Lett. 580, 3638–3642. doi:10.1016/j.febslet.2006.05.049
Yoshida, R., Ozaki, S., Kawakami, H., and Katayama, T. (2023). Single-stranded DNA recruitment mechanism in replication origin unwinding by DnaA initiator protein and HU, an evolutionary ubiquitous nucleoid protein. Nucleic Acids Res. 51, 6286–6306. doi:10.1093/nar/gkad389
Youngren, B., Nielsen, H. J., Jun, S., and Austin, S. (2014). The multifork Escherichia coli chromosome is a self-duplicating and self-segregating thermodynamic ring polymer. Genes. & Dev. 28, 71–84. doi:10.1101/gad.231050.113
Yu, I., Mori, T., Ando, T., Harada, R., Jung, J., Sugita, Y., et al. (2016). Biomolecular interactions modulate macromolecular structure and dynamics in atomistic model of a bacterial cytoplasm. eLife 5, e19274. doi:10.7554/elife.19274
Zawadzki, P., Stracy, M., Ginda, K., Zawadzka, K., Lesterlin, C., Kapanidis, A. N., et al. (2015). The localization and action of topoisomerase IV in escherichia coli chromosome segregation is coordinated by the SMC complex, MukBEF. Cell. Rep. 13, 2587–2596. doi:10.1016/j.celrep.2015.11.034
Zechiedrich, E. L., Khodursky, A. B., and Cozzarelli, N. R. (1997). Topoisomerase IV, not gyrase, decatenates products of site-specific recombination in Escherichia coli. Genes. & Dev. 11, 2580–2592. doi:10.1101/gad.11.19.2580
Keywords: whole-cell modeling, chromosome replication, chromosome segregation, brownian dynamics, smc proteins, topoisomerase, Martini model
Citation: Gilbert BR, Thornburg ZR, Brier TA, Stevens JA, Grünewald F, Stone JE, Marrink SJ and Luthey-Schulten Z (2023) Dynamics of chromosome organization in a minimal bacterial cell. Front. Cell Dev. Biol. 11:1214962. doi: 10.3389/fcell.2023.1214962
Received: 30 April 2023; Accepted: 10 July 2023;
Published: 09 August 2023.
Edited by:
Susan Mertins, Leidos Biomedical Research, Inc., United StatesReviewed by:
Cemal Erdem, Clemson University, United StatesLexy Von Diezmann, University of Minnesota Twin Cities, United States
Copyright © 2023 Gilbert, Thornburg, Brier, Stevens, Grünewald, Stone, Marrink and Luthey-Schulten. This is an open-access article distributed under the terms of the Creative Commons Attribution License (CC BY). The use, distribution or reproduction in other forums is permitted, provided the original author(s) and the copyright owner(s) are credited and that the original publication in this journal is cited, in accordance with accepted academic practice. No use, distribution or reproduction is permitted which does not comply with these terms.
*Correspondence: Zaida Luthey-Schulten, emFuQGlsbGlub2lzLmVkdQ==