 Noelle A. Sterling
 Bethany K. Terry
 Julia M. McDonnell1
 Seonhee Kim
- 1Shriners Hospitals Pediatrics Research Center, Department of Neural Sciences, Lewis Katz School of Medicine, Temple University, Philadelphia, PA, United States
- 2Biomedical Sciences Graduate Program, Lewis Katz School of Medicine, Temple University, Philadelphia, PA, United States
The mosaic variegated aneuploidy (MVA)-associated gene Budding Uninhibited by Benzimidazole 1B (BUB1B) encodes BUBR1, a core member of the spindle assembly checkpoint complex that ensures kinetochore-spindle attachment for faithful chromosome segregation. BUB1B mutation in humans and its deletion in mice cause microcephaly. In the absence of BubR1 in mice, massive cell death reduces cortical cells during neurogenesis. However, the molecular and cellular mechanisms triggering cell death are unknown. In this study, we performed three-dimensional imaging analysis of mitotic BubR1-deficient neural progenitors in a murine model to show profound chromosomal segregation defects and structural abnormalities. Chromosomal defects and accompanying DNA damage result in P53 activation and apoptotic cell death in BubR1 mutants. To test whether the P53 cell death pathway is responsible for cortical cell loss, we co-deleted Trp53 in BubR1-deficient cortices. Remarkably, we discovered that residual apoptotic cell death remains in double mutants lacking P53, suggesting P53-independent apoptosis. Furthermore, the minimal rescue of cortical size and cortical neuron numbers in double mutant mice suggests the compelling extent of alternative death mechanisms in the absence of P53. This study demonstrates a potential pathogenic mechanism for microcephaly in MVA patients and uncovers the existence of powerful means of eliminating unfit cells even when the P53 death pathway is disabled.
1 Introduction
Mosaic variegated aneuploidy (MVA) is a rare autosomal recessive disorder characterized by growth retardation, predisposition to cancer, and microcephaly (Garcia-Castillo et al., 2008; Suijkerbuijk et al., 2010; Bianchi et al., 2018; Pavone et al., 2022). Premature chromatid separation resulting in cells with numerically abnormal chromosomes (aneuploidy) is a hallmark feature of MVA. A well-characterized MVA causative gene, Budding Uninhibited by Benzimidazole 1B (BUB1B) encodes the BUB-related 1 (BubR1) protein (Bolanos-Garci and Blundell, 2011). Previous work in mice found that a BubR1 hypomorphic allele substantially reduces protein level presenting with premature aging, and tumor formation, but not microcephaly (Baker et al., 2004; Hanks et al., 2004; Matsuura et al., 2006; Frio et al., 2010; Suijkerbuijk et al., 2010; Miyamoto et al., 2011; Baker et al., 2012; Wijshake et al., 2012; Choi et al., 2016; Yang et al., 2017; Pavone et al., 2022). Successful microcephaly modeling has been shown in Emx1-Cre-mediated genetic ablation, which nearly completely depletes BubR1 in cortical progenitors and recapitulates microcephaly phenotypes observed in humans (Simmons et al., 2019).
Microcephaly is a condition diagnosed in children born with head circumferences two or more standard deviations below the mean (Hanzlik and Gigante, 2017). Many genetic causes of microcephaly in humans have been linked to genes required for cell cycle progression, DNA replication and repair, and faithful mitosis (Woods et al., 2005; Faheem et al., 2015). BubR1 is a multidomain spindle assembly checkpoint (SAC) protein that ensures mitotic spindle attachment and prevents premature activation of the anaphase promoting complex (APC) (Mao et al., 2003; Burke and Stukenberg, 2008; Bolanos-Garcia and Blundell, 2011; Suijkerbuijk et al., 2012). Accordingly, BubR1 loss or mutation can cause microcephaly when impaired checkpoint function results in aneuploidy and subsequent cortical cell loss (Izumi et al., 2009; Malureanu et al., 2009; Lara-Gonzalez et al., 2011; Suijkerbuijk et al., 2012). Previous studies of BubR1 deficiency have described aneuploidy associated with the presence of lagging chromosomes and mitotic slippage (Matsuura et al., 2006; Frio et al., 2010). However, it remains to be determined whether BubR1 microcephaly models indeed have chromosome segregation defects that have been associated with BubR1 depletion and microcephaly pathology.
In BubR1 conditional knockout (cKO) mice, massive cell death produces significantly smaller cortices consistent with microcephaly pathology (Simmons et al., 2019). In other systems, apoptosis due to genomic alterations or mitotic disruption is often caused by activation of the tumor suppressor protein P53 (Ha et al., 2007; Ohashi et al., 2015; Soto et al., 2017). P53 activation can arrest the cell cycle or initiate apoptosis to eliminate genomically unfit cells as part of its role in mitotic surveillance (Pilaz et al., 2016; Soto et al., 2017; Hafner et al., 2019; Navarro et al., 2020). Importantly, P53 activation has been observed in a variety of microcephaly models (Frank et al., 2000; Gao, et al., 2000; McConnell et al., 2004; Insolera et al., 2014; Marjanovic et al., 2015; Ghouzzi et al., 2016; Mao et al., 2016; Bianchi et al., 2017; Sgourdou et al., 2017; Little and Dwyer, 2019; Shi et al., 2019; Phan et al., 2021; White et al., 2021; Martins et al., 2022; Peek et al., 2022; Sterling et al., 2023).
In some studies, genetic deletion of Trp53 rescues cortical size, suggesting that P53 activation triggers extensive cortical cell death that leads to microcephaly (Insolera et al., 2014; Marjanovic et al., 2015; Mao et al., 2016; Bianchi et al., 2017; Little and Dwyer, 2019; Shi et al., 2019; Phan et al., 2021; Peek et al., 2022; Sterling et al., 2023). Therefore, it is plausible that mitotic disruption due to BubR1 loss may result in P53 activation and subsequent cell death. Alternatively, in other microcephaly models, P53 elimination does not rescue microcephaly due to the persistence of compounding factors with cellular consequences that are not mediated by P53 (Frank et al., 2000; Gao, et al., 2000; White et al., 2021). To date, Trp53 co-deletion to determine whether P53 activation mediates BubR1 microcephaly pathogenesis has not been tested.
In this study, we use a BubR1 cKO mouse model to examine the cellular mechanism underlying the massive cell death that occurs when BubR1 is lost during cortical development. From three-dimensional analysis of mitotic neural progenitors in the developing cortex, we observe that BubR1 loss causes extensive DNA damage and chromosome structural abnormalities. These changes underlie massive cell death, leading to microcephaly. As has been described in other microcephaly models, we observe P53 activation in response to BubR1 cortical loss. However, genetic co-deletion of BubR1 and Trp53 only mildly improved microcephaly and cell death without rescuing DNA damage. Importantly, our results implicate a P53-independent cell death mechanism in microcephaly resulting from BubR1 loss. Our study reveals that P53-independent cell death pathways can provide redundancy to ensure the elimination of unfit cells from the cerebral cortex.
2 Materials and methods
2.1 Animal care and breeding
The experiments described within this manuscript were approved by and performed following the guidelines established by the Institutional Animal Care and Use Committee (IACUC) at the Temple University School of Medicine. Mice were kept on a 12-h light: 12-h dark cycle and provided food and water ad libitum. Animals were kept at ambient temperatures between 70 and 74°C and humidity from 30% to 70%. For every experiment, 3–11 animals were analyzed. Both male and female mice were used in these studies.
BubR1H/H mice (Baker et al., 2004) were bred with Emx1-Cre mice (Jackson Lab #005628) to generate BubR1 conditional knockout (cKO) animals (Gorski et al., 2002). BubR1 cKO animals were crossed with Trp53fl/fl animals (The National Cancer Institute Mouse Repository # 01XC2) to generate BubR1;Trp53 double conditional knockout (dcKO) mice. Genotyping was undertaken as previously described using the primers below (Armstrong et al., 1995; Jonkers et al., 2001; Baker et al., 2004).
Cre- (F: GCA TTA CCG GTC GAT GCA ACG AGT GAT GAG, R: GAG TGA ACG AAC CTG GTC GAA ATC AGT GCG).
BubR1- (F: GTA AGT CTA TTT CTC CTG GAT TAA GTA G, R: CAT CTG TGT ACC ATA CGT GTG TCT GG, R: ATA TTG CTG AAG AGC TTG GCG GCG).
Trp53- (F: CAC AAA AAC AGG TTA AAC CCA G, R: AGC ACA TAG GAG GCA GAG AC).
2.2 Apical explant staining
At embryonic day (E)14.5, the mouse dorsal cortex was dissected and incubated in 4% paraformaldehyde at 4°C overnight. Samples were then transferred to phosphate-buffered saline (PBS) and maintained at 4°C until staining. Antigen retrieval was performed in 1% sodium dodecyl sulfate (SDS) in PBS for 5 min, followed by rinsing in PBS. Permeabilization was then performed in 0.1% TritonX-100 in PBS for 15 min, followed by PBS washes. Next, samples were incubated in primary antibodies with 5% normal goat serum (NGS) at 4°C overnight and washed again in PBS the next morning. Samples were incubated in secondary antibody solution (Cy3 anti-mouse, Alexa Fluor 647 anti-rabbit) with 5% NGS and Hoechst 33258 at room temperature for 1 h. Samples were washed in PBS and mounted in Fluoromount G (SouthernBiotech #0100-01) on glass slides with the apical face of the cortex oriented upward. Finally, samples were imaged with a confocal microscope (SP8, Leica) in 0.5 μm z-stacks of a 20 μm thickness. Image analysis was performed using LAS AF (Leica) and Photoshop (Adobe v22.2.0). Mitotic cell modeling was performed using Imaris software to create surface objects where samples showed DAPI-labeled DNA.
2.3 Immunohistochemistry
Animals were sacrificed at E14.5 and postnatal day (P)21, then perfused with phosphate-buffered saline (PBS) and 4% paraformaldehyde in PBS. Brains were dissected out and fixed overnight in 4% paraformaldehyde in PBS. Collected cortices were embedded in paraffin before microtome sectioning at a thickness of 7 μm.
For immunohistochemistry, cortex sections were rehydrated in a series of 100% xylene and 100%–30% ethanol washes before antigen retrieval in a 10 mM sodium citrate solution. Slides were incubated in primary antibody mixes with the antibodies of interest (information included below) and 5% normal goat serum in PBS at 4°C overnight. After PBS washes the next day, slides were incubated in secondary antibodies (Alexa Fluor 488 anti-mouse, Alexa Fluor 488 anti-rabbit, Alexa Fluor 488 anti-rat, Cy3 anti-rabbit, Cy3 anti-mouse, Alexa Fluor 647 anti-rabbit), 1:500 Hoechst 33342 (Invitrogen #H21492), and 5% normal goat serum in PBS for 3 h. Slides were then washed and mounted with Fluoromount-G (SouthernBiotech #0100-01). TUNEL staining was performed using the Click-iT Plus TUNEL Assay Kit with Alexa Fluor 594 (Invitrogen #C10617).
2.4 Primary antibodies
The following antibodies were used for immunohistochemistry: BrdU (ab6326, Abcam, 1:200), Cleaved Caspase-3 (#9661, Cell Signaling Technology, 1:200), CTIP2 (ab18465, Abcam, 1:200), CUX1 (11733-1-AP, Proteintech, 1:200), F4/80 (28463-1-AP, Proteintech, 1:200), FOXP2 (ab16046, Abcam, 1:200), MPM2 (05-368, Cell Signaling, 1:200), P21 (#27296-1-AP, Proteintech, 1:200), PAX6 (#901301, Biolegend, 1:200), PH3 (H0412, Millipore Sigma, 1:500), SOX9 (AB5535, Millipore Sigma, 1:500), TBR2 (ab23345, Abcam, 1:200), and γH2AX (05-636-I, Millipore Sigma, 1:200).
2.5 Histology
Hematoxylin and eosin staining was undertaken on the 7 μm paraffin-embedded sections, collected as described in the immunohistochemistry section above. Briefly, samples were rehydrated in a series of xylene and ethanol washes before incubation in hematoxylin and eosin (Scytek #NC0510871). Slides were washed again with another series of xylene and ethanol washes and then mounted with Cytoseal™ 60 (Thermo Scientific #8310-4).
2.6 Cell counting and cortical size analyses
For cortical and hippocampal measurements (including length, thickness, and area) at E14.5 and P21, cortical measurements were made using non-consecutive H&E-stained sections for each animal using ImageJ (FIJI) (Schindelin et al., 2012). Cortical surface area measurements were taken from whole brain images using ImageJ (FIJI). Cell counting analyses were completed using Photoshop (Adobe v 22.2.0.). At E14.5, cells were counted within a 200 μm width of cortex, counting all positive cells within the entire height of the cortex. Particle analysis of P21 expression was performed in a 200 μm width of the cortex using ImageJ (FIJI). Thresholding was performed to select for particles within 1–10 μm to eliminate clumps and background noise, and particle number was measured.
Analysis of apical explant staining and mitotic cell staging was performed at E14.5 in a 200 μm2 section of the apical surface. PH3 staining intensity varies by mitotic phase and was therefore used as a guide to indicate mitotic cells. Cells in prophase possess bright PH3 labelling with round DNA, metaphase cells possess PH3 labelling with DNA aligned at the metaphase plate, and ana/telophase cells rarely label with PH3 and display DNA separating in two aligned regions. All cells within the measurement area were examined carefully, and all mitotic cells were counted regardless of PH3 intensity.
At P21, cells were counted within a 400 μm width of cortex, or within a 1,000 μm width of the CA1/CA2 region of the hippocampus, counting all positive cells within the entire height of the cortex.
2.7 Statistical analyses
For each analysis, between three and eleven animals for each genotype group were assessed. Statistical significance was assessed using a one-way ANOVA and then a post hoc Tukey test, or a two-tailed Student’s t-test using GraphPad Prism (version 9.1.0 for Windows, GraphPad Software, San Diego, CA).
3 Results
3.1 Developmental loss of BubR1 causes mitotic defects in cortical neural progenitors
As a major component of the spindle assembly check point (SAC), BubR1 is a versatile protein essential for genomic integrity. In addition to its role in delaying anaphase initiation by inhibiting the anaphase promoting complex (APC) regulatory subunit CDC20, BubR1 is known to stabilize microtubule-kinetochore attachment by recruiting phosphatase PP2A-B56 to reverse phosphorylation at kinetochores (Bolanos-Garcia and Blundell, 2011; Braga et al., 2020). This promotes chromosome alignment and SAC silencing. Although we have shown that BubR1 loss in cortical progenitors mediated by Emx1-Cre causes massive cell death and cortical cell reduction, the cellular mechanism responsible for compromised cellular viability is unknown (Simmons et al., 2019). Previously, a reduced proportion of mitotic cells and smaller fraction of metaphase cells in BubR1 cKO cortices indicated the possibility of premature chromosome separation (Simmons et al., 2019). However, it was not determined whether mitotic disruption was present, or if BubR1-deficient mitosis generated aneuploidy or structural chromosome abnormalities. To find evidence of mitotic disruption, we performed en face apical explant analyses of BubR1 cKO cortices with Emx1-Cre which we previously studied (Simmons et al., 2019). As cortical progenitors undergo cell cycle-dependent nuclear migration, mitotic division occurs at the ventricular (apical) surface (Figure 1A). Therefore, the apical surface of the developing cortex is populated by cells undergoing mitosis in both wild type (WT) and BubR1 cKO animals (Figure 1A).
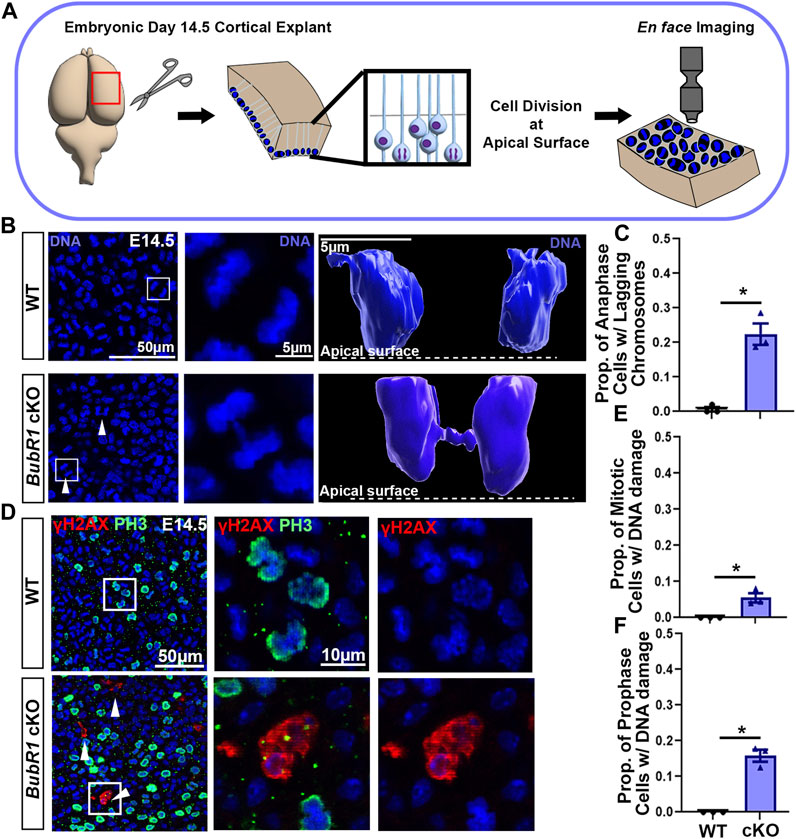
FIGURE 1. Loss of BubR1 causes lagging chromosomes in mitotic neural progenitors. (A) Schematic depicting the method by which dividing neural progenitors at the apical surface of the cortex can be visualized by en face apical explants. (B, C) Representative images and quantification showing an increase in the number of neural progenitors in cytokinesis that display lagging chromosomes in the BubR1 cKO brain. White arrows indicate cytokinetic cells with lagging chromosomes. White boxes indicate cells represented in inset images (B). Scale bar = 50 μm. WT n = 3, BubR1 cKO n = 3. (P = <0.0161). (D–F) Visualization and quantification of mitotic cells displaying DNA damage performed via apical explant staining shows a significant increase in mitotic cells with DNA damage in BubR1 cKO brains. Cells with DNA damage are restricted to prophase where an average of 15% of prophase cells display DNA damage in the BubR1 cKO. Scale bar = 50 μm, 10 μm. WT n = 3, BubR1 cKO n = 3. (PPH3+DNA DAMAGE = <0.0486), (PPH3+DNA DAMAGE PROPHASE = .01100). Data are presented as the mean±SEM and analyzed by a two-tailed Student’s t-test.
Through detailed analysis of mitotic cells at the height of neurogenesis in the embryonic day (E)14.5 cortex, we observed lagging chromosomes, DNA bridges, and micronuclei in BubR1 cKO cells (Figure 1B and data not shown). Chromosome segregation defects are visible during anaphase and are known to contribute to the mosaic variegated aneuploidy that is associated with BubR1 mutation or loss in humans. We found chromosome segregation defects in an average of 23% of total mitotic cells in BubR1 cKO samples, compared to 0% of WT cells (Figures 1B, C). Modelling examples of anaphase cells using Imaris software allowed visualization of the distinct separation of anaphase DNA in WT cells, whereas a BubR1-deficient cell displayed a DNA bridge formed from lagging chromosomes lingering between separating DNA during anaphase (Figure 1B). Our observations of lagging chromosomes, DNA bridges, and micronuclei demonstrate a spectrum of chromosome segregation defects in BubR1-deficient neural progenitors. These results suggest that BubR1 loss contributes to chromosome segregation defects in cortical neural progenitors and may produce cells unfit for proliferation and survival.
Because aneuploidy can cause DNA damage that leads to cell cycle arrest and cell death, and we observed chromosome segregation defects, we next examined whether DNA damage is increased in BubR1 cKO cortices. We were particularly interested in determining if mitotic cells harbor DNA damage as these cells that have passed the G2-M checkpoint could undergo mitotic catastrophe followed by apoptosis or necrosis (Yasuhira et al., 2016; Bertheloot et al., 2021). To determine the fraction of mitotic cells with DNA damage, we performed immunostaining on apical explants to co-label mitotic cells with phospho-histone (PH)3 and cells containing DNA double strand breaks with γH2AX. When BubR1 is lost during cortical development, we observed a significant increase in the number of cells displaying γH2AX+ DNA damage compared to WT controls (Figures 1D–F). Interestingly, mitotic cells with DNA damage were in prophase but not in later mitotic stages such as meta-, ana-, or telophase. Importantly, 10% of prophase cells have apparent DNA damage labelled by γH2AX in the BubR1 cKO cortex while no WT cells in prophase are positive for γH2AX (Figure 1F). Prophase neural progenitors with DNA damage may struggle to enter subsequent mitotic phases. Consistent with this evidence, we previously observed that the proportion of mitotic cells in prophase was increased by BubR1 deletion (Simmons et al., 2019). It is therefore possible that mitosis may be longer to provide time for the DNA damage response. Alternatively, cells with unresolved DNA damage may undergo mitotic catastrophe and cell death without proceeding through the rest of the mitotic cycle. Together, we have found that in the absence of BubR1, a significant proportion of prophase mitotic cells contain DNA damage.
3.2 Apoptotic cell death but not DNA damage can be improved by Trp53 co-deletion
Because significant cell death and DNA damage are features of BubR1 cortical loss, we examined whether P53 activation mediates cell elimination in the BubR1 cKO cortex as in many other microcephaly models. To determine whether P53 is indeed activated in response to BubR1 loss in the developing cortex, we performed immunostaining for P21, the well-known downstream effector of P53. Importantly, P21 levels were significantly increased throughout the BubR1 cKO cortex at E14.5 (Figures 2A, B). To be certain that P53 activation causes P21 upregulation, we genetically deleted Trp53 in our BubR1 cKO using Emx1-Cre. As expected, Trp53 co-deletion reduced P21 expression to WT levels (Figures 2A, B). Because microglia are known to become activated in the cortex following P53 upregulation, we also analyzed the numbers of activated microglia (F4/80+) in the developing cortex (Shi et al., 2019). The numbers of activated microglia were significantly increased in the BubR1 cKO and reduced back to WT levels by Trp53 co-deletion (Figures 2C, D). Together, this data indicates that P53 is activated when BubR1 is lost from the developing cortex.
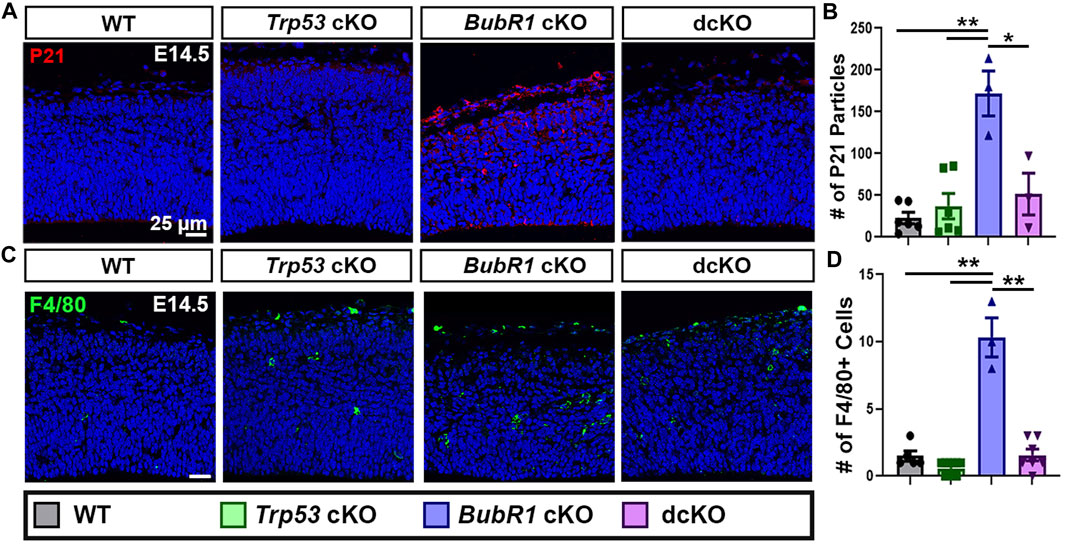
FIGURE 2. P53 activation occurs in response to BubR1 loss. (A, B) At E14.5, immunohistochemistry, and particle analysis for P21 in a 200 μm width of the cortex demonstrates that BubR1 cKO animals express more P21 protein. This effect can be fully rescued by Trp53 deletion indicating that P53 is activated in response to BubR1 loss. Scale bar = 25 μm. WT n = 6, P53 cKO n = 6, BubR1 cKO n = 3, dcKO n = 3. (ANOVAP21 F = 13.97, df = 3.14, p = 0.0002; Adjusted PWT-p53 CKO = 0.8886, Adjusted PWT−BUBR1 CKO = 0.0001, Adjusted PWT−DCKO = 0.6455, Adjusted PP53 CKO−BUBR1 cKO = 0.0004, Adjusted PP53 CKO−DCKO = 0.9305, Adjusted PBUBR1−DCKO = 0.0036). (C, D) Representative images and quantification of F4/80 labeled activated microglia. Activated microglia are increased in the cortex when BubR1 is lost. This effect is returned to WT levels in the dcKO group, confirming P53 activation when BubR1 is lost. Scale bar = 25 μm. WT n = 5, P53 cKO n = 10, BubR1 cKO n = 3, dcKO n = 7. (ANOVAF4/80 F = 62.25, df = 3.21, P = <0.0001; Adjusted PWT-p53 CKO = 0.4648, Adjusted PWT−BUBR1 CKO = <0.0001, Adjusted PWT−DCKO = 0.9995, Adjusted PP53 CKO−BUBR1 cKO = <0.0001, Adjusted PP53 CKO−DCKO = 0.3107, Adjusted PBUBR1−DCKO = <0.0001).
Next, we sought to determine the contribution of P53 activation to cell death when BubR1 is lost via the presence of the apoptosis marker cleaved-caspase 3 (CC3) in WT, Trp53 cKO, BubR1 cKO and dcKO animals at E14.5. Because P53 is a major apoptotic cell death mediator, we observed an expected, nearly complete absence of CC3+ cells in Trp53 cKO cortices (Figures 3A, B). In contrast, BubR1 loss results in a significant increase in the number of apoptotic cortical cells (Figures 3A, B). To determine whether P53 activation is responsible for apoptotic cell death, we analyzed CC3+ cells in dcKO samples. Interestingly, Trp53 co-deletion produced a significant but incomplete reduction in apoptotic cell numbers (Figures 3A, B). To better characterize the population of cortical cells being affected by cell death, we divided each cortex into four regions (Figure 3A). These regions include the ventricular zone (VZ), subventricular zone (SVZ), intermediate zone (IZ), and cortical plate (CP). Our analysis revealed that cell death is distributed throughout the cortex. Cell death was not significantly different between regions of the cortex or between the cKO and dcKO groups (Figure 3C). This data therefore suggests that cortical cells residing in any region can be affected by cell death when BubR1 is lost in the developing cortex. This data reflects previous analysis of cell death in BubR1 cKO cortices which showed that both proliferative and post-mitotic cells undergo cell death when BubR1 is lost (Simmons et al., 2019).
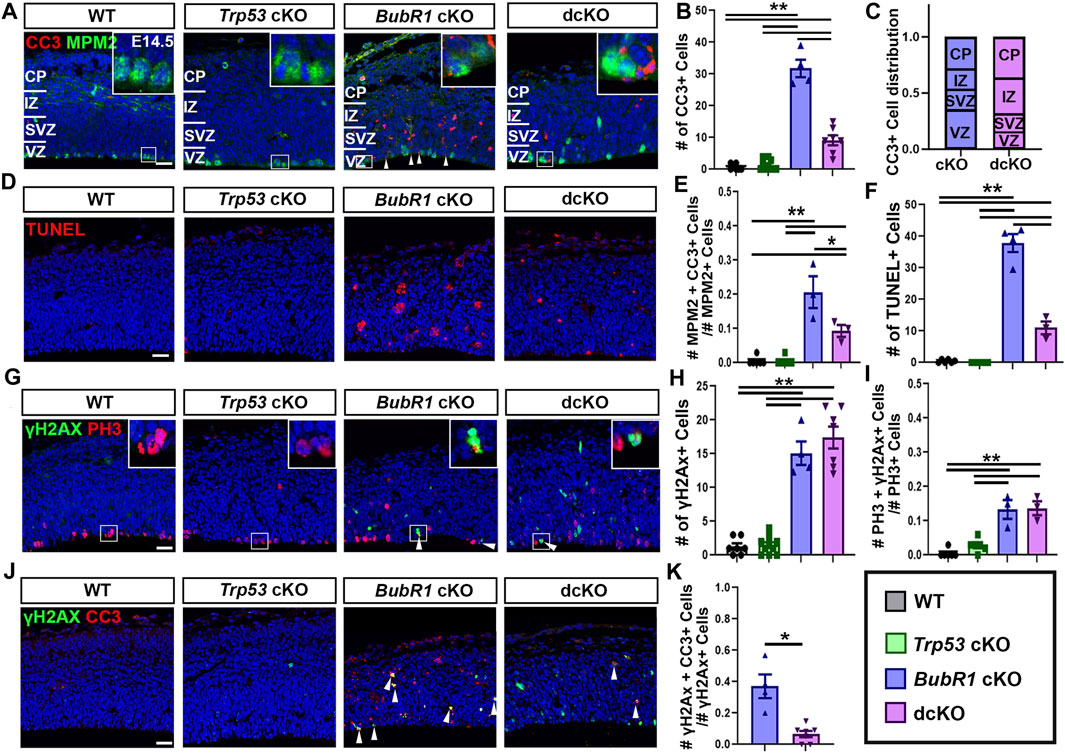
FIGURE 3. At E14.5, microcephaly pathology can be partially improved by Trp53 co-deletion. (A) Representative images showing CC3 labeling of apoptotic cells and MPM2 labelling of mitotic cells in the E14.5 cortex. (B) Quantification of CC3+ apoptotic cells in a 200 μm width of the cortex demonstrates a significant increase in CC3+ cells in BubR1 cKO animals. Cell death still occurs but is significantly reduced in dcKO brains. Scale bar = 25 μm. WT n = 7, P53 cKO n = 10, BubR1 cKO n = 4, dcKO n = 7. (ANOVACC3 F = 107.8, df = 3.24, P = <0.0001; Adjusted PWT-p53 CKO = 0.9686, Adjusted PWT−BUBR1 CKO = <0.0001, Adjusted PWT−DCKO = 0.0002, Adjusted PP53 CKO−BUBR1 cKO = <0.0001, Adjusted PP53 CKO−DCKO = 0.0002, Adjusted PBUBR1−DCKO = <0.0001). (C) Quantification of the distribution of CC3+ dying cells throughout the cortex showing that cell death affects cells in all cortical regions. The proportion of dying cells is not significantly different between any region or between the two animal groups. BubR1 cKO n = 3, dcKO n = 3. (ANOVACC3/Cortical Zone (RowCKO/DCKO: DF=1, F=<.0001, P=>.99)(ColumnRegion: DF=3, F=.6967, P=.6175). (D) Representative images of TUNEL+ cells. Scale bar = 25 μm. (E) Quantification of the proportion of mitotic cells undergoing cell death in a 200 μm width of the cortex at E14.5. The proportion of dying mitotic cells is significantly higher in BubR1 cKO animals compared to WT or P53 cKO. This effect is significantly but not fully reduced in the dcKO group. WT n = 6, P53 cKO n = 6, BubR1 cKO n = 3, dcKO n = 3. (ANOVAMPM2/CC3 F = 29.72, df = 3.14, P = <0.0001; Adjusted PWT-p53 CKO = >0.9999, Adjusted PWT–BUBR1 CKO = <0.0001, Adjusted PWT–DCKO = 0.0120, Adjusted PP53 CKO–BUBR1 cKO = <0.0001, Adjusted PP53 CKO–DCKO = 0.0120, Adjusted PBUBR1–DCKO = 0.0055). (F) Quantification of of TUNEL+ cells in a 200 μm width of the cortex demonstrates a significant increase in TUNEL+ cells in BubR1 cKO animals. Cell death still occurs but is significantly reduced in dcKO brains. WT n = 6, P53 cKO n = 6, BubR1 cKO n = 4, dcKO n = 3. (ANOVATUNEL F = 172.0, df = 3.15, P = <0.0001; Adjusted PWT-p53 CKO = 0.9942, Adjusted PWT–BUBR1 CKO = <0.0001, Adjusted PWT–DCKO = 0.0006, Adjusted PP53 CKO–BUBR1 cKO = <0.0001, Adjusted PP53 CKO–DCKO = 0.0004, Adjusted PBUBR1–DCKO = <0.0001). (G–I) Representative images and quantification of mitotic cells and DNA damage in a 200 μm width of the cortex. Quantification of cells with DNA damage (γH2AX+) at E14.5 in a 200 μm width of the cortex reveals that the number of cells with DNA image is increased in BubR1 cKO but is not improved by Trp53 co-deletion. Scale bar = 25 μm. WT n = 7, P53 cKO n = 10, BubR1 cKO n = 3, dcKO n = 7. (ANOVAγH2AX F = 71.37, df = 3.24, P = <0.0001; Adjusted PWT-p53 CKO = 0.9985, Adjusted PWT−BUBR1 CKO = <0.0001, Adjusted PWT−DCKO = <0.0001, Adjusted PP53 CKO−BUBR1 cKO = <0.0001, Adjusted PP53 CKO−DCKO = <0.0001, Adjusted PBUBR1−DCKO = 0.5170). In BubR1 cKO animals, there is a significant increase in mitotic cells with DNA damage compared to WT that is unchanged by Trp53 deletion. Scale bar = 25 μm. WT n = 6, P53 cKO n = 6, BubR1 cKO n = 3, dcKO n = 3. (ANOVAγH2AX/PH3 F = 28.13, df = 3.14, P = <0.0001; Adjusted PWT-p53 CKO = 0.4383, Adjusted PWT−BUBR1 CKO = <0.0001, Adjusted PWT−DCKO = <0.0001, Adjusted PP53 CKO−BUBR1 cKO = 0.0003, Adjusted PP53 CKO−DCKO = 0.0002, Adjusted PBUBR1−DCKO = 0.9986). (J–K) Quantification of the proportion of γH2AX+ cells with DNA damage that are undergoing apoptosis (CC3+) shows that a significant number of cells with DNA damage are dying in the BubR1 cKO but not the dcKO animals. Scale bar = 25 μm BubR1 cKO n = 4, dcKO n = 7. (p = .0239). White boxes represent inset images. Inset images are closer representations of mitotic cells. Data are presented as the mean±SEM and analyzed by one-way ANOVA followed by a posthoc Tukey test, two-way ANOVA, or a Student’s t-test.
To confirm that Trp53 deletion does not fully rescue cell death in the BubR1 cKO cortex, we also performed TUNEL staining to label cells in the terminal stages of apoptosis. While WT or Trp53 cKO cortices include very few TUNEL+ cells, deletion of BubR1 significantly increases dying cells, and Trp53 co-deletion significantly but not fully reduces the average number of TUNEL+ cells (Figures 3D, F). Importantly, we also found a substantial proportion of mitotic cells undergoing apoptosis (∼20%) in the BubR1 cKO cortex, which can be halved by Trp53 co-deletion (10%) (Figure 3E). Because Trp53 deletion does not fully prevent apoptotic cell death, as indicated by CC3 staining and TUNEL labeling, our results suggest the presence of a P53-independent cell death mechanism affecting BubR1-deficient cortical cells.
Because P53 activation can cause DNA damage and DNA damage can cause P53 activation, we asked whether DNA damage persists after Trp53 deletion. If P53 activation contributes to DNA damage accumulation, DNA damage would be reduced by P53 depletion. Alternatively, P53 depletion could allow the persistence of cells with DNA damage by preventing them from being repaired or eliminated. As previously shown (Simmons et al., 2019), we observed that the number of cells containing γH2AX+ DNA damage in the cortex was significantly increased by loss of BubR1 (Figures 3G, H). However, Trp53 co-deletion did not decrease the number of cells with DNA damage, suggesting that P53 activation is downstream of or unrelated to DNA damage acquisition (Figure 3H). Similarly, an increase in the proportion of mitotic cells with DNA damage (13%) was unchanged by Trp53 co-deletion (Figure 3I). This data suggests that P53-mediated damage repair does not play a significant role when BubR1 is lost because elimination of P53 in the dcKO cortex does not increase the number of cells with DNA damage compared to BubR1 cKO brains.
Although cells with unrepaired DNA damage should undergo apoptosis to prevent genomic instability, the absence of P53 in dcKO cortices may prevent apoptosis of genomically unfit cells. To test this, we analysed the proportion of cells with DNA damage (γH2AX+) that were undergoing apoptotic cell death (CC3+) (Figures 3J, K). Due to their lack of significant cell death or DNA damage, WT and Trp53 cKO animal groups were excluded from this analysis. We found that in the BubR1 cKO cortex, an average of 37% of cells with γH2AX+ DNA damage were CC3+ apoptotic cells (Figure 3K). Meanwhile, dcKO cortices showed that only 7% of cells with DNA damage are apoptotic (Figure 3K), suggesting that cells with DNA damage are no longer targeted for apoptosis in the absence of P53. Together, our results suggest that apoptosis triggered by DNA damage is significantly reduced when P53 is eliminated, potentially allowing cells with DNA damage to persist in dcKO cortices at this stage.
3.3 Trp53 co-deletion partially restores cortical cells during neurogenesis
Since we found substantial reductions in apoptotic but not DNA damaged cells in dcKO cortices, we next sought to determine if Trp53 deletion could improve cell survival in the developing cortex. As previously shown, at E14.5 BubR1 loss results in significantly reduced ventricular length and cortical thickness, indicating a smaller dorsal cortex (Figures 4A–C). While Trp53 co-deletion significantly improved ventricular surface length to WT levels, there was no improvement in cortical thickness (Figures 4A–C). This suggests that initial microcephaly pathogenesis is not completely rescued by eliminating P53-dependent apoptotic cell death at E14.5. To determine if the lack of rescue in cortical thickness correlated with cell numbers, we first labeled and analyzed the number of apical radial glia progenitors (aRG, PAX6+). Consistent with previous results, we found a significant reduction in aRG numbers caused by BubR1 loss (Figures 4D, E). Subsequent co-deletion of Trp53 partially rescued the number of PAX6+ neural progenitors (Figures 4D, E). As in our analysis of PAX6+ aRG, we found that SOX9+ aRG were reduced by the loss of BubR1 and were partially rescued by Trp53 co-deletion (Figures 4F, G).
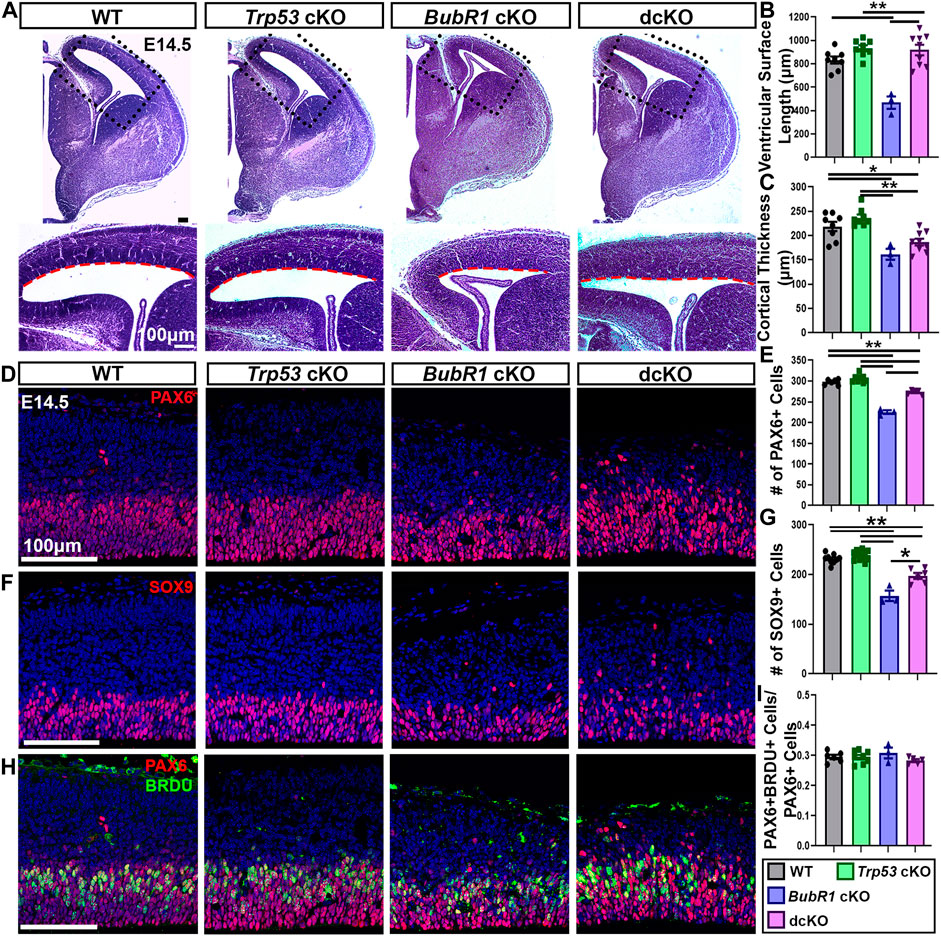
FIGURE 4. At E14.5, microcephaly pathology can be partially improved by Trp53 co-deletion. (A) At E14.5 Hematoxylin and Eosin staining demonstrates that ventricular surface length, but not cortical thickness is improved in dcKO cortices compared to BubR1 cKO mice that display a reduced cortex. Scale bar = 100 μm. (B, C) Quantification of ventricular surface length and cortical thickness at E14.5. WT n = 8, P53 cKO n = 8, BubR1 cKO n = 3, dcKO n = 9. (ANOVALENGTH F = 17.29, df = 3.24, P = <0.0001; Adjusted PWT-p53 CKO = 0.2214, Adjusted PWT−BUBR1 CKO = 0.0001, Adjusted PWT−DCKO = 0.3308, Adjusted PP53 CKO−BUBR1 cKO = <0.0001, Adjusted PP53 CKO−DCKO = 0.9892, Adjusted PBUBR1−DCKO = <0.0001). (ANOVATHICKNESS F = 12.38, df = 3.24, P = <0.0001; Adjusted PWT-p53 CKO = 0.3791, Adjusted PWT−BUBR1 CKO = 0.0043, Adjusted PWT−DCKO = 0.0299, Adjusted PP53 CKO−BUBR1 cKO = 0.0002, Adjusted PP53 CKO−DCKO = 0.0005, Adjusted PBUBR1−DCKO = 0.3470). (D, E) Representative images and quantification of PAX6 labeling of neural progenitors at E14.5 in a 200 μm width of the cortex. PAX6+ cell numbers are reduced by BubR1 loss and significantly but not fully rescued in the dcKO. Scale bar = 100 μm. WT n = 6, P53 cKO n = 8, BubR1 cKO n = 3, dcKO n = 5. (ANOVAPAX6 F = 91.02, df = 3.18, P = <0.0001; Adjusted PWT-p53 CKO = 0.2309, Adjusted PWT−BUBR1 CKO = <0.0001, Adjusted PWT−DCKO = 0.0003, Adjusted PP53 CKO−BUBR1 cKO = <0.0001, Adjusted PP53 CKO−DCKO = <0.0001, Adjusted PBUBR1−DCKO = <0.0001). (F, G) Representative images and quantification of SOX9+ neural progenitors in a 200 μm width of cortex at E14.5 shows that cell numbers are significantly reduced by BubR1 loss and are not rescued by subsequent Trp53 co-deletion. Scale bar = 100 μm. WT n = 9, P53 cKO n = 11, BubR1 cKO n = 3, dcKO n = 6. (ANOVASOX9 F = 47.85, df = 3.25, P = <0.0001; Adjusted PWT-p53 CKO = 0.5383, Adjusted PWT−BUBR1 CKO = <0.0001, Adjusted PWT−DCKO = <0.0001, Adjusted PP53 CKO−BUBR1 cKO = <0.0001, Adjusted PP53 CKO−DCKO = <0.0001, Adjusted PBUBR1−DCKO = 0.0003). (H, I) At E14.5, representative images and quantification of the proportion of PAX6+ neural progenitors that are also BrdU+ after 30 min of BrdU incorporation in utero shows that the proportion of S-phase neural progenitors is unchanged by loss of BubR1 or P53. Scale bar = 100 μm. WT n = 6, P53 cKO n = 8, BubR1 cKO n = 3, dcKO n = 5. (ANOVAPAX6/BrdU F = 1.070, df = 3.18, p = 0.3866; Adjusted PWT-p53 CKO = >0.9999, Adjusted PWT−BUBR1 CKO = 0.7737, Adjusted PWT−DCKO = 0.7432, Adjusted PP53 CKO−BUBR1 cKO = 0.7398, Adjusted PP53 CKO−DCKO = 0.7199, Adjusted PBUBR1−DCKO = 0.3191). Data are presented as the mean±SEM and analyzed by one-way ANOVA followed by a posthoc Tukey test.
Although we did not previously find changes in the S-phase fraction in BubR1 cKO cortices, P53 has established functions in cell cycle arrest and delayed mitotic progression (Ohashi et al., 2015; Pilaz et al., 2016; Soto et al., 2017; Hafner et al., 2019; Navarro et al., 2020). Therefore, we determined whether the S-phase fraction is altered when P53 is lost. To determine if the proportion of S-phase aRG was altered by BubR1 loss or Trp53 co-deletion, we used BrdU and Pax6 immunostaining after treating mice with nucleotide analog BrdU for 30 min. This analysis revealed no significant differences in the proportion of S-phase cells among total aRG in any groups (Figures 4H, I). Therefore, it is unlikely that cell cycle progression is affected by BubR1 or P53 depletion.
Next, we examined the number of intermediate basal progenitors (BP, TBR2+), and early-born neurons (CTIP2+) (Figure 5). Similar to aRG, BP and early-born neuron numbers were reduced in BubR1 cKO brains. Interestingly, while the number of TBR2+ BPs was fully rescued to WT levels in the dcKO cortex (Figures 5A, B), the number of CTIP2+ early-born neurons was not rescued at all by P53 removal (Figures 5C, D). These results demonstrate the differing effects of Trp53 deletion on various cell types in the developing cortex. Interestingly, Trp53 deletion improved ventricular surface length but not cortical thickness (Figures 4A–C). It is possible that because the ventricular surface is composed of apical endfeet and cells undergoing mitosis, the partial but significant restoration of PAX6+ cell numbers may contribute to the ventricular length rescue at E14.5. On the other hand, because vertical growth is achieved by increasing cortical plate thickness, the lack of rescue in cortical neuron production may explain why cortical thickness is not rescued in dcKO brains. Although the number of BPs are restored in dcKO cortices, the partial rescue of aRG numbers and failure to rescue early-born neuron production suggests that prevention of P53-dependent apoptotic cell death may have a limited ability to restore cortical cell numbers.
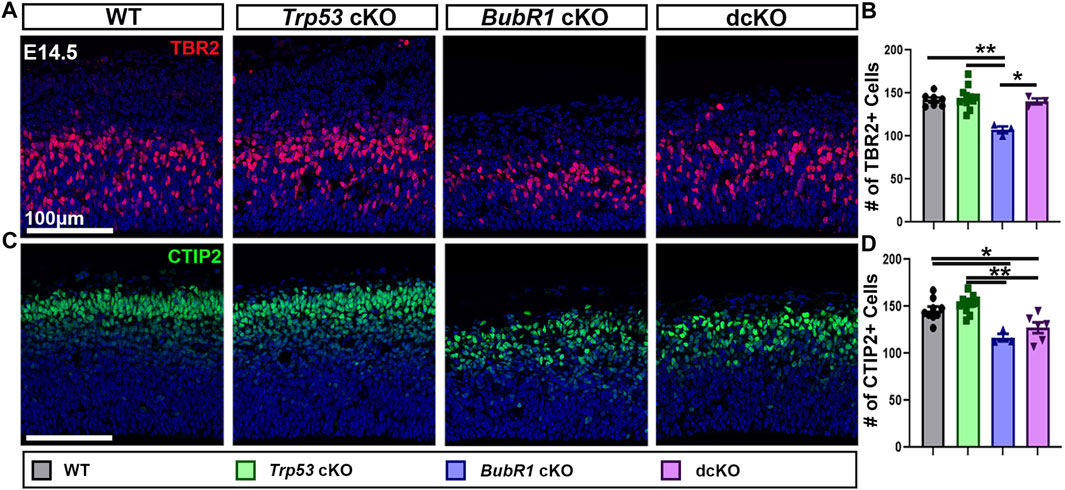
FIGURE 5. Intermediate progenitor and neuron numbers are partially rescued by Trp53 co-deletion at E14.5. (A, B) Representative images and quantification of TBR2 labeling of intermediate progenitors in a 200 μm width of the cortex at E14.5. TBR2+ cell numbers are fully rescued in the dcKO group from their reduced levels in BubR1 cKO cortices. Scale bar = 100 μm. WT n = 7, P53 cKO n = 11, BubR1 cKO n = 3, dcKO n = 3. (ANOVATBR2 F = 10.21, df = 3.20, p = 0.0003; Adjusted PWT-p53 CKO = 0.9522, Adjusted PWT−BUBR1 CKO = 0.0007, Adjusted PWT−DCKO = 0.9957, Adjusted PP53 CKO−BUBR1 cKO = 0.0001, Adjusted PP53 CKO−DCKO = 0.9209, Adjusted PBUBR1−DCKO = 0.0054). (C, D) Representative images and quantification of CTIP2-labeled early-born neurons in a 200 μm width of the cortex at E14.5. The reduction in numbers observed in the BubR1 cKO animals is unaltered in the dcKO. Scale bar = 100 μm. WT n = 9, P53 cKO n = 11, BubR1 cKO n = 3, dcKO n = 6. (ANOVACTIP2 F = 12.17, df = 3.25, P = <0.0001; Adjusted PWT-p53 CKO = 0.5639, Adjusted PWT−BUBR1 CKO = 0.0032, Adjusted PWT−DCKO = 0.0199, Adjusted PP53 CKO−BUBR1 cKO = 0.0003, Adjusted PP53 CKO−DCKO = 0.0008, Adjusted PBUBR1−DCKO = 0.5507). Data are presented as the mean±SEM and analyzed by one-way ANOVA followed by a posthoc Tukey test.
3.4 P53 removal does not rescue the microcephaly phenotype of BubR1 cKO mice
Because we observed a partial preservation effect in cortical cells via genetic deletion of Trp53 during neurogenesis, we next investigated whether Trp53 deletion could improve microcephaly. We analyzed the cortical phenotype at postnatal day (P)21 for all four genotypes. At P21, BubR1 cKO mice are smaller with significantly shorter body lengths and reduced cortical surface area (Figure 6). Because the conditional allele was generated in a BubR1 hypomorphic allele background (Simmons et al., 2019), the whole body possesses reduced BubR1 levels, leading to smaller body size. Of note, cortex size is only decreased when BubR1 level is further eliminated by Cre-mediated cortex specific deletion. While Trp53 deletion alone does not alter the size or morphology of the cortex, dcKO mice display reduced body sizes and cortical surface area as in BubR1 cKO mice (Figure 6). Through histological analyses, we observed that BubR1 loss results in a severe decrease in cortical thickness and ventricular surface length consistent with previous research (Figures 7A–C) (Simmons et al., 2019). Interestingly, when Trp53 was concurrently deleted in the BubR1 cKO cortex, ventricular surface length was mildly but significantly improved while cortical thickness was unchanged, as in embryonic cortex analyses (Figures 7A–C).
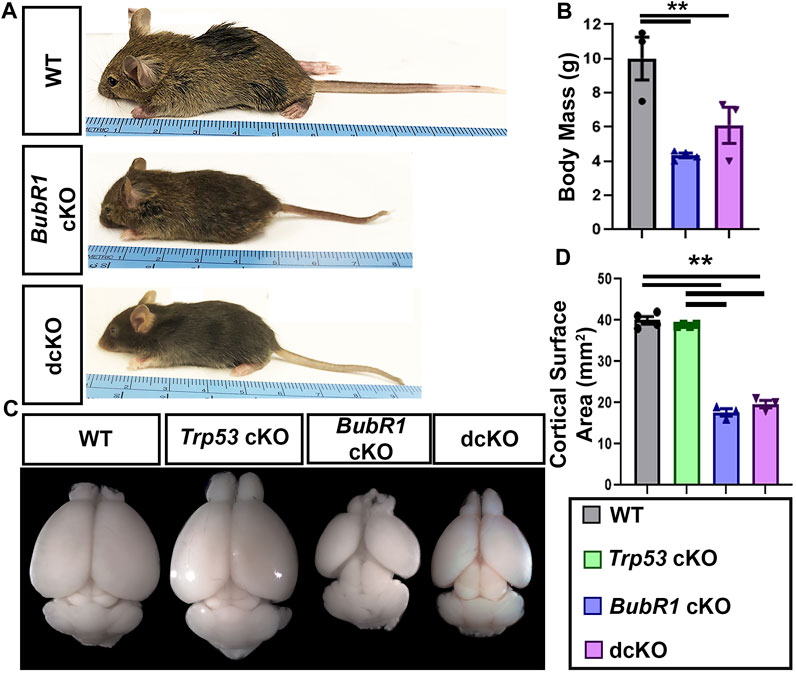
FIGURE 6. BubR1 cKO and dcKO show reductions in body and cortex size. (A, B) Representative images and quantification show that BubR1 cKO and dcKO animals are smaller than their WT counterparts at P21. WT n = 3, BubR1 cKO n = 4, dcKO n = 3. (ANOVABODY MASS F = 11.95, df = 2.7, p = 0.0055; Adjusted PWT−BUBR1 CKO = 0.0046, Adjusted PWT−DCKO = 0.0393, Adjusted PBUBR1−DCKO = 0.3436). (C, D) Representative images of whole brains and quantification of cortical area at P21 shows an overall cortical reduction in BubR1 cKO animals that is unchanged in dcKO animals. WT n = 4, P53 cKO n = 4, BubR1 cKO n = 3, dcKO n = 3. (ANOVACORTICAL AREA F = 251.8, df = 3.10, P = <0.0001; Adjusted PWT-p53 CKO = 0.6042, Adjusted PWT−BUBR1 CKO = <0.0001, Adjusted PWT−DCKO = <0.0001, Adjusted PP53 CKO−BUBR1 cKO = <0.0001, Adjusted PP53 CKO−DCKO = <0.0001, Adjusted PBUBR1−DCKO = 0.3496). Data are presented as the mean±SEM and analyzed by one-way ANOVA followed by a posthoc Tukey test.
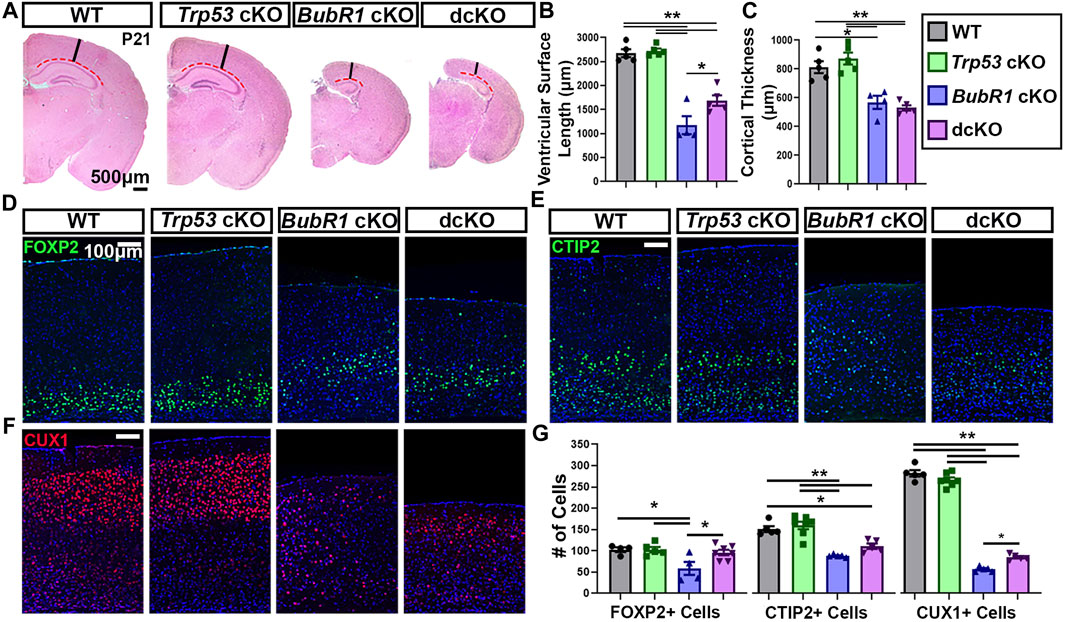
FIGURE 7. Concurrent Trp53 deletion only partially rescues microcephaly pathology in BubR1 cKO animals at P21. (A) Hematoxylin and Eosin staining shows that BubR1 cKO causes microcephaly at P21 which is minimally improved in dcKO animals. Scale bar = 500 μm. Red dotted lines denote where the ventricular surface area was measured. Black lines indicate where cortical thickness was measured. (B, C) Quantification of ventricular surface length and cortical thickness at P21 indicates a mild rescue of ventricular length but not cortical thickness in the dcKO compared to BubR1 cKO. WT n = 5, P53 cKO n = 5, BubR1 cKO n = 4, dcKO n = 5. (ANOVA LENGTH F = 47.50, df = 3.15, P = <0.0001; Adjusted PWT-p53 CKO = 0.9870, Adjusted PWT−BUBR1 CKO = <0.0001, Adjusted PWT−DCKO = <0.0001, Adjusted PP53 CKO−BUBR1 cKO = <0.0001, Adjusted PP53 CKO−DCKO = <0.0001, Adjusted PBUBR1−DCKO = 0.0246). (ANOVA THICKNESS F = 21.53, df = 3.15, P = <0.0001; Adjusted PWT-p53 CKO = 0.6554, Adjusted PWT−BUBR1 CKO = 0.0022, Adjusted PWT−DCKO = 0.0003, Adjusted PP53 CKO−BUBR1 cKO = 0.0003, Adjusted PP53 CKO−DCKO = <0.0001, Adjusted PBUBR1 DCKO = 0.8940).) (D–F) Immunohistochemistry for FOXP2, CTIP2, and CUX1 demonstrates that BubR1 cKO causes a reduction in both early-born and late-born populations of neurons, while concurrent Trp53 deletion minimally improves cell loss. Scale bar = 100 μm. (G) Quantification of cortical neuron numbers at P21 in a 400 μm width of the cortex. (FOXP2: WT n = 4, P53 cKO n = 5, BubR1 cKO n = 4, dcKO n = 7. ANOVAFOXP2 F = 5.162, df = 3.16, p = 0.0875; Adjusted PWT-p53 CKO = >0.9999, Adjusted PWT−BUBR1 CKO = 0.0222, Adjusted PWT−DCKO = 0.9455, Adjusted PP53 CKO−BUBR1 cKO = 0.0154, Adjusted PP53 CKO−DCKO = 0.9330, Adjusted PBUBR1−DCKO = 0.0287). (CTIP2: WT n = 5, P53 cKO n = 7, BubR1 cKO n = 5, dcKO n = 5. ANOVACTIP2 F = 22.34, df = 3.18, P = <0.0001; Adjusted PWT-p53 CKO = 0.8262, Adjusted PWT−BUBR1 CKO = <0.0001, Adjusted PWT−DCKO = 0.0569, Adjusted PP53 CKO−BUBR1 cKO = <0.0001, Adjusted PP53 CKO−DCKO = 0.0006, Adjusted PBUBR1−DCKO = 0.1781). (CUX1: WT n = 5, P53 cKO n = 7, BubR1 cKO n = 5, dcKO n = 5. ANOVACUX1 F = 478.3, df = 3.18, P = <0.0001; Adjusted PWT-p53 CKO = 0.1933, Adjusted PWT−BUBR1 CKO = <0.0001, PWT−DCKO = <0.0001, Adjusted PP53 CKO−BUBR1 cKO = <0.0001, Adjusted PP53 CKO−DCKO = <0.0001, Adjusted PBUBR1−DCKO = 0.0111). Data is presented as the mean ±SEM and analyzed by one-way ANOVA followed by a posthoc Tukey test.
Because cortical thickness was not rescued in dcKO cortices, it is likely that the number of cortical layer neurons are not restored. However, it is also possible that the composition of layer specific neurons may differ in dcKO cortices compared to BubR1 cKO brains. To assess this, we examined layer-specific neuron numbers after labeling early-born neurons with CTIP2 and FOXP2, and late-born neurons with CUX1. As expected, Trp53 deletion alone did not alter cortical cell numbers and cortical lamination, while loss of BubR1 resulted in a significant reduction of neurons from every cortical layer (Figures 7D–G). Trp53 co-deletion significantly rescued the number of early-born neurons labeled with FOXP2 (Figures 7D, G). However, there was no improvement in early-born neurons labeled with CTIP2, and only mild improvement in late-born neuron numbers (CUX1+) at P21 (Figures 7E–G). The significant but minimal rescue effects of Trp53 co-deletion on cortical neuron numbers is consistent with the observed lack of improvement in cortical thickness in dcKO animals. Although the alternative cell death pathway may be a delayed and inefficient mechanism, our results demonstrate that the majority of cells which should be eliminated are eventually removed in the absence of P53. We propose that genomic anomalies and unrepaired DNA damage accumulation are not compatible with survival. In the absence of P53, alternative death mechanisms including P53-independent apoptosis would be responsible for the death of unfit cells.
Although we observed a mild increase in cortical neurons in the dcKO cortex compared to BubR1 cKO, hippocampal development was not improved by Trp53 deletion at P21. BubR1 cKO mice display a morphologically distinct hippocampus with a significantly smaller area than in WT or Trp53 cKO brains. The reduced hippocampal size found in BubR1 cKO brains was not rescued by Trp53 co-deletion (Figures 8A, B). We further quantified the number of neurons within the CA1/CA2 region of the hippocampus by labeling with CTIP2. A significant reduction in the number of CTIP2+ hippocampal neurons observed in BubR1 loss was also not improved by Trp53 co-deletion (Figures 8C, D). Although we have not studied hippocampal developmental defects in the BubR1 cKO and dcKO, it is intriguing that CTIP2+ granule neurons display a disorganized distribution that is especially prominent in dcKO brains. It is possible that insufficient or abnormal genomic content may contribute to defective neuronal migration. Because we observed dispersed cortical progenitors in the dcKO cortex, it is possible that ectopically located progenitors may contribute to the lamina defects found in the hippocampus. Furthermore, the failure of BubR1 cKO brains to develop ependymal cells is not recovered in dcKO brains (data not shown). Overall, this work demonstrates only minimal improvement in the microcephaly phenotype when P53 is lost in the BubR1 cKO cortex, suggesting that P53-mediated cortical cell loss is not the major contributor to BubR1-related microcephaly pathogenesis.
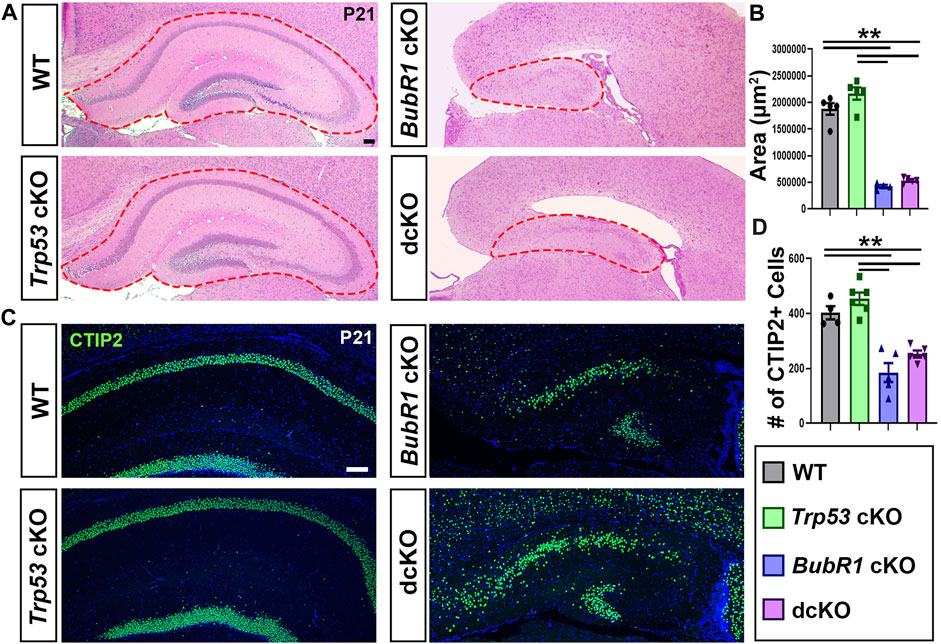
FIGURE 8. Trp53 co-deletion does not significantly rescue hippocampal reduction in BubR1 cKO at P21. (A) Hematoxylin and Eosin staining and shows that the size of the hippocampus is reduced in both BubR1 cKO and dcKO animals. Scale bar = 100 μm. (B) Quantification of hippocampal area shows that hippocampal size is significantly reduced by BubR1 loss and not restored by subsequent Trp53 co-deletion. WT n = 5, P53 cKO n = 5, BubR1 cKO n = 4, dcKO n = 5. (ANOVAAREA F = 107.9, df = 3.15, P = <0.0001; Adjusted PWT-p53 CKO = 0.1147, Adjusted PWT−BUBR1 CKO =<0.0001, Adjusted PWT−DCKO = <0.0001, Adjusted PP53 CKO−BUBR1 cKO = <0.0001, Adjusted PP53 CKO−DCKO = <0.0001, Adjusted PBUBR1−DCKO = 0.8009). (C, D) Representative images and quantification of CTIP2+ neurons in the hippocampal CA1/CA2 region at P21 show a significant reduction in cell numbers caused by BubR1 loss that is unimproved in the dcKO brain. Scale bar = 100 μm. WT n = 4, P53 cKO n = 6, BubR1 cKO n = 5, dcKO n = 5. (ANOVACTIP2 F = 26.76, df = 3.16, P = <0.0001; Adjusted PWT-p53 CKO = 0.4990, Adjusted PWT−BUBR1 CKO = 0.0001, Adjusted PWT−DCKO = 0.0049, Adjusted PP53 CKO−BUBR1 cKO = <0.0001, Adjusted PP53 CKO−DCKO = 0.0001, Adjusted PBUBR1−DCKO = 0.2595). Data are presented as the mean±SEM and analyzed by one-way ANOVA followed by a posthoc Tukey test.
4 Discussion
Because many microcephaly-causing genes encode proteins that are involved in faithful mitosis, studying how mitotic defects lead to microcephaly builds a greater understanding of overall microcephaly pathogenesis (Frank et al., 2000; McConnell et al., 2004; Silver et al., 2010; Chen et al., 2014; Insolera et al., 2014; Faheem et al., 2015; Marjanovic et al., 2015; Mao et al., 2016; Bianchi et al., 2017; Sgourdou et al., 2017; Little and Dwyer, 2019; Shi et al., 2019; McNeely and Dwyer, 2020; Phan et al., 2021; White et al., 2021; Martins et al., 2022; Sterling et al., 2023). In this study, cellular analysis of BubR1 cKO cortices identified a spectrum of structural abnormalities in chromosomes that are caused by the functional loss of BubR1. By imaging mitotic cells which are enriched at the ventricular surface in en face apical explants, we observed lagging chromosomes, DNA bridges, and micronuclei in BubR1 cKO neural progenitors. Premature separation of chromatids is a hallmark of BubR1-related MVA but does not always produce chromosome structural defects (Garcia-Castillo et al., 2008; Soto et al., 2017). Furthermore, the absence of structural abnormalities in whole chromosome aneuploidy was previously shown not to induce P53 activation and cell death (Soto et al., 2017). Because dysfunctional mitotic machinery including disoriented spindle formation and kinetochore failure can produce chromosomal structure abnormalities, BubR1 function in kinetochore integrity may be critical in microcephaly pathogenesis (Ha et al., 2007; Ganem and Pellman, 2012). BubR1 has an increasingly recognized role in establishing kinetochore interaction with the mitotic spindle and recruiting PP2A to the kinetochore to antagonize mitotic phosphorylation (Burke and Stukenberg, 2008; Braga et al., 2020). Therefore, our studies demonstrating structural chromosome aberrations in the BubR1 cKO suggest that microcephaly pathogenesis is owing to the loss of BubR1 function required for kinetochore integrity, which causes P53 activation and subsequent massive cell death.
We identified P53 activation in BubR1 cKO cortices via elevated P21 expression and activated microglia, consistent with the idea that mitotic disruption and DNA damage activate P53. Our findings in this study demonstrate that the role of P53 activation in the BubR1 cKO cortex is to initiate apoptotic cell death, consistent with other microcephaly animal models. Interestingly, unlike other models, we found a significant number of apoptotic cells remaining after P53 elimination, indicating the presence of a P53-independent cell death pathway mediating apoptosis in the BubR1 mutants. For example, P73 and P63 can mediate apoptosis in the absence of P53 (Irwin and Miller, 2004; Melino, 2011; Fisher et al., 2020; Rozenberg et al., 2021; Wang et al., 2021). In particular, P73 is known to be expressed in cortical cells (Irwin and Miller, 2004; Rozenberg et al., 2021). Alternatively, JNK is a known mediator of the aneuploidy-induced P53-independent apoptotic pathway in Drosophila (Dhanasekaran and Reddy, 2017; Gerlach et al., 2018). We therefore postulated that apoptosis may be mediated through these potential factors in our dcKO model to eliminate cells with compromised genomic content in the absence of P53. However, as P53-independent apoptosis is shown to be less efficient (Aubrey et al., 2017), our observation of fewer CC3 and TUNEL+ cells in dcKO cortices compared to BubR1 cKO brains may be due to the diminished efficiency of P53-independent cell death.
The relative inefficiency of P53-independent apoptosis poses an interesting question about whether P53 elimination has beneficial effects on microcephaly resulting from BubR1 loss. Our data showed that at the middle of active neurogenesis, P53 elimination causes a substantial rescue of ventricular length and the number of TBR2+ intermediate basal progenitor, and a partial rescue of the number of PAX6+ and SOX9+ aRG cells. However, we found minimal rescue effects at later stages, suggesting that most genomically unfit cells are cleared by P53-independent pathways resulting in apoptosis and necrosis. Future studies are necessary to distinguish the potential pathways that lead to cell death after BubR1 loss. This study provides new insights into the existence of P53-independent cell death in BubR1-deficient cortical cells when P53 is no longer available.
While many microcephaly models display apoptotic cell death that is mediated by P53 activation, our study demonstrates that P53 elimination minimally restores brain size in BubR1 cKO mice. Distinguishing P53 activation as a molecular mechanism for microcephaly pathology in various models provides important insight into cellular defects linked to P53 activation. For instance, when P53 activation is directly associated with mitotic defects, genetic deletion or inhibition of P53 can substantially rescue the microcephaly phenotype (Sterling et al., 2023). Alternatively, when P53 elimination solely promotes cell survival, a variety of outcomes can be observed. Unfit cells may be removed by alternative cell death mechanisms, or defective cells survive and are observed at later stages (Yang et al., 2003; Peterson et al., 2012; Lang et al., 2016; Shi et al., 2019; Moujalled et al., 2021). In this study, the minimal rescue of cell numbers achieved by deletion of Trp53 in BubR1 cKO mice supports the idea that alternative cell death pathways eliminate unfit cells. In a similar case, cerebellar hypoplasia caused by loss of the DNA damage repair protein ATR is not rescued by Trp53 deletion (Lang et al., 2016). Likewise, when microcephaly is caused by loss of the minor spliceosome protein Rnu11, Trp53 co-deletion does not rescue microcephaly (White et al., 2021). Instead, Rnu11 deficiency causes cell cycle disruption that is exacerbated by the subsequent removal of P53. Interestingly, Knl1 deletion alone allows for animal survival, but the persistence of defective cells in Knl1 and Trp53 double mutants causes postnatal lethality before weaning age (Shi et al., 2019). Our results show minimal rescue effects but no further compromised viability by Trp53 deletion, highlighting the importance of P53-independent cell death pathways for clearing aberrant cells.
In this study, BubR1 cortical deficiency results in many cortical cells and mitotic cells with γH2AX+ DNA damage accumulation that is not prevented by P53 removal. Interestingly, in mitotic cells, DNA damage was detected in prophase but not beyond. Our previous study found a reduced fraction of metaphase cells and an increased fraction of prophase cells among total mitotic cells in BubR1 cKO brains, suggesting that metaphase was shortened by the compromised mitotic checkpoint or prophase was lengthened to allow for the DNA damage response (Simmons et al., 2019). The data in this study suggests the possibility that prophase cells with DNA damage may not proceed through mitosis and could undergo mitotic catastrophe resulting in elimination of these unfit cells. In future studies, the use of time-lapse imaging will be important to distinguish between the possibility of lengthened prophase or unchecked metaphase in BubR1-deficient cells. It will also be important to address the question of how BubR1 loss generates extensive DNA damage. Chromosome segregation errors can result in genomic instability in a variety of ways (Yang et al., 2003; Ganem and Pellman, 2012; Peterson et al., 2012; Luzhna et al., 2013; Ohashi et al., 2015; Rohrback et al., 2018). For example, lagging chromosomes can be trapped and damaged by cleavage furrow progression or translocated to other chromosomes (Ganem and Pellman, 2012). BubR1 is also known to play a role in the DNA damage response (Ha et al., 2007; Baker et al., 2012; Weaver et al., 2016). Elevated BubR1 expression in cancer cells with DNA damage induced by chemoradiation therapy increased non homologous end joining repair (NHEJ) and promoted cell survival (Komura et al., 2021). However, this study cannot distinguish whether BubR1 function is directly required to prevent DNA damage by promoting faithful mitosis to prevent aneuploidy, or if BubR1 is active in repair mechanisms. Importantly, our results show the presence of DNA damage that may have a causative role in P53 activation and cell death.
Overall, our study shows that chromosome structural defects result from BubR1 deficiency in cortical progenitors, providing a potential explanation for massive cortical cell death. Our results also demonstrate that P53 activation occurs in the developing cortex when BubR1 is removed, but loss of cortical volume and cell numbers are only mildly improved by Trp53 deletion in BubR1 cKO brains. This inability to rescue BubR1-dependent cortical cell loss by Trp53 deletion argues the robustness of P53-independent cell death pathways. We therefore propose a model in which genomically unfit cells are generated through aneuploidy, chromosome structural defects and DNA damage after BubR1 loss. Ultimately, these unfit cells can eventually be cleared even in the absence of P53-dependent pathways.
Data availability statement
The original contributions presented in the study are included in the article/Supplementary Material, further inquiries can be directed to the corresponding author.
Ethics statement
The animal study was approved by Temple University, Institutional Animal Care and Use Committee. The study was conducted in accordance with the local legislation and institutional requirements.
Author contributions
NS: Conceptualization, Investigation, Validation, Visualization, Writing–original draft, Writing–review and editing, Data curation, Formal Analysis, Methodology, Software. BT: Conceptualization, Data curation, Formal Analysis, Investigation, Methodology, Software, Validation, Visualization, Writing–original draft, Writing–review and editing. JM: Data curation, Formal Analysis, Investigation, Methodology, Writing–review and editing. SK: Investigation, Writing–review and editing, Conceptualization, Funding acquisition, Project administration, Resources, Supervision, Validation, Visualization, Writing–original draft.
Funding
The author(s) declare financial support was received for the research, authorship, and/or publication of this article. This work was supported by Shriners Hospitals for Children Research Grants (85134-PHI-21 and 85111-PHI-23 to SK), a National Institute of Neurological Disorders and Stroke grant (R01NS104038, R01NS133694 to SK), a Creative Arts, Research And Scholarship (CARAS) grant (to JM), and a student stipend from the Temple Undergraduate Research Program (to JM).
Acknowledgments
The authors would like to thank Jiyeun Kim and Kathleen Rajavong for assistance with animal care and sample collection, Brooke Karchner for help with sample collection, and the entire Kim lab for their helpful feedback on this manuscript. We are also grateful to Jan van Deursen for providing us with the BubR1H/H mice that his lab generated and Joon Young Park for providing us with the Trp53fl/fl mice from the National Cancer Institute Mouse Repository.
Conflict of interest
The authors declare that the research was conducted in the absence of any commercial or financial relationships that could be construed as a potential conflict of interest.
Publisher’s note
All claims expressed in this article are solely those of the authors and do not necessarily represent those of their affiliated organizations, or those of the publisher, the editors and the reviewers. Any product that may be evaluated in this article, or claim that may be made by its manufacturer, is not guaranteed or endorsed by the publisher.
References
Armstrong, J. F., Kaufman, M. H., Harrison, D. J., and Clarke, A. R. (1995). High-frequency developmental abnormalities in p53-deficient mice. Curr. Biol. 5, 931–936. doi:10.1016/s0960-9822(95)00183-7
Aubrey, B. J., Kelly, G. L., Janic, A., Herold, M. J., and Strasser, A. (2017). How does p53 apoptosis and how does this relate to p53-mediated tumour suppression? Cell Death Diff 25, 104–113. doi:10.1038/cdd.2017.169
Baker, D. J., Dawlaty, M. M., Wijshake, T., Jeganathan, K. B., Malureanu, L., van Ree, J. H., et al. (2012). Increased expression of BubR1 protects against aneuploidy and cancer and extends healthy lifespan. Nat. Cell Biol. 15 (1), 96–102. doi:10.1038/ncb2643
Baker, D. J., Jeganathan, K. B., Cameron, J. D., Thompson, M., Juneja, S., Kopecka, A., et al. (2004). BubR1 insufficiency causes early onset of aging-associated phenotypes and infertility in mice. Nat. Genet. 36, 744–749. doi:10.1038/ng1382
Bertheloot, D., Latz, E., and Franklin, B. S. (2021). Necroptosis, pyroptosis and apoptosis: an intricate game of cell death. Cell. Mol. Immunol. 18, 1106–1121. doi:10.1038/s41423-020-00630-3
Bianchi, F. T., Berto, G. E., and Di Cunto, F. (2018). Impact of DNA repair and stability defects on cortical development. Cell Mol. Life Sci. 75, 3963–3976. doi:10.1007/s00018-018-2900-2
Bianchi, F. T., Toccbakero, C., Pallavicini, G., Lrun11iu, Y., Verni, F., Merigliano, C., et al. (2017). Citron kinase deficiency leads to chromosomal instability and TP53-sensitive microcephaly. Cell Rep. 18 (7), 1674–1686. doi:10.1016/j.celrep.2017.01.054
Bolanos-Garcia, V. M., and Blundell, T. L. (2011). BUB1 and BUBR1: multifaceted kinases of the cell cycle. Trends Biochem. Sci. 36 (3), 141–150. doi:10.1016/j.tibs.2010.08.004
Braga, L. G., Cisneros, A. F., Mathieu, M. M., Clerc, M., Garcia, P., Lottin, B., et al. (2020). BUBR1 pseudokinase domain promotes kinetochore PP2A-B56 recruitment, spindle checkpoint silencing, and chromosome alignment. Cell Rep. 33 (7), 108397. doi:10.1016/j.celrep.2020.108397
Burke, D. J., and Stukenberg, P. T. (2008). Linking kinetochore-microtubule binding to the spindle checkpoint. Dev. Cell. 14 (4), 474–479. doi:10.1016/j.devcel.2008.03.015
Chen, J. F., Zhang, Y., Wilde, J., Hansen, K., Lai, F., and Niswander, L. (2014). Microcephaly disease gene Wdr62 regulates mitotic progression of embryonic neural stem cells and brain size. Nat. Commun. 5, 3885. doi:10.1038/ncomms4885
Choi, C. I., Yoo, K. H., Hussaini, S. M. Q., Jeon, B. T., Welby, J., Gan, H., et al. (2016). The progeroid gene BubR1 regulates axon myelination and motor function. Aging 8 (11), 2667–2688. doi:10.18632/aging.101032
Dhanasekaran, D. N., and Reddy, E. P. (2017). JNK-signaling: A multiplexing hub in programmed cell death. Genes Cancer 8 (9-10), 682–694. doi:10.18632/genesandcancer.155
Faheem, M., Naseer, M. I., Rasool, M., Chaudhary, A. G., Kumosani, T. A., Ilyas, A. M., et al. (2015). Molecular genetics of human primary microcephaly: an overview. BMC Med. Genomics. 8 (1), S4. doi:10.1186/1755-8794-8-S1-S4
Fisher, M. L., Balinth, S., and Mills, A. A. (2020). p63-related signaling at a glance. J. Cell Sci. 133 (17), jcs228015. doi:10.1242/jcs.228015
Frank, K. M., Sharpless, N. E., Gao, Y., Sekiguchi, J. M., Ferguson, D. O., Zhu, C., et al. (2000). DNA ligase IV deficiency in mice leads to defective neurogenesis and embryonic lethality via the p53 pathway. Mol. Cell. 5 (6), 993–1002. doi:10.1016/s1097-2765(00)80264-6
Frio, T. J., Lavoie, J., Hamel, N., Geyer, F. C., Kushner, Y. B., Novak, D. J., et al. (2010). Homozygous BUB1B mutation and susceptibility to gastrointestinal neoplasia. N. Engl. J. Med. 363, 2628–2637. doi:10.1056/NEJMoa1006565
Ganem, N. J., and Pellman, D. (2012). Linking abnormal mitosis to the acquisition of DNA damage. J. Cell Biol. 199, 871–881. doi:10.1083/jcb.201210040
Gao, Y., Ferguson, D. O., Xie, W., Manis, J. P., Sekiguchi, J., Frank, K. M., et al. (2000). Interplay of p53 and DNA-repair protein XRCC4 in tumorigenesis, genomic stability and development. Nature 404 (6780), 897–900. doi:10.1038/35009138
Garcia-Castillo, H., Vasquez-Velasquez, A. I., Rivera, H., and Barros-Nunez, P. (2008). Clinical and genetic heterogeneity in patients with mosaic variegated aneuploidy: delineation of clinical subtypes. Am. J. Med. Genet. A 146A (13), 1687–1695. doi:10.1002/ajmg.a.32315
Gerlach, S. U., Eichenlaub, T., and Herranz, H. (2018). Yorkie and JNK control tumorigenesis in Drosophila cells with cytokinesis failure. Cell Rep. 23 (5), 1491–1503. doi:10.1016/j.celrep.2018.04.006
Ghouzzi, V. E., Bianchi, F. T., Molineras, I., Mounce, B. C., Berto, G. E., Rak, M., et al. (2016). ZIKA virus elicits P53 activation and genotoxic stress in human neural progenitors similar to mutations involved in severe forms of genetic microcephaly. Cell Death Dis. 7, e2440. doi:10.1038/cddis.2016.266
Gorski, J. A., Talley, T., Qiu, M., Puelles, L., Rubenstein, J. L. R., and Jones, K. R. (2002). Cortical excitatory neurons and glia, but not GABAergic neurons, are produced in the Emx1-expressing lineage. J. Neurosci. 22, 6309–6314. doi:10.1523/JNEUROSCI.22-15-06309.2002
Hafner, A., Bulyk, M. L., Jambhekar, A., and Lahav, G. (2019). The multiple mechanisms that regulate p53 activity and cell fate. Nat. Rev. Mol. Cell Biol. 20, 199–210. doi:10.1038/s41580-019-0110-x
Ha, G. H., Baek, K. H., Kim, H. S., Jeong, S. J., Kim, C. M., McKeon, F., et al. (2007). p53 activation in response to mitotic spindle damage requires signaling via BubR1-mediated phosphorylation. Cancer Res. 67, 7155–7164. doi:10.1158/0008-5472.CAN-06-3392
Hanks, S., Coleman, K., Reid, S., Plaja, A., Firth, H., FitzPatrick, D., et al. (2004). Constitutional aneuploidy and cancer predisposition caused by biallelic mutations in BUB1B. Nat. Genet. 36, 1159–1161. doi:10.1038/ng1449
Insolera, R., Bazzi, H., Shao, W., Anderson, K. V., and Shi, S. H. (2014). Cortical neurogenesis in the absence of centrioles. Nat. Neurosci. 17 (11), 1528–1535. doi:10.1038/nn.3831
Irwin, M. S., and Miller, F. D. (2004). p73: regulator in cancer and neural development. Cell Death Diff 11, S17–S22. doi:10.1038/sj.cdd.4401452
Izumi, H., Matsumoto, Y., Ikeuchi, T., Saya, H., Kajii, T., and Matsuura, S. (2009). BubR1 localizes to centrosomes and suppresses centrosome amplification via regulating Plk1 activity in interphase cells. Oncogene 28, 2806–2820. doi:10.1038/onc.2009.141
Jonkers, J., Meuwissen, R., van der Gulden, H., Peterse, H., van der Valk, M., and Berns, A. (2001). Synergistic tumor suppressor activity of BRCA2 and p53 in a conditional mouse model for breast cancer. Nat. Genet. 29, 418–425. doi:10.1038/ng747
Komura, K., Inamoto, T., Tsujino, T., Matsui, Y., Konuma, T., Nishimura, K., et al. (2021). Increased BUB1B/BUBR1 expression contributes to aberrant DNA repair activity leading to resistance to DNA-damaging agents. Oncogene 40, 6210–6222. doi:10.1038/s41388-021-02021-y
Lang, P. Y., Nanjangud, G. J., Sokolsky-Papkov, M., Shaw, C., Hwang, D., Parker, J. S., et al. (2016). ATR maintains chromosomal integrity during postnatal cerebellar neurogenesis and is required for medulloblastoma formation. Development 143 (21), 4038–4052. doi:10.1242/dev.139022
Lara-Gonzalez, P., Scott, M. I. F., Diez, M., Sen, O., and Taylor, S. S. (2011). BubR1 blocks substrate recruitment to the APC/C in a KEN-box-dependent manner. J. Cell Sci. 124 (24), 4332–4345. doi:10.1242/jcs.094763
Little, J. N., and Dwyer, N. D. (2019). p53 deletion rescues lethal microcephaly in a mouse model with neural stem cell abscission defects. Hum. Mol. Genet. 28, 434–447. doi:10.1093/hmg/ddy350
Luzhna, L., Kathiria, P., and Kovalchuk, O. (2013). Micronuclei in genotoxicity assessment: from genetics to epigenetics and beyond. Front. Genet. 4 (131), 00131. doi:10.3389/fgene.2013.00131
Melino, G. (2011). P63 is a suppressor of tumorigenesis and metastasis interacting with mutant p53. Cell Death Diff 18, 1487–1499. doi:10.1038/cdd.2011.81
Malureanu, L. A., Jeganathan, K. B., Hamada, M., Wasilewski, L., Davenport, J., and van Deursen, J. M. (2009). BubR1 N terminus acts as a soluble inhibitor of cyclin B degradation by APC/CCdc20 in interphase. Dev. Cell. 16 (1), 118–131. doi:10.1016/j.devcel.2008.11.004
Mao, H., McMahon, J. J., Tsai, Y. H., Wang, Z., and Silver, D. L. (2016). Haploinsufficiency for core exon junction complex components disrupts embryonic neurogenesis and causes p53-mediated microcephaly. PLOS Genet. 12 (9), e1006282. doi:10.1371/journal.pgen.1006282
Mao, Y., Abrieu, A., and Cleveland, D. W. (2003). Activating and silencing the mitotic checkpoint through CENP-E-dependent activation/inactivation of BubR1. Cell. 114 (1), 87–98. doi:10.1016/S0092-8674(03)00475-6
Marjanović, M., Sanchez-Huertas, C., Terre, B., Gomez, R., Scheel, J. F., Pacheco, S., et al. (2015). CEP63 deficiency promotes p53-dependent microcephaly and reveals a role for the centrosome in meiotic recombination. Nat. Commun. 6, 7676. doi:10.1038/ncomms8676
Martins, S., Erichsen, L., Datsi, A., Wruck, W., Goering, W., Chatzantonaki, E., et al. (2022). Impaired p53-mediated DNA damage response contributes to microcephaly in Nijmegen Breakage Syndrome patient-derived cerebral organoids. Cells 11 (5), 802. doi:10.3390/cells11050802
Matsuura, S., Matsumoto, Y., Morishima, K., Izumi, H., Matsumoto, H., Ito, E., et al. (2006). Monoallelic BUB1B mutations and defective mitotic-spindle checkpoint in seven families with premature chromatid separation (PCS) syndrome. Am. J. Med. Gen. A 140 (4), 358–367. doi:10.1002/ajmg.a.31069
McConnell, M. J., Kaushal, D., Yang, A. H., Kingsbury, M. A., Rehen, S. K., Treuner, K., et al. (2004). Failed clearance of aneuploid embryonic neural progenitor cells leads to excess aneuploidy in the Atm-deficient but not the Trp53-deficient adult cerebral cortex. J. Neurosci. 24 (37), 8090–8096. doi:10.1523/JNEUROSCI.2263-04.2004
McNeely, K. C., and Dwyer, N. D. (2020). Cytokinesis and postabscission midbody remnants are regulated during mammalian brain development. Proc. Natl. Acad. Sci. USA. 117 (17), 9584–9593. doi:10.1073/pnas.1919658117
Miyamoto, T., Porazinski, S., Wang, H., Borovina, A., Ciruna, B., Shimizu, A., et al. (2011). Insufficiency of BUBR1, a mitotic spindle checkpoint regulator, causes impaired ciliogenesis in vertebrates. Hum. Mol. Genet. 20 (10), 2058–2070. doi:10.1093/hmg/ddr090
Moujalled, D., Strasser, A., and Liddell, J. R. (2021). Molecular mechanisms of cell death in neurological diseases. Cell Death Differ. 28 (7), 2029–2044. doi:10.1038/s41418-021-00814-y
Navarro, A. M., Pronk, R. B., van der Geest, A. T., Oliynyk, G., Nordgren, A., Arsenian-Henriksson, M., et al. (2020). p53 controls genomic stability and temporal differentiation of human neural stem cells and affects neural organization in human brain organoids. Cell Death Dis. 11 (1), 52. doi:10.1038/s41419-019-2208-7
Ohashi, A., Ohori, M., Iwai, K., Nakayama, Y., Nambu, T., Morishita, D., et al. (2015). Aneuploidy generates proteotoxic stress and DNA damage concurrently with p53-mediated post-mitotic apoptosis in SAC-impaired cells. Nat. Commun. 6, 7668. doi:10.1038/ncomms8668
Pavone, P., Pappalardo, X. G., Mustafa, N., Falsaperla, R., Marino, S. D., Corsello, G., et al. (2022). Pathogenic correlation between mosaic variegated aneuploidy 1 (MVA1) and a novel BUB1B variant: a reappraisal of a severe syndrome. Neurol. Sci. 43 (11), 6529–6538. doi:10.1007/s10072-022-06247-w
Peek, S. L., Bosch, P. J., Bahl, E., Iverson, B. J., Parida, M., Bais, P., et al. (2022). p53-mediated neurodegeneration in the absence of the nuclear protein Akirin2. iScience 25 (2), 103814. doi:10.1016/j.isci.2022.103814
Peterson, S. E., Yang, A. H., Bushman, D. M., Westra, J. W., Yung, Y. C., Barral, S., et al. (2012). Aneuploid cells are differentially susceptible to caspase-mediated death during embryonic cerebral cortical development. J. Neurosci. 32 (46), 16213–16222. doi:10.1523/JNEUROSCI.3706-12.2012
Phan, T. P., Maryniak, A. L., Boatwright, C. A., Lee, J., Atkins, A., Tijhuis, A., et al. (2021). Centrosome defects cause microcephaly by activating the 53BP1-USP28-TP53 mitotic surveillance pathway. EMBO J. 40 (1), e106118. doi:10.15252/embj.2020106118
Pilaz, L. J., McMahon, J. J., Miller, E. E., Lennox, A. L., Suzuki, A., Salmon, E., et al. (2016). Prolonged mitosis of neural progenitors alters cell fate in the developing brain. Neuron 89 (1), 83–99. doi:10.1016/j.neuron.2015.12.007
Rohrback, S., Siddoway, B., Liu, C. S., and Chun, J. (2018). Genomic mosaicism in the developing and adult brain. Dev. Neurobiol. 78 (11), 1026–1048. doi:10.1002/dneu.22626
Rozenberg, J. M., Zvereva, S., Dalina, A., Blatov, I., Zubarev, I., Luppov, D., et al. (2021). The p53 family member p73 in the regulation of cell stress response. Biol. Direct 16, 23. doi:10.1186/s13062-021-00307-5
Schindelin, J., Arganda-Carreras, I., Frise, E., Kaynig, V., Longair, M., Pietzsch, T., et al. (2012). Fiji: an open-source platform for biological-image analysis. Nat. Methods 9 (7), 676–682. doi:10.1038/nmeth.2019
Sgourdou, P., Mishra-Gorur, K., Saotome, I., Henagariu, O., Tuysuz, B., Campos, C., et al. (2017). Disruptions in asymmetric centrosome inheritance and WDR62-Aurora kinase B interactions in primary microcephaly. Sci. Rep. 7, 43708. doi:10.1038/srep43708
Shi, L., Qalieh, A., Lam, M. M., Keil, J. M., and Kwan, K. Y. (2019). Robust elimination of genome-damaged cells safeguards against brain somatic aneuploidy following Knl1 deletion. Nat. Commun. 10 (1), 2588. doi:10.1038/s41467-019-10411-w
Silver, D. L., Watkins-Chow, D. E., Schreck, K. C., Pierfelice, T. J., Larson, D. M., Burnetti, A. J., et al. (2010). The exon junction complex component Magoh controls brain size by regulating neural stem cell division. Nat. Neurosci. 13, 551–558. doi:10.1038/nn.2527
Simmons, A. J., Park, R., Sterling, N. A., Jang, M. H., van Deursen, J. M. A., Yen, T. J., et al. (2019). Nearly complete deletion of BubR1 causes microcephaly through shortened mitosis and massive cell death. Hum. Mol. Genet. 28 (11), 1822–1836. doi:10.1093/hmg/ddz022
Soto, M., Raaijmakers, J. A., Bakker, B., Spierings, D. C. J., Lansdorp, P. M., Foijer, F., et al. (2017). P53 prohibits propagation of chromosome segregation errors that produce structural aneuploidies. Cell Rep. 19 (12), 2423–2431. doi:10.1016/j.celrep.2017.05.055
Sterling, N. A., Park, J. Y., Park, R., Cho, S. H., and Kim, S. (2023). An entosis-like process induces mitotic disruption in Pals1 microcephaly pathogenesis. Nat. Commun. 14 (1), 82. doi:10.1038/s41467-022-35719-y
Suijkerbuijk, S. J. E., van Osch, M. H. J., Bos, F. L., Hanks, S., Rahman, N., and Kops, G. J. P. L. (2010). Molecular causes for BUBR1 dysfunction in the human cancer predisposition syndrome mosaic variegated aneuploidy. Cancer Res. 70 (12), 4891–4900. doi:10.1158/0008-5472.CAN-09-4319
Suijkerbuijk, S. J. E., Vleugel, M., Teixeira, A., and Kops, G. J. P. L. (2012). Integration of kinase and phosphatase activities by BUBR1 ensures formation of stable kinetochore-microtubule attachments. Dev. Cell. 23 (4), 745–755. doi:10.1016/j.devcel.2012.09.005
Wang, J., Thomas, H. R., Li, Z., Yeo, N. C. F., Scott, H. E., Dang, N., et al. (2021). Puma, noxa, p53, and p63 differentially mediate stress pathway induced apoptosis. Cell Death Dis. 12, 659. doi:10.1038/s41419-021-03902-6
Weaver, R. L., Limzerwala, J. F., Naylor, R. M., Jeganathan, K. B., Baker, D. J., and van Deursen, J. M. (2016). BubR1 alterations that reinforce mitotic surveillance act against aneuploidy and cancer. eLife 5, e16620. doi:10.7554/eLife.16620
White, A. K., Baumgartner, M., Lee, M. F., Drake, K. D., Aquino, G. S., and Kanadia, R. N. (2021). Trp53 ablation fails to prevent microcephaly in mouse pallium with impaired minor intron splicing. Development 148 (20), dev199591. doi:10.1242/dev.199591
Wijshake, T., Malureana, L. A., Baker, D. J., Jeganathan, K. B., van de Sluis, B., and van Deursen, J. M. (2012). Reduced life- and healthspan in mice carrying a mono-allelic BubR1 MVA mutation. PLoS Genet. 8 (12), e1003138. doi:10.1371/journal.pgen.1003138
Woods, C. G., Bond, J., and Enard, W. (2005). Autosomal recessive primary microcephaly (mcph): A review of clinical, molecular, and evolutionary findings. Am. J. Hum. Genet. 76 (5), 717–728. doi:10.1086/429930
Yang, A. H., Kaushal, D., Rehen, S. K., Kriedt, K., Kingsbury, M. A., McConnell, M. J., et al. (2003). Chromosome segregation defects contribute to aneuploidy in normal neural progenitor cells. J. Neurosci. 23 (32), 10454–10462. doi:10.1523/JNEUROSCI.23-32-10454.2003
Yang, Z., Jun, H., Choi, C. I., Yoo, K. H., Cho, C. H., Hussaini, S. M. Q., et al. (2017). Age-related decline in BubR1 impairs adult hippocampal neurogenesis. Aging Cell 16 (3), 598–601. doi:10.1111/acel.12594
Keywords: BubR1, mitosis analysis, neural progenitor, p53, microcephaly, cortical development, DNA damage
Citation: Sterling NA, Terry BK, McDonnell JM and Kim S (2023) P53 independent pathogenic mechanisms contribute to BubR1 microcephaly. Front. Cell Dev. Biol. 11:1282182. doi: 10.3389/fcell.2023.1282182
Received: 23 August 2023; Accepted: 26 September 2023;
Published: 12 October 2023.
Edited by:
Donald T. Fox, Duke University, United StatesReviewed by:
Louis-Jan Pilaz, Sanford Research, United StatesTodd Schoborg, University of Wyoming, United States
Copyright © 2023 Sterling, Terry, McDonnell and Kim. This is an open-access article distributed under the terms of the Creative Commons Attribution License (CC BY). The use, distribution or reproduction in other forums is permitted, provided the original author(s) and the copyright owner(s) are credited and that the original publication in this journal is cited, in accordance with accepted academic practice. No use, distribution or reproduction is permitted which does not comply with these terms.
*Correspondence: Seonhee Kim, c2VvbmhlZS5raW1AdGVtcGxlLmVkdQ==
†These authors share first authorship