 Andrew Stephen Leach1,2Alice V. Llewellyn1,2Chao Xu2,3,4Chun Tan1,2
 Thomas M. M. Heenan1,2Alex Dimitrijevic1,2Karin Kleiner5Clare P. Grey2,3Dan J. L. Brett1,2Chiu C. Tang6
 Paul R. Shearing1,2
 Rhodri Jervis1,2*
- 1Electrochemical Innovation Lab, Department of Chemical Engineering, UCL, London, United Kingdom
- 2The Faraday Institution, Quad One, Harwell Science and Innovation Campus, Didcot, United Kingdom
- 3Department of Chemistry, University of Cambridge, Cambridge, United Kingdom
- 4School of Physical Science and Technology, ShanghaiTech University, Shanghai, China
- 5Münster Electrochemical Energy Technology (MEET), University of Münster (WWU), Muenster, Germany
- 6Diamond Light Source, Didcot, United Kingdom
Understanding the performance of commercially relevant cathode materials for lithium-ion (Li-ion) batteries is vital to realize the potential of high-capacity materials for automotive applications. Of particular interest is the spatial variation of crystallographic behavior across (what can be) highly inhomogeneous electrodes. In this work, a high-resolution X-ray diffraction technique was used to obtain operando transmission measurements of Li-ion pouch cells to measure the spatial variances in the cell during electrochemical cycling. Through spatially resolved investigations of the crystallographic structures, the distribution of states of charge has been elucidated. A larger portion of the charging is accounted for by the central parts, with the edges and corners delithiating to a lesser extent for a given average electrode voltage. The cells were cycled to different upper cutoff voltages (4.2 and 4.3 V vs. graphite) and C-rates (0.5, 1, and 3C) to study the effect on the structure of the NMC811 cathode. By combining this rapid data collection method with a detailed Rietveld refinement of degraded NMC811, the spatial dependence of the degradation caused by long-term cycling (900 cycles) has also been shown. The variance shown in the pristine measurements is exaggerated in the aged cells with the edges and corners offering an even lower percentage of the charge. Measurements collected at the very edge of the cell have also highlighted the importance of electrode alignment, with a misalignment of less than 0.5 mm leading to significantly reduced electrochemical activity in that area.
Introduction
The increasing desire to move from fossil fuel-powered internal combustion engines to electric vehicles is driving swift advancements in the performance of Li-ion batteries, which will lead to a more sustainable society (Tarascon and Armand, 2001; Blomgren, 2017). Ni-rich layered Li transition metal oxides [such as LiNi0.8Co0.15Al0.05O2 (NCA) and LiNixMnyCo(1−x−y)O2 (NMC, x ≥ 0.5)] are currently used as electric vehicle Li-ion battery cathode materials owing to their superior energy and power densities (Blomgren, 2017; Manthiram et al., 2017; Myung et al., 2017; Kim et al., 2018; Li et al., 2020). Among these, LiNi0.8Mn0.1Co0.1O2, or NMC811, is desirable because of its high specific capacity and the lower ethical impact due to its lower cobalt content (Kim et al., 2018).
Despite all of their benefits, NMC811 and other Ni-rich layered materials suffer from poor cycle life relative to their lower-Ni-content analogs (Ryu et al., 2018; Friedrich et al., 2019). The electrochemical performance and stability of NMCs are strongly coupled to the structural changes during cycling. Ni-rich cathode materials undergo a significant lattice collapse in the direction perpendicular to the transition metal oxide layers at high states of charge (during Li+ extraction), resulting in a highly strained lattice that can cause mechanical degradation, such as cracking (de Biasi et al., 2019; Estandarte et al., 2020; Heenan et al., 2020), as well as more significant electrolyte degradation due to the greater proportion of highly reactive Ni4+ at high states of charge (SoC) NMCs (Zhang et al., 2020). NMC811 has been shown to have a lower onset voltage for oxygen evolution from the lattice and more gas evolution at a lower voltage than other, lower Ni content, NMCs (Yu et al., 2018a). Operando synchrotron radiation is an effective tool to study the changes in the crystallographic structure during charge and discharge, and has recently shed some light on the possible origins of capacity fade in NMC cathodes with >80% Ni content (Llewellyn et al., 20202020). For example, a surface reconstruction has been observed with a rock-salt layer forming at the surface of particles, reducing the performance significantly; this has recently been proposed to “pin” the layers and cause a fatiguing behavior in the material upon aging (Xu et al., 2021). In this work, Xu et al. employed a “multi-phase” analysis of the X-ray diffraction (XRD) data to differentiate between, and quantify, “active,” “intermediate,” and “fatigued” phases of the NMC within aged samples when delithiated (Xu et al., 2021). Though “fictitious” or metastable phase separation in single-phase cathode materials (such as NMC and NCA) has been shown to arise during dynamic charging of pristine materials (Grenier et al., 2020) and, more recently, via an autocatalytic mechanism by Park et al. (2021), Xu et al. (2021) also show that a residual fatigued phase remains in cycled materials, even under infinitesimally slow cycling and, thus, that the existence of fatigued phases in aged NMC cannot be fully attributed to kinetic effects.
While the surface reconstruction of Ni-rich layered cathodes has been reported, no inhibiting phase transformations, such as O3 to O1 or to spinel and rock salt, have been observed in the bulk of these cathode materials (Li et al., 2018). Kleiner et al. observed multiple rhombohedral NCA phases with the same symmetry but with noticeably different lattice constants in a fatigued cathode electrode after extensive electrochemical aging, one of these rhombohedral phases being no longer electrochemically active and remaining nearly fully lithiated when the electrode is charged to high potentials (Kleiner et al., 2015). Schweidler et al. showed similar results in Ni-rich NMC, also observing the presence of a more lithiated phase at high SoCs, and the phase fraction of this lithiated phase increases as the battery ages (Schweidler et al., 2019). An example of spatial variation of the SoC of NMC333, via operando XRD, has been reported by Yu et al. (2018b). They showed that across a commercial pouch cell, there was approximately a 5% range in SoC when the overall SoC was 40%.
Here, synchrotron XRD (SXRD) has been employed to reveal the distribution of the state of charge and the fatigue of NMC811 cathodes within operating pouch cells prior to, and following, long-term electrochemical aging. Operando measurements were performed at a range of C-rates and upper cutoff voltages. The coexistence of regions with differing lithium content at the highest SoC has been shown and that these are not evenly distributed through the cell. A greater proportion of fatigued phase is seen at a higher C-rate.
Materials
Polycrystalline NMC811 and graphite electrodes were fabricated and prepared into cells and balanced for 4.2-V full-cell cycling. The NMC cathode consists of 90 wt% NMC811 (Targray), 5 wt% polyvinylidene difluoride (PVDF 5130) binder, and 5 wt% carbon black (Denka black uncompressed), and the graphite electrode is composed of 95 wt% graphite powder (PRC30 Morgan AM&T Hairong synthetic graphite), 2.5 wt% carbon black, 2.5 wt% carboxymethyl cellulose/styrene–butadiene rubber 50/50 binder. The mass loadings of the NMC811 and graphite active materials are 2.83 and 1.25 mg cm−2, respectively, which represents a negative-to-positive electrode capacity ratio of ∼1.14. The electrolyte used was 1 M LiPF6, ethylene carbonate/ethyl methyl carbonate 3/7 weight ratio, 2% vinylene carbonate (VC) additive. Celgard 2320 tri-layer was used as the separator material. The cells were prepared as 50 mAh single-layer pouch cells. The thickness of the cathode layer was 40 μm. The cell was clamped in place throughout the experiment and was not allowed to move within the holder.
Cell cycling
The cells were measured on the beamline after initial formation and after 900 cycles. The cells were aged at a rate of 0.5 C (based on the pristine cell capacity of 50 mAh) between 4.3 and 2.7 V at room temperature (20 ± 1°C) using a CCCV charging and CC discharging protocol. CCCV charging was composed of a CC (constant current) step followed by a CV (constant voltage) hold at the upper cutoff voltage 4.3 V, until the current dropped below 0.05 C. When the cells were measured operando, a range of C-rates were investigated (0.5, 1, and 3C, based on a capacity of 180 mAh g−1), all based on the pristine cell capacity. One cell was cycled in the same way with an upper cutoff voltage of 4.2 V; this cell failed during long-term cycling (due to a tab ripping from the cell before it reached 50 cycles) and, therefore, was not measured during the second beamtime investigating the effects of cell aging.
Characterization by SXRD
The high-resolution SXRD measurements were conducted on beamline I11 at Diamond Light using a wavelength of λ = 0.4933 Å (∼25 keV), the beam size at the sample was 200 × 200 μm. The beamline facility is specifically designed for long duration experiments with technical features given by Murray et al. (2017). Each pattern was collected with an exposure time of 20 s using a two-dimensional Pixium area detector. At the start of the beamtime, NIST Standard Reference Material CeO2 was measured to obtain the X-ray wavelength and detector distance. Each diffraction image was reduced to 1-D pattern (2-theta vs. intensity) on-the-fly using Dawn software (Filik et al., 2017). A bespoke PEEK cell holder was used, which allowed for SXRD measurements in nine positions of the cell via small holes (0.48-cm diameter) in the holder while maintaining compression, which is important for pouch cell cycling. The motorized xyz sample stage of the beamline was able to move the cell through the nine acquisition positions, while charging and discharging was conducted allowing for the continuous sequential measurements of all the positions (from position 1 to position 9, and starting the cycle again at position 1, Figure 1). For C-rates of C/2 and 1C, the measurements for each position were collected during the same charge discharge cycle, and data were collected every 5 min for each position. For the faster C-rate (3C), the cell was kept stationary (at the center of the cell, position 5) as there was a risk of information being lost between patterns with the lower time resolution; therefore, data were collected every 30 s, as the cell was not moving.
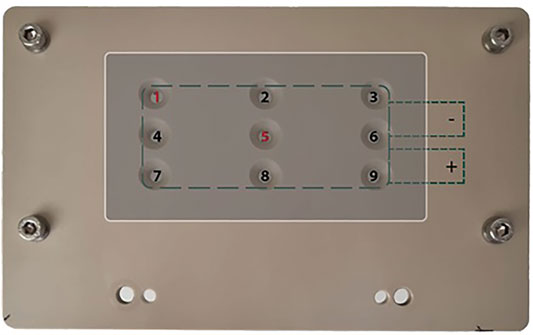
FIGURE 1. Image of the pouch cell holder showing the nine measurement positions as holes in the holder, and the location of the pouch cell (gray) and electrode (25 cm2) and tab positions (dashed lines). The electrode tabs exited the holder from slots on the back of the holder (not shown here). The X-ray beam in the direction perpendicular to the plane of the page. 1 and 5 are highlighted red as points of interest in the Results and discussion section.
Rietveld refinement of SXRD patterns from the NMC cathode materials was performed in GSAS-II software (Toby and Von Dreele, 2013) and based on the α-NaFeO2 structural model (
X-ray computed tomography
Micro X-ray-CT was performed using a Zeiss Xradia Versa 520 (Carl Zeiss XRM, Pleasanton, CA, USA) employing a tungsten anode with a characteristic peak of 58 keV (W-Kα), with a power of 7 W. Magnification was achieved using a cone-beam geometry with a ×4 optical magnification, which resulted in an approximate isotropic voxel length of 1.63 μm. Projections (1,061) were collected over a 180° rotation, which were reconstructed using commercial software (“Reconstructor Scout-and-Scan,” Carl Zeiss, CA, USA) employing filtered-back-projection (FBP) algorithms.
Results and discussion
Operando measurements were conducted on two identical cells at nine different spatial positions on each cell, which are shown in Figure 1 along with the tab positions for the current collectors. The first cell was taken to an upper cutoff voltage of 4.2 V, while the second was taken to 4.3 V. Both cells were cycled at a range of C-rates from 0.5 to 1C (nominal capacity of NCM811 was chosen to be 180 mAh g−1) on the beamline. The cell taken to 4.3 V was then cycled off the beam for 900 cycles at 0.5 C before further operando measurements in the beam, cycling at different C-rates between 0.1 and 1C as the cell exhibit significant capacity fade (3C was considered to short an experiment to get enough spectra).
Effect of upper cutoff voltage on the crystal structure of NMC811
At 0.5 C, in the center of the cell (position 5), the change in c-lattice parameter is reversible with most of the charging completed during the constant current stage. The change in c-lattice parameter in this position is similar to that reported in the literature and will be used as a representative example of the bulk electrode behavior in this study.
Figure 2A shows the 0.5 C charge–discharge curve for the cell charged to 4.2 V, which is typical of NMC811 full cells, and Figure 2B shows the whole SXRD pattern data collected for the center of the cell (position 5) cycled to 4.2 V. The 003 reflection, annotated in Figure 2B, is a very good proxy for the local state of charge as the c-lattice parameter shifts significantly through the charge (and discharge) process (Xu et al., 2021). There is a subtle elongation along this direction of the unit cell during initial delithiation, followed by a more significant collapse (starting from ∼70% SoC). This can be seen in Figure 3A with the steady shift of the peak from 5.95° to 5.85° 2θ before quickly extending to around 6.15° 2θ.
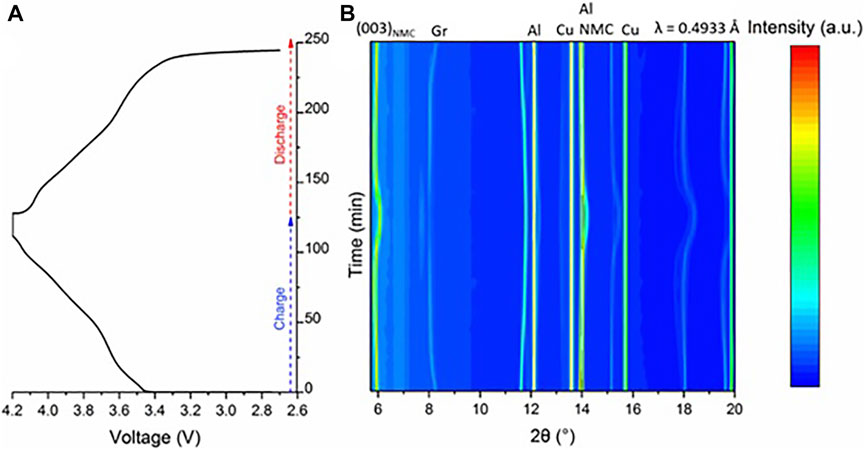
FIGURE 2. (A) Charge–discharge curve of the pristine cell, in the cell holder during operando measurement at a rate of 0.5 C followed by a constant voltage hold until the current was 0.05 C. (B) SXRD patterns for 2θ range of 5–20 for the charge–discharge show part (A) at Position 5, center of the cell as illustrated in Figure 1. The colors indicate x-ray intensity, with blue the lowest and red the highest.

FIGURE 3. Changes in the c-axis as a function of time for the nine points for (A) cutoff voltage of 4.2 V and (B) cutoff voltage of 4.3 V at a rate of 0.5 C. For cell 4.2 V, the discrepancies exist due to misalignment of the electrodes. (C) X-ray CT image of the pristine cell showing an overlap of the cathode on the cell cycled to 4.2 V at position 1. (D,E) The c-lattice parameter as a function of time during both charge and discharge, for the 4.2 and 4.3 V cells, respectively. Measurements at the same position in the cell are recorded at 5 min intervals (i.e., a full cycle of XRD measurements through the nine positions takes 5 min); therefore, not all positions are measured at exactly the same SoC. (F) The calculated a-lattice parameter as a function of charging and discharging for a rate of 0.5 C for the 4.3-V cell.
As expected, the cell with the higher upper cutoff voltage (4.3 V) undergoes additional collapse of the c-lattice compared with the cell with an upper cutoff voltage of 4.2 V, due to more extensive Li+ extraction in the former [Lc (4.2 V) = 13.89 Å; Lc (4.3 V) = 13.82 Å]; this is expected to exacerbate degradation due to additional stress placed on the material from more extensive changes in the crystallographic lattice.
Spatial variations in state-of-charge during cycling
Figure 3 shows the evolution of the 003 reflection as a function of time during a charge and discharge for both 4.2 V (a) and 4.3 V (b) cells; for all nine positions in the cells, the c-lattice parameter is also plotted (d and e). Measurements at the same position in the cell are recorded at 5 min intervals (i.e., a full cycle of SXRD measurements through the nine positions takes 5 min, a 0.5 C charge takes 2 h); therefore, not all positions are measured at exactly the same SoC. The most obvious observation is that for the cell cycled to 4.2 V, there are several positions that do not reach the same final c-lattice parameter and lag behind in lithiation extent during the whole cycle (even accounting for the small time constant in measurement during the cycling); these are positions 1, 2 and 3, all along the same top edge of the cell. This lack of activity is likely due to the electrodes being misaligned during manufacture of this cell; there is no observable anode diffraction for position 1 in the pattern and only small anode peaks in positions 2 and 3 (shown in Supplementary Figure S1).
The X-ray CT volume rendering of the edge of the cell stack (position 1), in Figure 3C, shows the extent of the misalignment of the electrodes in the 4.2-V cell where there is a ca. 300-µm overlap of the cathode along the top edge of the electrode (along points 1, 2, and 3). There is also an overlap of the anode down the side (along points 1, 4, and 7), although this is to be expected as anodes are often made slightly larger than the cathodes in order to avoid lithium plating. The area of the cell where the anode and cathode were misaligned shows significantly less change in the c-lattice parameter, and assuming this parameter is used as a proxy for SoC, it is not fully relithiated on discharge and does not return to the position at the start of the charge (Figure 3D).
Figure 3F shows the a-lattice parameter as a function of time, and this again agrees with previously published work (Märker et al., 2019). The continuous contraction of the lattice is explained by the transition metal oxidation state increasing, therefore, decreasing the TM-O bond length.
Figure 4 shows the maximum change in the c-lattice parameter (the difference between the largest and smallest value c-lattice parameter) for each of the nine positions in both cells. For the cell cycled to 4.2 V, as previously discussed, the positions along the top of the cell (see Figure 1) have the additional complication of misaligned electrodes, but there is still an observable trend across the rest of the cell. For both cells, the position closest to the positive tab (position 9) has the largest change (implying it delithiates to a greater extent than the bulk of the cell). The smallest change in c-lattice parameter is in position 1 for both cells (though there is an anomaly for the 4.2-V cell due to the misaligned electrodes), suggesting a gradient, which is highest nearest the positive tab and lowest in the opposite corner. As a result, there does appear to be a spatial dependence on the state of charge, with the areas of the electrode closest to the positive current collector having the largest shift in c-lattice parameter. This highlights the significance of the tab location within the cell. In this case, a relatively small prototype cell is being studied, but we expect this effect to be even more significant on larger format cells due to an increased effect from current collector resistance across larger format electrodes.

FIGURE 4. The maximum change in c-lattice value for the nine positions (Figure 1) for the two pristine cells cycled to 4.2 and 4.3 V. The color map highlights the areas which are delithiating to a greater or lesser extent (red and blue, respectively) than the central point in each respective cell, calculated as a percentage variation from the value of position 5 in each cell. The black color for positions 1 and 2 for the 4.2-V cell represents a change that is far lower than the central position and, thus, off the scale.
Effect of aging on rate capability of NMC811
As well as investigating the upper cutoff voltage, varied C-rates were also studied. Figure 5 shows the comparison of 0.5 and 1C for the cell cycled to 4.2 V, which has the misaligned electrodes. For the pristine cell, it was demonstrated earlier that there was a spatial variation in the state of charge within the cell during cycling at 0.5 C. However, on comparing the performance at the higher rate of 1 C, the overall change in c-lattice parameter is very similar for most of the points at both C-rates, even for the points with the misaligned electrode, which show less activity overall. It is important to note that more of the charging for the faster C-rate is carried out during the constant voltage step of the charging process due to higher overpotentials when running at a higher current (electrochemistry shown in Supplementary Figure S2). Unfortunately, this cell failed (tab connection issue) before the second beamtime, and therefore, the results of aging on the 4.3-V cell are discussed next.
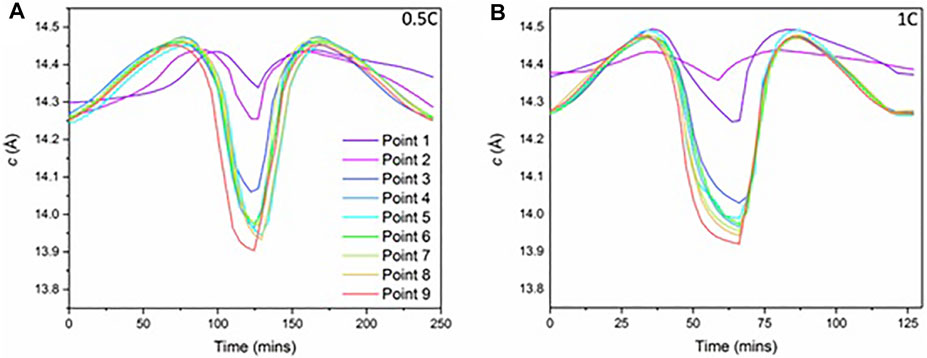
FIGURE 5. The c-parameter values as a function of time for each of the nine points for (A) 0.5 C and (B) 1 C. The cell was cycled to 4.2 V.
After cycling the cell 900 times at 0.5 C with a voltage window between 2.7 and 4.3 V, the capacity retention is approximately 55%–60% (Figure 6). The cell passed 80% capacity retention at around 200 cycles. As these experiments were conducted over a long period of time, and there were some periods of unavoidable laboratory shutdown, there are some step changes in performance on cycling. Nevertheless, the electrochemical cycling and calendar aging has clearly reduced the capacity of the cell.
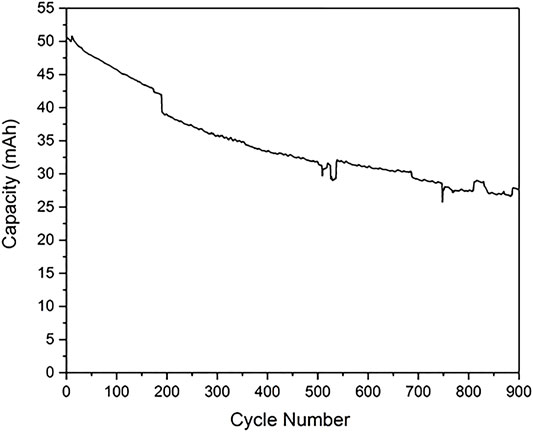
FIGURE 6. The capacity of a cell cycled between 2.7 and 4.3 V as a function of cycle number. These experiments were conducted over a long period of time, and there were some week-long periods of lab shutdown (notably just before 200 cycles), which lead to some step changes in performance.
To assess the effect of cell aging on the cathode materials, a “multi-phase” crystallographic analysis (Xu et al., 2021) was conducted, using operando SXRD data, in the 900th cycle for the cell cycled to 4.3 V, due to the significant NMC peak broadening caused by a range of SoCs (Figure 7 and Supplementary Figures S3–S21). There is a clear shoulder to the 003 reflection, which indicates the presence of more than one phase/state of lithiation at this point in the charge/discharge cycle (Figure 7B). Indeed, refining the pattern with a single phase (c-lattice parameter) does not give a good simulation to the data. Therefore, a three-phase refinement, using three values for the lattice parameter, is used to give an approximation of the relative ratio of fatigued material present in the measurements. While this refinement is still not perfect [Figure 7B, inset (red)], it is significantly better than a single-phase refinement, and previous work has clearly observed and quantified three-phases; therefore, the same analysis has been conducted (Xu et al., 2021). In the previous work of Xu et al., these phases are termed “fatigued,” “intermediate,” and “active,” depending on their extent of delithiation on cycling, and therefore c-lattice parameter, and in our work, the same approach and three-phase refinement of the data allows for a comparison of the relative ratio between active and fatigued phases present on aging of the cell, as well as the spatial variation in these values at different positions in the cell (Figure 1).
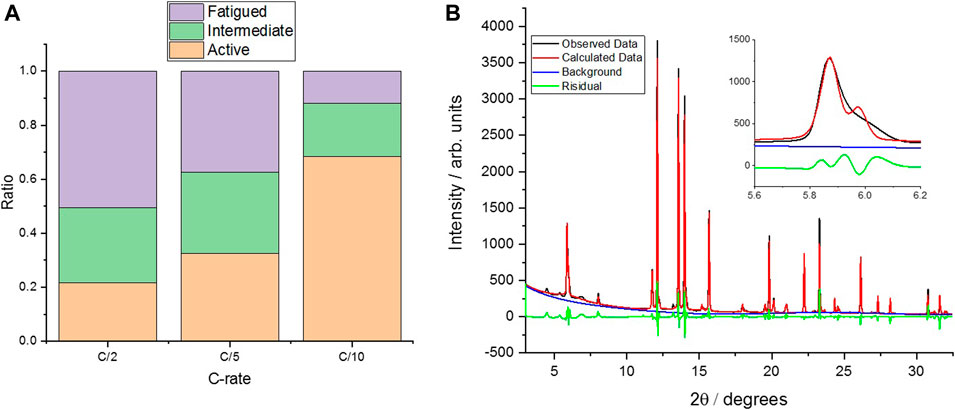
FIGURE 7. (A) The results of the “3-phase” analysis for three different C-rates, with all measurements at position 5. (B) The SXRD raw, calculated, and residual data for the 0.5 C measurement for position 5 at 4.3 V, with the inset showing the 003 reflection in more detail. Data Residual wR:11.1%. Plots for 0.2 and 0.1 C are shown in Supplementary Figures S3 and S4, respectively. All measurements were taken on the same cell after 900 cycles at 0.5 C (Figure 6).
There appears to be a significant rate dependence to the ratio of the “fatigued” (defined as structural degradation after repeating charge/discharge cycling) (Xu et al., 2021) and “active” phases in the aged material, whereby the slower the cell is charged, the more of the cathode material is fully delithiated (and therefore, the greater proportion of “active” phase is observed in the multiphase analysis), suggesting that there is a kinetic effect caused by the degradation. However, as can be seen in Figure 7A, there is still a residual inactive phase present even at low C-rates, indicating that there is a proportion of “non-kinetically fatigued” material in the aged cells that is incapable of delithiation beyond a certain extent, as observed by Xu et al. (2021) Figure 7B shows the observed data as well as the calculated fit, with the inset highlighting the 003 reflection in more detail. All SXRD patterns and refinements for the other points in the cell and C-rates are presented in the supporting information (Supplementary Figures S3–S21).
Analyzing the spatial variation in the makeup of the three phases across the area of the cell gives further insight into the inhomogeneities in material fatigue that can result from cycling, even in a relatively small format pouch cell. Figure 8 shows that the center of the cell (position 5) has the largest amount of the “active” phase, the positions on the edges of the cell (2, 4, 6, and 8) displaying a lower proportion of active phase, with the corners of the cell (positions 1, 3, 7, and 9) showing the greatest proportion of the “fatigued” phase. This aligns with the results from X. Yu et al. where the edges (and corners) were shown to lag behind when charging the pouch cells (Yu et al., 2018b). Comparing the ratios before and after the constant voltage (CV) hold also sheds some light on the nature of these phases, as in all cases, the “fatigued” phase decreases during this process, most significantly in the center of the cell. This indicates that there is still a kinetic component of the fatigued phase, as the material continues to delithiate during the voltage hold before relaxing to a state with a greater proportion of active phase than at the end of the constant current charging.

FIGURE 8. The ratios of the active, intermediate, and fatigued phases for each position at the start of the constant voltage (CV) hold and at the end of the CV section. The cell was cycled at C/10 (based on fresh capacity). SXRD raw, calculated, and residual data plots for these results are shown in Supplementary Figures S4–S21.
However, this relaxation is not complete and varies depending on the measurement position in the cell; the findings suggest that it is not completely attributable to increased impedance. The center of the cell shows some of the highest proportion of fatigued phase at the start of the CV hold, but close to the least by the end, suggesting this phase separation is possibly rate limited, and lower currents for longer periods of time can delithiate more of the cathode material than is possible in the initial CC stage of cycling. This agrees with the rate data shown in Figure 7A. However, for positions away from the center of the cell, the change after the CV hold is less pronounced, indicating that the material in this location has suffered more irreversible capacity loss, possibly via the mechanism of pinning from rocksalt layer formation described in the work of Xu et al. (2021). For these locations, it is likely that the contribution to the overall charge of the cell during the constant current (CC) charging is larger than for the center of the cell, before they reach the limit of their ability to extract lithium at some point during the CC step, meaning that the remaining charging of the cell during the CV hold is undertaken by the central locations of the cell (and hence, they show the greatest change in active:fatigued phase ratio before and after the CV step) (Xu et al., 2021). Such inhomogeneities in lithiation extent, and therefore effective local C-rate, in the cell during charge, will have implications for the material degradation on cycling, the result of which is evidenced in the accumulation of this effect after 900 cycles from the spatially resolved SXRD presented here.
Therefore, even for a relatively small pouch cell, the effect of tab position and electrode edges can have small but accumulating effects on the local degradation of cathodes, resulting in significantly varied levels of fatigue across the electrode area after extended cycling. For larger format cells or cylindrical cells (that might have a jellyroll electrode assembly of upward of 1-m long), this effect could be significantly exacerbated and have more severe consequences for cell degradation (Kok et al., 2019).
The results in Figure 8 can be compared with those in Figure 4B, which shows the relative extent of delithiation with location for the pristine cells. For the pristine cell, the position closest to the tab (position 9) exhibited the greatest extent of delithiation, and more so than the other corner positions. However, on cycle aging, though there is a large amount of fatigued phase present in position 9, the other corner positions (1, 3, and 7) also show a large proportion of fatigued material, both before and after the CV step. Therefore, these results suggest that the location of the material in the cell has a strong influence on the local electrochemistry and, therefore, the accumulative degradation of the material in that location on cycling. This local variation in degradation, even for a small format cell, is evident in the operando SXRD results and might not be possible to investigate with purely electrochemical methods (cycling) or lab-based diffraction; on cycle aging of the cell, the local variations in delithiation extent explored in this work have been shown to lead to overall capacity fade and inhomogeneous material fatigue in the cell.
Conclusion
In conclusion, via spatially resolved high-resolution XRD of single-layer pouch cells, we have investigated the local inhomogeneities in (de)lithiation of the cathode material of pristine and cycled cells at various C-rates. There was a significant impact from misaligned electrodes in one cell, highlighting the need to ensure that the anode overlaps the cathode and the importance of careful assembly of Li-ion batteries. The work has also shown that there is a relationship between the position in the pouch cell and the amount of delithiation. This relationship may well contribute to the lack of activity and increased percentage of “fatigued” cathode material that was observed after 900 cycles at the corners and the edges of the cell.
The extent of the “fatigued” phase was also shown to decrease during the constant voltage hold, where the current is lower, and also during lower C-rate cycling. It is concluded that the “fatigue” shown in the material has a kinetic component and may be limiting the rate at which the material can charge (i.e., the current). However, there is also a residual proportion of fatigued material remaining, even after the CV step, indicating that there is an overall reduction in the delithiation capability (and thus, total capacity of the cell). The results from the present work will have implications for larger format cells and cells cycled in more extreme conditions (rate, upper cutoff voltage or temperature) and show the importance of location within the cell on controlling spatially resolved degradation.
Data Availability Statement
The original contributions presented in the study are included in the article/Supplementary Material. Further inquiries can be directed to the corresponding author.
Author Contributions
ASL and RJ contributed to the conception and design of the study and writing of the manuscript. ASL, AVL, CT, TH, AD, and CX performed the experiments. ASL wrote the first draft of the manuscript. ASL, AVL, and CX helped perform the analysis with constructive discussions. All authors contributed to manuscript revision, read, and approved the submitted version. CG, DB, PS, and RJ provided supervision of the work.
Funding
This work was carried out with funding from the Faraday Institution (faraday.ac.uk; EP/S003053/1; grant numbers FIRG001, FIRG024 and FIRG028). The authors would like to acknowledge the Royal Academy of Engineering (CiET1718/59) for financial support.
Conflict of Interest
The authors declare that the research was conducted in the absence of any commercial or financial relationships that could be construed as a potential conflict of interest.
The handling editor declared a past co-authorship with the authors DB and PS.
Publisher’s Note
All claims expressed in this article are solely those of the authors and do not necessarily represent those of their affiliated organizations, or those of the publisher, the editors, and the reviewers. Any product that may be evaluated in this article, or claim that may be made by its manufacturer, is not guaranteed or endorsed by the publisher.
Acknowledgments
The authors acknowledge Diamond Light Source for the time on beamline I11 under proposals CY22498 and CY24122.
Supplementary Material
The Supplementary Material for this article can be found online at: https://www.frontiersin.org/articles/10.3389/fceng.2021.794194/full#supplementary-material.
References
Blomgren, G. E. (2017). The Development and Future of Lithium Ion Batteries. J. Electrochem. Soc. 164, A5019–A5025. doi:10.1149/2.0251701jes
Croguennec, L., Pouillerie, C., and Delmas, C. (2000). NiO[sub 2] Obtained by Electrochemical Lithium Deintercalation from Lithium Nickelate: Structural Modifications. J. Electrochem. Soc. 147, 1314. doi:10.1149/1.1393356
de Biasi, L., Schwarz, B., Brezesinski, T., Hartmann, P., Janek, J., and Ehrenberg, H. (2019). Chemical, Structural, and Electronic Aspects of Formation and Degradation Behavior on Different Length Scales of Ni‐Rich NCM and Li‐Rich HE‐NCM Cathode Materials in Li‐Ion Batteries. Adv. Mater. 31, 1900985. doi:10.1002/adma.201900985
Estandarte, A. K. C., Diao, J., Llewellyn, A. V., Jnawali, A., Heenan, T. M. M., Daemi, S. R., et al. (2020). Operando Bragg Coherent Diffraction Imaging of LiNi0.8Mn0.1Co0.1O2 Primary Particles within Commercially Printed NMC811 Electrode Sheets. ACS Nano 15, 1321–1330. doi:10.1021/acsnano.0c08575
Filik, J., Ashton, A. W., Chang, P. C. Y., Chater, P. A., Day, S. J., Drakopoulos, M., et al. (2017). Processing Two-Dimensional X-ray Diffraction and Small-Angle Scattering Data inDAWN 2. J. Appl. Cryst. 50, 959–966. doi:10.1107/s1600576717004708
Friedrich, F., Strehle, B., Freiberg, A. T. S., Kleiner, K., Day, S. J., Erk, C., et al. (2019). Editors' Choice-Capacity Fading Mechanisms of NCM-811 Cathodes in Lithium-Ion Batteries Studied by X-ray Diffraction and Other Diagnostics. J. Electrochem. Soc. 166, A3760–A3774. doi:10.1149/2.0821915jes
Grenier, A., Reeves, P. J., Liu, H., Seymour, I. D., Märker, K., Wiaderek, K. M., et al. (2020). Intrinsic Kinetic Limitations in Substituted Lithium-Layered Transition-Metal Oxide Electrodes. J. Am. Chem. Soc. 142, 7001–7011. doi:10.1021/jacs.9b13551
Heenan, T. M. M., Wade, A., Tan, C., Parker, J. E., Matras, D., Leach, A. S., et al. (2020). Identifying the Origins of Microstructural Defects Such as Cracking within Ni‐Rich NMC811 Cathode Particles for Lithium‐Ion Batteries. Adv. Energ. Mater. 10, 2002655. doi:10.1002/aenm.202002655
Kim, J., Lee, H., Cha, H., Yoon, M., Park, M., and Cho, J. (2018). Prospect and Reality of Ni-Rich Cathode for Commercialization. Adv. Energ. Mater. 8, 1702028. doi:10.1002/aenm.201702028
Kleiner, K., Dixon, D., Jakes, P., Melke, J., Yavuz, M., Roth, C., et al. (2015). Fatigue of LiNi0.8Co0.15Al0.05O2 in Commercial Li Ion Batteries. J. Power Sourc. 273, 70–82. doi:10.1016/j.jpowsour.2014.08.133
Kok, M. D. R., Robinson, J. B., Weaving, J. S., Jnawali, A., Pham, M., Iacoviello, F., et al. (2019). Virtual Unrolling of Spirally-Wound Lithium-Ion Cells for Correlative Degradation Studies and Predictive Fault Detection. Sust. Energ. Fuels 3, 2972–2976. doi:10.1039/c9se00500e
Li, W., Erickson, E. M., and Manthiram, A. (2020). High-nickel Layered Oxide Cathodes for Lithium-Based Automotive Batteries. Nat. Energ. 5, 26–34. doi:10.1038/s41560-019-0513-0
Li, W., Liu, X., Celio, H., Smith, P., Dolocan, A., Chi, M., et al. (2018). Mn versus Al in Layered Oxide Cathodes in Lithium‐Ion Batteries: A Comprehensive Evaluation on Long‐Term Cyclability. Adv. Energ. Mater. 8, 1703154. doi:10.1002/aenm.201703154
Llewellyn, A. V., Matruglio, A., Brett, D. J. L., Jervis, R., and Shearing, P. R. (2020). Using In-Situ Laboratory and Synchrotron-Based X-ray Diffraction for Lithium-Ion Batteries Characterization: A Review on Recent Developments. Condensed Matter 55, 7575. doi:10.3390/condmat5040075
Manthiram, A., Song, B., and Li, W. (2017). A Perspective on Nickel-Rich Layered Oxide Cathodes for Lithium-Ion Batteries. Energ. Storage Mater. 6, 125–139. doi:10.1016/j.ensm.2016.10.007
Märker, K., Reeves, P. J., Xu, C., Griffith, K. J., and Grey, C. P. (2019). Evolution of Structure and Lithium Dynamics in LiNi0.8Mn0.1Co0.1O2 (NMC811) Cathodes during Electrochemical Cycling. Chem. Mater. 31, 2545–2554. doi:10.1021/acs.chemmater.9b00140
Murray, C. A., Potter, J., Day, S. J., Baker, A. R., Thompson, S. P., Kelly, J., et al. (2017). New Synchrotron Powder Diffraction Facility for Long-Duration Experiments. J. Appl. Cryst. 50, 172–183. doi:10.1107/s1600576716019750
Myung, S.-T., Maglia, F., Park, K.-J., Yoon, C. S., Lamp, P., Kim, S.-J., et al. (2017). Nickel-Rich Layered Cathode Materials for Automotive Lithium-Ion Batteries: Achievements and Perspectives. ACS Energ. Lett. 2, 196–223. doi:10.1021/acsenergylett.6b00594
Park, J., Zhao, H., Kang, S. D., Lim, K., Chen, C.-C., Yu, Y.-S., et al. (2021). Fictitious Phase Separation in Li Layered Oxides Driven by Electro-Autocatalysis. Nat. Mater. 20, 991–999. doi:10.1038/s41563-021-00936-1
Ryu, H.-H., Park, K.-J., Yoon, C. S., and Sun, Y.-K. (2018). Capacity Fading of Ni-Rich Li[NixCoyMn1-X-y]O2 (0.6 ≤ X ≤ 0.95) Cathodes for High-Energy-Density Lithium-Ion Batteries: Bulk or Surface Degradation? Chem. Mater. 30, 1155–1163. doi:10.1021/acs.chemmater.7b05269
Schweidler, S., De Biasi, L., Garcia, G., Mazilkin, A., Hartmann, P., Brezesinski, T., et al. (2019). Investigation into Mechanical Degradation and Fatigue of High-Ni NCM Cathode Material: A Long-Term Cycling Study of Full Cells. ACS Appl. Energ. Mater. 2, 7375–7384. doi:10.1021/acsaem.9b01354
Tarascon, J.-M., and Armand, M. (2001). Issues and Challenges Facing Rechargeable Lithium Batteries. Nature 414, 359–367. doi:10.1038/35104644
Toby, B. H., and Von Dreele, R. B. (2013). GSAS-II: the Genesis of a Modern Open-Source All Purpose Crystallography Software Package. J. Appl. Cryst. 46, 544–549. doi:10.1107/s0021889813003531
Xu, C., Märker, K., Lee, J., Mahadevegowda, A., Reeves, P. J., Day, S. J., et al. (2021). Bulk Fatigue Induced by Surface Reconstruction in Layered Ni-Rich Cathodes for Li-ion Batteries. Nat. Mater. 20, 84–92.
Yu, X., Feng, Z., Ren, Y., Henn, D., Wu, Z., An, K., et al. (2018). Simultaneous Operando Measurements of the Local Temperature, State of Charge, and Strain inside a Commercial Lithium-Ion Battery Pouch Cell. J. Electrochem. Soc. 165, A1578–A1585. doi:10.1149/2.1251807jes
Yu, Y., Karayaylali, P., Katayama, Y., Giordano, L., Gauthier, M., Maglia, F., et al. (2018). Coupled LiPF6 Decomposition and Carbonate Dehydrogenation Enhanced by Highly Covalent Metal Oxides in High-Energy Li-Ion Batteries. J. Phys. Chem. C. 122, 27368–27382. doi:10.1021/acs.jpcc.8b07848
Zhang, Y., Katayama, Y., Tatara, R., Giordano, L., Yu, Y., Fraggedakis, D., et al. (2020). Revealing Electrolyte Oxidation via Carbonate Dehydrogenation on Ni-Based Oxides in Li-Ion Batteries by In Situ Fourier Transform Infrared Spectroscopy. Energy Environ. Sci. 13, 183–199. doi:10.1039/c9ee02543j
Keywords: NMC811, Li-ion batteries, operando XRD, SXRD, operando electrochemistry, operando spectroelectrochemistry, battery degeneration
Citation: Leach AS, Llewellyn AV, Xu C, Tan C, Heenan TMM, Dimitrijevic A, Kleiner K, Grey CP, Brett DJL, Tang CC, Shearing PR and Jervis R (2022) Spatially Resolved Operando Synchrotron-Based X-Ray Diffraction Measurements of Ni-Rich Cathodes for Li-Ion Batteries. Front. Chem. Eng. 3:794194. doi: 10.3389/fceng.2021.794194
Received: 13 October 2021; Accepted: 22 November 2021;
Published: 14 January 2022.
Edited by:
Alexander Roberts, Coventry University, United KingdomReviewed by:
Matteo Bianchini, University of Bayreuth, GermanyWei Kong Pang, University of Wollongong, Australia
Copyright © 2022 Leach, Llewellyn, Xu, Tan, Heenan, Dimitrijevic, Kleiner, Grey, Brett, Tang, Shearing and Jervis. This is an open-access article distributed under the terms of the Creative Commons Attribution License (CC BY). The use, distribution or reproduction in other forums is permitted, provided the original author(s) and the copyright owner(s) are credited and that the original publication in this journal is cited, in accordance with accepted academic practice. No use, distribution or reproduction is permitted which does not comply with these terms.
*Correspondence: Rhodri Jervis, cmhvZHJpLmplcnZpc0B1Y2wuYWMudWs=