 Willem A. Landman
 Emma R. M. Archer
 Mark A. Tadross
- 1Department of Geography, Geoinformatics and Meteorology, University of Pretoria, Pretoria, South Africa
- 2International Research Institute for Climate and Society, The Earth Institute of Columbia University, New York, NY, United States
- 3Climate Systems Analysis Group, University of Cape Town, Cape Town, South Africa
Seasonal-to-interannual variations of rainfall over southern Africa, key to predicting extreme climatic events, are predictable over certain regions and during specific periods of the year. This predictability had been established by testing seasonal forecasts from models of varying complexity against official station rainfall records typically managed by weather services, as well as against gridded data sets compiled through a range of efforts. Members of the general public, including farmers, additionally have extended records of rainfall data, often as daily values spanning several decades, which are recorded and updated regularly at their farms and properties. In this paper, we show how seasonal forecast modelers may use site recorded farm rainfall records for the development of skillful forecast systems specific to the farm. Although the uptake of seasonal forecasts in areas with modest predictability such as southern Africa may be challenging, we will show that there is potential for financial gain and improved disaster risk farm management by co-developing with farmers forecast systems based on a combination of state-of-the-art climate models and farm rainfall data. This study investigates the predictability of seasonal rainfall extremes at five commercial farms in southern Africa, four of which are in the austral summer rainfall areas, while one is located in the winter rainfall area of the southwestern Cape. We furthermore calculate a measure of cumulative profits at each farm, assuming a “fair odds” return on investments made according to forecast probabilities. The farmers are presented with hindcasts (re-forecasts) at their farms, and potential financial implications if the hindcasts were used in decision-making. They subsequently described how they would use forecasts for their farm, based on their own data.
Introduction
Seasonal forecast model development has a long history in South Africa (Landman, 2014). During this time, the seasonal forecast community in South Africa has developed complex climate models for operational seasonal forecasting (Beraki et al., 2014). The coupling of atmospheric climate models to models for the ocean, the land surface and sea ice, has led to improved seasonal forecasts, also for South Africa (Landman et al., 2012). Notwithstanding the proven accuracies of seasonal climate forecast models, statistical correction methods are recommended even for today's coupled climate model forecasts (Barnston and Tippett, 2017). Such statistical correction has had a long track record in terms of testing predictability over southern African countries including South Africa and Namibia (e.g., Bartman et al., 2003; Landman and Goddard, 2005), where local climatic mechanisms effecting seasonal-to-interannual variations over these countries have been studied comprehensively (e.g., Tadross et al., 2005; Hansingo and Reason, 2009; Reason and Smart, 2015). Statistical correction still forms part of the seasonal forecast systems developed at certain institutions for operational forecasting in South Africa, including the South African Weather Service and the University of Pretoria (UP). In addition to statistical corrections of global models forecast output, hindcasts (or re-forecasts) over multiple decades have also been used in the development of application models for agriculture in southern Africa (Malherbe et al., 2014), hydrology (Muchuru et al., 2016) and health (Landman et al., 2020), among others. In this study, we seek to use rainfall data provided by farmers to create and test seasonal forecast models specific to their farms, and to learn from them how such forecasts, including those relevant to climatic extremes, might impact on their farming decisions. Such a process of co-learning between forecast modelers and forecast users may help improve on seasonal forecasts tailored for commercial farm management, and, thus, potentially improve forecast uptake—a challenging aspect in southern Africa, where seasonal forecasting skill ranks modestly with other regions globally (Landman et al., 2019).
Farmers were invited to engage with the seasonal forecast bulletins of UP, during forecast presentations at farmers meetings, and during radio interviews, to make their rainfall records available for this kind of forecast system development and testing. There has, thus far, been a positive response, with more than 20 farmers providing their data, including dry-land end-of-season yield data at a small number of farms. In this paper, we have selected a small number of farmers who also indicated that they would be willing to respond to questions regarding use of forecasts in their farming decision-making. In addition to their willingness to participate, a further factor was that seasonal rainfall at the farm had, to some extent, to be predictable. Such use of citizen observations has already been proven useful in operational weather prediction (Nipen et al., 2020).
Data and Methodology
Data
Global climate model prediction output, in particular 3-month total rainfall fields, of the North American Multi-Model Ensemble (NMME; Kirtman et al., 2014) experiment are used as predictors for the forecast models developed for each farm. Here we use only the hindcasts from the GFDL-CM2p5-FLOR-B01 (referred to here as “GFDL”) since this model has been shown to outperform other NMME models over southern Africa (Landman et al., 2019). This model data set is available from March 1980 to present, for 12 ensemble members and for 11 lead-time months. We only use hindcasts made at a 1-month lead-time. Further, only restricted areas of the GFDL output are used and include 35°-15° South, 15°-35° East (for the three South African farms in the summer rainfall region); 40°-15° South, 0°-50° East (for the Namibia farm), and 45°-20° South, 0°-40° East (for the farm in the winter rainfall region).
The rainfall data included in the study was made available from five farmers—respectively located in the southwestern Cape (winter rainfall), three farmers in the central and northwestern interiors of South Africa (mid-summer rainfall), and northern Namibia (late summer rainfall). Although the rainfall records of the farms do not all start on the same year, they are all up to date for the rainfall totals recorded up to the end of the 2019/20 summer rainfall season.
Hindcast Method
The GFDL rainfall fields as specified over the domains above are considered for the development of statistically-based rainfall models for each farm. These rainfall models are produced by statistically downscaling the climate model's seasonal rainfall fields to concurrent seasonal rainfall totals at the farms. The canonical correlation analysis option of the Climate Predictability Tool (CPT; Mason and Tippett, 2016) is used in the development of the statistical models. Only 1-month lead-times are considered, and so typical configurations of the rainfall models is designed as follows: Predicting JFM rainfall totals, the GFDL was initialized in December for a JFM rainfall hindcast set downscaled to JFM rainfall totals at the farm.
The hindcast skill levels of the five rainfall models are tested using a cross-validation setup, with a 5-year-out window. It is important to note that the farms' rainfall data were first transformed into an approximate normal distribution before downscaling. The hindcast and observed data at each farm are subsequently normalized in order to produce rainfall indices as opposed to rainfall totals. Figures 1–5 show the respective hindcasts vs. observed time series for each farm. We only show Pearson correlation values between cross-validated hindcasts and observed time series on these figures in order to represent the deterministic skill levels of the rainfall models. Each statistical rainfall model is then used to retro-actively produce forecast for the most recent years of the available farm data, ranging from 9 to 20 years. The retro-active forecast process is able to create probabilistic rainfall forecasts (Landman et al., 2012) for each farm for three categories with thresholds defined by respectively the 25th (low rainfall indices) and 75th (high rainfall indices) percentile values of the climatological record. These thresholds define extremely above- and extremely below-normal rainfall categories, in terms of extreme events.
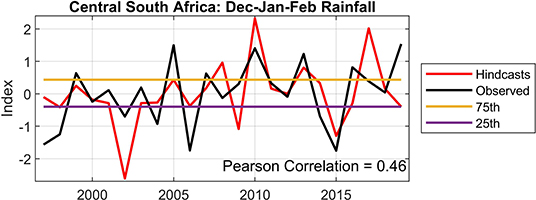
Figure 1. Cross-validated hindcasts (red) vs. observations (black) for the Dec-Jan-Feb rainfall season of the farm located in the central interior of South Africa. The two horizontal lines respectively represent the 25th percentile value (purple) and the 75th percentile value (orange) of the climatological record. The Pearson correlation value between hindcast and observed is significant at the 98.6% level of confidence.
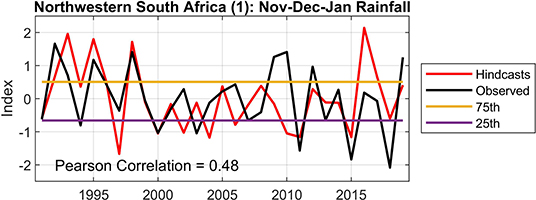
Figure 2. As for Figure 1, but for the Nov-Dec-Jan rainfall of the first farm located in the northwestern interior of South Africa. The correlation value's level of confidence is at the 99.8% level.
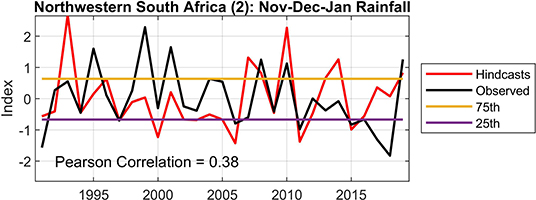
Figure 3. As for Figure 1, but for the Nov-Dec-Jan rainfall of the second farm located in the northwestern interior of South Africa. The correlation value's level of confidence is at the 99.7% level.
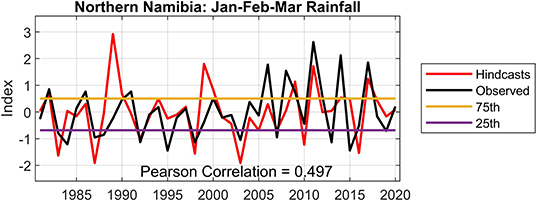
Figure 4. As for Figure 1, but for the Jan-Feb-Mar rainfall of the farm located in the northern interior of Namibia. The correlation value's level of confidence is at the 99.99% level.
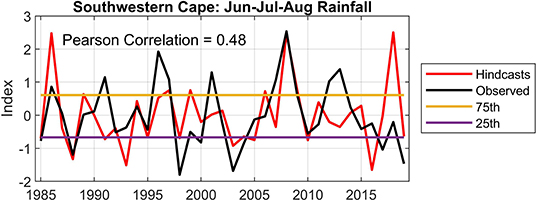
Figure 5. As for Figure 1, but for Jun-Jul-Aug rainfall at the farm located in the southwestern Cape of South Africa. The correlation value's level of confidence is at the 99.4% level.
The potential economic value of the five retro-active rainfall forecasts are subsequently assessed (Hagedorn and Smith, 2009). For this purpose, we make use of the cumulative profit (CP) values generated by the CPT software (see Mason (2018) for a comprehensive explanation on the calculation of the CP values). Because farming, naturally, has cost implications, it may, potentially, be of value to a farmer to consider the potential economic value of seasonal rainfall forecasts made for the farm. Cumulative profit values evaluate probabilistic forecasts (for example, 60% chance of above-, 30% of near- and 10% chance of below-normal rainfall) by means of quantifying the skill of the forecast based on its effective return. Here, we calculate the cumulative profit values over a number of probabilistic forecasts based on an arbitrary ZAR100 investment in the first year. The return on investment is calculated based on “fair odds” and assuming that the ZAR100 is spread across the forecast categories in proportion to the forecast probabilities. This means that for the observed category (above, below or normal), the farmer realizes effectively triple the investment in that category each year. The results shown on the cumulative profit figures (Figures 6–10) can be interpreted as follows: for example, the cumulative profit value of, say, 10 found for a specific year later on means that the initial investment of ZAR100 in the first year would be worth ZAR(100 × 10 =) ZAR 1,000 in that specific year. One would (in this case study) subsequently invest, theoretically, all ZAR1000 based on the next year's forecast, and so forth. Skilful forecasts are associated with an increase in profits, while poorer performing forecasts are associated with a decrease in profits. This high skill—high profits relationship was clearly demonstrated in a study on the seasonal rainfall and inflows predictability for the Lake Kariba catchment which is located over central southern Africa (Muchuru et al., 2014, 2016).
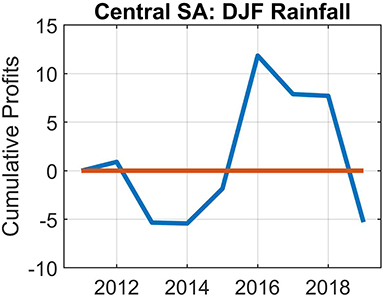
Figure 6. Cumulative profits graph based on 9-years of probabilistic Dec-Jan-Feb rainfall forecasts for the farm located in the central interior of South Africa, to communicate the monetary value of probabilistic forecasts. The higher the amount of capital placed on a forecast that is correct, the higher the profit or return will be.
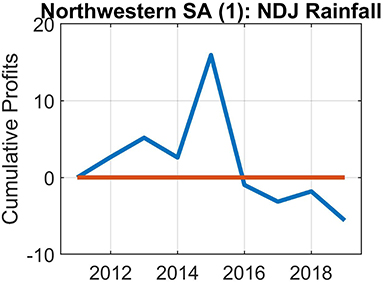
Figure 7. As for Figure 6, but for Nov-Dec-Jan rainfall forecasts for the first farm located in the northwestern interior of South Africa.
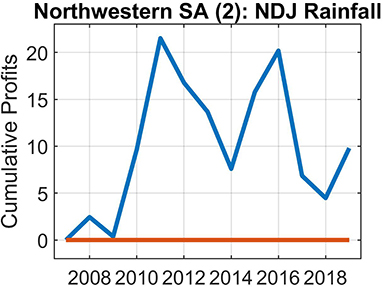
Figure 8. As for Figure 6, but for 13-years and for Nov-Dec-Jan rainfall forecasts for the second farm located in the northwestern interior of South Africa.
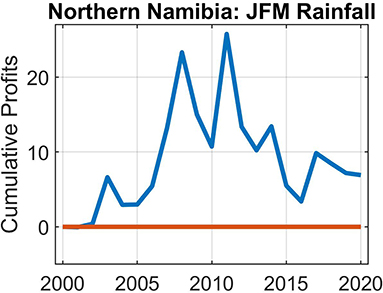
Figure 9. As for Figure 6, but for 20-years and for Jan-Feb-Mar rainfall forecasts for the farm located in the northern interior of Namibia.
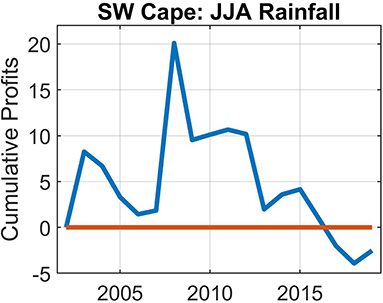
Figure 10. As for Figure 6, but for 18-years and for Jun-Jul-Aug rainfall forecasts for the farm located in the southwestern Cape of South Africa.
Questions to Farmers
Formulating precise questions without a proper understanding of the farms (and how they are managed) is, it should be noted, not the objective of this study. In fact, we have set out here to show that in using rainfall data provided by the farmer, skillful forecast models, albeit only at a 1-month lead-time (although we argue that this may still have utility), can be developed for the farm. We propose further that this development may be able to inspire and support interest by the farmer to engage in a co-learning process with climate modelers, in order to eventually improve forecast development, usability, uptake and constructive use. To this end, the following questions, along with the specific farm's hindcasts (Figures 1–5) and cumulative profits graphs (Figures 6–10), were given to the farmer:
1. What decision might you make based on the forecasts presented to you?
2. Do the forecasts and what turned out to be the case have to be close together for a farming decision based on the forecast to be effective?
3. What percentage of farm expenditure or profit will be enhanced if the decision based on the forecast was correct?
4. Do you tend to trust the forecasts more or less so because data from your farm was used to produce the forecasts?
5. Do you want any improvements in the forecasts provided?
6. What is the ideal lead-time (in months) the forecasts should be provided before the onset of the rainy season to help you to better prepare and make farming decisions?
Results
Deterministic Hindcasts
The selection of the five farms from the more than 20 farmers who responded to the call to make their rainfall data available is of course, fairly limited. However, we wanted to use rainfall data that are not only restricted to the summer rainfall regions of South Africa, where predictability studies have been conducted for a number of decades already (see references in Landman, 2014). We are therefore grateful that a farmer from the southwestern Cape has made data available for this study in a region that has only recently been shown to have some level of forecast skill (Archer et al., 2019). Further, the Grootfontein area of Namibia has a small number of farmers that have over recent years been actively engaging with seasonal forecast modelers in South Africa. As a result, including that area was considered likely to prove useful. Moreover, as stated earlier, we are only presenting the forecasts for farms where we have found predictability to be present. Finally, farm data has been collected, but has neither been analyzed nor used in the development of forecast models yet for some farms, owing to the fact that we only recently received the data.
We begin our presentation of the seasonal rainfall predictions by considering hindcasts for the three farms in the summer rainfall region of South Africa, located respectively in the central and north-western interior (two) regions of South Africa. Figure 1 shows the results for the central interior, and Figures 2, 3 for the north-western interior. Similar skill levels are found for the three farms, but the seasonal-to-interannual variation of both the observed and hindcast data differ. Notwithstanding, rainfall hindcasts during the strong El Niño events of 1997/98 and 2015/16 tend to show negative anomalies, although the outcome was not as severe for the 1997/98 season. The ENSO-neutral year of 2019/20 is associated with high rainfall totals for these three farms, even though the hindcast for that year does not always pick up on the high rainfall outcomes. The 2019/20 example may yet be another reminder of the major challenges faced in developing good forecasts for South Africa, when we are in an ENSO-neutral season (Landman and Beraki, 2012), notwithstanding the possible presence of climate factors in addition to ENSO that also have been found to be associated with southern African rainfall. These include sea-surface temperature of the Indian and Atlantic Ocean (Mason, 1995), dipole modes in the Indian Ocean (Reason, 2001; Washington and Preston, 2006; Hoell et al., 2017) and the Madden-Julian Oscillation (Pohl et al., 2009). The important effect of specific boundary forcing (e.g., ENSO) on the seasonal prediction skill for a given year remains an important consideration in seasonal forecasting (Hoell and Eischeid, 2019).
Figure 4 shows the hindcast results for the farm site in northern Namibia. This area is associated with good forecast skill during ENSO years (Landman and Beraki, 2012), and it is thus likely that the phase of ENSO is largely responsible for the relatively good level of skill found for the farm there. A variety of farming activities are found in that part of Namibia, including cattle and maize (as well as wildlife management in different forms, in certain areas).
The southwestern Cape farm is also associated with significant predictability (Figure 5), but the rainfall model did not perform skilfully during the more recent years of the test period, especially for the 2018 season when the hindcast shows a large positive anomaly during a period when the southwestern Cape was facing significant water use challenges owing to prolonged droughts (Otto et al., 2018).
Potential Economic Value of the Hindcasts
Figures 6–10 show the cumulative profit values for the five farms over varying test periods. We arbitrarily selected the lengths of these periods on condition that the most recent years are included in the analysis. These figures show the economic value of skillful forecasts—but also what may happen with accumulated profits, when there is a sequence of poorly performing forecasts. Except for one of the South African farms and the Namibian farm, the accumulated profits become negative at the end of the forecast period.
The results of this economic value analysis shows that much more work has to be done in the investigation of the financial viability of introducing seasonal forecasts in decision-making in agriculture in southern Africa. This is not surprising as we have used an idealized calculation here to illustrate the method, whereas in the real world cumulative profits would depend on input costs and the price the crop is sold for, all of which vary from year to year. In a real sense, we are very early in the process of truly working with the agricultural sector in southern Africa in a way that truly captures iterative and longstanding processes of co-learning.
Response From Farmers
Our discussion on the farmer's responses start with the farm in northern Namibia, as forecast skill and economic profit are found to be highest for this farm of the five farms considered, and the response from the farmer has been comprehensive and positive. It is important to note that forecasts in real-time produced by UP for this particular farm have been provided to the farmer since 2018. Owing to this already existing relationship between the farmer and the forecast producer, it may be expected to find a more positive response from the farmer. In fact, the farmer states that the UP seasonal forecasts do influence farming decisions, and that the forecast service provided to the farmer is such that in future the farmer will consider to only use UP forecasts for farming decision-making—including, for example, decisions as how many hectares to stock or destock with cattle. Notwithstanding the recent good forecasts provided to the farmer, the farmer will continue to require that forecasts for future seasons capture the amplitude of the anomalous dry or wet season, due to high risks and profitability, and the unavailability of maize insurance in Namibia. When asked about percentage farm expenditure or profitmaking, the farmer stated that cattle profit or loss is about 40% of the farming, maize is also about 40%—while the rest is barbeque wood or charcoal produced from invader bush. Because cattle and maize both rely on seasonal climate, the farmer claims that seasonal forecasts play a significant role in profit or loss planning for the farm. In addition, the farmer states that profits can increase by at least a further 10% in a favorable rainy season which is predicted in advance, whereas in dry seasons, the farmer has to focus primarily on wood and charcoal. In reply to the question if forecasts that use data from the farm increase trust in forecasts, the farmer claims that the forecasts produced this way, especially for the 2020 summer season of high spatial variability, provided unprecedented guidance on expected rainfall outcomes. The farmer was happy to have used the UP forecasts for the past season regarding the planting of maize on the farm. However, the farmer would like to also see forecasts from neighboring farms (within a 20–50 km radius)—hopefully, thus, more farmers from the region will join the UP initiative. In addition to having more forecasts for the region, the farmer also require forecasts at multiple month lead-times—for instance, as maize farmer planning has to start as early as August for the first half of summer (Oct-Nov-Dec) as well as for the main rainfall season of Jan-Feb-Mar. As a cattle farmer, forecasts at such lead-times should also be able to advise on whether or not to sell cattle early in the season, or, if the farmer can delay the sale of existing cattle until February (the price per head picks up again in November after an initial drop).
The responses from the three farmers in the summer rainfall region are less comprehensive, but still valuable. The first farmer in the northwestern interior (see Figures 2, 7) states that seasonal forecasts may influence his decisions on which crops to consider planting for a coming season, and also decisions relating to planting dates of the crops. Furthermore, seasonal forecasts should be able to help provide a holistic view on expenditure; for example the purchasing of farming equipment and fertilizer. However, forecasts need to be skillful and such forecasts may contribute to as much as 30% of the profit, according to the farmer. The farmer is also convinced that the inclusion of his own data in the development of a seasonal rainfall forecast model for his farm has made forecast more trustworthy as compared to forecasts available from other sources. The farmer would also, however, like to see his data being used to make forecasts for individual calendar months to supplement the seasonal forecasts, and that lead-times are extended to make forecasts for the coming summer rainfall season as early as July or August.
The second farmer in the northwestern interior (Figures 3, 8) seems to be most interested in the forecasts when the forecasts favor an anomalously wet season. During such seasons the farmer will apply more fertilizer than would be the case for even “normal” years, and as a result boost production. As was stated by the first northwest farmer, forecasts need to be skillful before their potential can be fully realized. In fact, the second farmer would like to see more years of the test period as skillfully predicted as the years from 2005 to 2012 (Figure 3) since skillful forecasts can increase profits by as much as 25%. The farmer does not, however, have a lot of confidence in the current forecast model for his farm, notwithstanding the incorporation of his rainfall data in the model (in which he is confident they have been accurately recorded). Effectively, before the farmer would invest in such forecasts for his farm, he requires a significant improvement in forecast performance. On a positive note, he requires forecast lead-times of only a month or two, so an improved forecast system does not additionally have to cater for long lead-times.
The farmer in the central interior of South Africa stopped farming actively on his farm about 2 years ago, after selling more than 70% of his land. Although he still resides on the remaining land, he has since become a commodity trader. In spite of this development, his view on the utility of seasonal forecasts may still be of some use. In fact, he claims that as a speculator, he does consider seasonal forecasts to a limited extent, and that skillful forecasts may be able to make his business about 10% more profitable. However, he is of the opinion that the inclusion of his own data in the development of a forecast model for his farm has not necessarily made the forecasts for his farm more trustworthy. If the forecasts can improve, however, he would like to receive forecasts for the whole year and not just for the main 3-month rainfall season, and that these forecasts are issued at lead-times ranging from 4 to 6 months.
The farmer from the southwestern Cape believes that a number of farming decisions will be positively influenced by good and reliable seasonal forecasts. Even decisions as (in his view) mundane as how much effort must be spent to prepare the dirt roads for the winter months will benefit from skillful forecasts. Perhaps more importantly, decisions on those areas in which to plant crops in that year can benefit the most. However, from the hindcast graph provided to the farmer, the forecasts made for those years from 2010 are not very useful. These poor forecasts over the most recent years reduced the confidence the farmer may have in forecasts for coming seasons. Poor forecasts are especially problematic if the forecast is for a wet season and it turns out to be dry. Moreover, when the forecast indicated a wet season (in the above-normal category) then the outcome should at least be above the climatological average. Although there seems to be a lack of confidence in seasonal forecasts for that region, the farmer does state that there is a tendency to have increased faith in forecast models that include rainfall data from the farm.
When asked what percentage of farm expenditure or profit might be enhanced if the decision based on the forecast were correct, it was clear that the Cape farmer has not really considered this aspect thus far in farming operations. This may be the result of the general lack of available seasonal forecasts for South Africa's winter rainfall region. The farmer's previous experience with forecasts available online is that they generally do not give a clear direction in which the coming rainfall season was headed. Notwithstanding, the farmer states that more accurate seasonal forecasts will definitely have a positive effect on profit, but such an effort is currently difficult to quantify. Accurate forecasts would be especially beneficial if they can give guidance on particular months, not only on 3-month seasons. For example, if the forecast shows an enhanced likelihood of a dry winter, guidance on which single month has the biggest chance of receiving some rain will enable farmers to plant just before or after most of the rainfall has been received. Skillful forecasts, as was the case for the farmers in the summer rainfall areas, need to be made at several months lead-time in order to be most beneficial for decision-making. The farmer states that a 6-month lead-time would be preferred even if the forecast only provides a general direction—for example, if the consensus is for a wet or for a dry winter season. A more detailed forecast will be helpful 3 months before the winter season, including which single month is most likely to be wet. This information will allow for significantly improved planning for planting, especially if the forecasts also include the expected dominating wind direction.
Summary and Conclusions
Statistical post-processing is required to improve on seasonal forecasts from global models (Barnston and Tippett, 2017). In addition to corrections of model biases and adjusting the variances of model output fields, statistical models can also be developed to relate global climate model output to commodities such as dry-land crop yields. Recently, such a procedure was used to develop statistical seasonal forecast models for malaria occurrence over the Limpopo province of South Africa (Landman et al., 2020). The malaria modeling was proven successful, not only as a consequence of the skilful models developed, but also as a result of the engagement between modelers and health practitioners in the region during the development stage of the models and the subsequent high uptake of the malaria forecasts. This successful collaboration required the provision of malaria data to modelers who in turn used the malaria data to develop forecast models in real-time. We wanted to show here that a similar co-production process can potentially lead to improved forecast value and uptake by a number of commercial farmers in southern Africa.
Rainfall data from five farms within southern Africa are considered. The statistical rainfall models for all five farms show statistically significant correlations (p > 0.05) between rainfall hindcasts and observed values, even though some of the years over the hindcast period are predicted poorly (Figures 1–5). Notwithstanding poor forecasts, there are a good number of consecutive seasons during which farmers can potentially experience enhanced profits based on forecasts (Figures 6–10). However, since there will always be seasons when even probabilistic seasonal forecasts will turn out to be less useful, farmers may benefit from knowing in advance when such seasons may occur and/or which seasons are more likely to be associated with reliable forecasts (Hoell and Eischeid, 2019).
This notion of “predicting” how reliable the probabilistic forecast for the next season is, is of course, difficult to do. However, verification work on hindcast data has provided the following general guideline that can also be followed by farmers in the larger part of southern Africa, namely, “no ENSO, no forecast” (e.g., Landman and Beraki, 2012). This guideline suggests that during ENSO-neutral seasons, farmers may improve their position by ignoring seasonal forecasts for planning purposes during such seasons. In addition to this guideline, probabilistic verification over the retro-active periods used for the profit calculations (Figures 6–10) shows that the relative operating characteristic scores (an indication of forecast discrimination; Wilks, 2011) for two of the South African farms in the summer rainfall region is about 0.8 for the extreme below-normal category and <0.5 for the extreme above-normal category. This result shows that these two farmers can be more confident when the forecast direction for a coming season shows drought (although we are not making claims here about the reliability of the forecast probabilities). Therefore, if an El Niño event is present (not ENSO-neutral), and the forecast for these two farms suggests a drought, this may be the point when these farmers should act on the forecast, by investing in protective action (Richardson, 2000).
In general, the farmers claim that using seasonal forecast can improve their profits. The prospects of using seasonal forecasts by the South African farmers seems to be viewed as less than that expressed by the Namibian farmer, who seems more optimistic about the forecasts. Two reasons for this conclusion are proposed here. The first is that there has been a track record, albeit short, and consequently greater trust between forecast user and forecast produced in the case of the Namibian farm. The second is that seasonal rainfall for the Namibian farm has higher forecast skill, and, thus, forecasts are subsequently associated with greater economic value.
When asked how forecasts can be improved and what their required forecast lead-time should be, most of the farmers wanted lead-times longer than the 1-month lead time hindcasts presented to them. This requirement should be achievable since skilful seasonal forecasts for parts of southern Africa have been shown to be possible at lead-times up to 3 or even 4 months (Landman et al., 2012). Further improvements could be achieved by making forecasts for individual months within a 3- month season. Higher temporal resolution forecasting has received some attention in the region (Phakula et al., 2018), but needs to be developed further. Further improvements may be possible through the use of dynamical variables from the GCMs as predictors for the statistical downscaling, instead of rainfall which is sometimes less well simulated. This could help build confidence in those farmers who observed the current forecasts are not sufficiently skilful.
This study is limited in the sense that only a small sample of only commercial farmers are considered in the analysis, and that even for the five farmers included here, the interaction between forecast user and producer has been brief. There remains a lot of co-learning to explore. For example, although cumulative profit results (Figures 6–10) were also presented to the farmers, and there was a question posed to them on their expected profits when using the forecasts, none of the farmers referred to the cumulative profit graphs on their responses—even though they were presented with an explanation on the interpretation of the graphs. This interaction may be improved in the future by engaging in the co-production of cumulative profit calculations, utilizing specific input costs and crop prices which are realized at each individual farm and therefore making the calculations more realistic for each farming enterprise.
Notwithstanding the caveats presented above, we feel we have moved further toward co-learning and co-development in agriculture in the region, including learning from this process. However, we need to iteratively improve on our engagement with the farmers, in order to develop a track record of trust, reach out to more farmers to make their data available for forecast model development for their respective farms, provide honest assessments on forecast performance and capability, and expand on the notion that using forecasts can be profitable, while being clear on the conditions under which that may occur.
Data Availability Statement
The raw data supporting the conclusions of this article will be made available by the authors, without undue reservation.
Author Contributions
WL: Farm data analysis and modeling, led writing the manuscript. EA: Contributed toward writing the manuscript, and editing. MT: Set the questions posed to farmers, expanded on the cumulative profit calculations, and editing. All authors contributed to the article and approved the submitted version.
Funding
The work is a result of support by the National Research Foundation of South Africa (NRF) through their financial support of rated researchers (119031), and the ACySACCESS project (114689).
Conflict of Interest
The authors declare that the research was conducted in the absence of any commercial or financial relationships that could be construed as a potential conflict of interest.
Acknowledgments
We acknowledge the agencies that support the NMME-Phase II system, and we thank the climate modeling groups (Environment Canada, NASA, NCAR, NOAA/GFDL, NOAA/NCEP, and University of Miami) for producing and making available their model output. NOAA/NCEP, NOAA/CTB, and NOAA/CPO jointly provided coordinating support and led development of the NMME-Phase II system.
References
Archer, E., Landman W. A., Malherbe, J., Tadross, M., and Pretorius, S. (2019). South Africa's winter rainfall region drought: a region in transition? Climate Risk Manage. 25:100188. doi: 10.1016/j.crm.2019.100188
Barnston, G., and Tippett, M. K. (2017). Do statistical pattern corrections improve seasonal climate predictions in the North American Multimodel Ensemble models? J. Climate 30, 8335–8355. doi: 10.1175/JCLI-D-17-0054.1
Bartman, A. G., Landman, W. A., and Rautenbach, C. J., deW. (2003). Recalibration of general circulation model output to austral summer rainfall over southern Africa. Intern. J. Climatol. 23, 1407–1419. doi: 10.1002/joc.954
Beraki, A. F., DeWitt, D., Landman, W. A., and Olivier, C. (2014). Dynamical seasonal climate prediction using an ocean-atmosphere coupled climate model developed in partnership between South Africa and the IRI. J. Climate 27, 1719–1741. doi: 10.1175/JCLI-D-13-00275.1
Hagedorn, R., and Smith, L. A. (2009). Communicating the value of probabilistic forecasts with weather roulette. Meteorol. Applicat. 16, 143–155. doi: 10.1002/met.92
Hansingo, K., and Reason, C. J. C. (2009). Modelling the atmospheric response over southern Africa to SST forcing in the southeast tropical Atlantic and southwest subtropical Indian Oceans. Intern. J. Climatol. 29, 1001–1012. doi: 10.1002/joc.1919
Hoell, A., and Eischeid, J. (2019). On the interpretation of seasonal Southern Africa precipitation prediction skill estimates during Austral summer. Climate Dynamics 53, 6769–6783. doi: 10.1007/s00382-019-04960-5
Hoell, A., Funk, C., Zinke, J., and Harrison, L. (2017). Modulation of the Southern Africa precipitation response to the El Niño Southern Oscillation by the subtropical Indian Ocean Dipole. Climate Dynamics 48, 2529–2540. doi: 10.1007/s00382-016-3220-6
Kirtman, B. P., Min, D., Infanti, J. M., Kinter, I. I. I., J. L., Paolino, D. A., et al. (2014). The North American multimodel ensemble: phase-1 seasonal-to-interannual prediction; phase-2 toward developing intraseasonal prediction. Bull. Am. Meteorol. Soc. 95, 585–601. doi: 10.1175/BAMS-D-12-00050.1
Landman, W. A. (2014). How the International Research Institute for Climate and Society has contributed towards seasonal climate forecast modelling and operations in South Africa. Earth Perspect. 1:22. doi: 10.1186/2194-6434-1-22
Landman, W. A., Barnston, A. G., Vogel, C., and Savy, J. (2019). Use of El Niño-Southern Oscillation related seasonal precipitation predictability in developing regions for potential societal benefit. Int. J. Climatol. 39, 5327–5337. doi: 10.1002/JOC.6157
Landman, W. A., and Beraki, A. (2012). Multi-model forecast skill for midsummer rainfall over southern Africa. Intern. J. Climatol. 32, 303–314. doi: 10.1002/joc.2273
Landman, W. A., DeWitt, D., Lee, D.-E., Beraki, A., and Lötter, D. (2012). Seasonal rainfall prediction skill over South Africa: 1- vs. 2-tiered forecasting systems. Weather Forecasting 27, 489–501. doi: 10.1175/WAF-D-11-00078.1
Landman, W. A., and Goddard, L. (2005). Predicting southern African summer rainfall using a combination of MOS and perfect prognosis. Geophys. Res. Lett. 32:L15809. doi: 10.1029/2005GL022910
Landman, W. A., Sweijd, N., Masedi, N. Minakawa, N. (2020). The development and prudent application of climate-based forecasts of seasonal malaria in the Limpopo province in South Africa. Environ. Dev. doi: 10.1016/j.envdev.2020.100522. [Epub ahed of print].
Malherbe, J., Landman, W. A., Olivier, C., Sakuma, H., and Luo, J.-J. (2014). Seasonal forecasts of the SINTEX-F coupled model applied to maize yield and streamflow estimates over north-eastern South Africa. Meteorol. Applicat. 21, 733–742. doi: 10.1002/met.1402
Mason, S. J. (1995). Sea-surface temperature—South African rainfall associations, 1910–1989. Intern. J. Climatol. 15, 119–135. doi: 10.1002/joc.3370150202
Mason, S. J. (2018). Guidance on Verification of Operational Seasonal Climate Forecasts. WorldMeteorological Organization, Commission for Climatology XIV Technical Report 1220.
Mason, S. J., and Tippett, M. K. (2016). Climate Predictability Tool Version 15.3. New York, NY: Columbia University Academic Commons.
Muchuru, S., Landman, W. A., and DeWitt, D. (2016). Prediction of inflows into Lake Kariba using a combination of physical and empirical models. Intern. J. Climatol. 36, 2570–2581. doi: 10.1002/joc.4513
Muchuru, S., Landman, W. A., DeWitt, D., and Lötter, D. (2014). Seasonal rainfall predictability over the Lake Kariba catchment area. Water SA 40, 461–469, doi: 10.4314/wsa.v40i3.9
Nipen, T. N., Seierstad, I. A., Lussana, C., Kristiansen, J., and Hov, Ø. (2020). Adopting citizen observations in operational weather prediction. Bull. Am. Meteorol. Soc. 101, E43–E57. doi: 10.1175/BAMS-D-18-0237.1
Otto, F. E. L., Wolski, P., Lehner, F., Tebaldi, C., van Oldenborgh, G. J., Hogesteeger, S., et al. (2018). Anthropogenic influence on the drivers of the Western Cape drought 2015–2017. Environ. Res. Lett. 13:124010. doi: 10.1088/1748-9326/aae9f9
Phakula, S., Landman, W. A., and Beraki, A. (2018). Forecasting seasonal rainfall characteristics and onset months over South Africa. Intern. J. Climatol. 38, e889–e900. doi: 10.1002/joc.5417
Pohl, B., Richard, Y., and Fauchereau, N. (2009). Influence of the Madden–Julian Oscillation on Southern African Summer Rainfall. J. Clim. 20, 4227–4242. doi: 10.1175/JCLI4231.1
Reason, C. J. C. (2001). Subtropical Indian Ocean SST dipole events and southern African rainfall. Geophys. Res. Lett. 28, 2225–2227. doi: 10.1029/2000GL012735
Reason, C. J. C., and Smart, S. (2015). Tropical south east Atlantic warm events and associated rainfall anomalies over southern Africa. Front. Environ. Sci. 3:24. doi: 10.3389/fenvs.2015.00024
Richardson, D. S. (2000). Skill and relative economic value of the ECMWF ensemble prediction system. Q. J. R. Meteorol. Soc. 126, 649–667. doi: 10.1002/qj.49712656313
Tadross, M. A., Hewitson, B. C., and Usman, M. T. (2005). The interannual variability on the onset of the maize growing season over South Africa and Zimbabwe. J. Clim. 18:16. doi: 10.1175/JCLI3423.1
Washington, R., and Preston, A. (2006). Extreme wet years over southern Africa: Role of Indian Ocean sea surface temperatures. J. Geophys. Res. Atmosph. 111:D15104. doi: 10.1029/2005JD006724
Keywords: Southern Africa, seasonal climate forecasts, co-production, profits, farm management
Citation: Landman WA, Archer ERM and Tadross MA (2020) Citizen Science for the Prediction of Climate Extremes in South Africa and Namibia. Front. Clim. 2:5. doi: 10.3389/fclim.2020.00005
Received: 30 May 2020; Accepted: 23 July 2020;
Published: 08 September 2020.
Edited by:
Andrew John Dougill, University of Leeds, United KingdomReviewed by:
Elias Nkiaka, University of Leeds, United KingdomNnyaladzi Batisani, Botswana Institute for Technology Research and Innovation (BITRI), Botswana
Copyright © 2020 Landman, Archer and Tadross. This is an open-access article distributed under the terms of the Creative Commons Attribution License (CC BY). The use, distribution or reproduction in other forums is permitted, provided the original author(s) and the copyright owner(s) are credited and that the original publication in this journal is cited, in accordance with accepted academic practice. No use, distribution or reproduction is permitted which does not comply with these terms.
*Correspondence: Willem A. Landman, V2lsbGVtLkxhbmRtYW5AdXAuYWMuemE=