 Marc Wiedermann
 Jonatan F. Siegmund1
 Jonathan F. Donges
 Reik V. Donner
- 1Potsdam Institute for Climate Impact Research (PIK)—Member of the Leibniz Association, Potsdam, Germany
- 2Stockholm Resilience Centre, Stockholm University, Stockholm, Sweden
- 3Department of Water, Environment, Construction and Safety, Magdeburg–Stendal University of Applied Sciences, Magdeburg, Germany
The effects of El Niño's two distinct flavors, East Pacific (EP) and Central Pacific (CP)/Modoki El Niño, on global climate variability have been studied intensively in recent years. Most of these studies have made use of linear multivariate statistics or composite analysis. Especially the former assumes the same type of linear statistical dependency to apply across different phases of the El Niño–Southern Oscillation (ENSO), which appears not necessarily a justified assumption. Here, we statistically evaluate the likelihood of co-occurrences between very high or very low seasonal precipitation sums over vast parts of the global land surface and the presence of the respective EP and CP types of both, El Niño and La Niña. By employing event coincidence analysis, we uncover differential imprints of both flavors on very low and very high seasonal precipitation patterns over distinct regions across the globe, which may severely affect, among others, agricultural and biomass production or public health. We particularly find that EP periods exhibit statistically significant event coincidence rates with hydrometeorological anomalies at larger spatial scales, whereas sparser patterns emerge along with CP periods. Our statistical analysis confirms previously reported interrelations for EP periods and uncovers additional distinct regional patterns of very high/low seasonal precipitation, such as increased rainfall over Central Asia alongside CP periods that have to our knowledge not been reported so far. Our results demonstrate that a thorough distinction of El Niño and La Niña into their two respective flavors could be crucial for understanding the emergence of strong regional hydrometeorological anomalies and anticipating their associated ecological and socioeconomic impacts.
1. Introduction
The positive (El Niño) and negative (La Niña) phases of the El Niño–Southern Oscillation (ENSO) are known to be associated with wide-spread anomalies in the mean hydrometeorological conditions at various distant parts of the Earth. These long-ranged interactions are often referred to as teleconnections (Trenberth, 1997; Neelin et al., 2003; Domeisen et al., 2019). In this context, recent findings indicate that there exist two distinct types or flavors of El Niño phases, usually referred to as the East Pacific (EP) or canonical El Niño and the Central Pacific (CP) El Niño or El Niño Modoki (Ashok et al., 2007; Kao and Yu, 2009; Marathe et al., 2015), respectively. It has been shown that these two flavors are possibly associated with distinct hydrometeorological responses in certain regions (Taschetto and England, 2009). Examples include reduced rainfall over eastern Australia (Chiew et al., 1998) or Southern Africa (Ratnam et al., 2014) only during EP periods as well as increased precipitation over the tropical regions of Africa (Preethi et al., 2015) or the western Indo-Pacific Oceans (Weng et al., 2011; Feng and Chen, 2014) during CP periods. The main reason for such differential responses are different longitudinal positions of the strongest ENSO related sea surface temperature (SST) anomalies in the tropical Pacific Ocean alongside the different flavors, which results in different modifications of large-scale atmospheric circulation patterns (Ashok and Yamagata, 2009; Domeisen et al., 2019).
A similar discrimination into two types has been suggested for La Niña phases as well (Kug and Ham, 2011), even though their respective imprints on SST patterns seem less distinct than for El Niño (Kao and Yu, 2009; Ren and Jin, 2011). It therefore remains an open problem to provide further statistical and/or dynamical evidence either in favor or against such a distinction of different La Niña flavors in analogy to El Niño (Chen et al., 2015; Zhang et al., 2015; Levine et al., 2016). Still, differential hydrometeorological responses alongside specific La Niña phases have recently been identified especially across the Pacific (Shinoda et al., 2011; Magee et al., 2017; Song et al., 2017; Hidayat et al., 2018), which provides good reason for discriminating La Niña into two types as well.
Most previous studies (including those mentioned above) on the teleconnective impacts of different ENSO phases and flavors have either applied linear statistical tools, such as (partial) correlation analysis (Diaz et al., 2001; Weng et al., 2011; Preethi et al., 2015; Magee et al., 2017; Hidayat et al., 2018) or empirical orthogonal function (EOF) analysis (Taschetto and England, 2009), or investigated composites (i.e., mean spatial patterns for a specific type of ENSO period) of the corresponding climate observable of interest (Feng and Chen, 2014; Hoell et al., 2014; Song et al., 2017). Specifically, the former methods share the common limitation of focusing on linear or average interdependencies between ENSO and possible response variables. At the same time, global climate change has been projected to lead to an increase in the strength and frequency of both, climate extremes (Easterling et al., 2000; Karl and Trenberth, 2003) as well as extreme ENSO phases (Cai et al., 2014, 2015). This calls for more systematically assessing possible statistical as well as dynamical/mechanistic linkages between these two findings (Allan and Soden, 2008). Accordingly, the present work aims to identify and quantitatively characterize spatial patterns of markedly wet/dry seasons that have an elevated probability to co-occur with certain types (EP or CP) of ENSO phases, following upon previous findings that ENSO can have large-scale effects on rainfall patterns at both, global and regional scales (Ropelewski and Halpert, 1987; Dai and Wigley, 2000).
Several strategies to distinguish East Pacific (EP) from Central Pacific (CP) ENSO events have been proposed in the recent past (Hendon et al., 2009). One prominent example is the ENSO Modoki Index that is computed as weighted average SST anomalies over three specific regions (165°E to 140°W and 10°S to 10°N, 110°W to 70°W, and 15°S to 5°N, as well as 125°E to 145°E and 10°S to 20°N) in the equatorial Pacific (Ashok et al., 2007). Other approaches have used empirical orthogonal functions (Kao and Yu, 2009; Graf and Zanchettin, 2012) or combinations of the Nino3 and Nino4 indices (Hu et al., 2011; Kim et al., 2011) to provide the desired categorization.
Wiedermann et al. (2016) recently compiled a synthesis of eight previous studies that used either of the aforementioned frameworks and identified several ENSO periods during which these techniques proposed either ambiguous, mutually inconsistent, or incomplete classifications, with certain ENSO periods remaining entirely unassigned. In order to fill those gaps, Wiedermann et al. (2016) proposed a new index based on spatial correlation structures among global surface air temperature anomalies, which can be conveniently studied in terms of the transitivity of so-called functional climate networks (Tsonis et al., 2006; Donner et al., 2017). This transitivity index confirmed the flavors of all El Niños between 1953 and 2013 that had been classified in mutual agreement across the existing literature (Wiedermann et al., 2016). It also allowed to assign types to those cases where former work yielded incomplete or ambiguous categorizations and thereby provided a consistent, comprehensive, and complete classification of the respective flavors. Moreover, Wiedermann et al. (2016) showed that the transitivity index also naturally distinguishes La Niña episodes into two corresponding types, thereby providing a unique advantage over other classification schemes that mainly focus on El Niño phases alone. Even though the existing literature on a discrimination of different La Niña periods is comparatively scarce, the transitivity index confirmed the results of at least two recent studies (Tedeschi et al., 2013; Yuan and Yan, 2013) and again provides a consistent classification for years that previously had types ambiguously or not all assigned (Wiedermann et al., 2016). For both reasons, i.e., the comprehensiveness of the classification and the ability to distinguish La Niña into two types as well, we will directly use the classified periods from Wiedermann et al. (2016) (see Table 1 for an overview) for the purpose of our present study.
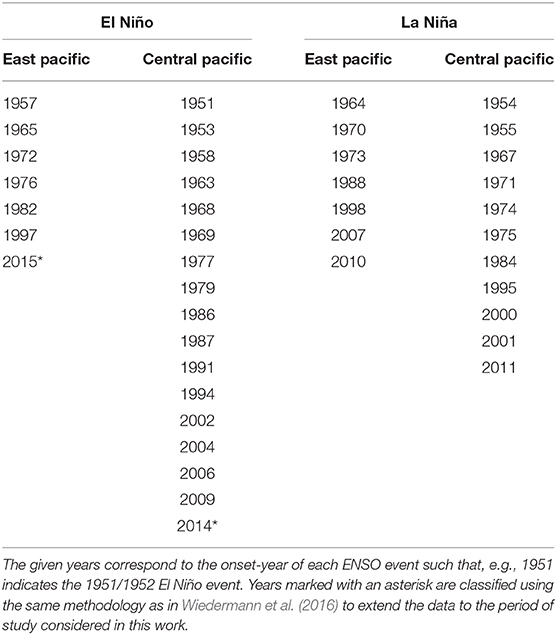
Table 1. Classification of ENSO periods according to Wiedermann et al. (2016) on the basis of a comprehensive literature synthesis and a consistent classification using the network-based transitivity index.
Based on this categorization of El Niño and La Niña phases, we quantify the likelihood of simultaneous or time-delayed co-occurrences of strong seasonal wet/dry anomalies at a local scale across vast parts of the global land surface with a certain type of ENSO phase. Specifically, we consider seasonal precipitation sums for boreal fall (September–November, SON), winter (December–February, DJF), and spring (March–May, MAM) as key seasons of the developmental cycle of El Niño and/or La Niña conditions. By contrast, we omit the boreal summer season, even though large scale hydrometeorological conditions during this season could still be distinctively affected by different (approaching or withdrawing) ENSO phases. The reason for this choice is that there are various cases where El Niño and La Niña conditions occur in subsequent years so that a unique attribution of anomalies to any of these two phases would be hardly possible. In our present analysis, strong wet (dry) anomalies will be defined as seasonal precipitation sums exceeding the empirical 80th (falling below the empirical 20th) percentile of the distribution of all values on record for a given season and location.
To statistically quantify co-occurrences between different types of ENSO phases and very wet/dry seasons, we employ event coincidence analysis (ECA) (Donges et al., 2011, 2016). Put in simple terms, ECA counts the fraction of events of one type (here, some particularly wet/dry season at a certain location) that coincide with those of another type (here, some type of ENSO period) while, in contrast to other conceptually related approaches like event synchronization (Quian Quiroga et al., 2002; Malik et al., 2010; Boers et al., 2014), allowing for a precise control of the relative timing between them (Wolf et al., 2020). This statistical framework has already been successfully applied to quantify the likelihood of climatic (extreme) events possibly triggering certain ecological or socioeconomic responses, such as extreme annual (Rammig et al., 2015) and daily (Siegmund et al., 2016a) tree growth or flowering dates (Siegmund et al., 2016b), the outbreak of epidemics (Donges et al., 2016) or armed conflicts (Schleussner et al., 2016; Ide et al., 2020).
In the course of this work, we first evaluate significant event coincidence rates for the canonical (EP) El Niño. This allows us to demonstrate the consistency of our approach by comparing the obtained spatial patterns with a variety of previously reported results. We continue by studying co-occurrences between strong seasonal precipitation anomalies and the so far less intensively studied CP El Niño periods to highlight differences in their teleconnectivity patterns as compared to their EP counterparts. Ultimately, we also study La Niña periods and demonstrate that the most remarkable large-scale spatial patterns of strong seasonal rainfall anomalies non-randomly co-occurring with this negative ENSO phase are associated with the corresponding EP flavor. This finding suggests that in the light of recent discussions on the existence of two distinct types of La Niña periods (Kao and Yu, 2009; Kug and Ham, 2011; Ren and Jin, 2011; Zhang et al., 2015), it is indeed meaningful to consider a global impact-based distinction between one type that significantly affects seasonal wet/dry patterns globally and another that exhibits less spatially coherent impacts. Wherever appropriate, we also briefly discuss possible ecological and socioeconomic consequences of the identified seasonal precipitation anomalies.
2. Data and Methods
2.1. GPCC Rainfall Data
We utilize gridded monthly precipitation data provided by the Global Precipitation Climatology Centre (GPCC) at a spatial resolution of 2.5° × 2.5° (Schneider et al., 2018). Since reliable discriminations of El Niño and La Niña periods into their respective EP and CP flavors are so far mainly available for the second half of the twentieth century (Graf and Zanchettin, 2012; Yuan and Yan, 2013; Wiedermann et al., 2016; Freund et al., 2019), we restrict our analysis to the period from 1951 to 2016 (the most recent year in the GPCC data set). We derive separate records for three seasons s by aggregating the precipitation sums of the corresponding 3-month periods from September to November (SON, 1951–2015), December to February (DJF, 1951/52–2015/16), and March to May (MAM, 1952–2016) to cover all seasons associated with the 1951/52 El Niño and all following ENSO phases while ensuring the same length of all series. This results in three time series Pi, s(t) per grid cell i with M = 65 annual values each. Note that the density of stations from which the GPCC data has been derived varies between 0 and more than 100 per grid cell and year (Lorenz and Kunstmann, 2012), which generally results in a lower accuracy and reliability of the data for those areas with only few stations (Rudolf et al., 1994). We therefore consider only grid cells with at least one station present for 95% of the study period in a specific season s (SON, DJF, or MAM). In addition, we exclude those grid cells where the average precipitation sum in a specific season is below 3 cm (i.e., 1 cm per month) since this particular choice of threshold ensures the exclusion of deserts from our analysis (Chatterton et al., 1971; Houston, 2006; Thomas and Nigam, 2018). Both preprocessing steps yield a total number of NSON = 1763, NDJF = 1, 610, and NMAM = 1, 736 valid grid cells in SON, DJF, and MAM (see Supplementary Figure 5 for details on the spatial distribution of valid grid cells).
We note that in the context of the present work, using 3-month precipitation sums provides information fully equivalent to that obtained when using the 3-month standardized precipitation index SPI-3 (Guttman, 1999; Svoboda et al., 2012), which is a solely precipitation-based characteristic commonly employed in drought-related studies. Specifically, SPI-3 values can be derived by a sophisticated monotonic transformation of the 3-month precipitation sums, which does not change the rank order of the values and, hence, the timing of the events considered in this study.
2.2. Classification of ENSO Periods
We use the classification of East Pacific (EP) and Central Pacific (CP) flavors of recent El Niño and La Niña episodes from Wiedermann et al. (2016) (Table 1). This classification has been based on a comprehensive literature review of eight (two) studies that distinguished certain El Niños (La Niñas) between 1953 and 2010 into their two respective types. Based on this compilation, Wiedermann et al. (2016) identified 11 ENSO periods for which previous works yielded mutually consistent results and another 10 periods for which (a subset) of previous studies yielded incomplete, ambiguous, or mutually inconsistent classifications.
In order to achieve a consistent and comprehensive classification of both, El Niño and La Niña flavors, including also the ENSO periods without previous consensus, Wiedermann et al. (2016) introduced the so-called transitivity index, which reflects distinct characteristics (in terms of abundance and localization) of ENSO's teleconnections during EP and CP periods (Radebach et al., 2013; Wiedermann et al., 2016). In brief, this index is obtained from 1-year sliding-window lag-zero absolute correlation matrices between time series at all pairs of grid cells in the global daily surface air temperature anomaly field (Kistler et al., 2001). The most relevant information of these matrices is contained in the 0.5% strongest absolute correlations (Donges et al., 2009; Radebach et al., 2013; Wiedermann et al., 2016), yielding thresholds for each considered time window below which the matrix coefficients are put to zero. The thus obtained sparse matrices are then considered as weighted adjacency matrices of so-called functional climate networks (Donges et al., 2009; Radebach et al., 2013; Wiedermann et al., 2016) with positive entries indicating a strong statistical relationship between climate variability in two grid cells. The transitivity index (Newman, 2003; Antoniou and Tsompa, 2008) then describes the degree to which such strong relationships among triples of grid cells are transitive, i.e., the fraction of cases in which connections between two pairs (i, j) and (i, k) of grid cells sharing a common member are accompanied by a third connection between the remaining pair (j, k). In order to provide a representative property, this fraction is further weighted by the respective cell-sizes and strengths of the involved links, i.e., the corresponding values of the absolute cross-correlation (Saramäki et al., 2007). The transitivity index quantifies the (dispersed or localized) spatiotemporal distribution of links in the climate network and directly reflects distinct characteristics in the temporal evolution of spatial autocorrelations and global teleconnections that are unique to specific ENSO flavors (Radebach et al., 2013; Wiedermann et al., 2016).
Given the presence of either El Niño or La Niña conditions as indicated by the Oceanic Nino Index (ONI), the transitivity index then indicates EP phases by a strong peak co-occurring with the respective ENSO period. By contrast, CP phases can be identified by the absence of such a transitivity peak with values of the index close to its baseline (see Wiedermann et al., 2016 for a comprehensive description and interpretation of the framework as well as all necessary mathematical details).
The transitivity index confirmed the classification of all 11 consistently reported El Niño periods from earlier works and additionally provided a comprehensive classification for those periods that were previously classified inconsistently or incompletely. While most other recent approaches for classifying ENSO flavors were mostly tailored to El Niño events, the transitivity index also provides a consistent classification of La Niña periods (Wiedermann et al., 2016), thereby making it particularly useful for our present study.
In total, Wiedermann et al. (2016) identified six EP El Niño and sixteen CP El Niños between 1951 and 2014, which is largely consistent with a recent study by Freund et al. (2019) that used objective supervised machine learning to obtain a similar discrimination. Similarly, Wiedermann et al. (2016) found seven EP La Niñas and 11 CP La Niñas. Since Wiedermann et al. (2016) only provide classifications for all ENSO periods prior to the year 2014, we apply their methodology to extend the event categorization to our present study period. We specifically identify the 2014/2015 and 2015/2016 El Niño periods as CP and EP types, respectively, which is again consistent with the recently proposed classification by Freund et al. (2019). An overview of all ENSO periods and types that are ultimately used in this study is given in Table 1.
Based on the classification in Table 1, we create binary indicator time series for the four different ENSO phases (see Figure 1), e.g., an EP El Niño series XEPEN(t) with XEPEN(t) = 1 if t marks the onset-year of an EP El Niño and XEPEN(t) = 0 otherwise (solid lines in Figure 1A). Correspondingly, we obtain the event series XCPEN(t) for CP El Niños (dashed lines in Figure 1A). The same procedure is applied to La Niña periods, resulting in two event series XEPLN(t) and XCPLN(t), respectively (Figure 1B).
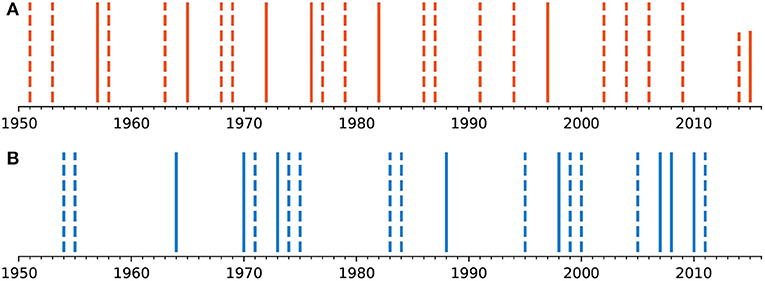
Figure 1. (A) Event series XEPEN of East Pacific (solid lines) and XCPEN of Central Pacific (dashed lines) El Niños according to the classification in Wiedermann et al. (2016) and Table 1. (B) The same for La Niña periods.
2.3. Data Preprocessing
We identify years with seasons s (DJF, SON, or MAM, see above) exhibiting extraordinary high or low precipitation amounts from the corresponding time series Ps, i(t) for each grid cell i, individually. Specifically, we consider values above (below) the 80th (20th) percentile () in each of the time series Ps, i(t) as extraordinary high (low) seasonal precipitation sums (Figure 2A). We choose these particular thresholds to ensure the presence of a sufficient number of particularly dry and wet seasons that is comparable with the number of different types of ENSO periods in the considered study period. It has been checked that the results obtained in this work do not change qualitatively if more restrictive or loose thresholds are applied (see Supplementary Material for details).

Figure 2. (A) Exemplary seasonal precipitation time series Ps,i(t) (colored bars) as well as corresponding thresholds and computed as the 80th and 20th percentile of Ps,i(t), respectively. Precipitation signals above (blue bars) are considered very wet while those below (red bars) are considered very dry for the subsequent analysis. (B) The two corresponding event series and with if a corresponding event occurs at time t and otherwise.
According to these considerations, we obtain six binary (indicator) time series for each GPCC grid cell i,
where () indicates the presence of a very high (very low) seasonal precipitation sum at grid cell i during season s in year t (Figure 2). By following the above procedure, no further deseasonalization of the precipitation data is necessary, since the grid cell specific seasonality of precipitation is already taken into account. Furthermore, the events are defined for each grid cell independent of all the others, which means that the specific characteristics of rainfall variability and strength at one location do not influence the definition of events at other locations as it would be the case when considering, e.g., a global (location-independent) threshold for seasonal precipitation.
2.4. Event Coincidence Analysis
Event coincidence analysis (ECA) is a statistical tool that quantifies the empirical likelihood of co-occurrences of events in two series (Donges et al., 2011, 2016; Rammig et al., 2015). To complement other conceptually related approaches like event synchronization (Quian Quiroga et al., 2002; Malik et al., 2010; Boers et al., 2014), ECA has been developed based on analytical considerations on paired point processes and combines a precise control of the relative timing of (instantaneous or mutually lagged) events that are considered synchronous with analytical confidence bounds on the obtained event coincidence rates (Donges et al., 2011, 2016). Both aforementioned features provide some considerable benefit of ECA in the specific context of the present work not shared by other similar methods. Particularly the precise control of the relative timing between events (along with the specific ability to chose a global coincidence interval; Wolf et al., 2020) is crucial for our analysis. It ensures that the we only consider precipitation anomalies that occur simultaneously (for SON or DJF) or exactly a year subsequent (for MAM) to the onset of a respective ENSO phase.
In the context of our work, ECA provides for each grid cell the fraction (called event coincidence rate) of EP/CP ENSO periods that co-occur with very high or low precipitation sums in SON or DJF of the same year or MAM of the year following the onset of an El Niño or La Niña phase. Hence, the event coincidence rate for one pair of ENSO and precipitation event series is given by
Here, X•(t) represents one of the four time series indicating the presence of EP and CP flavors of El Niño and La Niña (see above). While interpreting t as the calendar year, the offset τ reads τ = 0 for SON and DJF and τ = 1 for MAM.
Note, that our present analysis studies so-called trigger coincidence rates (Donges et al., 2016) that quantify the likelihood of a given ENSO period and phase to be followed by a specific strong/wet precipitation signal. In contrast, a complementary definition of ECR (denoted precursor coincidence rate; Donges et al., 2016) would address the inverse problem of quantifying likelihoods that a given precipitation event (that could arise through a variety of conditions and drivers) is preceded by a specific ENSO period and phase. However, since our present work only considers instantaneous coincidences (see Donges et al., 2016 for details), i.e., coincidences between events in the same ENSO period, the two types of coincidence rates only differ in their normalization [i.e., the denominator of Equation (2)]. They therefore provide essentially similar information, except for possible differences in the associated statistical significance resulting from different numbers of events (i.e., different sample sizes).
To assess the statistical significance of the empirical event coincidence rates, we assume both involved event sequences to be distributed randomly, independently and uniformly (Donges et al., 2011, 2016). A corresponding p-value is derived analytically from the probability distribution of event coincidence rates that would occur by chance only. We consider an empirical event coincidence rate as statistically significant if its associated p-value is smaller than a confidence level of α = 0.05 (Donges et al., 2016).
3. Results
3.1. Seasonal Wet/Dry Patterns and EP El Niño
We first investigate co-occurrences of EP El Niño periods and very wet/dry seasons. Figures 3A,C,E highlight areas with significant event coincidence rates between EP El Niños and very dry (red squares) and wet seasons (blue squares) in SON, DJF, and MAM, respectively.
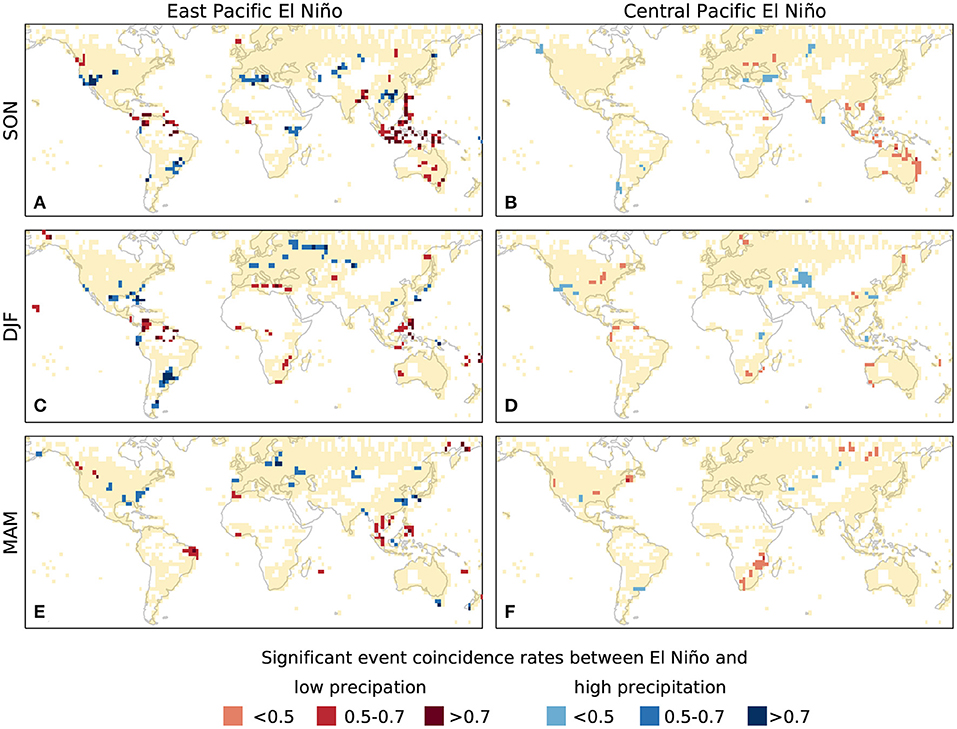
Figure 3. Statistically significant event coincidence rates (ECR) between EP (A,C,E) and CP (B,D,F) El Niños and very dry (red squares) or very wet (blue squares) conditions for the three seasons SON, DJF, and MAM. Dry/wet periods are defined by seasonal precipitation sums below/above the 20th/80th percentile of all years from 1951 to 2016. Only significant clusters of at least two adjacent grid-cells are shown. Different shades of red/blue indicate increasing magnitudes of significant ECR between the respective El Niño events and strong/weak seasonal precipitation. Yellow areas indicate grid cells with non-significant event coincidence rates. White areas over land indicate insufficient quality of the GPCC dataset (i.e., grid cells excluded from our analysis).
During those SON seasons that correspond to the developing stages of EP El Niños, we find an elevated probability of very dry conditions over Indonesia, the Philippines, and the southwestern Pacific Islands as well as over northern South America and the northern Amazon Basin (Figure 3A). Droughts in the latter region have been previously linked to an increased risk of biomass loss in the Amazon which normally serves as a long-term carbon sink (Phillips et al., 2009; Lewis et al., 2011).
For the same season (SON), we also observe an increased likelihood of very wet conditions along the west coast of North America (Figure 3A). Similarly, unusually wet conditions frequently emerge over Ecuador and southeastern South America in SON and DJF (Figures 3A,C). We further observe more spatially confined regions with wet conditions over parts of the Chilean Andes in SON (Figure 3A), which may result in an increased risk for the occurrence of floods in this area (Bookhagen and Strecker, 2012; Boers et al., 2014). All these observations agree well with previous studies (Diaz et al., 2001).
Coinciding with EP El Niños, we also observe more frequent wet conditions over the Mediterranean region and East Africa during SON (Figure 3A), both of which have been previously reported in local case studies (Camberlin et al., 2001; Shaman and Tziperman, 2010). The observed tendency toward very dry conditions in southwestern Africa during DJF (Figure 3C) has also been reported recently (Hoell et al., 2014).
For MAM seasons, we observe pronounced large-scale patterns of significant event coincidence rates between EP El Niños and low precipitation sums in Northeast Brazil (Figure 3E), which is consistent with previous studies (Kane, 1997). Furthermore, the dry conditions over the Philippines that are observed during SON (see above) and DJF also persist into the MAM season (Figure 3E). In addition, strong MAM rainfall occurring alongside EP El Niños is most prominently observed in the southeastern United States, which is again consistent with previous works that used composite analysis to determine North American weather patterns associated with El Niño conditions (Ropelewski and Halpert, 1986).
Taken together, the results of ECA are overall in good agreement with previously reported interrelations between El Niño and global precipitation patterns, which have mostly been identified using linear statistical tools such as correlation analysis (Camberlin et al., 2001; Phillips et al., 2009), principal component analysis (Diaz et al., 2001), or composites based on seasonal averages (Shaman and Tziperman, 2010; Hoell et al., 2014). Thus, we conclude that the application of ECA to unveil strong ENSO related hydrometeorological anomalies provides consistent results when compared to previous studies. Our results also imply that strong responses of seasonal precipitation to canonical (EP) El Niño conditions show similar spatial patterns as the average statistical interdependency between ENSO-related indices and the corresponding hydrometeorological observables. However, we note that most previous studies have not discriminated between the two El Niño flavors. Thus, the agreement between our results for EP El Niños and the existing literature suggests that the previously observed (linear) effects might be dominated by the (on average stronger; Kug et al., 2009; Huang et al., 2016) EP events.
3.2. Seasonal Wet/Dry Patterns and CP El Niño
Next, we focus on very high and low seasonal precipitation along with the so far less intensively studied CP El Niño (cf. Figures 3B,D,F). We first discuss those regions that display significant event coincidence rates for EP El Niños (see above) but not for the corresponding CP periods. Notably, very dry seasons over tropical South America that frequently co-occur together with EP El Niños are markedly less prominent for CP El Niños during DJF (Figure 3D) and do not display any significant event coincidence rates at all in SON (Figure 3B). The latter also holds true for very wet seasons along the western coast of Central and North America that have been observed for EP El Niños. In the same manner, the wet SON patterns over southern China, the Mediterranean, and East Africa frequently co-occurring with EP El Niños in SON do not exhibit significant coincidence rates with CP El Niños (Figure 3B). We further note, that the large-scale dry events over Indonesia observed along with EP El Niños during SON become less spatially coherent for CP El Niños (Figure 3B). For MAM, the wet patterns over the northern Iberian peninsula that are observed for EP El Niños cannot be identified for CP El Niños (Figure 3F).
While the aforementioned observations indicate decreased or weakened impacts of CP El Niños in comparison with the EP flavor, we also observe new additional patterns of significant event coincidence rates that are not present during EP El Niños but emerge only along with CP periods. Most notably, very dry conditions become more likely along Australia's east coast during SON (Figure 3B). Such hydrometeorological anomalies could thus result in severe impacts on river ecosystems and agriculture in that region (Leblanc et al., 2012). In particular, marked drought phases in Eastern Australia are likely to cause a cascade of low river inflows, general water scarcity and large scale floodplain forest mortality as well as an increase of toxicity in the surrounding lakes (Leblanc et al., 2012). These natural hazards can have substantial effects on agricultural production in terms of a severe reduction in irrigated crop yields (van Dijk et al., 2013).
In addition to reduced rainfall responses, significant event coincidence rates with very wet conditions are found over southern Chile pointing toward increased rainfall during CP El Niños as compared to their canonical counterparts. In DJF months coinciding with CP El Niño periods, we observe the emergence of new wet patterns over Central Asia well as a dry pattern over the north of Peru and Ecuador (Figure 3D). Finally, we observe a pronounced dry pattern over Southeast Africa in MAM (Figure 3F).
Generally, we note lower event coincidence rates between seasonal wet/dry conditions and CP El Niños as compared to EP periods (compare Figures 3A,C,E and Figures 3B,D,F). This might be partly explained by the larger of number of 17 CP events as compared to 7 EP events over the considered study period which is consistent with previously reported frequencies of the two flavors (Hendon et al., 2009; Graf and Zanchettin, 2012; Preethi et al., 2015; Wiedermann et al., 2016). In addition, recent studies suggest that CP El Niños might be further discriminated into two subtypes based on their specific impacts on Pacific rainfall and the modes of the Indian Ocean dipole (Wang and Wang, 2013, 2014; Wang et al., 2018). Along those lines, future work should therefore investigate whether the comparatively lower significant event coincidence rates between CP El Niños and strong/weak seasonal precipitation can indeed also be attributed to the presence or absence of any of these two possible subtypes.
3.3. Seasonal Wet/Dry Patterns and EP/CP La Niña
Ultimately, we perform the same analysis as above for La Niña periods. For the EP, i.e., canonical, La Niña phases (Figures 4A,C,E) we again find various patterns that have already been reported in previous studies. Specifically, during SON coinciding with EP La Niñas (Figure 4A), we recapture an increased probability for very wet conditions over Australia and Indonesia (Arblaster et al., 2002) and exceptionally dry conditions in southern Europe (Pozo-Vázquez et al., 2005) and the south of Brazil and Uruguay (Ropelewski and Halpert, 1996). We further observe significant event coincidence rates for dry seasons in the Middle East contrasted by more intense than normal rainfall over central Europe. For DJF, our analysis confirms previous findings of very wet conditions over South Africa and dry episodes over West Africa (Nicholson and Selato, 2000) (Figure 4C), the latter having been previously linked to potential agricultural losses (Karpouzoglou and Barron, 2014) and considerable health risks in that specific area (Rataj et al., 2016). We further observe a prominent seasonal precipitation dipole with dry conditions over Mexico and elevated rainfall over southwestern Canada. The latter has become an important aspect of local water resource management (Lute and Abatzoglou, 2014), but together with increasing air temperature and more frequent storms also poses the threat of landslides in corresponding coastal areas (Guthrie et al., 2010). For MAM seasons associated with EP La Niñas, we observe a tendency towards strong rainfall over the Amazon (Rogers, 1988) and parts of Northern Australia (Arblaster et al., 2002) and the Philippines (Figure 4E).
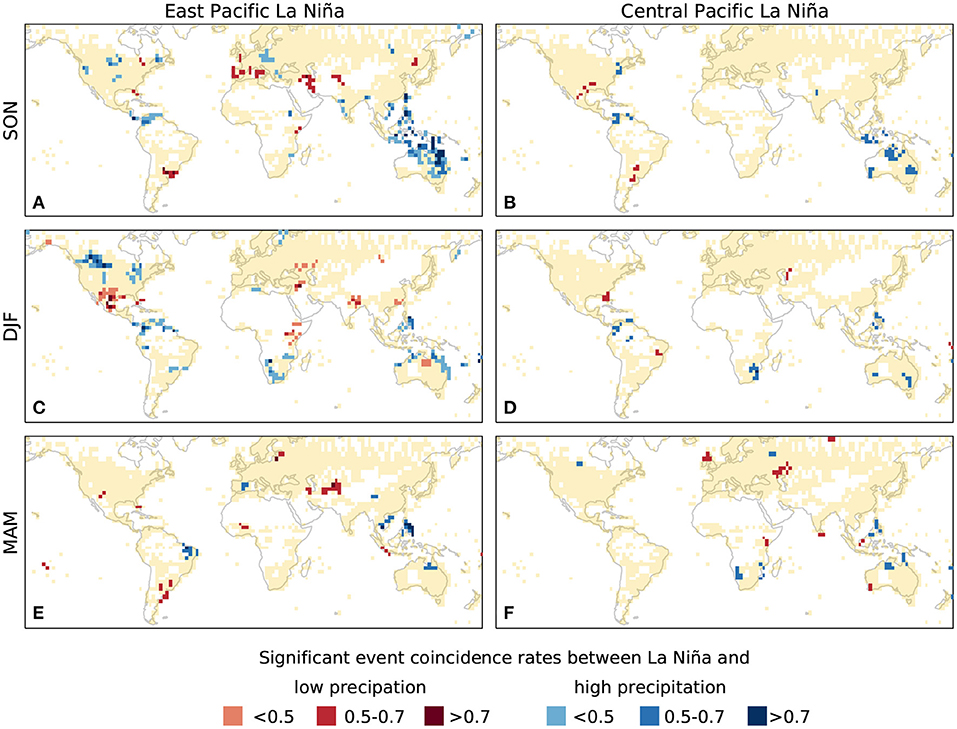
Figure 4. Same as Figure 3, but for the two types of La Niña.
In contrast to the wide-spread spatially coherent wet/dry anomaly patterns observed for EP La Niña periods, we find much fewer spatially extended structures along with CP La Niñas (Figures 4B,D,F). Most prominently, we recover previously reported wet conditions over parts of Australia in SON (Arblaster et al., 2002; Cai and Cowan, 2009) (Figure 4B). Additionally, we uncover strongly reduced rainfall over Florida in DJF (Figure 4D), and over the United Kingdom, Ireland and the west of Kazakhstan in MAM (Figure 4F). In summary, we observe that CP La Niñas co-occur with less spatially coherent precipitation responses as compared to their canonical counterparts. We also note that event coincidence rates between La Niña and seasonal wet/dry precipitation signals are quantitatively more similar across EP and CP periods than El Niño (cf. Figures 4A–F), which could be partly explained by the comparatively lower difference between the total number of 8 EP and 12 CP La Niña events. In addition, future work should again investigate the potential for further discriminating CP La Niñas into two distinct subtypes in analogy to El Niño (Wang and Wang, 2013, 2014; Wang et al., 2018). Such an approach would possibly allow us to attribute significant event coincidence rates between CP La Niña and strong/weak seasonal precipitation signals to the presence or absence of a certain event type and help explain the different magnitude in significant event coincidence rates observed in Figure 4.
4. Discussion and Conclusions
We have carried out a detailed analysis of ENSO imprints in global patterns of very wet/dry seasons over land. Specifically, we distinguished both, El Niño and La Niña, into two distinct flavors (East Pacific and Central Pacific) by utilizing a classification based on an extensive literature review paired with the assessment of a recently proposed complex network-based index (Wiedermann et al., 2016). From this classification, we obtained event series describing the occurrence-times of the four distinct types of ENSO. Strong seasonal precipitation anomalies have been obtained from the globally gridded GPCC rainfall data set by identifying seasons with precipitation sums above the empirical 80th (below the empirical 20th) percentile of all values for a given grid point as very wet (very dry) periods. This definition follows the spirit of the 3-month aggregate standardized precipitation index (SPI-3), which just provides a monotonic rescaling of seasonal precipitation sums according to the local distributional characteristics of seasonal rainfall. Accordingly, our results can be interpreted in terms of seasonal drought characteristics. Modifying the considered thresholds for defining very wet/dry seasons within reasonable ranges did not qualitatively alter the results reported in this work (see Supplementary Material).
We have then employed event coincidence analysis (Donges et al., 2016; Siegmund et al., 2016a) to identify grid points with significant event coincidence rates between different types of ENSO phases and very high or low seasonal precipitation sums. Our analysis confirmed that previously observed interrelationships based on linear correlation or composite analysis in many cases also apply to the timing of events corresponding to the tails of the probability distributions of seasonal precipitation sums. In addition, we identified further patterns of very wet/dry conditions with elevated probabilities alongside different ENSO types, which have to our best knowledge not been described so far. These include increased rainfall over Central Asia during CP El Niños contrasted by rainfall reduction over the same area during CP La Niñas (compare also Figures 5B,D) which implies that for such cases standard (linear) statistical methods seem to be insufficient to unveil the underlying interrelations of events. Moreover, our present analysis demonstrates that even though a general linear relationship between ENSO and precipitation might be relatively weak or even absent for a given region, dry periods or very wet seasons can still be possible consequences of the presence of certain ENSO phases. At the same time we observe that several previously reported links between ENSO and global precipitation patterns mostly apply to EP ENSO flavors as far as particularly wet/dry seasons are concerned.
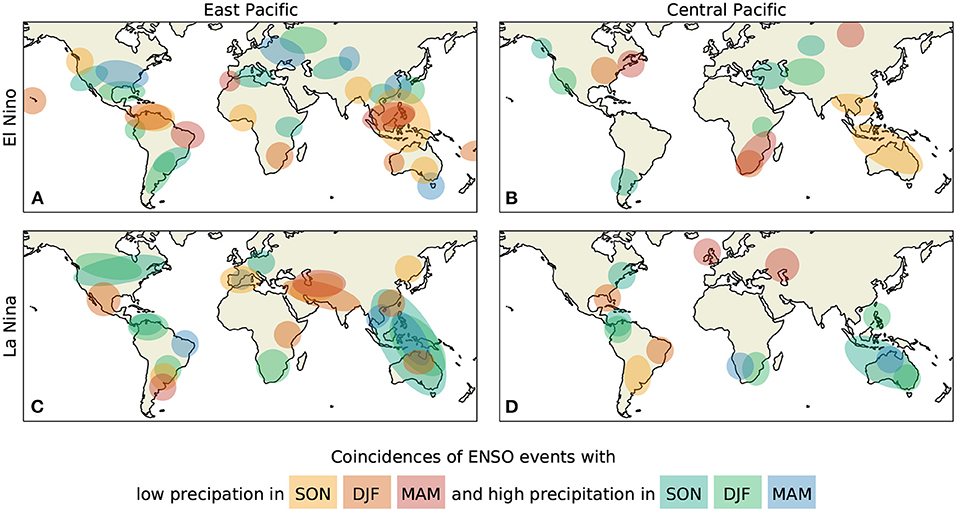
Figure 5. Schematic summary of the results presented in this work. Shaded areas indicate major regions in which very high/low seasonal precipitation sums show significant event coincidence rates with EP (A,C) or CP (B,D) El Niño (A,B) or La Niña phases (C,D).
We found that the CP flavor of El Niño (and in parts also that of La Niña) significantly, i.e., non-randomly, co-occurs alongside wet/dry seasonal precipitation signals at lower event coincidence rates which might in parts be explained by the more frequent occurrence (Hendon et al., 2009; Graf and Zanchettin, 2012; Preethi et al., 2015; Wiedermann et al., 2016) compared to its EP counterpart. This finding also suggests that the absolute number of event coincidences [i.e., the numerator in Equation (2)] between EP or CP ENSO periods with wet/dry seasonal precipitation per grid-cell might be of rather comparable size over the period of study, an effect that should be investigated more thoroughly in future research. In addition, recent studies suggest that the CP El Niño can be further discriminated into two types with distinct imprints on precipitation signals especially in the Indo-Pacific area (Wang and Wang, 2013, 2014; Wang et al., 2018). Future work should hence investigate if the comparatively lower significant event coincidence rates between CP El Niño and wet/dry seasonal conditions can potentially be attributed to the presence or absence of a further subtype of CP El Niño. Since El Niño and La Niña show a large degree of symmetry in terms of their frequency and potential for discrimination into different types (Ashok et al., 2007; Kao and Yu, 2009; Hidayat et al., 2018), a similar analysis could also be performed for La Niña as we found lower, yet significant, event coincidence rates for the CP flavor of ENSO's negative phase as well.
Along those lines, our analysis provides a complementary impact oriented view on the recently raised question whether it is actually (statistically and/or dynamically) meaningful to distinguish La Niña into two types in a similar fashion as El Niño (Kug and Ham, 2011). While some previous studies advocated for such a distinction (Ashok and Yamagata, 2009; Kao and Yu, 2009), others argued that based on correlation analyses between La Niña related SST patterns there is a lack of evidence for the existence of two distinct types (Kug et al., 2009; Ren and Jin, 2011). Contributing to this discussion, Wiedermann et al. (2016) already demonstrated that according to the transitivity index of ENSO's global teleconnections it is indeed meaningful to provide a discrimination of La Niña periods into two flavors in close analogy to El Niño. Complementing recent findings on differential hydrometeorological conditions alongside potentially distinct La Niña flavors (Shinoda et al., 2011; Magee et al., 2017; Song et al., 2017; Hidayat et al., 2018), our results further demonstrate that seasonal wet/dry patterns accompanied by EP La Niñas are generally more likely to arise in a spatially coherent way than such observed along with CP periods (Figure 4). The same finding also applies to El Niño periods, which highlights that there exists a certain symmetry between both types of ENSO phases not only in the spatial SST anomaly patterns of El Niño and La Niña themselves, but also with respect to their effects on global precipitation patterns. Thus, from an impact oriented point of view, our work provides further evidence in favor of a distinction between two flavors of La Niña indicated by the presence or absence of very wet/dry regional conditions along with either of the two types of ENSO conditions. In other words, from the viewpoint of event based statistics (and therefore not necessarily in agreement with results based on linear correlations) it appears not only reasonable, but actually relevant to discriminate La Niña into two types in a similar way as common for El Niño periods.
In conclusion, our analysis provides a detailed and global overview on the large-scale differential imprints of different ENSO phases and flavors in the emergence of very wet/dry seasons. All findings reported in this work are ultimately summarized in Figure 5, which highlights schematically the main regions where the four different types of ENSO show large scale patterns of significant event coincidence rates with very high/low seasonal precipitation. Especially with respect to the CP flavors we find a variety of regions [such as (northern) Australia or southern Africa] where El Niño and La Niña show opposite impacts in terms of wet/dry seasons (Figures 5B,D). In addition, we observe that both flavors of one ENSO phase can also display similar impacts over the same regions, such as reduced precipitation over Australia or south-east Asia for EP and CP El Niños (Figures 5A,B) or enhanced precipitation over Australia or northern South America for EP and CP La Niñas (Figures 5C,D). We further uncover unique signatures that are only observed for a single type, e.g., reduced precipitation over northern India and the Middle East for EP (and not CP) La Niñas (Figure 5C). The general trend toward less significant clusters of large-scale coincidences between ENSO and very wet/dry seasons along with CP periods is observable for both, El Niño and La Niña, as well (c.f. Figures 5A,B and Figures 5C,D). Our results thus demonstrate that a thorough discrimination of ENSO can be crucial for properly anticipating strong regional and seasonal hydrometeorological anomalies since its differential impacts may not only vary depending on the presence of El Niño and La Niña conditions but are additionally modulated by their respective EP and CP flavors.
5. Perspectives and Outlook
Future work should further apply the statistical concepts used in this work to also study ENSO related imprints on other climate variables (e.g., surface air temperature) as well as corresponding effects on socioeconomically and ecologically relevant observables like agricultural yields or water availability. This also implies that if the specific flavor of a developing El Niño or La Niña was to be detected early enough, possible threats like droughts or elevated flood risks, as well as their ecological and socio-economic consequences, could be better anticipated.
Since reliable predictions of EP or CP types of ENSO are scarce, the framework surrounding our present analysis has the potential to serve as an indirect early classification scheme of such periods based on observed globally distributed impacts. Specifically, the observation of early strong/weak climate signals either in SON or the presently ignored boreal summer (June–August, JJA) season of the onset year could be employed to assess the likelihood of approaching an ENSO phase with a specific flavor. Here, ECA could be used to analyze probabilities for specific types of seasonal climate anomalies—that could arise through a variety of conditions and drivers—to be preceded by certain ENSO periods and flavors (using so-called precursor event coincidence rates; Donges et al., 2016, see section 2.4). Such assessments would complement the estimation of trigger coincidence rates (Donges et al., 2016) at which a specific ENSO flavor is followed by a certain precipitation response as studied in our present work. The corresponding impact-based classification of ENSO periods could then be used to systematically estimate probabilities of potentially upcoming later (DJF, MAM, or even JJA of the year following the onset of an ENSO period) strong/weak precipitation seasons. In this context, we recall that for the case of instantaneous co-occurrences as studied here, precursor and trigger event coincidence rates solely differ by which of the two series (ENSO or precipitation events) is considered as the reference, i.e., the denominator in Equation (2). Since (sea or air) temperature anomalies are known to exhibit considerable persistence, it may therefore be another relevant extension of the present work to study non-instantaneous (i.e., multi-year) statistical linkages between ENSO episodes and wet/dry patterns, in which case trigger and precursor event coincidence rates become distinct statistical concepts.
Taken together, a corresponding analysis for early classification of ENSO flavors would need to be accompanied by a thorough review of recent approaches for ENSO prediction and attribution, a proper selection of climate variables beyond precipitation that potentially exhibit a mechanistic link with ENSO variability (Di Capua et al., 2019), and an associated estimation of appropriate temporal scales. Ultimately, such a predictive analysis would require a reliable validation of the obtained results by means of dividing the considered study period into training and test intervals, potentially accompanied by extending the analysis at least over the complete twentieth century or even beyond to ensure a sufficient number of events. Even though such an endeavor is clearly beyond the scope of the present work, it remains as a proposal for a potentially important subject of future research with the potential for an early attribution of EP and CP flavors to developing El Niños and La Niñas.
Finally, a more detailed intercomparison between the results obtained from traditional linear and complementary event based statistics could prove useful in assessing which regions are most affected in terms of strong climate responses to the presence of any combination of ENSO phase and flavor. Specifically, and in order to not only assess timing and regional extent of coincidences between ENSO events and precipitation signals, future work should systematically combine ECA with complementary techniques such as composite analysis to also study quantitatively the (relative) changes in magnitude of enhanced/reduced precipitation occurring alongside EP or CP flavours of ENSO. While the current work has solely focused on observational data, it should also be investigated if the reported co-occurrence patterns can be equally observed in historical simulations of state of the art coupled climate models [e.g., those contributing to the Coupled Model Intercomparison Project Phase 6 (CMIP 6)], with any difference pointing to potentially insufficiently represented key processes in the models, thereby contributing to the identification of such processes and, hence, future model improvements. Ultimately, given that the frequency and magnitude of different ENSO phases might be markedly affected by global climate change (Yeh and Kirtman, 2007; Stevenson, 2012; Cai et al., 2014, 2015), it appears additionally useful to further apply the presented framework to future climate projections in order to assess possible changes in the spatial extent and frequency of ENSO related extreme events.
Data Availability Statement
Publicly available datasets were analyzed in this study. The GPCC gridded precipitation data can be obtained directly from: https://opendata.dwd.de/climate_environment/GPCC/full_data_2018/full_data_monthly_v2018_25.nc.gz.
Author Contributions
All authors designed the study. MW and JS analyzed the data and wrote the manuscript with input from all authors. JD assisted with the analysis. RD supervised the study. MW, JD, and RD substantively revised the work.
Funding
MW, JS, and RD acknowledge funding by the German Federal Ministry for Education and Research via the BMBF projects CoSy-CC2 (grant no. 01LN1306A), GOTHAM (grant no. 01LP16MA), and ROADMAP (grant no. 01LP2002B). JD has been supported by the Stordalen Foundation. MW and JD thank the Leibniz Society (project DOMINOES) for financial support. RD acknowledges the IRTG 1740 funded by DFG and FAPESP. JS has been supported by the Evangelisches Studienwerk Villigst e.V.
Conflict of Interest
The authors declare that the research was conducted in the absence of any commercial or financial relationships that could be construed as a potential conflict of interest.
Acknowledgments
This paper was developed within the scope of the IRTG 1740/TRP 2015/50122-0, funded by the DFG/FAPESP. The authors gratefully acknowledge the European Regional Development Fund (ERDF), the German Federal Ministry of Education and Research and the Land Brandenburg for supporting this project by providing resources on the high performance computer system at the Potsdam Institute for Climate Impact Research. This manuscript has been released as a pre-print at http://arxiv.org/abs/1702.00218 (Wiedermann et al., 2020). The content of this manuscript has been partially published as part of the dissertation of Wiedermann (2018).
Supplementary Material
The Supplementary Material for this article can be found online at: https://www.frontiersin.org/articles/10.3389/fclim.2021.618548/full#supplementary-material
References
Allan, R. P., and Soden, B. J. (2008). Atmospheric warming and the amplification of precipitation extremes. Science 321, 1481–1484. doi: 10.1126/science.1160787
Antoniou, I. E., and Tsompa, E. T. (2008). Statistical analysis of weighted networks. Discrete Dyn. Nat. Soc. 2008:375452. doi: 10.1155/2008/375452
Arblaster, J., Meehl, G., and Moore, A. (2002). Interdecadal modulation of Australian rainfall. Clim. Dyn. 18, 519–531. doi: 10.1007/s00382-001-0191-y
Ashok, K., Behera, S. K., Rao, S. A., Weng, H., and Yamagata, T. (2007). El Ni no Modoki and its possible teleconnection. J. Geophys. Res. 112:C11007. doi: 10.1029/2006JC003798
Ashok, K., and Yamagata, T. (2009). Climate change: the El Ni no with a difference. Nature 461, 481–484. doi: 10.1038/461481a
Boers, N., Bookhagen, B., Barbosa, H., Marwan, N., Kurths, J., and Marengo, J. (2014). Prediction of extreme floods in the eastern Central Andes based on a complex networks approach. Nat. Commun. 5:5199. doi: 10.1038/ncomms6199
Bookhagen, B., and Strecker, M. R. (2012). Spatiotemporal trends in erosion rates across a pronounced rainfall gradient: examples from the southern Central Andes. Earth Planet. Sci. Lett. 327, 97–110. doi: 10.1016/j.epsl.2012.02.005
Cai, W., Borlace, S., Lengaigne, M., van Rensch, P., Collins, M., Vecchi, G., et al. (2014). Increasing frequency of extreme El Ni no events due to greenhouse warming. Nat. Clim. Change 4, 111–116. doi: 10.1038/nclimate2100
Cai, W., and Cowan, T. (2009). La Ni na Modoki impacts Australia autumn rainfall variability. Geophys. Res. Lett. 36:L12805. doi: 10.1029/2009GL037885
Cai, W., Wang, G., Santoso, A., McPhaden, M. J., Wu, L., Jin, F.-F., et al. (2015). Increased frequency of extreme La Ni na events under greenhouse warming. Nat. Clim. Change 5, 132–137. doi: 10.1038/nclimate2492
Camberlin, P., Janicot, S., and Poccard, I. (2001). Seasonality and atmospheric dynamics of the teleconnection between African rainfall and tropical sea-surface temperature: Atlantic vs. ENSO. Int. J. Climatol. 21, 973–1005. doi: 10.1002/joc.673
Chatterton, N. J., Goodin, J. R., McKell, C. M., Parker, R. V., and Rible, J. M. (1971). Monthly variation in the chemical composition of desert saltbush. Rangeland Ecol. Manag. 24, 37–40. doi: 10.2307/3896062
Chen, D., Lian, T., Fu, C., Cane, M. A., Tang, Y., Murtugudde, R., et al. (2015). Strong influence of westerly wind bursts on El Ni no diversity. Nat. Geosci. 8, 339–345. doi: 10.1038/ngeo2399
Chiew, F. H. S., Piechota, T. C., Dracup, J. A., and McMahon, T. A. (1998). El Ni no/Southern Oscillation and Australian rainfall, streamflow and drought: links and potential for forecasting. J. Hydrol. 204, 138–149. doi: 10.1016/S0022-1694(97)00121-2
Dai, A., and Wigley, T. M. L. (2000). Global patterns of ENSO-induced precipitation. Geophys. Res. Lett. 27, 1283–1286. doi: 10.1029/1999GL011140
Di Capua, G., Kretschmer, M., Runge, J., Alessandri, A., Donner, R. V., van den Hurk, B., et al. (2019). Long-lead statistical forecasts of the indian summer monsoon rainfall based on causal precursors. Weath. Forecast. 34, 1377–1394. doi: 10.1175/WAF-D-19-0002.1
Diaz, H. F., Hoerling, M. P., and Eischeid, J. K. (2001). ENSO variability, teleconnections and climate change. Int. J. Climatol. 21, 1845–1862. doi: 10.1002/joc.631
Domeisen, D. I., Garfinkel, C. I., and Butler, A. H. (2019). The teleconnection of El Ni no Southern Oscillation to the stratosphere. Rev. Geophys. 57, 5–47. doi: 10.1029/2018RG000596
Donges, J. F., Donner, R. V., Trauth, M. H., Marwan, N., Schellnhuber, H.-J., and Kurths, J. (2011). Nonlinear detection of paleoclimate-variability transitions possibly related to human evolution. Proc. Natl. Acad. Sci. U.S.A. 108, 20422–20427. doi: 10.1073/pnas.1117052108
Donges, J. F., Schleussner, C.-F., Siegmund, J. F., and Donner, R. V. (2016). Event coincidence analysis for quantifying statistical interrelationships between event time series: on the role of flood events as triggers of epidemic outbreaks. Eur. Phys. J.-Spec. Top. 225, 471–487. doi: 10.1140/epjst/e2015-50233-y
Donges, J. F., Zou, Y., Marwan, N., and Kurths, J. (2009). Complex networks in climate dynamics. Eur. Phys. J.-Spec. Top. 174, 157–179. doi: 10.1140/epjst/e2009-01098-2
Donner, R. V., Wiedermann, M., and Donges, J. F. (2017). “Complex network techniques for climatological data analysis,” in Nonlinear and Stochastic Climate Dynamics, eds C. L. Franzke and T. J. O'Kane (Cambridge University Press), 159–183. doi: 10.1017/9781316339251.007
Easterling, D. R., Evans, J., Groisman, P. Y., Karl, T., Kunkel, K. E., and Ambenje, P. (2000). Observed variability and trends in extreme climate events: a brief review. Bull. Am. Meteor. Soc. 81:417. doi: 10.1175/1520-0477(2000)081<0417:OVATIE>2.3.CO;2
Feng, J., and Chen, W. (2014). Influence of the IOD on the relationship between El Ni no Modoki and the East Asian-western North Pacific summer monsoon. Int. J. Climatol. 34, 1729–1736. doi: 10.1002/joc.3790
Freund, M. B., Henley, B. J., Karoly, D. J., McGregor, H. V., Abram, N. J., and Dommenget, D. (2019). Higher frequency of Central Pacific El Ni no events in recent decades relative to past centuries. Nat. Geosci. 12, 450–455. doi: 10.1038/s41561-019-0353-3
Graf, H.-F., and Zanchettin, D. (2012). Central Pacific El Ni no, the subtropical bridge, and Eurasian climate. J. Geophys. Res. 117:D01102. doi: 10.1029/2011JD016493
Guthrie, R. H., Mitchell, S. J., Lanquaye-Opoku, N., and Evans, S. G. (2010). Extreme weather and landslide initiation in coastal British Columbia. Quart. J. Eng. Geol. Hydrogeol. 43, 417–428. doi: 10.1144/1470-9236/08-119
Guttman, N. B. (1999). Accepting the standardized precipitation index: a calculation algorithm 1. J. Am. Water Res. Assoc. 35, 311–322. doi: 10.1111/j.1752-1688.1999.tb03592.x
Hendon, H. H., Lim, E., Wang, G., Alves, O., and Hudson, D. (2009). Prospects for predicting two flavors of El Ni no. Geophys. Res. Lett. 36:L19713. doi: 10.1029/2009GL040100
Hidayat, R., Juniarti, M., and Maŕufah, U. (2018). Impact of La Ni na and La Ni na Modoki on Indonesia rainfall variability. IOP Conf. Ser. Earth Environ. Sci. 149:012046. doi: 10.1088/1755-1315/149/1/012046
Hoell, A., Funk, C., Magadzire, T., Zinke, J., and Husak, G. (2014). El Ni no-Southern Oscillation diversity and Southern Africa teleconnections during Austral Summer. Clim. Dyn. 45, 1583–1599. doi: 10.1007/s00382-014-2414-z
Houston, J. (2006). Variability of precipitation in the Atacama Desert: its causes and hydrological impact. Int. J. Climatol. 26, 2181–2198. doi: 10.1002/joc.1359
Hu, Z.-Z., Kumar, A., Jha, B., Wang, W., Huang, B., and Huang, B. (2011). An analysis of warm pool and cold tongue El Ni nos: air-sea coupling processes, global influences, and recent trends. Clim. Dyn. 38, 2017–2035. doi: 10.1007/s00382-011-1224-9
Huang, B., L'Heureux, M., Hu, Z.-Z., and Zhang, H.-M. (2016). Ranking the strongest ENSO events while incorporating SST uncertainty. Geophys. Res. Lett. 43, 9165–9172. doi: 10.1002/2016GL070888
Ide, T., Brzoska, M., Donges, J. F., and Schleussner, C.-F. (2020). Multi-method evidence for when and how climate-related disasters contribute to armed conflict risk. Glob. Environ. Chang. 62:102063. doi: 10.1016/j.gloenvcha.2020.102063
Kane, R. (1997). Prediction of droughts in north-east Brazil: Role of ENSO and use of periodicities. Int. J. Climatol. 17, 655–665. doi: 10.1002/(SICI)1097-0088(199705)17:6<655::AID-JOC144>3.0.CO;2-1
Kao, H.-Y., and Yu, J.-Y. (2009). Contrasting Eastern-Pacific and Central-Pacific types of ENSO. J. Clim. 22, 615–632. doi: 10.1175/2008JCLI2309.1
Karl, T. R., and Trenberth, K. E. (2003). Modern global climate change. Science 302, 1719–1723. doi: 10.1126/science.1090228
Karpouzoglou, T., and Barron, J. (2014). A global and regional perspective of rainwater harvesting in sub-Saharan Africa's rainfed farming. Phys. Chem. Earth 72–75, 43–53. doi: 10.1016/j.pce.2014.09.009
Kim, W., Yeh, S.-W., Kim, J.-H., Kug, J.-S., and Kwon, M. (2011). The unique 2009-2010 El Ni no event: a fast phase transition of warm pool El Ni no to La Ni na. Geophys. Res. Lett. 38:L15809. doi: 10.1029/2011GL048521
Kistler, R., Collins, W., Saha, S., White, G., Woollen, J., Kalnay, E., et al. (2001). The NCEP-NCAR 50-Year reanalysis: monthly means CD-ROM and documentation. Bull. Am. Meteor. Soc. 82, 247–267. doi: 10.1175/1520-0477(2001)082<0247:TNNYRM>2.3.CO;2
Kug, J.-S., and Ham, Y.-G. (2011). Are there two types of La Nina? Geophys. Res. Lett. 38:L16704. doi: 10.1029/2011GL048237
Kug, J.-S., Jin, F.-F., and An, S.-I. (2009). Two types of El Ni no events: Cold Tongue El Ni no and Warm Pool El Ni no. J. Clim. 22, 1499–1515. doi: 10.1175/2008JCLI2624.1
Leblanc, M., Tweed, S., Van Dijk, A., and Timbal, B. (2012). A review of historic and future hydrological changes in the Murray-Darling Basin. Glob. Planet. Chang. 80, 226–246. doi: 10.1016/j.gloplacha.2011.10.012
Levine, A., Jin, F. F., and McPhaden, M. J. (2016). Extreme noise-extreme El Ni no: How state-dependent noise forcing creates El Ni no-La Ni na asymmetry. J. Clim. 29, 5483–5499. doi: 10.1175/JCLI-D-16-0091.1
Lewis, S. L., Brando, P. M., Phillips, O. L., Heijden, G. M. F. v. d., and Nepstad, D. (2011). The 2010 Amazon drought. Science 331, 554–554. doi: 10.1126/science.1200807
Lorenz, C., and Kunstmann, H. (2012). The hydrological cycle in three state-of-the-art reanalyses: Intercomparison and performance analysis. J. Hydrometeorol. 13, 1397–1420. doi: 10.1175/JHM-D-11-088.1
Lute, A. C., and Abatzoglou, J. T. (2014). Role of extreme snowfall events in interannual variability of snowfall accumulation in the western United States. Water Resour. Res. 50, 2874–2888. doi: 10.1002/2013WR014465
Magee, A. D., Verdon-Kidd, D. C., Diamond, H. J., and Kiem, A. S. (2017). Influence of ENSO, ENSO Modoki, and the IPO on tropical cyclogenesis: a spatial analysis of the southwest Pacific region. Int. J. Climatol. 37, 1118–1137. doi: 10.1002/joc.5070
Malik, N., Marwan, N., and Kurths, J. (2010). Spatial structures and directionalities in monsoonal precipitation over south Asia. Nonlin. Proc. Geophys. 17:371. doi: 10.5194/npg-17-371-2010
Marathe, S., Ashok, K., Swapna, P., and Sabin, T. (2015). Revisiting El Ni no Modokis. Clim. Dyn. 45, 3527–3545. doi: 10.1007/s00382-015-2555-8
Neelin, J. D., Chou, C., and Su, H. (2003). Tropical drought regions in global warming and El Ni no teleconnections. Geophys. Res. Lett. 30:2275. doi: 10.1029/2003GL018625
Newman, M. (2003). The structure and function of complex networks. SIAM Rev. 45, 167–256. doi: 10.1137/S003614450342480
Nicholson, S., and Selato, J. (2000). The influence of La Ni na on African rainfall. Int. J. Climatol. 20, 1761–1776. doi: 10.1002/1097-0088(20001130)20:14<1761::AID-JOC580>3.0.CO;2-W
Phillips, O. L., Arag ao, L. E. O. C., Lewis, S. L., Fisher, J. B., Lloyd, J., López-González, G., et al. (2009). Drought sensitivity of the Amazon rainforest. Science 323, 1344–1347. doi: 10.1126/science.1164033
Pozo-Vázquez, D., Gámiz-Fortis, S. R., Tovar-Pescador, J., Esteban-Parra, M. J., and Castro-Díez, Y. (2005). El Ni no-Southern Oscillation events and associated European winter precipitation anomalies. Int. J. Climatol. 25, 17–31. doi: 10.1002/joc.1097
Preethi, B., Sabin, T., Adedoyin, J., and Ashok, K. (2015). Impacts of the ENSO Modoki and other tropical Indo-Pacific climate-drivers on African rainfall. Sci. Rep. 5:16653. doi: 10.1038/srep16653
Quian Quiroga, R., Kreuz, T., and Grassberger, P. (2002). Event synchronization: a simple and fast method to measure synchronicity and time delay patterns. Phys. Rev. E 66:041904. doi: 10.1103/PhysRevE.66.041904
Radebach, A., Donner, R. V., Runge, J., Donges, J. F., and Kurths, J. (2013). Disentangling different types of El Ni no episodes by evolving climate network analysis. Phys. Rev. E 88:052807. doi: 10.1103/PhysRevE.88.052807
Rammig, A., Wiedermann, M., Donges, J. F., Babst, F., von Bloh, W., Frank, D., et al. (2015). Coincidences of climate extremes and anomalous vegetation responses: comparing tree ring patterns to simulated productivity. Biogeosciences 12, 373–385. doi: 10.5194/bg-12-373-2015
Rataj, E., Kunzweiler, K., and Garthus-Niegel, S. (2016). Extreme weather events in developing countries and related injuries and mental health disorders-a systematic review. BMC Public Health 16:1020. doi: 10.1186/s12889-016-3692-7
Ratnam, J., Behera, S., Masumoto, Y., and Yamagata, T. (2014). Remote effects of El Ni no and Modoki events on the austral summer precipitation of southern Africa. J. Clim. 27, 3802–3815. doi: 10.1175/JCLI-D-13-00431.1
Ren, H.-L., and Jin, F.-F. (2011). Ni no indices for two types of ENSO. Geophys. Res. Lett. 38:L04704. doi: 10.1029/2010GL046031
Rogers, J. C. (1988). Precipitation variability over the Caribbean and Tropical Americas associated with the Southern Oscillation. J. Clim. 1, 172–182. doi: 10.1175/1520-0442(1988)001<0172:PVOTCA>2.0.CO;2
Ropelewski, C. F., and Halpert, M. S. (1986). North American precipitation and temperature patterns associated with the El Ni no/Southern Oscillation (ENSO). Mon. Weather Rev. 114, 2352–2362. doi: 10.1175/1520-0493(1986)114<2352:NAPATP>2.0.CO;2
Ropelewski, C. F., and Halpert, M. S. (1987). Global and regional scale precipitation patterns associated with the El Ni no/Southern Oscillation. Mon. Weather Rev. 115, 1606–1626. doi: 10.1175/1520-0493(1987)115<1606:GARSPP>2.0.CO;2
Ropelewski, C. F., and Halpert, M. S. (1996). Quantifying Southern Oscillation-Precipitation relationships. J. Clim. 9, 1043–1059. doi: 10.1175/1520-0442(1996)009<1043:QSOPR>2.0.CO;2
Rudolf, B., Hauschild, H., Rueth, W., and Schneider, U. (1994). “Terrestrial precipitation analysis: Operational method and required density of point measurements,” in Global Precipitations and Climate Change, Number 26 in NATO ASI Series, eds M. Desbois and F. Désalmand (Berlin; Heidelberg: Springer), 173–186. doi: 10.1007/978-3-642-79268-7_10
Saramäki, J., Kivelä, M., Onnela, J.-P., Kaski, K., and Kertész, J. (2007). Generalizations of the clustering coefficient to weighted complex networks. Phys. Rev. E 75:027105. doi: 10.1103/PhysRevE.75.027105
Schleussner, C.-F., Donges, J. F., Donner, R. V., and Schellnhuber, H. J. (2016). Armed-conflict risks enhanced by climate-related disasters in ethnically fractionalized countries. Proc. Natl. Acad. Sci. U.S.A. 113, 9216–9221. doi: 10.1073/pnas.1601611113
Schneider, U., Becker, A., Finger, P., Meyer-Christoffer, A., and Ziese, M. (2018). GPCC Full Data Monthly Version 2018 at 2.5circ: Monthly Land-Surface Precipitation from Rain-Gauges Built on GTS-Based and Historic Data: Gridded Monthly Totals. Global Precipitation Climatology Centre (GPCC) at Deutscher Wetterdienst.
Shaman, J., and Tziperman, E. (2010). An atmospheric teleconnection linking ENSO and southwestern European precipitation. J. Clim. 24, 124–139. doi: 10.1175/2010JCLI3590.1
Shinoda, T., Hurlburt, H. E., and Metzger, E. J. (2011). Anomalous tropical ocean circulation associated with La Ni na Modoki. J. Geophys. Res.-Oceans 116:C12001. doi: 10.1029/2011JC007304
Siegmund, J. F., Sanders, T. G. M., Heinrich, I., van der Maaten, E., Simard, S., Helle, G., et al. (2016a). Meteorological drivers of extremes in daily stem radius variations of Beech, Oak, and Pine in Northeastern Germany: an event coincidence analysis. Front. Plant. Sci. 7:733. doi: 10.3389/fpls.2016.00733
Siegmund, J. F., Wiedermann, M., Donges, J., and Donner, R. V. (2016b). Impact of temperature and precipitation extremes on the flowering dates of four German wildlife shrub species. Biogeosciences 13, 5541–5555. doi: 10.5194/bg-13-5541-2016
Song, L., Chen, S., Chen, W., and Chen, X. (2017). Distinct impacts of two types of La Ni na events on Australian summer rainfall. Int. J. Climatol. 37, 2532–2544. doi: 10.1002/joc.4863
Stevenson, S. (2012). Significant changes to ENSO strength and impacts in the twenty-first century: results from CMIP5. Geophys. Res. Lett. 39:L17703. doi: 10.1029/2012GL052759
Svoboda, M., Hayes, M., and Wood, D. (2012). Standardized Precipitation Index User Guide. World Meteorological Organization Geneva.
Taschetto, A. S., and England, M. H. (2009). El Ni no Modoki impacts on Australian rainfall. J. Clim. 22, 3167–3174. doi: 10.1175/2008JCLI2589.1
Tedeschi, R. G., Cavalcanti, I. F., and Grimm, A. M. (2013). Influences of two types of ENSO on South American precipitation. Int. J. Climatol. 33, 1382–1400. doi: 10.1002/joc.3519
Thomas, N., and Nigam, S. (2018). Twentieth-century climate change over Africa: seasonal hydroclimate trends and sahara desert expansion. J. Clim. 31, 3349–3370. doi: 10.1175/JCLI-D-17-0187.1
Trenberth, K. E. (1997). The definition of El Ni no. Bull. Am. Meteor. Soc. 78, 2771–2777. doi: 10.1175/1520-0477(1997)078<2771:TDOENO>2.0.CO;2
Tsonis, A. A., Swanson, K. L., and Roebber, P. J. (2006). What do networks have to do with climate? Bull. Amer. Meteor. Soc. 87, 585–595. doi: 10.1175/BAMS-87-5-585
van Dijk, A. I. J. M., Beck, H. E., Crosbie, R. S., de Jeu, R. A. M., Liu, Y. Y., Podger, G. M., et al. (2013). The millennium drought in southeast Australia (2001–2009): Natural and human causes and implications for water resources, ecosystems, economy, and society. Water Resour. Res. 49, 1040–1057. doi: 10.1002/wrcr.20123
Wang, C., and Wang, X. (2013). Classifying El Ni no Modoki I and II by different impacts on rainfall in southern China and typhoon tracks. J. Climate 26, 1322–1338. doi: 10.1175/JCLI-D-12-00107.1
Wang, X., Tan, W., and Wang, C. (2018). A new index for identifying different types of El Ni no Modoki events. Clim. Dyn. 50, 2753–2765. doi: 10.1007/s00382-017-3769-8
Wang, X., and Wang, C. (2014). Different impacts of various El Ni no events on the Indian Ocean Dipole. Clim. Dyn. 42, 991–1005. doi: 10.1007/s00382-013-1711-2
Weng, H., Wu, G., Liu, Y., Behera, S. K., and Yamagata, T. (2011). Anomalous summer climate in China influenced by the tropical Indo-Pacific Oceans. Clim. Dyn. 36, 769–782. doi: 10.1007/s00382-009-0658-9
Wiedermann, M. (2018). Classification of complex networks in spatial, topological and information theoretic domains (Ph.D. thesis). Humboldt-Universität zu Berlin, Berlin, Germany.
Wiedermann, M., Radebach, A., Donges, J. F., Kurths, J., and Donner, R. V. (2016). A climate network-based index to discriminate different types of El Ni no and La Ni na. Geophys. Res. Lett. 43, 7176–7185. doi: 10.1002/2016GL069119
Wiedermann, M., Siegmund, J. F., Donges, J. F., and Donner, R. V. (2020). Differential imprints of distinct enso flavors in global patterns of very low and high seasonal precipitation. arXiv [Preprint]. 1702.00218.
Wolf, F., Bauer, J., Boers, N., and Donner, R. V. (2020). Event synchrony measures for functional climate network analysis: a case study on South American rainfall dynamics. Chaos 30:033102. doi: 10.1063/1.5134012
Yeh, S.-W., and Kirtman, B. P. (2007). ENSO amplitude changes due to climate change projections in different coupled models. J. Clim. 20, 203–217. doi: 10.1175/JCLI4001.1
Yuan, Y. and Yan, H. (2013). Different types of La Ni na events and different responses of the tropical atmosphere. Chin. Sci. Bull. 58, 406–415. doi: 10.1007/s11434-012-5423-5
Keywords: El Niño Southern Oscillation, precipitation, Central Pacific El Niño (El Niño Modoki), Central Pacific La Niña, event coincidence analysis
Citation: Wiedermann M, Siegmund JF, Donges JF and Donner RV (2021) Differential Imprints of Distinct ENSO Flavors in Global Patterns of Very Low and High Seasonal Precipitation. Front. Clim. 3:618548. doi: 10.3389/fclim.2021.618548
Received: 17 October 2020; Accepted: 20 January 2021;
Published: 12 February 2021.
Edited by:
Marcelo Barreiro, Universidad de la República, UruguayReviewed by:
Cristina Masoller, Universitat Politecnica de Catalunya, SpainAnnalisa Cherchi, Institute of Atmospheric Sciences and Climate (CNR-ISAC), Italy
Copyright © 2021 Wiedermann, Siegmund, Donges and Donner. This is an open-access article distributed under the terms of the Creative Commons Attribution License (CC BY). The use, distribution or reproduction in other forums is permitted, provided the original author(s) and the copyright owner(s) are credited and that the original publication in this journal is cited, in accordance with accepted academic practice. No use, distribution or reproduction is permitted which does not comply with these terms.
*Correspondence: Marc Wiedermann, bWFyY3dpZUBwaWstcG90c2RhbS5kZQ==