 Soheil Shayegh
 Valentina Bosetti1,2
- 1RFF-CMCC European Institute on Economics and the Environment, Centro Euro-Mediterraneo sui Cambiamenti Climatici, Milan, Italy
- 2Department of Economics, Bocconi University, Milan, Italy
- 3Department of Management and Economics, Politecnico di Milano, Milan, Italy
Direct air capture (DAC) technologies are promising but speculative. Their prospect as an affordable negative emissions option that can be deployed in large scale is particularly uncertain. Here, we report the results of an expert elicitation about the evolution of techno-economic factors characterizing DAC over time and across climate scenarios. This is the first study reporting technical experts' judgments on future costs under different scenarios, for two time periods, for two policy options, and for two different DAC technologies. Experts project CO2 removal costs to decline significantly over time but to remain expensive (median by mid-century: around 200 USD/tCO2). Nonetheless, the role of direct air capture in a 2°C policy scenario is expected to be significant (by 2050: 1.7 [0.2, 5.9] GtCO2)1. Projections align with scenarios from integrated assessment model (IAM) studies. Agreement across experts regarding which type of DAC technology might prevail is low. Energy usage and policy support are considered the most critical factors driving these technologies' future growth.
1. Introduction
According to the Special Report on Global Warming of 1.5° C (SR1.5) by the Intergovernmental Panel on Climate Change (IPCC), achieving climate targets such as those outlined in the Paris agreement, requires a fast transition of energy and economic systems to renewable, clean, and sustainable alternatives as well as substantial deployment of carbon dioxide removal (CDR) technologies (Allen et al., 2019). Across future socioeconomic pathways and models, most scenarios staying well below 2°C by the end of the century require net-zero greenhouse gas (GHG) emissions mid-century and negative aggregate emissions after that (Rogelj et al., 2018). Carbon dioxide removal, which is essential to achieve these objectives, includes a wide range of terrestrial and ocean-based technologies from bio-energy with carbon capture and storage (BECCS) (Azar et al., 2010), to direct air capture (DAC) (Socolow et al., 2011), and indirect ocean capture (IOC) (de Lannoy et al., 2018).
However, the technologies' effectiveness in permanently removing GHG emissions from the atmosphere depends on how system boundaries are defined and differ substantially across different negative emission technologies (Tanzer and Ramirez, 2019). Furthermore, the scale of carbon dioxide removal required to achieve climate targets of 1.5° and 2°C is currently unproven. There is a wide range of technical, environmental, social, and ethical risks associated with such massive deployment (Fuss et al., 2014; Intergovernmental Panel on Climate Change, 2018; Lenzi, 2018) with the required spending estimated to reach up to a third of government general expenditure in developed countries (Bednar et al., 2019). This adds to existing uncertainties about the future cost and capacity of CDR technologies (Waisman et al., 2019).
In recent years, DAC has attracted investors and policymakers' attention to the point that it is now considered an appealing CDR strategy. This is because of its potential capability of reversing the increase in atmospheric CO2 concentrations by directly removing CO2 from the atmosphere without substantial interference in the energy, food, and water infrastructure (Smith et al., 2016; Wilcox et al., 2017). There are currently two types of DAC technologies in the commercial stage using either solid sorbent or liquid solvent materials for capturing CO2 from the ambient air.
DAC plants can be installed anywhere and can use various types of energy input, making them an attractive solution compared to other CDR methods such as BECCS, which face stricter geographical constraints (Fridahl and Lehtveer, 2018). However, to achieve net negative emissions, DAC technologies need to be coupled with renewable energy sources such as solar and wind (Breyer et al., 2019), limiting the feasibility of DAC projects.
The National Academy of Sciences (NAS) report on negative emissions technologies has provided the latest and most reliable estimates for DAC technologies' cost and capacities (National Academies of Sciences Engineering and Medicine, 2019). Further assessment of DAC technologies reveals that achieving net-zero emissions by mid century in the US alone would require between 560 and 1,850 MtCO2 to be removed by DAC technology and then permanently stored underground annually (Larsen et al., 2019). However, there are only few studies on techno-economic assessment of DAC technologies (Keith et al., 2018; Azarabadi and Lackner, 2019; Fasihi et al., 2019) and their potential contribution to mitigation efforts (Realmonte et al., 2019; Fuhrman et al., 2020). These studies have highlighted the sensitivity of DAC on techno-economic assumptions and the pace and extent of capacity addition. All of these assumptions are highly speculative, given the early stage of technological development.
A structured expert elicitation can help narrow key parameters and quantify uncertainties in the form of probabilistic distributions that can be used in subsequent modeling analysis of decarbonization pathways. Furthermore, the evolution of the cost and capacity factors over time and across policies is missing in DAC technologies' current techno-economic assessments. Although insightful, the quantitative results of expert elicitation studies should be treated with caution. For example, between 2008 and 2011, several expert elicitation studies were conducted to project the future solar photo-voltaic systems' future costs in 2030 (Curtright et al., 2008; Baker et al., 2009; Bosetti et al., 2012; Verdolini et al., 2015). However, a recent study showed that the actual price in 2017–18 was lower than the median projections for 2030 (Nemet, 2019). Therefore, in addition to providing the median projections, we have emphasized on identifying the range of uncertainties in experts' judgements and have presented the results in the context of their background policy scenarios.
In this paper, we report the results of an elicitation of 18 experts in negative emissions and direct air capture technologies and the economic and policy issues. Expert elicitation studies have been widely used to gauge uncertainty surrounding the future costs of various energy technologies (Wiser et al., 2016; Anadon et al., 2017; Thomas et al., 2017; Baik et al., 2020). Our survey was designed to elicit information about DAC technologies' future in two future scenarios of climate change policies; policy as usual (PAU) and a stringent climate policy consistent with the 2°C target (2DC).
Under each scenario, experts were first asked to choose a technology that they thought will be the dominant DAC technology in 2050. Then they provided the 10th, 50th, and 90th percentiles of the cost and annual installed capacity of the chosen DAC technology in the present (year 2020) and in the future (year 2050). The current cost estimates of DAC technologies vary based on the material used in the capturing process and other assumptions about the capturing and regeneration units' design. Therefore, they are subject to a wide range of uncertainty (Socolow et al., 2011; Keith et al., 2018; Tollefson, 2018; National Academies of Sciences Engineering and Medicine, 2019). For all additional questions, experts were asked to provide further information referring only to the PAU scenario and DAC technology choice under this scenario.
1.1. DAC Technologies
Every DAC technology achieves the objective of capturing carbon from the ambient air through two distinct phases: carbon dioxide capture, and regeneration. First, a chemical is used to capture carbon from ambient air and binds with it in a contactor. The choice of the carbon capturing material is the key determining factor in designing a DAC plant at this phase, as it can be either a solid sorbent or a liquid solvent. During the regeneration phase, captured carbon is separated from the binding chemical. The regeneration process requires a substantial amount of energy in the form of heat, electricity, pressure, or a combination of them depending on the type of the material used in the capturing process. After the removal of the CO2, the material will be regenerated for reuse. At the same time, the captured CO2 is sent out for storage or utilization (Sanz-Perez et al., 2016). Figure 1 represents the general setup of a DAC process with capture and regeneration phases.
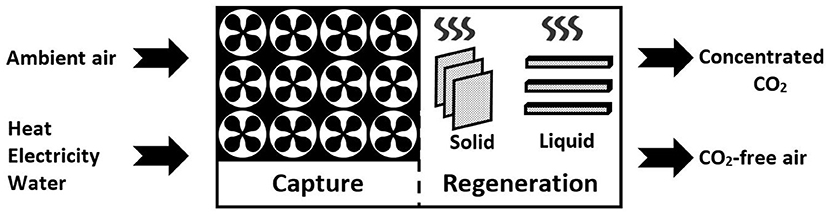
Figure 1. A schematic DAC facility consists of two main phases: Capturing CO2 from the ambient air and then releasing it through the regeneration process.
There are currently two main DAC technologies available at the commercial stage, one liquid and one solid. The liquid solvent system uses a hydroxide solution (NaOH or KOH) that is highly binding and reacts quickly with the CO2 from the air to form water and carbonate in the contractor. In the regeneration unit, the carbonate is heated to about 900°C to release a high-purity CO2 gas that can be further processed for sequestration and/or utilization (Socolow et al., 2011; National Academies of Sciences Engineering and Medicine, 2019). Several designs and materials have been proposed for this process (Baciocchi et al., 2006; Zeman, 2007; Holmes et al., 2013; Li et al., 2015). Currently, the only commercial liquid solvent-based plant uses potassium hydroxide (KOH) and its techno-economic assessment has been published in Keith et al. (2018).
The second technology uses solid sorbent materials that require lower temperatures in the regeneration process (Beuttler et al., 2019). Another advantage of this setup is its flexibility, allowing a modular design to be scaled up easily. Like the liquid solvent system, many different setups and materials have been proposed for the literature's solid sorbent system (Choi et al., 2012; Kulkarni and Sholl, 2012; Sinha et al., 2017). However, currently, only two companies are developing this technology at a commercial scale (Gambhir and Tavoni, 2019).
Regardless of the type of the material used for capturing carbon, the key factor in ensuring the successful net removal of CO2 is integrating the DAC system with low-carbon energy sources such as solar and wind for electricity and natural gas for heat (Gambhir and Tavoni, 2019).
1.2. Future Climate Scenarios
The future growth of DAC technologies depends on the type of climate change mitigation and adaption policies adopted by the international community. These policy options range from minimum efforts to curb greenhouse gas emissions to aggressive decarbonization pathways that ensure the increase in global mean temperature remains under 1.5° or 2°C as outlined in the Paris agreement (Rogelj et al., 2018). As climate policies become more stringent and carbon budget becomes tighter, the need for negative emission technologies increases (Anderson and Peters, 2016). In this survey, we consider two climate change scenarios with different implications for the development and deployment of DAC technologies:
1. Policy as usual (PAU): under this scenario future climate policies would be coherent with efforts planned in the Intended Nationally Determined Contributions (INDCs) (Levin et al., 2015). Under the INDC commitments, and excluding the climate neutrality targets which have been announced after the elicitation took place, the global mean temperature is likely to rise by 2.6–3.1° C by 2100 (Rogelj et al., 2016). Future development of DAC technologies under the PAU scenario will be mainly driven by factors outside the direct government policy interventions, including private sector R&D investments, emerging demand for carbon utilization, and other market mechanisms.
2. Stringent climate policy consistent with the 2°C target (2DC): under this scenario coordinated international efforts will reduce emissions in line with the long-term Paris agreement goal of keeping global temperature rise well below 2°C. According to the IPCC 1.5SR, this requires achieving global carbon neutrality by 2050–60 (Intergovernmental Panel on Climate Change, 2018). The 2DC scenario requires deployment of negative emissions technologies especially to achieve the climate targets after 2030 (Rogelj et al., 2016). Future development of DAC technologies under this scenario is therefore, directly affected by climate policies aimed at reaching the 2°C target and by competition with other negative emission technologies or mitigation options.
Presenting the experts in our survey with these two very different policy scenarios, has allowed us not only to provide a median estimate of future cost and capacity of DAC technologies under each scenario but also to compare these estimates and to draw some insights from on how the experts foresee the role of DAC technologies in shaping future climate policies.
2. Materials and Methods
In our survey, we asked experts to provide judgements about the future costs and capacity of these DAC technologies, how their technical specifications will evolve, and what non-technical barriers could prevent their diffusion. The survey was designed, developed, and conducted according to expert elicitation guidelines developed in the last few decades (Cooke and Goossens, 2000).
Elicitation is a structured procedure of collecting scientific data in the form of expert judgment (Cooke, 1991; Morgan, 2014). The participating experts are asked to express their professional judgment about an uncertain quantity such as cost or capacity of an emerging technology by providing information about their subjective distribution over this quantity's possible values (Cooke and Goossens, 2000). If more than one expert participates in the elicitation, a procedure of aggregation will be performed to synthesize their knowledge and express it in the form of a single probability distribution function (O'Hagan et al., 2006). While, elicitation is not a sampling exercise to statistically represent the population's view, the choice of experts in the elicitation procedure should reflect the broad judgments and professional opinions that exist in the field. The required number of experts which should be included in an expert elicitation survey is indeed very subjective and depends on the characteristics of the subject matter (Morgan, 2014).
However, even with a careful selection of the experts, elicitation surveys are subject to biases known to any human decision-making process (Walls and Quigley, 2001). To minimize the impacts of such biases, we carefully analyzed the potential biases. We followed the procedure outlined for eliciting the future prospects of renewable energy technologies to address the potential biases in our elicitation protocol (Bosetti et al., 2012).
We designed a two-stage procedure to eliminate the bias in expert selection and in choosing the uncertain parameters. In the first phase (exploratory phase) of the project, we interviewed 13 experts online from June to August 2019. The list of participants in the exploratory phase is provided in Supplementary Material. The main purpose of these interviews was, therefore to address the following two biases.
• Expert selection bias: we asked the participants in the exploratory phase to identify other experts that should be contacted in the main phase of the project, and
• Parameter selection bias: we asked the participants in the exploratory phase to identify the pressing issues that the experts believed could be addressed through a formal expert elicitation survey.
At the end of the exploratory phase, 30 experts were identified and contacted for the survey's main phase. Out of these 30 experts, 18 agreed to participate in the survey. We tried to choose the pool of experts with broad affiliation, geographical representation, and expertise background as shown in Figure 2. The experts represented both industry and academia with backgrounds in chemical engineering, energy engineering, energy economics and policy, and DAC development. Currently, there are only a few DAC plants in operation in Europe and North America. Our experts are similarly from these two geographical locations. Since DAC is still considered new technology, most research on DAC technologies is focused on optimizing the chemical properties of the absorbents/adsorbents and the chemical processes involved in capturing and regeneration phase. Therefore, it is not surprising to see that most of the experts in our study had chemical engineering or energy engineering background. However, we also included experts with economics and policy background and empirical experts and industry representatives to have a balanced mix of professional judgment opinions. Table 1 shows the list of experts and their affiliation. All answers are anonymously reported in the rest of the paper.
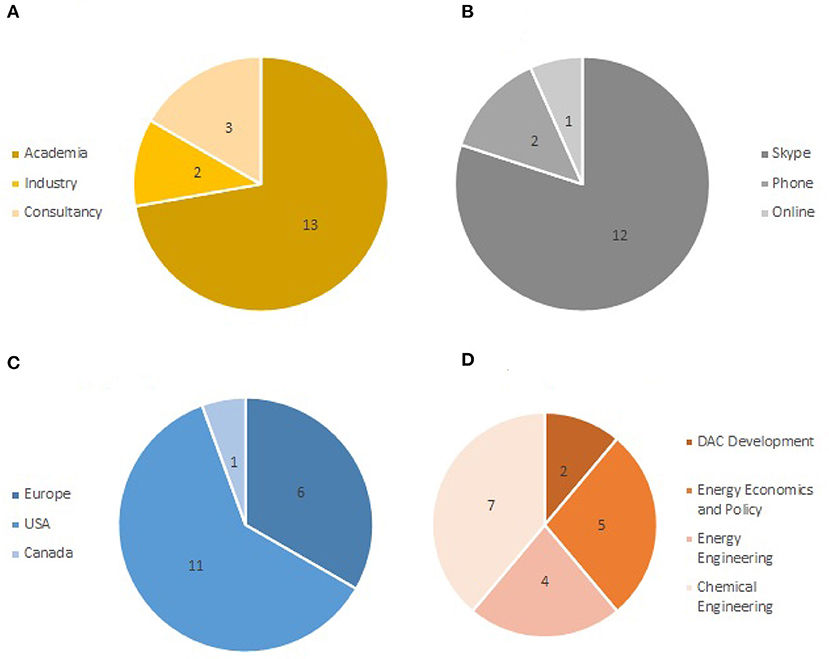
Figure 2. Expert elicitation coverage in terms of (A) experts affiliation, (B) interview method, (C) experts location, and (D) experts background.
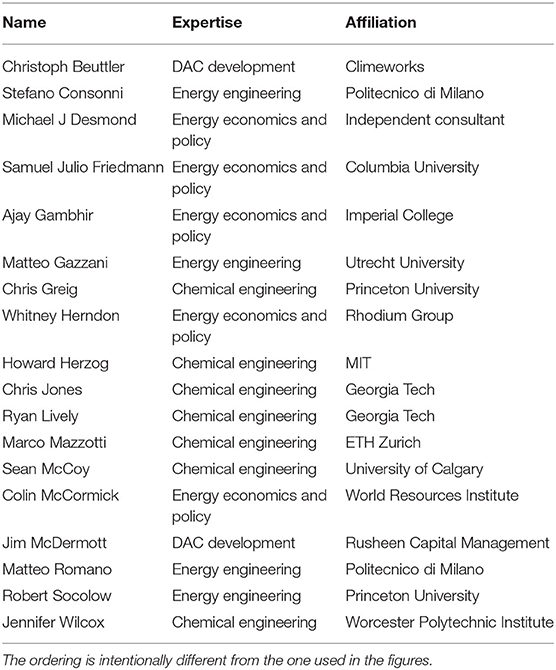
Table 1. List of experts in the main phase in alphabetical order by last names.
The objective of the main phase of the survey was to assess the future technical developments and costs of available DAC technologies for removing carbon dioxide from the air. We particularly focused on liquid solvent and solid sorbent technologies as they are at different levels of development and commercial deployment. The experts were given an option to provide techno-economic estimates for any other DAC technology beyond these two types. However, none of the experts chose to discuss an alternative DAC technology. The questionnaire was divided into three sections:
1. Assessing the cost and capacity of DAC technologies under two future scenarios o climate change policy (i.e., 2DC scenario and PAU scenario);
2. Identifying the current and future technical requirements for DAC deployment in terms of required energy, temperature, land, etc.;
3. Evaluating critical non-technical factors including growth barriers and supporting policies that will have an effect on future deployment of DAC technologies
We surveyed through interviews to eliminate any misinterpretation of the questions and clarify the experts' answers where needed. The interviews included 12 via Skype, 3 in-person, and 2 via phone from November 2019 to March 2020 (see Figure 2B). Only one person used the link to the online survey without having an interview. At the beginning of each interview we provided experts with a set of practice questions unrelated to DAC technologies to help the experts get familiar with the elicitation procedure and gauge their uncertainty. In the main part of the survey, few experts responded partially or preferred not to answer one or more questions. The list of survey questions is provided at the end of Supplementary Material.
To identify uncertainty in experts' assessment, they were asked to provide low, median, and high estimates corresponding to the 10th, 50th, and 90th percentiles of the current and future costs, capacity, and performance of DAC technologies under 2DC and PAU scenarios. For each DAC technology, we report the results at the individual level for each expert and at an aggregated level for the group of experts. The quantitative approach to construct individual distributions from the 10th, 50th, and 90th percentiles are presented in Supplementary Materials. The “aggregated” values are obtained from combining the individual expert's probability distributions with equal weights. Combining the judgements of experts participating in the survey is also a very subjective issue. Some studies have recommended some additional pre-elicitation interviews to gauge the quality and performance of expert judgements (Cooke and Goossens, 2008). However, a review of several elicitation surveys using equal weights method and performance weights method shows that they produce similar medians and equal weights method has better accuracy (Clemen, 2008). Nevertheless, while averaging the expert judgments, we combine individual probability distributions and calculate the quantiles of the combined probability distribution instead of taking the average of the individual quantiles. This method has been shown superior in performance and producing more evenly spread combined distribution. The median of equally-weighted combinations of individual distributions is shown to be a better estimate than the average of equally weighted individual medians (Cooke et al., 2021).
3. Results
3.1. Cost Estimates
Under each scenario (PAU or 2DC), experts were first asked to define which DAC technology (solid sorbent, liquid solvent, or another technology) is expected to become the dominant one by 2050. For the prevalent technology, respondents were then asked to give a probabilistic estimate for different economic and technical parameters. The first set of results is provided in Figure 3 where the total net removal costs are calculated based on experts' estimates of high, medium, and low capital expenditure (CAPEX) and operating expenses (OPEX). Individual estimates of CAPEX and OPEX for each expert are provided in Supplementary Material.
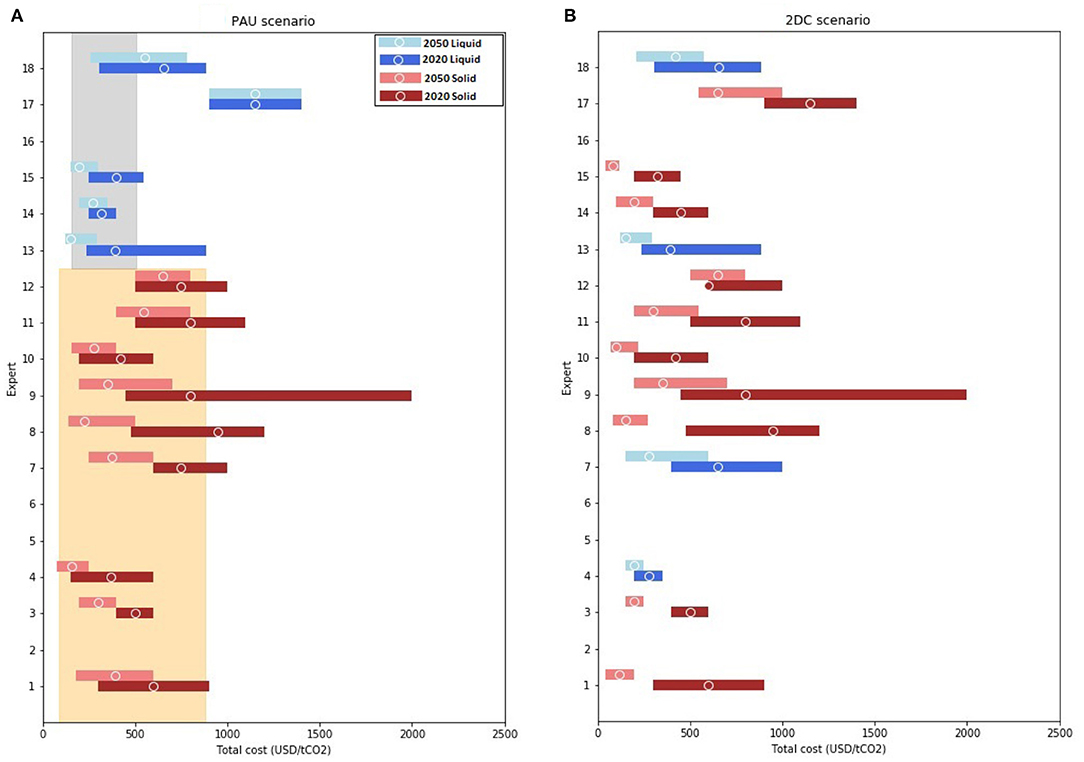
Figure 3. Total net removal cost estimates (50th, 90th, and 10th percentiles) for solid sorbent (red bars) and liquid solvent (blue bars) technologies under (A) PAU scenario and (B) 2DC scenario. The results are reported for 2020 (dark colors) and 2050 (light colors) for each expert. The orange and gray boxes indicate the range of values reported in the National Academy of Sciences (National Academies of Sciences Engineering and Medicine, 2019) reports for solid sorbent and liquid solvent technologies respectively. Experts 2, 5, 6, and 16 did not provide answers to the cost estimate questions.
A key factor to consider here is that net removal costs depend on the assumption that the experts have implicitly made about the DAC plants' energy source and potential storage or utilization of the captured carbon. Although we did not limit the experts to think about any specific energy source, most experts indicated that future DAC plants will use renewable energy sources for their operations (see Figure 7).
The experts' estimates provided in Figure 3 are compared with the range provided by the most recent NAS report (National Academies of Sciences Engineering and Medicine, 2019). The NAS report devises a cost correction factor, defined as , where x is the amount of CO2 emitted for every unit of CO2 that is captured by DAC. If a DAC plant uses high carbon intensity fossil fuels, x approaches 1 and the cost grows. In contrast, when using renewable energies, x is approaching zero, making the net removal cost equal to the actual capture cost. The lower-bound and upper-bound of the NAS net removal cost estimates for liquid solvent DAC are 156 USD/tCO2 for a system with high-efficient solar energy and 506 USD/tCO2 for a low-efficient system with wind energy, respectively (gray shaded area in Figure 3)2.
On the other hand, most cost estimates in the literature are only considering the capturing cost. Therefore, their net removal costs are highly dependent on the choice of energy source. The American Physical Society (APS) has estimated the capture cost for a realistic design using liquid solvent DAC to be around 550 USD/tCO2, while the corrected cost (i.e. including emissions from energy sources) would be 780 USD/tCO2 (Socolow et al., 2011). The optimized avoided cost of a similar design is as low as 518 USD/tCO2 (Mazzotti et al., 2013). Alternative designs of liquid solvent DAC have been suggested where K+ is used instead of Na+ as cation (Keith et al., 2018). This new design's capture cost is estimated to be in the range of 94–232 USD/tCO2. Assuming a 13% increase due to the electricity source's carbon intensity, the avoided cost will be in the range of 106–262 USD/tCO2.
Our analysis outlined in the Figure 3 shows that out of five experts who chose the liquid solvent DAC system in the PAU scenario, two reported median net removal cost estimates larger than the NAS upper-bound. They also reported a much smaller reduction in the future cost estimates compared to the other experts. The three other experts, however, not only reported a sharp decline in the median net removal cost in 2050 compared to 2020, but also expressed a considerably smaller uncertainty over the future cost values. The reduction in the median net removal cost is more evident when comparing the aggregate cost estimates in 2020 and 2050 in Figure 4 where the aggregate median net removal cost goes down from 453 [251, 1,150] USD/tCO2 in 2020 (Figure 4C) to 275 [135, 1,150] USD/tCO2 in 2050 under PAU scenario (Figure 4D).
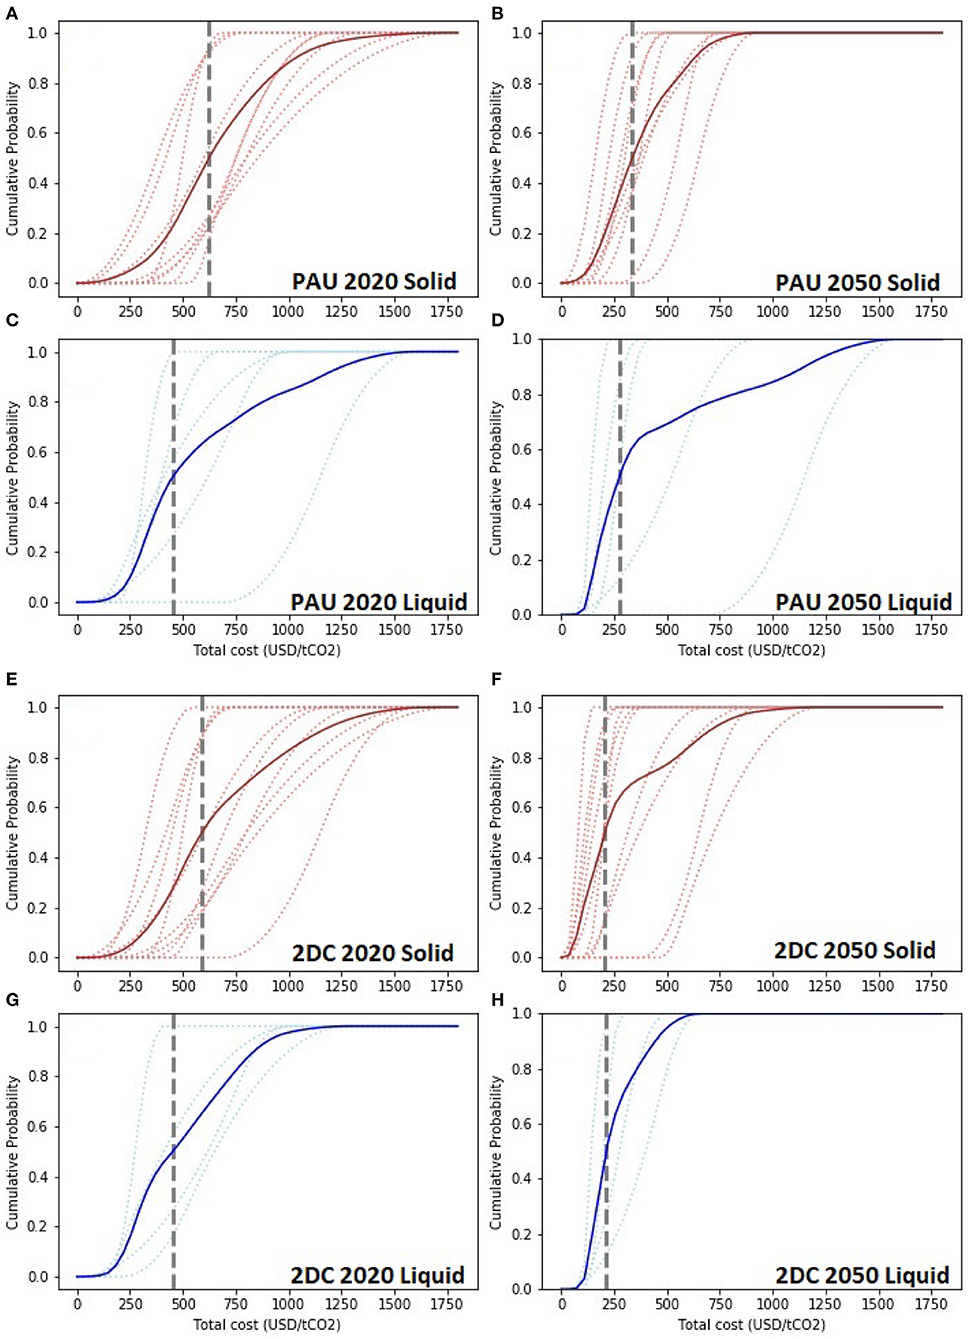
Figure 4. Cumulative distribution functions (CDF) for net removal cost for the aggregate (continuous lines) and for each expert (dotted lines). The median of the aggregate distribution is indicated by gray dashed line. Cumulative distributions are triangular fit to 10th, 50th, and 90th percentiles for solid sorbent (red lines in A,B,E,F) and liquid solvent (blue lines in C,D,G,H) technologies under PAU scenario (A–D) and 2DC scenario (E–H). The results are reported for 2020 (A,C,E,G) and 2050 (B,D,F,H) for each expert. The aggregated CDF is constructed by combining equally weighted individual probability distribution functions (PDF) as shown in Supplementary Figure 5 (Supplementary Material).
The cost reductions from 2020 to 2050 are even more profound in the 2DC scenario. In this case, all four experts who chose the liquid solvent DAC system indicated a reduction in the median cost and the uncertainty over it in 2050 compared to 2020. As shown in Figure 4, the aggregate median net removal cost goes down from 453 [222, 837] USD/tCO2 in 2020 (Figure 4G) to 214 [124, 445] USD/tCO2 in 2050 under 2DC scenario (Figure 4H).
Unlike liquid solvent DAC, only a few techno-economic studies have estimated the capture cost of solid sorbent DAC systems. The NAS lower-bound and upper-bounds for solid sorbent DAC are 89 USD/tCO2 for a system with high-efficient solar energy and 877 USD/tCO2 for a low-efficient system with coal energy, respectively (orange shaded area in Figure 3). A most recent study has put the capture cost of solid sorbent DAC in the range of 120–155 USD/tCO2 (Fasihi et al., 2019).
In our study, most of the 2020 net removal cost median estimates are consistent with the NAS report range as shown in Figure 3. Only one expert (expert 8) reported the median net removal cost larger than the NAS upper-bound. However, the 2020 net removal cost uncertainty ranges vary greatly among the experts while the uncertainty ranges are smaller for the 2050 net removal cost estimates. Similar to the liquid solvent DAC, both the median estimates and uncertainty ranges reduce under 2DC scenario. As Figure 4 shows the median of the aggregate median net removal cost with solid sorbent technology goes down from 624 [336, 1,035] USD/tCO2 in 2020 (Figure 4A) to 336 [158, 631] USD/tCO2 in 2050 under PAU scenario (Figure 4B).
On the other hand, under 2DC scenario the aggregate median net removal cost with solid sorbent technology goes down from 591 [314, 1,143] USD/tCO2 in 2020 (Figure 4E) to 207 [77, 691] USD/tCO2 in 2050 under 2DC scenario (Figure 4F).
In summary, these graphs help us compare the results in terms of median net removal cost estimate and the uncertainty range around it across time, policy, and technology domains (see also Supplementary Figure 5 and Supplementary Table 3).
• Median estimate: while the current solid sorbent technology has a slightly higher median removal cost estimate compared to the liquid solvent technology, the future median cost estimates for both technologies converge to a lower level in 2050 under both policies compared to 2020. However, the median of 2050 cost estimates is lower under 2DC scenarios than PAU scenarios for both technologies. Furthermore, the estimated 2050 median values under 2DC scenario (214 USD/tCO2 and 207 USD/tCO2 for liquid solvent and solid sorbent technologies, respectively) are in line with the range of 200 USD/tCO2 to 350 USD/tCO2 cost estimates used in integrated assessment models (IAMs) (Realmonte et al., 2019).
• Uncertainty range: the uncertainty over net removal cost is generally smaller in 2050 compared to 2020 for each expert and the aggregated results. More experts favored solid sorbent technology and the individual uncertainty ranges are generally smaller for this type of DAC technology. The aggregate uncertainty ranges under 2DC scenario are smaller for liquid solvent technology and slightly larger for solid sorbent technology.
3.2. Capacity Estimates
In addition to costs, experts provided information about expectations on the future deployment of DAC technologies. In Figure 5, elicited probabilities concerning annual installed capacity (AIC) are reported for both technologies under two scenarios. First, we note that currently, there are very few installed DAC facilities, and therefore, the experts provided near-zero estimates for 2020 values. Second, only five experts estimated that the median AIC of solid sorbent systems will be above 100 MtCO2 in 2050 but none of them provided an AIC estimate above 1 GtCO2. On the other hand, two respondents estimated that AIC of liquid solvent system will go beyond 1 GtCO2 in 2050. This highlights the potential of a liquid solvent system in delivering high capacity removal in large scales. Under 2DC scenario, however, the median AIC estimates increase significantly for both technologies in 2050. However, the uncertainty ranges are wider in both groups for individual experts and aggregated estimates.
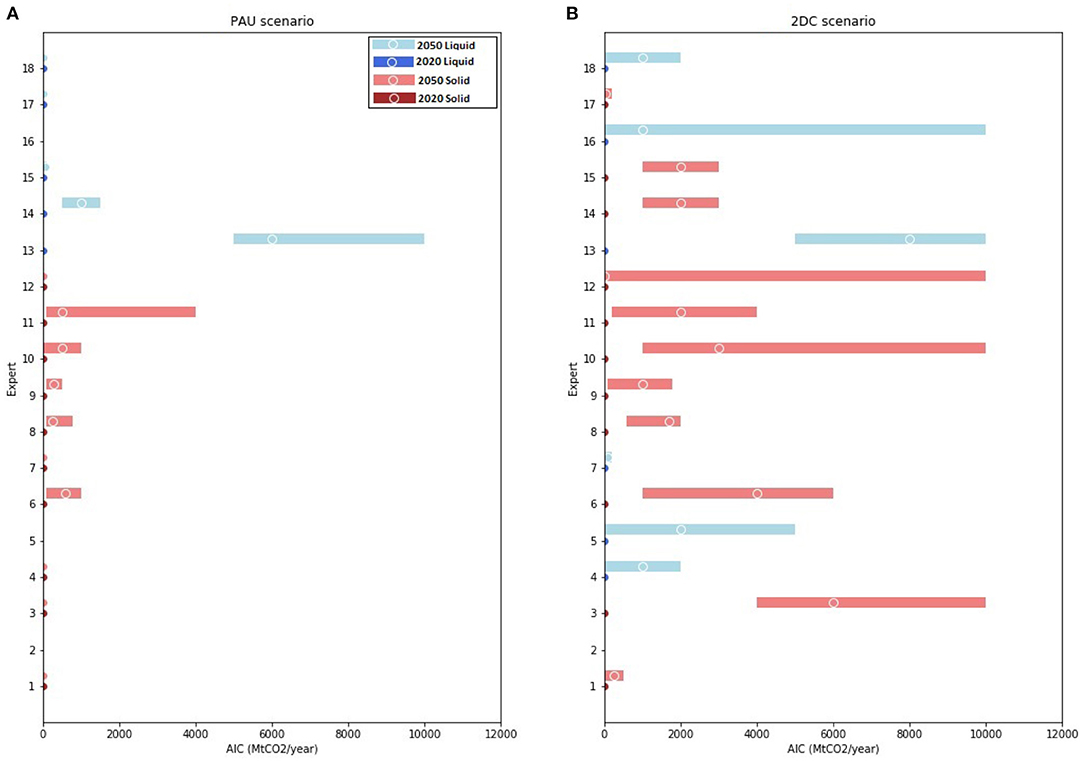
Figure 5. Annual installed capacity (AIC) of DAC (50th, 90th, and 10th percentiles) for solid sorbent (red bars) and liquid solvent (blue bars) technologies under (A) PAU scenario and (B) 2DC scenario. The results are reported for 2020 (dark colors) and 2050 (light colors) for each expert. The 2020 values are near zero and negligible. The red bars show the solid sorbent technology and the blue bars represent the liquid solvent technology. Experts 2 did not provide answers for the AIC estimate questions. Experts 5 and 16 provided estimates only for 2DC scenario.
Figure 6 shows the fitted cumulative distributions under each scenario for a combined set of both technologies. Merging data for both technologies allows us to understand what experts think about the role of DAC in shaping the mitigation portfolio under each scenario regardless of the type of technology being used. In this case, the median of aggregate distribution for AIC in 2050 is 0.24 [0.05, 1.34] GtCO2 under PAU scenario while it reaches to about 1.69 [0.19, 5.86] GtCO2 under 2DC scenario (see also Supplementary Figure 6). Regardless of large uncertainties over the AIC estimates, the experts' collective judgments suggest that DAC could contribute to reaching the 2°C climate target by removing several GtCO2 by mid century under 2DC scenario. These values are again in line with the estimated values reported in previous IAM studies. For example, the estimated values of around 3 GtCO2 from a multi-model analysis of DAC scenarios (Realmonte et al., 2019) corresponds to the 70th percentile of the aggregate distribution in our survey. Another recent study has shown that given the current cost and performance characteristics, DAC should provide about 3 GtCO2 annual negative emissions by 2035 to meet the climate target of 1.5° C (Fuhrman et al., 2020). Other studies have highlighted the interplay of mitigation ambitions and CDR requirements. They have shown that increasing mitigation efforts in short-term (e.g., limiting emissions from 18 to 31 GtCO2 per year in 2030) could reduce the need for CDR for achieving the 2°C climate target from 8 to 2 GtCO2 per year (Strefler et al., 2018).
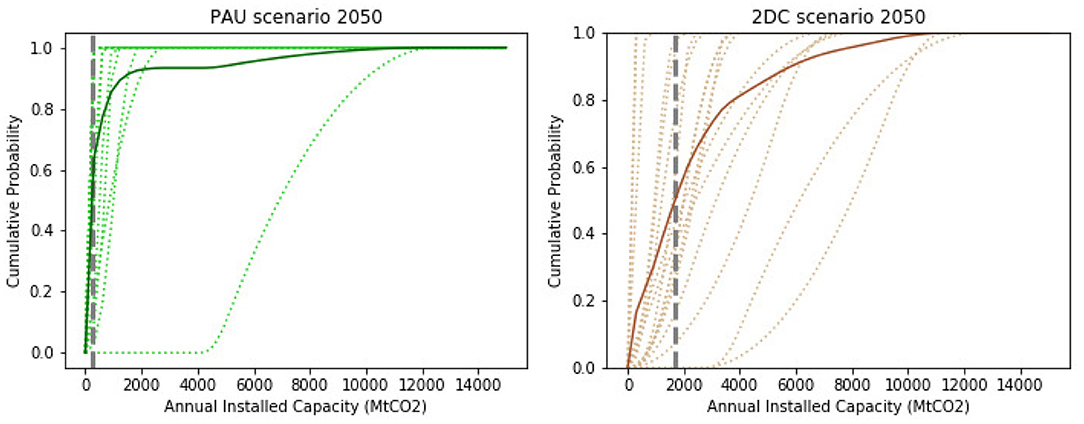
Figure 6. Cumulative distribution functions (CDF) for annual installed capacity in 2050 for the aggregate (continuous line) and for each expert (dotted line). The median of the aggregate distribution is indicated by gray dashed line. Cumulative distributions are triangular fit to 10th, 50th, and 90th percentiles for both solid sorbent and liquid solvent technologies under PAU (green lines) and 2DC (brown lines) scenarios. The aggregated CDF is constructed by combining equally weighted individual probability distribution functions (PDF) as shown in Supplementary Figure 7 (Supplementary Material).
Like the cost estimates, we can now compare the AIC median estimates and the uncertainty range around it across time, and policy for a combined set of both technologies (see Supplementary Figure 7 and Supplementary Table 4).
• Median estimate: the future median AIC estimates converge for both technologies to higher levels in 2050 compared to 2020. Still, the median of 2050 AIC estimates are much higher under 2DC scenario compared to PAU scenario.
• Uncertainty range: the uncertainty over AIC is larger in 2050 compared to 2020 for each expert and the aggregated results mainly because the 2020 numbers are almost zero. The individual uncertainty ranges are generally wider for solid sorbent technology. The ranges under 2DC scenario are larger and the aggregated range is more spread.
3.3. Energy Requirement
The experts provided estimates for each technology's evolution in required energy, temperature, and land in addition to the cost and capacity estimates. The detailed results for these parameters are provided in Supplementary Figure 8.
Liquid solvent DAC technologies, in general, require more heat during the regeneration process. Processing solid sorbent DAC technologies, on the other hand, is less energy-intensive and it requires a lower temperature. Energy requirements estimates in this survey are generally higher than those reported by the NAS (National Academies of Sciences Engineering and Medicine, 2019). The median estimate for solid sorbent technologies is around 8 GJ/tCO2 in 2020 while the NAS estimates range from 4 to 6 GJ/tCO2. However, the experts estimated that the median energy requirements for solid sorbent systems will drop to about 6 GJ/tCO2 by 2050 which falls at the upper-bound of the NAS' estimate range. On the other hand, the median estimate for liquid solvent technologies is around 10 GJ/tCO2 in 2020, within the range of NAS estimates (8–12 GJ/tCO2). The experts estimated that liquid solvent systems' median energy requirements will drop to about 8 GJ/tCO2 by 2050. The 2020 estimates of energy requirements for both technologies are in the range of values used in the IAM studies. For example, Realmonte et al. assume two DAC technologies with an overall energy requirements ranging from 5.0 to 9.9 GJ/tCO2 (Realmonte et al., 2019) while Fuhrman et al. assume a range of 6.6–9.9 GJ/tCO2 for low- and high-cost DAC technologies respectively (Fuhrman et al., 2020).
3.4. Utilization and Integration
The DAC process's output is CO2 with high purity that can be either sequestered in geological storage sites or processed for utilization in the production of carbon-based fuels and other chemicals (Gambhir and Tavoni, 2019). Therefore, successful deployment of DAC technologies in the future is highly dependent on the availability of carbon sequestration or utilization options. Half of the experts (50%) elicited in our study indicated “Geological storage” as the most likely option for sequestration of the captured CO2 while only 39% of the experts chose “Enhance oil recovery” as the first option for utilization of the captured CO2 followed by the utilization of the captured carbon in producing synthetic fuel and more generally, “air-to-chemicals.”
To fully realize its climate benefits, DAC should be integrated into a low carbon energy system (Mac Dowell et al., 2019). But even when DAC facilities are powered with renewable energy sources, there is still a risk of higher health and social costs from upstream fossil emissions (Jacobson, 2019). In our survey, we asked experts about the type of facilities that need to be placed near DAC plants. Some studies have highlighted the long-term social and Although liquid solvent DAC requires substantial heat that makes it harder to completely rely on renewable sources, few experts rank fossil fuel related facilities above renewable energy sources. On the other hand, almost 40% of the experts highlighted the need to integrate DAC facilities with renewable sources of energy (wind and solar) or locating DAC facilities near geothermal reservoir. Figure 7A shows the ranking of supporting facilities that the experts believe should be placed near DAC facilities. The integration of DAC facilities with renewable energy sources is not only essential for meeting the electricity requirements but also for providing the necessary thermal energy for the regeneration process (Wohland et al., 2018). However, in the case of liquid solvent technologies with high temperature requirements, using renewable electricity directly for heating is not efficient. In this case, renewable electricity can be used for electrolysis to generate hydrogen which can be used in fuel cells for thermal heating (National Academies of Sciences Engineering and Medicine, 2019). Other studies have suggested the integration of DAC systems and renewable energy sources to produce methanol (Daggash et al., 2018; Bos et al., 2020; Liu et al., 2020).
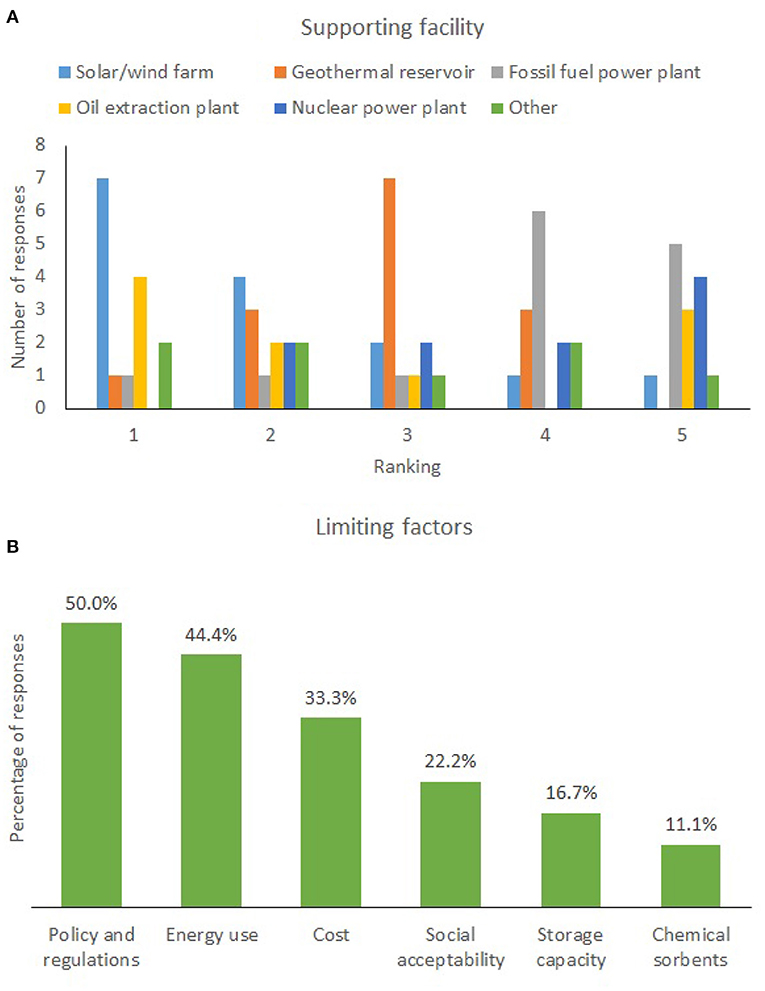
Figure 7. Ranking of (A) supporting facilities required in the vicinity of future DAC plants with 1 indicating the highest rank and 5 indicating the lowest rank, and (B) limiting factors in developing DAC technologies.
In terms of limitations to DAC technologies' future growth, half of the experts (50%) indicated that lack of supporting “Policy and regulations” will hinder the expansion of DAC technologies. After policy, the need for innovation in reducing the DAC process's energy intensity and integrating it with renewable sources of energy has received support from 44% of the experts. One interesting outcome of this study is to show that “Social acceptability” and “Storage capacity” have received only about 22 and 17% of the experts' votes, respectively. This indicates that the experts believe that not only there is enough geological storage capacity for permanent sequestration of captured CO2 but also general public is willing to accept DAC as long as there is a policy and regulatory support for that. Although the provision of chemical sorbent materials has been highlighted in previous studies as a potential constraint for DAC technologies' mass development, it (Realmonte et al., 2019), only 11% of the experts highlighted it as a potential critical obstacle in our study. Figure 7B shows the ranking of these limiting factors.
Finally as shown in Supplementary Figure 9, experts projected that most direct air capture projects will be developed in North America (27%), Europe (16%), and China (16%), identifying these regions are the early adopters of DAC technologies. They also projected that about one-fifth of future DAC installations will be in the Middle East. As the world economy is moving away from fossil fuel consumption, oil and gas producers could take advantage of their existing infrastructure to transition from processing fossil fuel to processing synthesized fuel made from the captured carbon in DAC facilities.
4. Discussion
This paper summarizes the results of an expert elicitation on direct air capture technologies and their prospects. To the best of our knowledge, we are the first to provide a summary of experts' judgment on how DAC technologies may evolve over time and across climate policy scenarios. Three key areas emerge from the results of our survey.
First, the experts' removal cost estimates show a wide range of uncertainty due to the lack of available, trustworthy information about the real costs of developing and operating DAC technologies. This calls for more transparency in reporting the cost and performance of existing DAC facilities. Although private companies operate the current DAC plants, such voluntary transparency in reporting their financial costs can benefit the whole field and help potential investors, policy makers, and technology developers to identify the key obstacles in developing new DAC projects. Despite high uncertainty in estimation of current removal costs, there was a strong consensus among the experts that the costs will fall sharply from their current levels (500–600 USD/tCO2 removed) but will remain significant (about 200 USD/tCO2 removed in 2050) under a strong climate policy regardless of the type of technology.
The second finding highlights the prospective deployment of direct air capture. Even the most optimistic experts were hesitant to provide median estimates of annual installed capacity of more than few GtCO2. These estimates and those of the cost estimates are both in line with annual negative emissions capacity required to reach stringent climate targets according to integrated assessment models of climate change and economy (Strefler et al., 2018; Realmonte et al., 2019; Fuhrman et al., 2020). This highlights the challenges of developing a successful DAC program in the medium-term (Beuttler et al., 2019). Even under the best prospects, DAC should be considered part of a vast portfolio of mitigation strategies, most importantly renewables and gas with carbon capture and storage.
Third, although the science of capturing CO2 from ambient air has been known over the past few decades, various technical and policy obstacles have hindered the adoption of DAC technologies in scale needed for tackling the growing carbon concentration in the atmosphere. Developing new absorbent/adsorbent materials, alternative process designs, and finally new energy sources can reduce the net removal cost of CO2. Half of the experts indicated lack of supporting policy as a major obstacle in developing DAC projects (Figure 7). In terms of types of policy that will benefit DAC projects, more than half of the experts (56%) indicated establishing a carbon credit market such as “Low carbon fuel standard” that is currently in place in California will be the most effective way to support DAC technologies. Carbon tax and R&D policies were the second and the third favorite policies after carbon credit. In any case, government support is a key enabling factor for developing DAC at scale.
Finally, we should acknowledge some of the limitations of our study. First, we were not able to reach all of the 30 experts we wanted to talk to. Some refused to participate in this study and some were not comfortable providing projections about a new technology that they considered to be too uncertain. As a result, we were able to talk to only 18 exerts. Second, although we tried to cover the key technical, economic, and policy aspects of the DAC technologies, investigating the detailed technical aspects of their energy requirements and chemical processes was beyond the scope of this research and requires further investigation. As more DAC projects are being developed, more experts with direct expertise in different aspects of these technologies will be available. We hope our study provides the first step in collecting informed predictive judgments about DAC technologies and paves the way for future expert elicitation studies in this field.
Data Availability Statement
The raw data supporting the conclusions of this article will be made available by the authors, without undue reservation.
Ethics Statement
Ethical review and approval was not required for the study on human participants in accordance with the local legislation and institutional requirements. The patients/participants provided their written informed consent to participate in this study.
Author Contributions
SS carried out the interviews and wrote the manuscript. VB and MT supervised the process. All authors revised and improved the manuscript and contributed in designing the questionnaire.
Conflict of Interest
The authors declare that the research was conducted in the absence of any commercial or financial relationships that could be construed as a potential conflict of interest.
Acknowledgments
We would like to thank all the experts who contributed valuable time to this study in both phases of the projects. We specially thank Dr. Jennifer Wilcox and the NET Primer Workshop organiserz at Worcester Polytechnic Institute (Feb 10-11, 2020) for providing us with access to the attendees for conducting the interviews. We would like to thank Roger Cooke from RFF for providing useful insights and guidance on how to conduct the elicitation and analyze the results. VB and MT acknowledge support from the Italian Ministry of University and Research, PRIN project #201782J9R9 ‘Experimenting with climate change: a behavioral approach to foster cooperation'.
Supplementary Material
The Supplementary Material for this article can be found online at: https://www.frontiersin.org/articles/10.3389/fclim.2021.630893/full#supplementary-material
Footnotes
1. ^Throughout this paper, we report the median estimate and the uncertainty range for the estimated values as M [L, U] where M is the median and L and U are the 10th and 90th percentiles, respectively.
2. ^In order to meet the high temperature heat requirements in liquid solvent systems, the NAS report contains calculations based on both burning fossil fuel and H2 combustion, with H2 produced through electrolysis with renewable sources.
References
Allen, M., Antwi-Agyei, P., Aragon-Durand, F., Babiker, M., Bertoldi, P., Bind, M., et al. (2019). Technical Summary: Global Warming of 1.5 C. An Ipcc Special Report on the Impacts of Global Warming of 1.5 C Above Pre-industrial Levels and Related Global Greenhouse Gas Emission Pathways, in the Context of Strengthening the Global Response to the Threat of Climate Change, Sustainable Development, and Efforts to Eradicate Poverty. Technical report, Intergovernmental Panel on Climate Change.
Anadon, L. D., Baker, E., and Bosetti, V. (2017). Integrating uncertainty into public energy research and development decisions. Nature Energy 2, 1–14. doi: 10.1038/nenergy.2017.71
Anderson, K., and Peters, G. (2016). The trouble with negative emissions. Science 354, 182–183. doi: 10.1126/science.aah4567
Azar, C., Lindgren, K., Obersteiner, M., Riahi, K., van Vuuren, D. P., den Elzen, K. M. G., et al. (2010). The feasibility of low CO2 concentration targets and the role of bio-energy with carbon capture and storage (BECCS). Clim. Change 100, 195–202. doi: 10.1007/s10584-010-9832-7
Azarabadi, H., and Lackner, K. S. (2019). A sorbent-focused techno-economic analysis of direct air capture. Appl. Energy 250, 959–975. doi: 10.1016/j.apenergy.2019.04.012
Baciocchi, R., Storti, G., and Mazzotti, M. (2006). Process design and energy requirements for the capture of carbon dioxide from air. Chem. Eng. Process. Process Intensif. 45, 1047–1058. doi: 10.1016/j.cep.2006.03.015
Baik, S., Davis, A. L., Park, J. W., Sirinterlikci, S., and Morgan, M. G. (2020). Estimating what us residential customers are willing to pay for resilience to large electricity outages of long duration. Nat. Energy 5, 250–258. doi: 10.1038/s41560-020-0581-1
Baker, E., Chon, H., and Keisler, J. (2009). Advanced solar r&d: Combining economic analysis with expert elicitations to inform climate policy. Energy Econ. 31, S37–S49. doi: 10.1016/j.eneco.2007.10.008
Bednar, J., Obersteiner, M., and Wagner, F. (2019). On the financial viability of negative emissions. Nat. Commun. 10, 1–4. doi: 10.1038/s41467-019-09782-x
Beuttler, C., Charles, L., and Wurzbacher, J. (2019). The role of direct air capture in mitigation of anthropogenic greenhouse gas emissions. Front. Clim. 1:10. doi: 10.3389/fclim.2019.00010
Bos, M., Kersten, S., and Brilman, D. (2020). Wind power to methanol: renewable methanol production using electricity, electrolysis of water and CO2 air capture. Appl. Energy 264:114672. doi: 10.1016/j.apenergy.2020.114672
Bosetti, V., Catenacci, M., Fiorese, G., and Verdolini, E. (2012). The future prospect of PV and CSP solar technologies: an expert elicitation survey. Energy Policy 49, 308–317. doi: 10.1016/j.enpol.2012.06.024
Breyer, C., Fasihi, M., and Aghahosseini, A. (2019). Carbon dioxide direct air capture for effective climate change mitigation based on renewable electricity: a new type of energy system sector coupling. Mitigat. Adapt. Strat. Global Change 25, 1–23. doi: 10.1007/s11027-019-9847-y
Choi, S., Watanabe, T., Bae, T.-H., Sholl, D. S., and Jones, C. W. (2012). Modification of the MG/DOBDC MOF with amines to enhance CO2 adsorption from ultradilute gases. J. Phys. Chem. Lett. 3, 1136–1141. doi: 10.1021/jz300328j
Clemen, R. T. (2008). Comment on Cooke's classical method. Reliabil. Eng. Syst. Saf. 93, 760–765. doi: 10.1016/j.ress.2008.02.003
Cooke, R. (1991). Experts in Uncertainty: Opinion and Subjective Probability in Science. New York, NY: Oxford University Press.
Cooke, R. M., and Goossens, L. L. (2000). Procedures Guide for Structured Expert Judgment. Technical Report EUR 18820, European Commission.
Cooke, R. M., and Goossens, L. L. (2008). Tu delft expert judgment data base. Reliabil. Eng. Syst. Saf. 93, 657–674. doi: 10.1016/j.ress.2007.03.005
Cooke, R. M., Marti, D., and Mazzuchi, T. (2021). Expert forecasting with and without uncertainty quantification and weighting: what do the data say? International Journal of Forecasting 37, 378–387. doi: 10.1016/j.ijforecast.2020.06.007
Curtright, A. E., Morgan, M. G., and Keith, D. W. (2008). Expert assessments of future photovoltaic technologies. Environ. Sci. Technol. 42, 9031–9038. doi: 10.1021/es8014088
Daggash, H., Patzschke, C., Heuberger, C., Zhu, L., Hellgardt, K., Fennell, P., et al. (2018). Closing the carbon cycle to maximise climate change mitigation: power-to-methanol vs. power-to-direct air capture. Sustain. Energy Fuels 2, 1153–1169. doi: 10.1039/C8SE00061A
de Lannoy, C.-F., Eisaman, M. D., Jose, A., Karnitz, S. D., DeVaul, R. W., Hannun, K., et al. (2018). Indirect ocean capture of atmospheric CO2: Part I. Prototype of a negative emissions technology. Int. J. Greenhouse Gas Control 70, 243–253. doi: 10.1016/j.ijggc.2017.10.007
Fasihi, M., Efimova, O., and Breyer, C. (2019). Techno-economic assessment of CO2 direct air capture plants. J. Clean. Product. 224, 957–980. doi: 10.1016/j.jclepro.2019.03.086
Fridahl, M., and Lehtveer, M. (2018). Bioenergy with carbon capture and storage (BECCS): Global potential, investment preferences, and deployment barriers. Energy Res. Soc. Sci. 42, 155–165. doi: 10.1016/j.erss.2018.03.019
Fuhrman, J., McJeon, H., Patel, P., Doney, S. C., Shobe, W. M., and Clarens, A. F. (2020). Food-energy-water implications of negative emissions technologies in a+ 1.5 C future. Nat. Clim. Change 10, 920–927. doi: 10.1038/s41558-020-0876-z
Fuss, S., Canadell, J. G., Peters, G. P., Tavoni, M., Andrew, R. M., Ciais, P., et al. (2014). Betting on negative emissions. Nat. Clim. change 4, 850–853. doi: 10.1038/nclimate2392
Gambhir, A., and Tavoni, M. (2019). Direct air carbon capture and sequestration: how it works and how it could contribute to climate-change mitigation. One Earth 1, 405–409. doi: 10.1016/j.oneear.2019.11.006
Holmes, G., Nold, K., Walsh, T., Heidel, K., Henderson, M. A., Ritchie, J., et al. (2013). Outdoor prototype results for direct atmospheric capture of carbon dioxide. Energy Proc. 37, 6079–6095. doi: 10.1016/j.egypro.2013.06.537
Intergovernmental Panel on Climate Change (2018). Global Warming of 1.5 C: An IPCC Special Report on the Impacts of Global Warming of 1.5 C Above Pre-industrial Levels and Related Global Greenhouse Gas Emission Pathways, in the Context of Strengthening the Global Response to the Threat of Climate Change, Sustainable Development, and Efforts to Eradicate Poverty. Intergovernmental Panel on Climate Change.
Jacobson, M. Z. (2019). The health and climate impacts of carbon capture and direct air capture. Energy Environ. Sci. 12, 3567–3574. doi: 10.1039/C9EE02709B
Keith, D. W., Holmes, G., Angelo, D. S., and Heidel, K. (2018). A process for capturing CO2 from the atmosphere. Joule 2, 1573–1594. doi: 10.1016/j.joule.2018.05.006
Kulkarni, A. R., and Sholl, D. S. (2012). Analysis of equilibrium-based tsa processes for direct capture of CO2 from air. Indus. Eng. Chem. Res. 51, 8631–8645. doi: 10.1021/ie300691c
Larsen, J., Herndon, W., Grant, M., and Marsters, P. (2019). Capturing Leadership: Policies for the US to Advance Direct Air Capture Technology. Technical report, Rhodium Group.
Levin, K., Rich, D., Bonduki, Y., Comstock, M., Tirpak, D., Mcgray, H., et al. (2015). Designing and Preparing Intended Nationally Determined Contributions (INDCs). World Resources Institute, Washington, DC.
Li, C., Shi, H., Cao, Y., Kuang, Y., Zhang, Y., Gao, D., et al. (2015). Modeling and optimal operation of carbon capture from the air driven by intermittent and volatile wind power. Energy 87, 201–211. doi: 10.1016/j.energy.2015.04.098
Liu, C. M., Sandhu, N. K., McCoy, S. T., and Bergerson, J. A. (2020). A life cycle assessment of greenhouse gas emissions from direct air capture and fischer-tropsch fuel production. Sustain. Energy Fuels. 4, 3129–3142. doi: 10.1039/C9SE00479C
Mac Dowell, N., Fajardy, M., Daggash, H., and Patrizio, P. (2019). Negative emissions: priorities for research and policy design. Front. Clim. 1:6. doi: 10.3389/fclim.2019.00006
Mazzotti, M., Baciocchi, R., Desmond, M. J., and Socolow, R. H. (2013). Direct air capture of CO2 with chemicals: optimization of a two-loop hydroxide carbonate system using a countercurrent air-liquid contactor. Clim. Change 118, 119–135. doi: 10.1007/s10584-012-0679-y
Morgan, M. G. (2014). Use (and abuse) of expert elicitation in support of decision making for public policy. Proc. Natl. Acad. Sci. U.S.A. 111, 7176–7184. doi: 10.1073/pnas.1319946111
National Academies of Sciences Engineering and Medicine (2019). Negative Emissions Technologies and Reliable Sequestration: A Research Agenda. National Academies Press.
Nemet, G. F. (2019). How Solar Energy Became Cheap: A Model for Low-Carbon Innovation. New York, NY: Routledge. doi: 10.4324/9780367136604
O'Hagan, A., Buck, C. E., Daneshkhah, A., Eiser, J. R., Garthwaite, P. H., Jenkinson, D. J., et al. (2006). Uncertain Judgements: Eliciting Experts' Probabilities. Padstow; Cornwall: John Wiley & Sons. doi: 10.1002/0470033312
Realmonte, G., Drouet, L., Gambhir, A., Glynn, J., Hawkes, A., Köberle, A. C., et al. (2019). An inter-model assessment of the role of direct air capture in deep mitigation pathways. Nat. Commun. 10, 1–12. doi: 10.1038/s41467-019-10842-5
Rogelj, J., Den Elzen, M., Höhne, N., Fransen, T., Fekete, H., Winkler, H., et al. (2016). Paris agreement climate proposals need a boost to keep warming well below 2 C. Nature 534, 631–639. doi: 10.1038/nature18307
Rogelj, J., Popp, A., Calvin, K. V., Luderer, G., Emmerling, J., Gernaat, D., et al. (2018). Scenarios towards limiting global mean temperature increase below 1.5 c. Nat. Clim. Change 8:325. doi: 10.1038/s41558-018-0091-3
Sanz-Perez, E. S., Murdock, C. R., Didas, S. A., and Jones, C. W. (2016). Direct capture of CO2 from ambient air. Chem. Rev. 116, 11840–11876. doi: 10.1021/acs.chemrev.6b00173
Sinha, A., Darunte, L. A., Jones, C. W., Realff, M. J., and Kawajiri, Y. (2017). Systems design and economic analysis of direct air capture of CO2 through temperature vacuum swing adsorption using MIL-101 (Cr)-PEI-800 and mmen-Mg2 (dobpdc) MOF adsorbents. Indus. Eng. Chem. Res. 56, 750–764. doi: 10.1021/acs.iecr.6b03887
Smith, P., Davis, S. J., Creutzig, F., Fuss, S., Minx, J., Gabrielle, B., et al. (2016). Biophysical and economic limits to negative CO2 emissions. Nat. Clim. Change 6, 42–50. doi: 10.1038/nclimate2870
Socolow, R., Desmond, M., Aines, R., Blackstock, J., Bolland, O., Kaarsberg, T., et al. (2011). Direct Air Capture of CO2 with Chemicals: A Technology Assessment for the APS Panel on Public Affairs. Technical report, American Physical Society.
Strefler, J., Bauer, N., Kriegler, E., Popp, A., Giannousakis, A., and Edenhofer, O. (2018). Between scylla and charybdis: delayed mitigation narrows the passage between large-scale cdr and high costs. Environ. Res. Lett. 13:044015. doi: 10.1088/1748-9326/aab2ba
Tanzer, S. E., and Ramirez, A. (2019). When are negative emissions negative emissions? Energy Environ. Sci. 12, 1210–1218. doi: 10.1039/C8EE03338B
Thomas, M., Partridge, T., Harthorn, B. H., and Pidgeon, N. (2017). Deliberating the perceived risks, benefits, and societal implications of shale gas and oil extraction by hydraulic fracturing in the US and UK. Nat. Energy 2, 1–7. doi: 10.1038/nenergy.2017.54
Tollefson, J. (2018). Sucking carbon dioxide from air is cheaper than scientists thought. Nature 558:173. doi: 10.1038/d41586-018-05357-w
Verdolini, E., Anadon, L. D., Lu, J., and Nemet, G. F. (2015). The effects of expert selection, elicitation design, and r&d assumptions on experts' estimates of the future costs of photovoltaics. Energy Policy 80, 233–243. doi: 10.1016/j.enpol.2015.01.006
Waisman, H., De Coninck, H., and Rogelj, J. (2019). Key technological enablers for ambitious climate goals: insights from the ipcc special report on global warming of 1.5 C. Environ. Res. Lett. 14:111001. doi: 10.1088/1748-9326/ab4c0b
Walls, L., and Quigley, J. (2001). Building prior distributions to support Bayesian reliability growth modelling using expert judgement. Reliabil. Eng. Syst. Saf. 74, 117–128. doi: 10.1016/S0951-8320(01)00069-2
Wilcox, J., Psarras, P. C., and Liguori, S. (2017). Assessment of reasona ble opportunities for direct air capture. Environ. Res. Lett. 12:065001. doi: 10.1088/1748-9326/aa6de5
Wiser, R., Jenni, K., Seel, J., Baker, E., Hand, M., Lantz, E., et al. (2016). Expert elicitation survey on future wind energy costs. Nat. Energy 1, 1–8. doi: 10.1038/nenergy.2016.135
Wohland, J., Witthaut, D., and Schleussner, C.-F. (2018). Negative emission potential of direct air capture powered by renewable excess electricity in Europe. Earths Future 6, 1380–1384. doi: 10.1029/2018EF000954
Keywords: negative emission, expert elicitation, cost, uncertainty, policy, direct air capture
Citation: Shayegh S, Bosetti V and Tavoni M (2021) Future Prospects of Direct Air Capture Technologies: Insights From an Expert Elicitation Survey. Front. Clim. 3:630893. doi: 10.3389/fclim.2021.630893
Received: 18 November 2020; Accepted: 28 April 2021;
Published: 26 May 2021.
Edited by:
Phil Renforth, Heriot-Watt University, United KingdomReviewed by:
Volker Sick, University of Michigan, United StatesCharithea Charalambous, Heriot-Watt University, United Kingdom
Copyright © 2021 Shayegh, Bosetti and Tavoni. This is an open-access article distributed under the terms of the Creative Commons Attribution License (CC BY). The use, distribution or reproduction in other forums is permitted, provided the original author(s) and the copyright owner(s) are credited and that the original publication in this journal is cited, in accordance with accepted academic practice. No use, distribution or reproduction is permitted which does not comply with these terms.
*Correspondence: Soheil Shayegh, c29oZWlsLnNoYXllZ2hAZWllZS5vcmc=