 Felix Cook
 Robert O. Smith
 Moninya Roughan
 Nicolas J. Cullen
 Nick Shears4
 Melissa Bowen
- 1Department of Marine Science, University of Otago, Dunedin, New Zealand
- 2Coastal and Regional Oceanography Lab, School of Biological Earth and Environmental Sciences, UNSW Sydney, Sydney, NSW, Australia
- 3School of Geography, University of Otago, Dunedin, New Zealand
- 4Leigh Marine Laboratory, Institute of Marine Science, University of Auckland, Leigh, New Zealand
- 5School of Environment, University of Auckland, Auckland, New Zealand
Marine heatwaves (MHWs) are extreme ocean temperature events that can have wide-ranging and pervasive effects on marine species and ecosystems. However, studies of MHW characteristics and drivers primarily focus on open-ocean environments, rather than the nearshore coastal ocean (<10 km from coast, <50 m depth). This is despite coastal waters sustaining significant commercial, recreational, and customary fisheries and aquaculture activities that are highly susceptible to the impacts of MHWs. The two longest (>50 year) daily in situ ocean temperature records in the Southern Hemisphere are used to investigate the variability, drivers, and trends of MHWs in shallow water marine ecosystems (SWMEs). Located at the northern and southern limits of New Zealand, both locations experience an average of two to three MHWs annually, with MHWs at the exposed coastline site generally being of longer duration but less intense than those observed within the semi-enclosed harbor site. Observed MHWs have timescales similar to synoptic weather systems (9–13 days) and are most intense during Austral summer with little seasonality in frequency or duration. An investigation of MHWs co-occurring in nearshore coastal and offshore waters suggests that MHWs in semi-enclosed waters (e.g., harbors, estuaries) are more closely coupled with local atmospheric conditions and less likely to have a co-occurring offshore MHW than those occurring on exposed coastlines. Composite analysis using a reanalysis product elucidates specific atmospheric drivers and suggests that atmospheric pressure systems, wind speed and latent heat fluxes are important contributing factors to the generation and decline of MHWs in SWMEs. Investigation of long-term trends in MHW properties revealed an increase in MHW duration and annual MHW days at the southern site and decrease in maximum intensity at the northern site. This is consistent with broad-scale warming trends previously documented at these coastal stations, with differences related to changes in large-scale circulation patterns around New Zealand. Our results highlight the importance of in situ data for the analysis of MHW events in the nearshore coastal ocean, and the role of local atmospheric forcing in modulating the occurrence of MHWs in SWMEs, which can cause decoupling of temperature dynamics with the surrounding shelf sea.
1. Introduction
Marine heatwaves (MHWs) are a “prolonged discrete anomalously warm water event,” where ocean temperatures are well above normal for an extended period of time (Hobday et al., 2016). The extreme ocean temperatures during these events can have many negative ecological effects including declines in marine species abundance and diversity, interruption of trophic flows, disease outbreak, and species displacement (Morton, 2018; Salinger et al., 2019, 2020; Thomsen et al., 2019). At a global scale, MHWs have increased in frequency, duration, and intensity over the past century (Oliver et al., 2018a,b), with these changes projected to continue over the twenty-first century (Oliver et al., 2019). As a consequence, there is potential for ecosystem impacts from individual MHW events to become more frequent, far reaching and pervasive, which would have a direct impact on ecosystem services (Smale et al., 2019) and the blue economy (Techera and Winter, 2019). For countries that already have, or plan to develop, a substantial coastal marine aquaculture industry, there is strong motivation to understand the mechanisms that generate MHWs and modulate their properties in order to support seasonal MHW forecasts (Jacox et al., 2022).
There is now an established global body of literature focused on the drivers and dynamics of MHWs (Oliver et al., 2018a; Elzahaby and Schaeffer, 2019; Holbrook et al., 2019; Jacox et al., 2019; Amaya et al., 2020; Gupta et al., 2020; Elzahaby et al., 2021; Perez et al., 2021). These studies document a diverse range of local and large-scale ocean-atmosphere processes, as well as geographic factors, that contribute to the generation and evolution of MHWs (Holbrook et al., 2019). Key local processes that can generate and control MHWs include advection of heat by ocean currents and changes in air-sea heat fluxes, while rates of vertical mixing of the upper ocean, which can be suppressed by a reduction in local winds, can also play a role. Large-scale drivers include the major modes of climate variability (e.g., ENSO, SAM, PDO; Holbrook et al., 2019), along with teleconnections through internal processes such as Rossby waves that can lead to adjustment of the thermocline and heat transport in ocean boundary currents (Li et al., 2020, 2022). However, many recent studies of MHW drivers and trends focus on the “open-ocean” (reviewed in Holbrook et al., 2019) and utilize the OISSTv2 satellite product that, despite having a spatial resolution of ~28 km (0.25° lat-lon), has a coarser effective spatial resolution due to the 100–200 km error in the correlation scales used in the optimal interpolation scheme (Banzon et al., 2016). These factors limit the applicability of the widely used OISSTv2 products for studying the drivers and dynamics of MHWs in coastal waters, as local variability in temperature across features of the inner continental shelf, including embayments, harbors, and estuaries, is likely to be poorly resolved or may be aliased from variability over the wider shelf (Schlegel et al., 2017b). This also highlights the need for long-term in situ temperature data for assessing the drivers and dynamics of MHWs in coastal waters (Schlegel et al., 2017b).
Local atmospheric forcing is known to play an important role in the generation and evolution of MHWs in coastal waters. For example, Schaeffer and Roughan (2017) demonstrate local downwelling favorable winds can lead to extreme subsurface temperature anomalies in coastal regions through mixing of the water column and reducing local stratification. Work by Schlegel et al. (2017a) using in situ coastal data records found that the coastal MHWs detected were typically associated with onshore or alongshore winds and anomalously high air temperature, with direct atmospheric forcing of coastal MHWs singled out as a driver that requires further investigation. Local wind relaxation events in upwelling zones have also recently been found to establish short-lived MHWs in coastal regions (Pietri et al., 2021). Further, it is apparent that the drivers of MHW occurrence can vary considerably with distance from the coastline. For example, Schlegel et al. (2017b) demonstrated that along the South African coast there is often a decoupling of MHW occurrence between the coastal and shelf waters, and that controls other than mesoscale forcing were likely contributing to the coastal MHWs. This highlights the need for closer consideration of the complex local-scale processes that can modulate MHW properties and event occurrence.
Research to date on MHWs in coastal waters has tended to focus on the characteristics and dynamics of these events on the mid- to inner-shelf (100–15 m depth; e.g., Pearce and Feng, 2013; Schaeffer and Roughan, 2017; Manta et al., 2018; Schlegel et al., 2021; Reyes et al., 2022) rather than shallow water marine ecosystems (SWMEs, <15 m depth), such as rocky reefs, harbors, and estuarine environments. SWMEs are important ecologically, economically, and culturally (Costanza et al., 1997; Bennett et al., 2015; Martin et al., 2020) and act as important feeding and breeding grounds for sessile and mobile marine species (Thrush et al., 2013; Araújo et al., 2016). Despite the ecological and societal importance of these nearshore systems, the nature of MHWs in SWMEs remain poorly understood, and we are aware of only one recent study (Mazzini and Pianca, 2022) that investigated MHWs in a large (11,601 km2) mid-latitude estuary bordering the North Atlantic. In part, this gap exists due to the lack of sufficient long-term coastal temperature data sets (Schlegel et al., 2017b; Mazzini and Pianca, 2022; Tassone et al., 2022). A consequence of this knowledge gap is that it also remains poorly understood whether key drivers of MHWs identified in the open-ocean (e.g., Holbrook et al., 2019) are equally important for generating and controlling the evolution of MHWs in SWMEs. SWMEs have the added complexity, compared to the open-ocean, of typically being vertically mixed by wind, wave and tidal energy (Simpson and Sharples, 2012) and having increased sensitivity to changes in local atmospheric conditions due to their limited water depth (Schlegel et al., 2017b; Hu, 2021). Indeed, a recent study has emphasized large-scale atmospheric forcing, through air-sea heat fluxes, as likely being an important factor in generating estuarine MHWs (Mazzini and Pianca, 2022). These factors may also contribute toward a decoupling of extreme temperature events in the nearshore from the offshore (Schlegel et al., 2017b). With MHWs being the target of several theorized (Jacox et al., 2019), experimental (Boschetti et al., 2021) and operational forecast systems (Moana Project, 2021), an improved understanding of the drivers and physical processes influencing MHWs in SWMEs is timely and has important implications for the continued improvement of these predictive tools (de Burgh-Day et al., 2022).
To help fill these knowledge gaps, here we utilize two of the longest (>50 year) daily in situ ocean temperature (T) records from the Southern Hemisphere, to investigate the characteristics of MHWs in SWMEs and to understand the drivers and physical processes that control their evolution. The data comes from two coastal stations, Leigh Marine Laboratory (Leigh) and Portobello Marine Laboratory (PML), located near the northern and southern extremes of New Zealand (Figure 1). At these locations in situ T measurements have been collected at 9 a.m. daily since 1967 (Leigh) and 1953 (PML) (Shears and Bowen, 2017). The MHWs detected in the coastal in situ T records are compared to meteorological conditions from an atmospheric reanalysis and to MHWs detected in the surrounding shelf seas in a remotely sensed SST product, to determine the extent to which their evolution is forced by, and coupled with, local atmospheric and oceanic conditions. Key questions that we wish to answer are:
• What are the mean, seasonal, and inter-annual characteristics of MHWs at these two contrasting shallow-water coastal stations?
• What contribution do local atmospheric and oceanic processes play in controlling the evolution of MHWs at these coastal stations?
• How have MHW characteristics at these coastal stations changed over the last half-century?
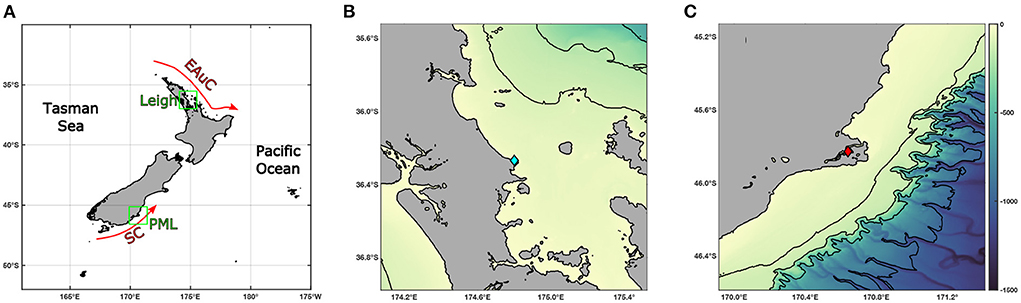
Figure 1. Map of New Zealand (A) and the two study sites (B,C) with local bathymetry displayed. The two study sites around Leigh Marine Laboratory (Leigh) and Portobello Marine Laboratory (PML) are outlined in green in (A). Also displayed in red are the East Auckland Current (EAuC) and Southland Current (SC). The coastal station at Leigh (B) and PML (C) are identified by a blue and red diamond, respectively. Contours are displayed in (B,C) for the 100, 200, 500, and 1,000 m isobath.
The manuscript is structured as follows. Data sets and analysis techniques are outlined in Section 2, with the MHW characteristics and outcomes of our analyses presented in Section 3. Relationships between MHWs and local atmospheric and oceanic drivers, together with possible drivers of interannual variability and long-term trends in MHW characteristics are identified in Section 4. The Section 5 summarizes our main findings.
2. Methods
2.1. Coastal in situ sea surface temperature data
In this study, we use long-term daily sea surface temperature (T) records from two New Zealand coastal stations: Leigh Marine Laboratory (Leigh, 36°16.12'S 174°48.01'E) and Portobello Marine Laboratory (PML, 45°49.68'S 170°38.39'E). Sea temperature measurements at Leigh and PML have been recorded daily at 9 a.m. since 1967 and 1953 respectively in <2 m of water using manual thermometers and, in the case of Leigh since 2011, using an automatic data logger (Bowen et al., 2017; Shears and Bowen, 2017). The Leigh and PML stations are located near the northern and southern extremes of New Zealand, separated by 9° of latitude (Figure 1). Leigh is an open coastal station based on the edge of an inner shelf rocky reef located within the Hauraki Gulf on the northeast coast of the North Island, New Zealand with typical water depths between 10 and 25 m (Ballantine and Gordon, 1979). The surrounding continental shelf is relatively broad with the shelf break located 50–60 km offshore (Manighetti and Carter, 1999). Circulation on the shelf is largely wind-forced but can also experience occasional intrusions of subtropical water related to the East Auckland Current (EAuC), a poleward flowing western boundary current (WBC) that flows southward adjacent to the region (Zeldis et al., 2004). PML is a coastal station situated within the semi-enclosed Otago Harbor which has a mean depth of 4.5 m and is located on the southeast coastline of the South Island, New Zealand (Otago Regional Council and Dunedin City Council, 1991). PML is located 8 km from the entrance and 25 km inshore of the continental shelf break (Gorman et al., 2013). Circulation on the surrounding shelf is affected by an equatorward flowing WBC, known locally as the Southland Current (Sutton, 2003), which transports a combination of warmer subtropical shelf-water and cooler offshore subantarctic waters northeastward.
2.2. Satellite-derived sea surface temperature product
This study also uses a satellite-derived sea surface temperature (SST) product from the European Space Agency Climate Change Initiative (hereafter CCI SST). This product consists of daily 0.05° lat-lon SST fields spanning 1982–2020 from the ESA SST CCI and Copernicus Sentinel-3 (C3S) analyses (Good et al., 2019). This is a reprocessed temperature product that provides gap-free maps of daily average satellite derived SST through an optimal interpolation procedure with an effective spatial resolution of ~20 km (Merchant et al., 2019).
2.3. QA/QC and gap filling of in situ temperature datasets
Since 2011 the Leigh in situ temperature data has been sampled ~200 m from the original sampling site but still at 9 a.m. local time. The sampling also changed from manual thermometer readings to an automated data logger (Nick Shears, pers. comm, 2021). Comparisons were made at the time of the changeover (2011) to ensure consistency in observations but despite best efforts, these data have not been recoverable. Therefore, we have also compared three 9-year periods of satellite-derived SST (ESA CCI) and in situ T observations to see if there has been any bias introduced into the time series due to a change in observational method (Supplementary Figure 1). We found no significant change in the difference between in situ T and satellite-derived SST observed during the first two periods (1992–2000: mean = −0.29°C, σ = 0.521°C and 2002–2010: mean = −0.32°C, σ = 0.45°C) prior to the change in sampling, and a third period (2012–2020: mean = −0.30°C, σ = 0.38°C) after this change.
For the most part the two in situ timeseries are largely complete, with 2.51 and 1.91% of values in the Leigh and PML datasets missing, respectively. The gaps that do exist in both datasets are generally on the scale of ≤ 6 days; however, the largest gap is 159 days (Supplementary Figure 2). These gaps were filled using a combination of two methods. Firstly, linear interpolation was used to fill short gaps (≤10 days) in the record. Secondly, the CCI SST data were used to fill the longer gaps (3 at Leigh, 6 at PML, >10 days). CCI SST data were obtained for a 1.5° × 1.5° box around each site, then a spatial decorrelation was performed between the in situ T and remotely sensed CCI SST data for each grid cell. The grid cell that maximized R and was >15 km from the coast was selected at each site. When comparing the in situ and remotely sensed data, there is a seasonally-varying difference with the shallow study sites generally cooler (warmer) than the nearby coastal ocean during winter (summer). This difference likely arises due to differences in water column depth. To account for this difference, a seasonally-varying offset term was also used. This term was obtained by creating a climatology of the difference between the in situ and satellite SST estimates for each day of year (doy) over the period 1982–2010 and then smoothing this with a 31 day moving window. The following expression was then used for infilling the in situ data:
where Tin situ is the estimated missing in situ T-value, SSToffshore(t) is the offshore satellite SST value and OFFSETclim(doy) is the offset term to account for the difference between the coastal in situ T and satellite-derived SST estimates.
2.4. Detection and characterization of events
Here we define MHWs following Hobday et al. (2016), as a period when water temperatures are greater than the 90th percentile of a seasonally-varying climatology for a period of at least 5 days. The climatology is calculated over the 29-year period 1982–2010. Although WMO guidelines for climatological standard normals recommend a 30-year climatology (World Meteorological Organization, 2017), we elected to use 1982–2010 as it is one year short of the recommended record length and a number of recent studies have used similar or identical periods (Golubeva et al., 2021; Kajtar et al., 2021). MHWs were detected in the in situ T and CCI SST data using a MATLAB implementation of the Hobday et al. (2016) definition (Zhao and Marin, 2019). MHWs detected using in situ data uses a climatology based on the in situ data. Similarly, MHWs detected using remotely sensed data uses a climatology based on the remotely sensed data. From this we obtain several metrics to describe the characteristics, variability and trends of MHWs at the coastal stations (Figure 2). Event metrics include several intensities (mean, maximum, and cumulative) and duration. From these metrics, events have also been categorized according to their severity S defined by Hobday et al. (2018) as:
where Tpeak is the maximum MHW intensity, is the climatological T-value for doy and is the 90th percentile climatological T-value for doy. There are four MHW categories: weak (1 ≤ S < 2), moderate (2 ≤ S < 3), strong (3 ≤ S < 4), and extreme (4 ≤ S; Hobday et al., 2018).
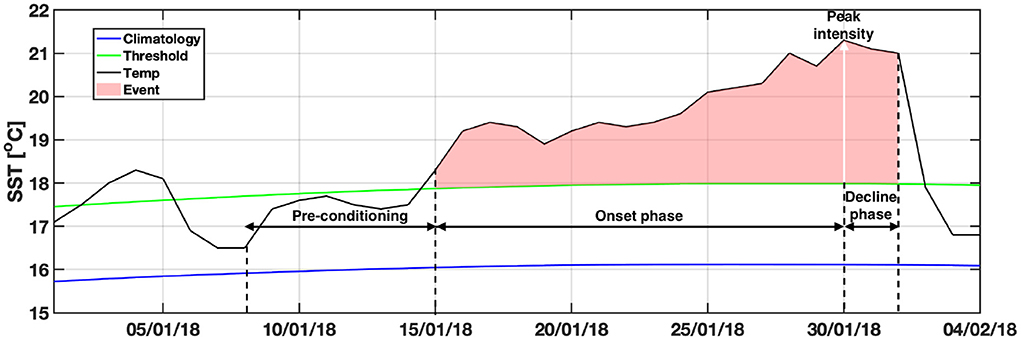
Figure 2. A detected event from the PML record showing the sea temperature climatology (blue), threshold (green), and temperature (black). The event is highlighted in red with the three MHW phases (pre-conditioning, onset, and decline) illustrated in black.
Following Oliver et al. (2018a) and Behrens et al. (2022), time series of MHW metrics at the coastal stations were annualized by taking the mean value of the metric for each event in a calendar year. This step is necessary to meet the constraints of statistical tests used for trend analysis (see Section 2.7) and provides the annual frequency of MHWs and the total number of MHW days per year.
2.5. Assessing co-occurrence of MHWs at coastal stations and the surrounding shelf
An investigation into the co-occurrence of MHWs detected at the in situ coastal stations and those occurring in the surrounding shelf waters was performed following Schlegel et al. (2017b), in order to better understand the coupling between extreme temperature events in nearshore coastal waters (<15 m) compared to offshore waters. To do so, we compared the in situ data with CCI SST data over the continental shelf offshore of the Leigh and Portobello Marine Laboratories. MHWs were detected using the same methods described above over the period 1982–2020 within 0.05° oceanic grid cells over a 1.5° × 1.5° region surrounding each coastal station (Figure 1). Co-occurrence is defined as any overlap in time between events detected at a coastal station and at an offshore analysis grid cell. To find the proportion of co-occurring events, the number of coastal station MHWs with a co-occurring offshore MHW was divided by the total number of MHWs detected at the coastal station. For MHWs that were found to co-occur between the coastal station and offshore grid cells, the mean lag or lead in days between the start of the nearshore and offshore MHW at each CCI grid cell was determined. Lags were only calculated between nearshore events and the first co-occurring offshore MHW. For example, if a nearshore MHW co-occurred with two offshore MHWs, only the lag/lead between the nearshore and first of the two offshore MHWs was calculated. Likewise, if an offshore event co-occurred with two nearshore events, only the lag/lead between the offshore and first of the two nearshore MHWs was calculated. Here, a positive lag value indicates that the nearshore event lags the offshore event, whereas a negative lag indicates the nearshore event leads the offshore event. We calculated 95% confidence intervals on the lag/lead values at each CCI grid cell using a bias corrected and accelerated percentile method (DiCiccio and Efron, 1996) as implemented in MATLAB 2021a, with cases where the confidence intervals on the lag/lead overlapped with zero considered non-significant.
2.6. Local atmospheric drivers
To investigate the importance of local atmospheric forcing and mechanisms during the generation and decline of MHWs at the two coastal stations, we follow the approach of Gupta et al. (2020) and examine anomalies of wind speed (10 m), total cloud cover, air temperature (2 m), mean sea level pressure (MSLP), net short wave radiation (SWR), net long wave (LWR) radiation, sensible (SEN) and latent (LAT) heat fluxes. These sum to net air-sea heat flux, NET = SWR + LWR + SEN + LAT.
We use data from the ERA5 atmospheric reanalysis (Hersbach et al., 2020), which was chosen as it spans the duration of both the Leigh and PML records (1953–present), has relatively high spatio-temporal resolution (hourly outputs at 0.25°) compared to several other atmospheric reanalysis of similar temporal span such as NCEP/DOE reanalyses (Kalnay et al., 1996; Kanamitsu et al., 2002) or JRA-55 (Kobayashi et al., 2015), and has been used in other recent studies of MHW drivers in the coastal zone (Karnauskas, 2020; Schlegel et al., 2021). Data were extracted for the nearest ERA5 grid cell to each coastal station that did not intersect with land, which were Leigh: 174°45'E, 36°0'S and PML: 170°45'E, 45°30'S. Grid cells not intersecting with land were chosen as we are studying turbulent heat exchanges over water which are not meaningfully represented in land-based grid cells. Prior to analysis, six-hourly values [12 a.m., 6 a.m., 12 p.m., and 6 p.m. local standard time (NZST)] for each variable were obtained for the period spanning 1953–2020 then averaged to obtain daily time series. Daily anomaly time series were calculated by subtracting from the daily mean of each variable from the 30-year daily climatology spanning the period 1982–2010. Climatologies were computed from the mean value of each variable for each day of the year and then applying a 31 day moving window average to smooth the resulting climatology. It should be noted that the sign convention for fluxes is positive toward the ocean surface so an anomalously positive value corresponds to the flux being anomalously high in the downwards direction. The anomaly time series were averaged over the pre-conditioning (7 days pre-event), onset and decline phase (Figure 2) of MHWs at each coastal station and then normalized by dividing by the standard deviation of the relevant property (Gupta et al., 2020).
2.7. Quantification of MHW trends
Analysing long-term trends in MHW metrics presents several challenges due to their non-parametric nature. For example, the frequency of events can be highly sporadic with several events occurring in one given year and an absence of events in another, sometimes for several years at a time. There is also the challenge of the metrics studied not being normally distributed and MHW duration has, by definition, a lower bound of 5 days. All of the intensities (max, mean, and cumulative) are non-zero bounded as they are either bounded by the 90th percentile climatology values (max and mean) or a multiple of duration that is bounded at 5 days (cumulative). Therefore, standard approaches such as linear regression are not suitable, as assumptions of these tests are not satisfied (Poole and O'Farrell, 1971; Oliver et al., 2018a).
Long-term trends in MHW metrics were assessed using a two-sample Kolmogorov-Smirnov (K-S) test. This approach was selected as it makes few assumptions about the distribution of the data analyzed (Massey, 1951) and has been recently applied in global and regional analyses of trends in MHWs (e.g., Oliver et al., 2018a,b; Behrens et al., 2022). The two-sample K-S test evaluates the difference between the continuous distribution functions of two sample distributions and allows for data that is not normally distributed. In this study, samples from the two periods 1967–1986 and 2001–2020 were compared for six annualized MHW metrics: duration, MHW days, frequency and the maximum, mean, and cumulative intensity. These windows were chosen to capture the first and last 20 years of the concurrent in situ records from Leigh and PML. An α-value of <0.05 was used to identify significant differences in MHW metrics between the two time windows. This analysis was performed on the annualized time series of MHW metrics, as well as four seasonal subsets, representing Austral spring (SON), summer (DJF), autumn (MAM), and winter (JJA).
3. Results
3.1. Detected MHW events and their metrics
There were 132 MHW events detected at Leigh (1967–2020) and 152 at PML (1953–2020), with 134 of the PML events occurring during the same time period (1967–2020) as the Leigh T record (Figure 3). Summary statistics of all events at each location are provided in Table 1. Leigh experienced an average of 2.44 events annually, with 18 of the 54 years analyzed having zero events and 1999 alone experiencing 10 events. Events had a mean duration of 12.96 days, with the longest event spanning 65 days. On average, Leigh was in a MHW state for 32 days each year, with 1999 experiencing 197 MHW days. PML experienced a similar number of events annually, with an average of 2.24 events per year. Similar to Leigh, the most events experienced in 1 year was 10 events, which occurred in 2018. Over the 68 year timeseries at PML, 16 years had no MHW events. PML events had a mean duration of 8.65 days and the average number of annual MHW days was 22 days, with waters in 2018 experiencing 91 days in a MHW state.
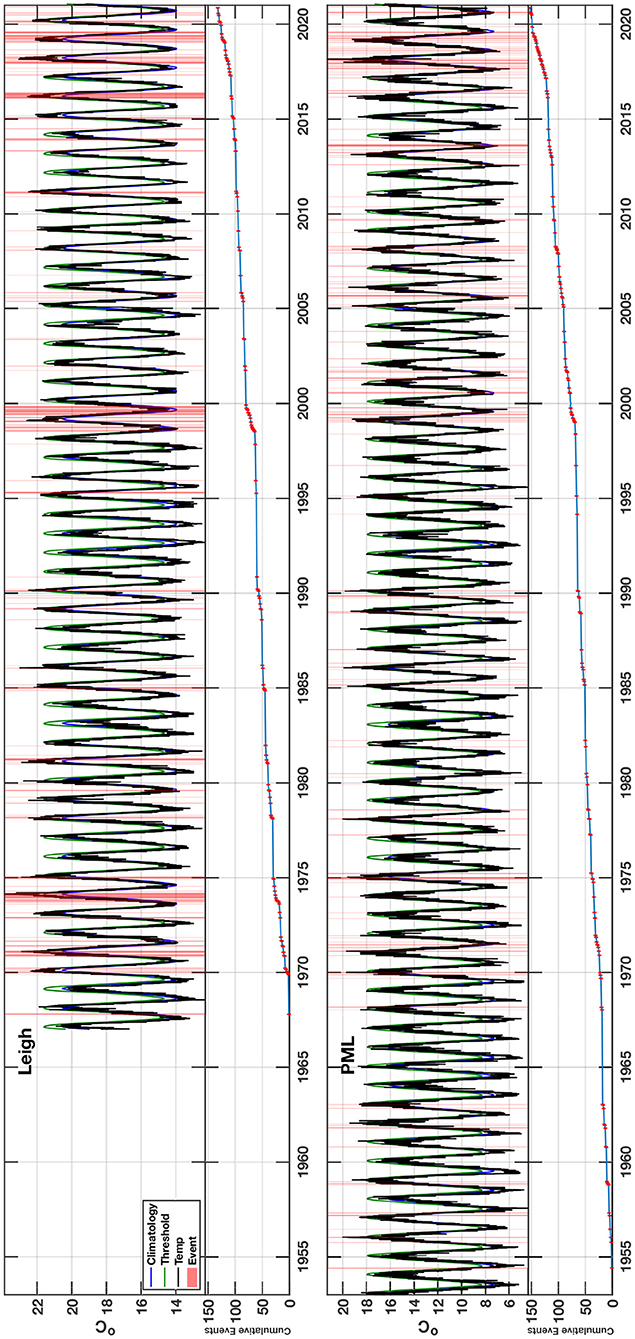
Figure 3. Sea surface temperature (black) at Leigh and PML with climatology (blue), 90th percentile climatology (green) and detected MHW events (red highlight). Cumulative total of MHW events is displayed below both time-series with detected events illustrated as red vertical lines. Figures were produced using code modified from Zhao and Marin (2019).
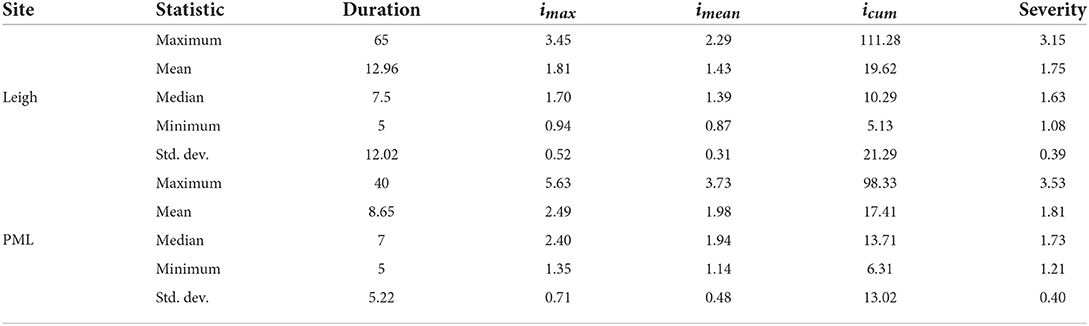
Table 1. Summary MHW statistics for Leigh and PML including the duration, maximum intensity (imax), mean intensity (imean), cumulative intensity (icum), and severity.
MHWs at Leigh are characterized as longer in duration but are generally of weaker intensity than those at PML (Section 2.4, Table 2). At Leigh, the average maximum intensity of events was 1.81°C and the strongest MHW detected had a maximum intensity of 3.45°C. The average mean intensity of events was 1.43°C and the average cumulative intensity was 19.62°C days. At PML the average maximum intensity of events was 2.49°C, with the strongest MHW detected having a maximum intensity of 5.63°C. The average mean intensity of events was 1.98°C and the average cumulative intensity was 17.41°C days. Leigh and PML experience a comparable number of moderate and strong MHWs and there are three severe MHWs detected, one at Leigh in early 1974 and two at PML during mid-1980 and late 2017. Neither site experienced an extreme MHW.
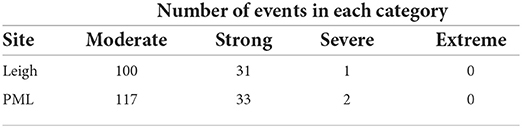
Table 2. Count of detected MHW events at Leigh and PML which are sorted by severity of event, where severity is defined by Hobday et al. (2018).
There was some seasonality in occurrence (Figures 4a,g), with MHWs occurring slightly more frequently (28–32%) during the summer than winter (18–22%). There was clearer seasonality in both maximum and mean intensities of MHWs for both locations, with more intense MHWs occurring during Austral summer (Figures 4c,d,i,j). There was no clear seasonality in the duration, cumulative intensity or severity of events for either location (Figures 4b,e,f,h,k,l). Of interest, the longest MHW recorded at PML, which lasted 40-days, occurred in the middle of Austral winter 2013.
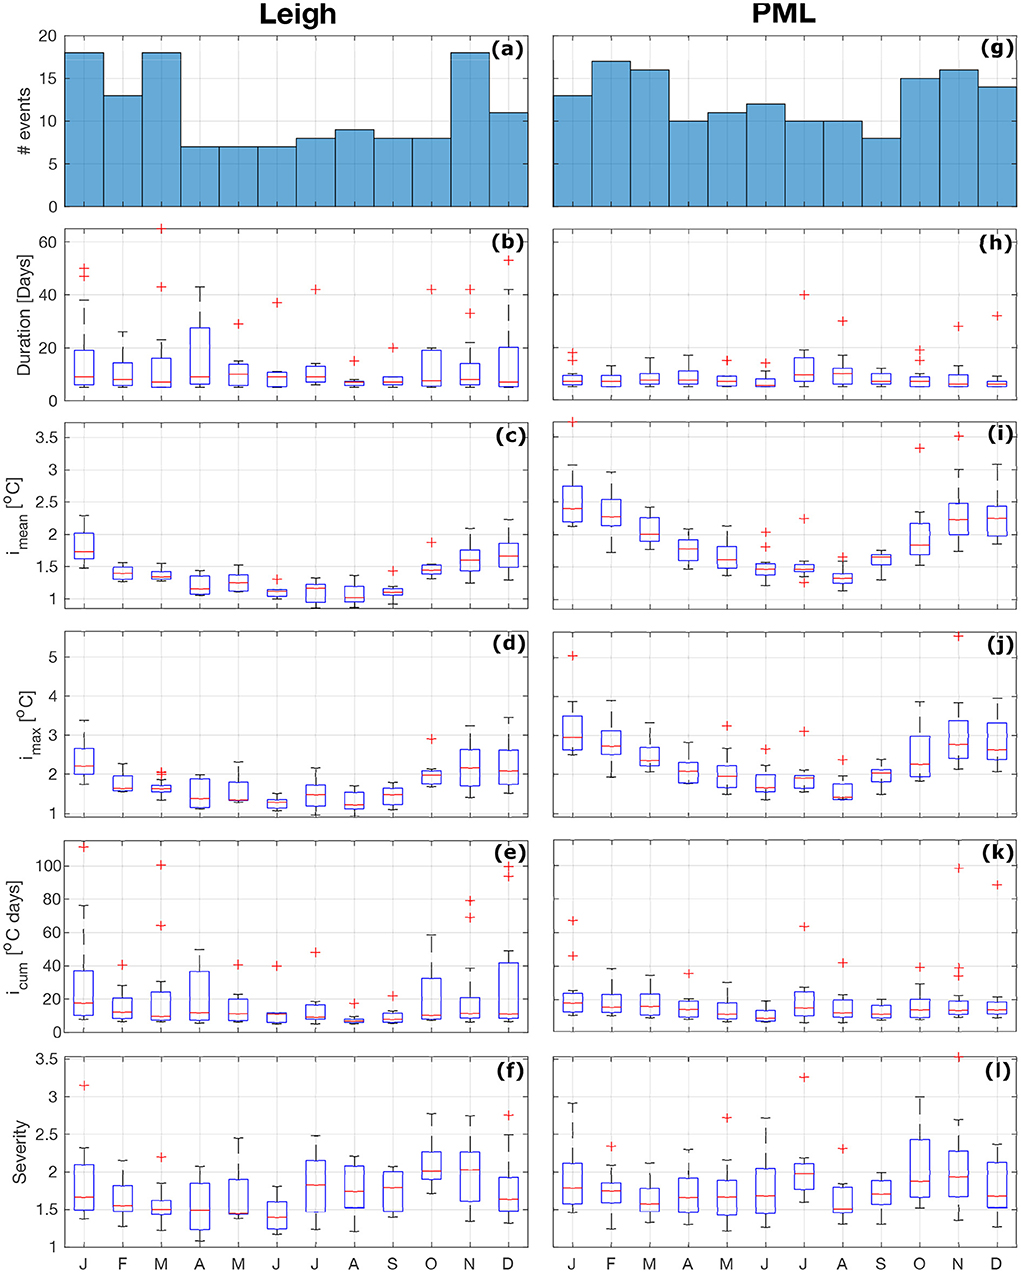
Figure 4. MHW metrics from detected events at Leigh (a–f) and PML (g–l) sorted by month. (a,g) Are histograms of event numbers for each month with box plots (b–f,h–l) of event duration, intensities (mean, maximum, and cumulative) and severity also displayed. Seasonality in mean (c,i) and maximum (d,j) intensity is observed but no clear patterns are observed for duration (b,h), cumulative intensity (e,k), and severity (f,l).
3.2. Interannual variability and trends
There is clear interannual variability in the occurrence and characteristics of MHWs at both coastal stations (Figure 5). Both locations experienced high MHW prevalence (≥7 events) during 1971, 1999, and 2019. Leigh also experienced a high number of MHWs in 1970, 1973, and 1978, whereas PML experienced a high number of MHWs in 2017. Both locations experienced only one MHW during the 4-year periods of 1964–1967 and 1991–1994. MHWs that occurred at Leigh during 1972, 1974, and 2016 stand out as having a much longer mean duration than over events observed at this location, as do events at PML during 1974 and 2013. At both coastal stations, the number of MHW days per year peaks in the early 1970's, 2000s, and late 2010's. It is also apparent that this interannual variability in MHW frequency and number of MHW days per year follows the interannual SST variability at both sites (Figures 5a,h), with years of a greater MHW frequency or days tending to coincide with the “warm” years (Figure 5, highlighted by gray bars).
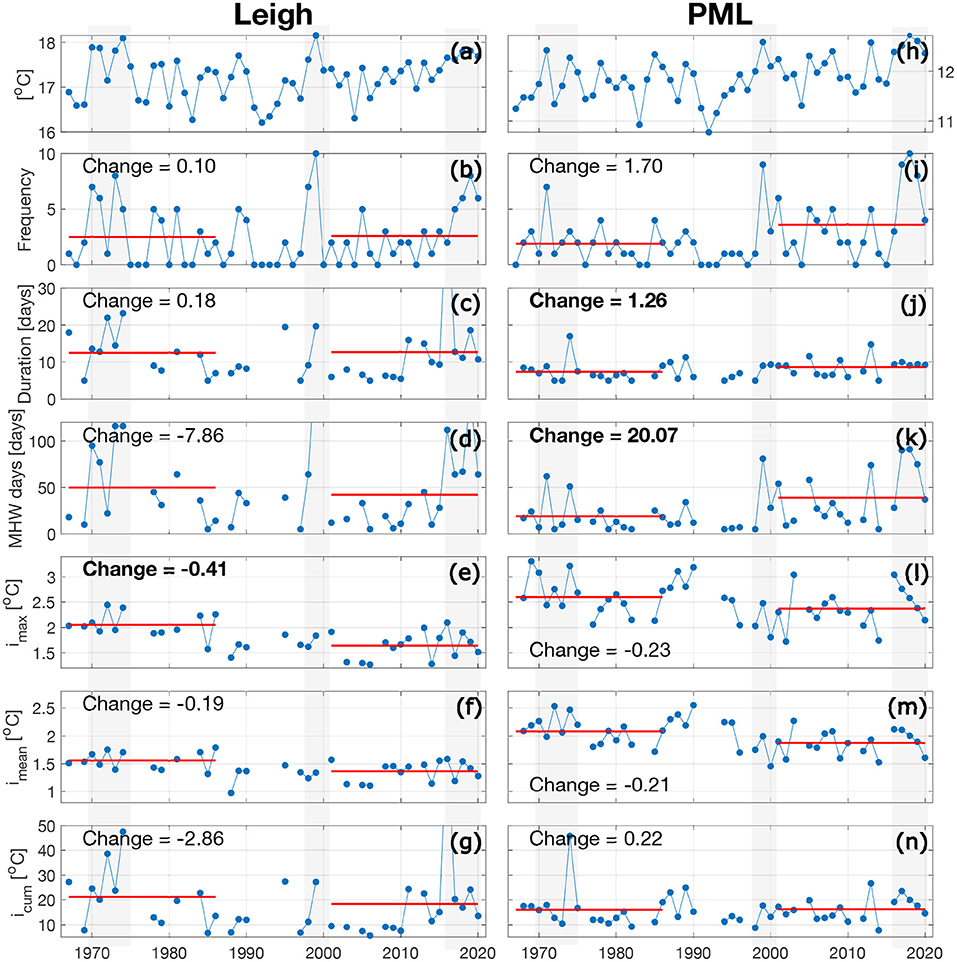
Figure 5. Annual mean sea temperature at Leigh (a) and PML (h) along with annualized MHW metrics of event frequency, duration, number of MHW days, and intensities (maximum, mean, and cumulative) of MHW events at Leigh (b–g) and PML (i–n). Red lines highlight the two time slices used for Kolmogorov-Smirnov tests and the mean value for each of the two periods. Periods of increased MHW frequency and days which coincide with “warm” years are highlighted with gray bars. Significant results are in bold.
Our assessment also reveals contrasting trends in MHW metrics at the two coastal stations over the period 1967–1986 and 2001–2020 (Figure 5, Table 3). There has been a reduction in the frequency of MHWs at Leigh (Figure 5b) and an increase in frequency at PML (Figure 5h), although neither change is statistically significant (p < 0.05). A negative trend in MHW intensity is observed at both sites. Leigh had a significant decrease in maximum intensity (−0.40°C, Figure 5d) and a non-significant decrease in both mean intensity and cumulative intensity (Figures 5e,f). PML had significant increases in both the annual mean duration of events (+1.26 days) and number of MHW days (+19.54 days, Figures 5h,i). This coastal station also experienced a non-significant decrease in maximum and mean intensity (Figures 5j,k).
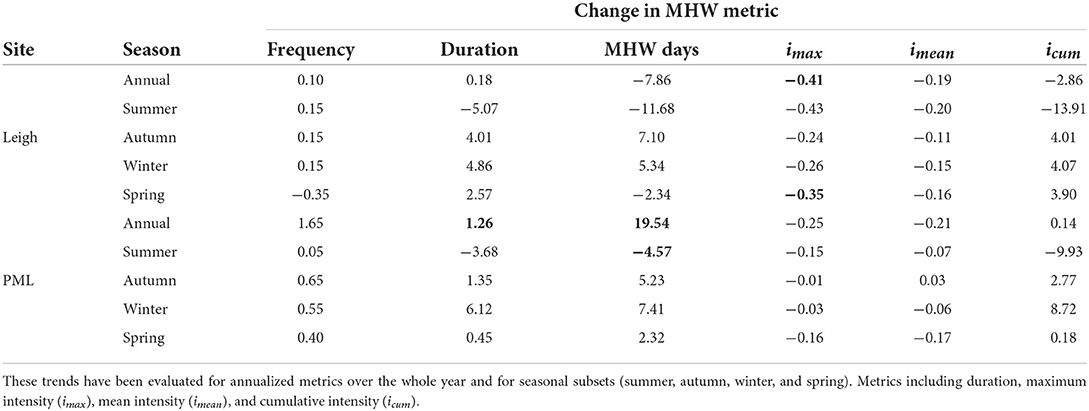
Table 3. Trends in annual MHW statistics at Leigh and PML (significant trends in bold).
An examination of long-term trends computed from seasonal subsets of these data yielded two significant changes; a decrease in maximum intensity at Leigh during spring (−0.31°C) and decrease in the number of summer MHW days at PML (−4.57 days, Table 3). While not significant, both sites had almost exclusively negative trends in maximum and mean intensity as well as positive trends in frequency and duration of events across all seasons.
3.3. Co-occurrence of coastal and offshore MHWs
Recent work has highlighted that there can be a decoupling of events in the nearshore and offshore (Schlegel et al., 2017b), which motivated our investigation of co-occurrence at the two study sites and the shelf surrounding them. There is a relatively high co-occurrence ratio (0.65–0.73) over the coastal and shelf waters surrounding the relatively exposed coastal station at Leigh (Figure 6a). The co-occurrence ratio decreases to ~0.45–0.50 at a distance of 60 km northeast and offshore of Leigh, with this rate of decrease appearing to be stronger in the cross-shore compared to the along-shore direction. Across the whole study site, the mean lag between all co-occurring events was −0.34 days [95% CI: −0.39, −0.29]. On the shelf around Leigh there are mean lags of ±2 days between co-occurring events; however, at the majority (93%) of CCI SST grid cells the lags were not significant (Figure 6c), indicating that MHWs at this coastal station generally develop simultaneously with those over the inner- to mid-shelf.
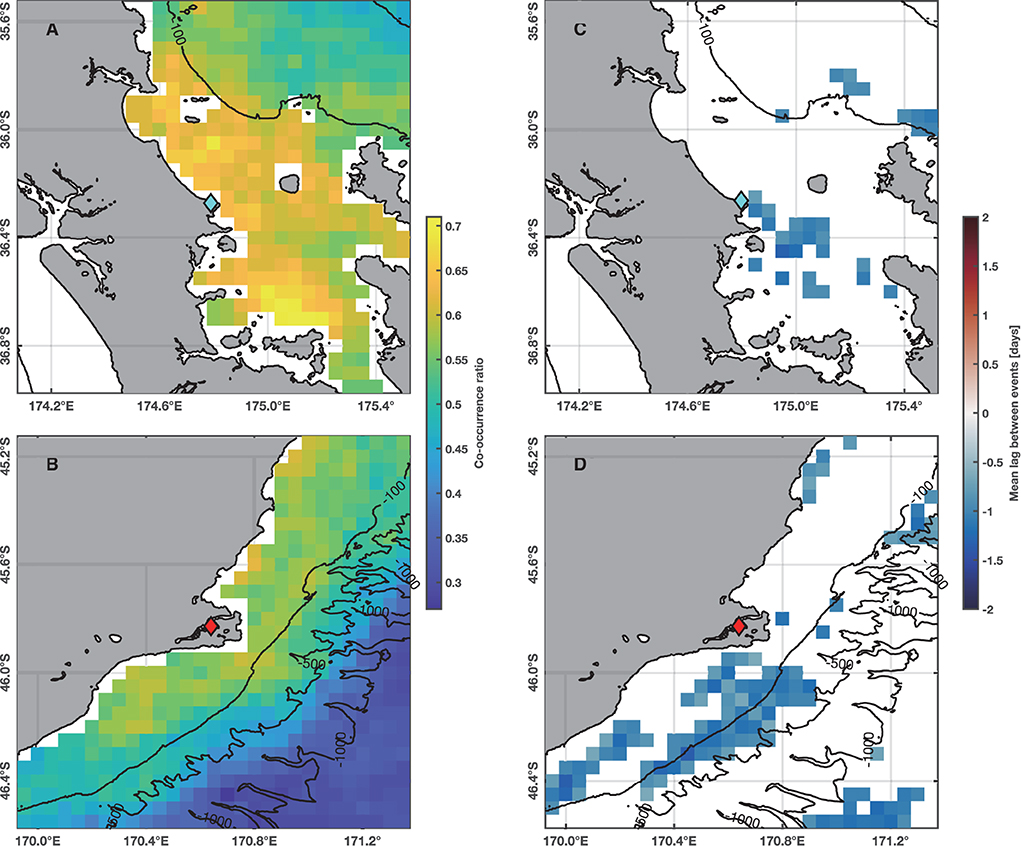
Figure 6. Maps of MHW co-occurrence ratios (fraction of MHWs at study site that a co-occurring MHW at coastal grid cell) between MHWs detected at coastal stations and MHWs at grid cells in the coastal ocean for (A) Leigh and (B) PML. The significant mean lag between MHWs detected at the coastal stations and in the coastal ocean are shown in (C,D). Blue (red) indicates that for co-occurring events, MHWs in the harbor precede (follow) events in the coastal ocean. Also shown is the regional bathymetry with the coastal stations located at the blue (Leigh) and red (PML) diamonds on the maps.
At PML, co-occurrence ratios between MHWs at the harbor site and the surrounding shelf waters are considerably lower than at Leigh, with ratios falling from 0.55 to 0.65 in the coastal waters to well below 0.35 as distance offshore increases. There is a prominent difference in the decline in co-occurrence ratios in the along-shore and cross-shore directions. Co-occurrence ratios decrease rapidly in the cross-shore direction to 0.25–0.3 over a distance of ~30 km, whilst ratios in the along-shore remain at 0.4–0.5 over the same distance (Figure 6C). For all co-occurring events in the study area, the mean lag time was −0.52 days [95% CI: −0.56, −0.48]. The lag-lead between nearshore and offshore MHWs was found to be non-significant for 78% of the grid cells examined over the shelf surrounding PML (Figure 6D); however, some significant results are present in waters southwest of the Otago Peninsula (170.7 E, −45.8 S), with MHWs in the harbor at PML generally leading offshore events by 1–2 days.
3.4. Local atmospheric drivers
We examined the influence of local atmospheric drivers, including the impact of atmospheric pressure systems, wind speeds, air-sea heat fluxes, and atmospheric temperatures, on the evolution of MHWs detected at Leigh and PML (Figure 7), following the approach of Gupta et al. (2020). To assist with interpretation, mean monthly values of atmospheric variables have been presented in Supplementary Figure 3. Generally, Leigh experiences increased wind speeds during winter and both study sites show little seasonality in air pressure or long-wave radiation fluxes. Both locations experience greater insolation and higher air temperatures during summer months with PML having reduced latent and sensible heat loss during winter. It was found that the pre-conditioning phase of MHWs at Leigh and PML are associated with anomalously high mean sea level pressure (MSLP), reduced cloud cover, reduced wind speeds, enhanced downwards shortwave radiation, reduced upward longwave radiation, reduced sensible and latent heat loss and elevated air temperature (Figures 7a,d). Of these atmospheric variables, air temperatures, wind speed, and atmospheric pressure were the most anomalous during the pre-conditioning phase. During the onset phase of MHWs at both locations, there is a tendency for these anomalies to be sustained or intensify, with increases in air temperature and a reduction in latent heat loss being the most apparent (Figures 7b,e). During the decline phase, there was a marked change toward anomalously low MSLP at both stations (Figures 7c,f). Anomalies observed in other atmospheric variables generally decreased in magnitude relative to those observed during the onset phase, although at both Leigh and PML, wind speeds remained anomalously low and air temperatures anomalously high during the MHW decline phase. To assess the sensitivity of these results to variations in MHW duration and severity, the above analysis was repeated considering (i) MHWs that had a duration of 14 days or less (Supplementary Figure 4), (ii) events that had a duration longer than 14 days in duration (Supplementary Figure 5), and (iii) for the ten most severe MHWs at both sites (Supplementary Figure 6). The general pattern and magnitude of atmospheric anomalies for all MHW phases at both study sites were markedly similar when comparing between events grouped by duration and severity and all events at each site (Figure 7), with atmospheric anomalies showing some intensification when considering MHWs longer than 14 days and the most severe events.
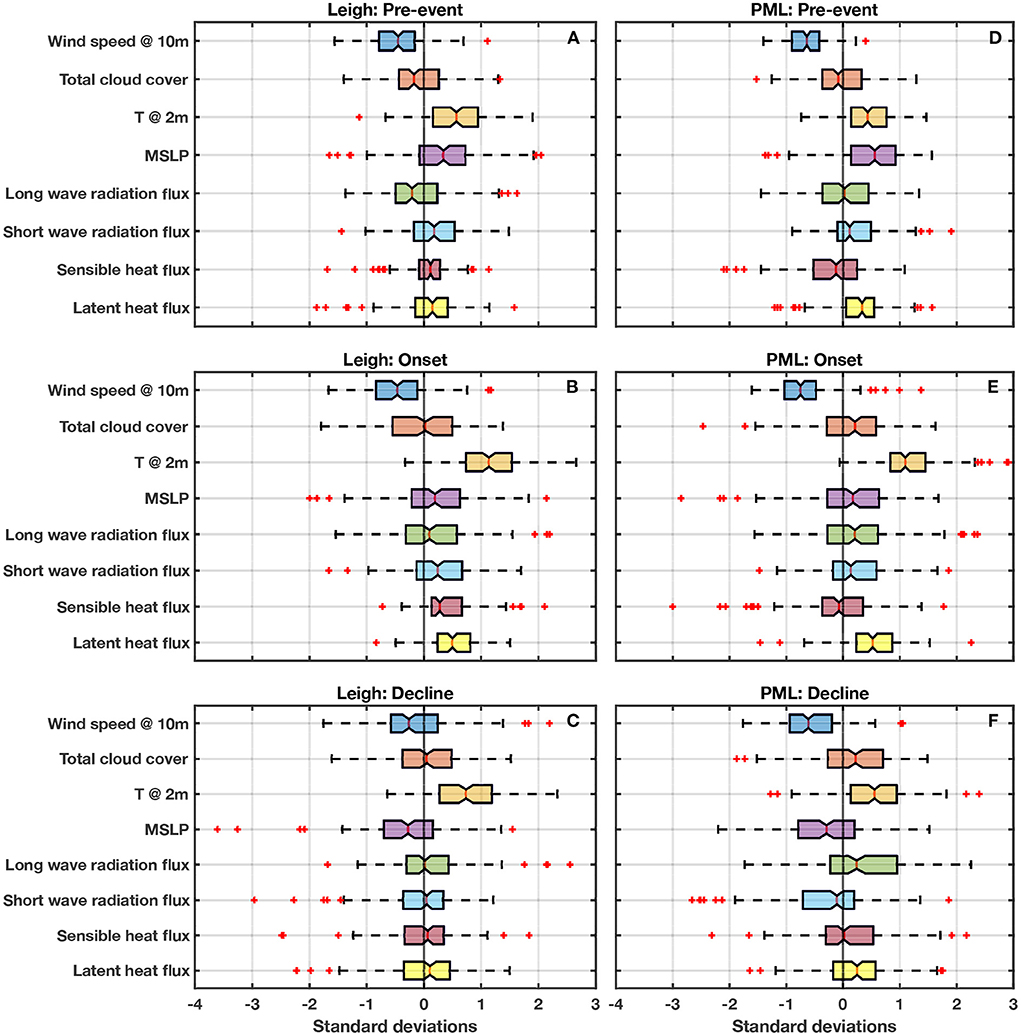
Figure 7. Notched box and whisker plots of normalized atmospheric anomalies averaged over the specified phase for each MHW detected at Leigh and PML. The pre-conditioning phase (A,D) is 7 days before the start of a MHW, onset (B,E) is from the start of the event to the peak intensity date, and decline (C,F) is from the peak intensity date to end of event. Outliers are shown as red crosses.
4. Discussion
We have investigated MHWs detected in two SWMEs around New Zealand using multi-decadal (54 and 68 years) daily, in situ ocean temperature measurements, the longest of their kind in the Southern Hemisphere. We found that most MHWs in the SWMEs were associated with anomalously high atmospheric pressure and low wind speeds, together with increased shortwave heat flux and reduced turbulent heat loss. This is in agreement with the findings of Holbrook et al. (2019), Gupta et al. (2020), and Schlegel et al. (2021) based on MHWs detected in open-ocean and shelf-sea regions. However, we also show that MHWs in the SWMEs can occur in the absence of extreme events detected in satellite-derived SST products in the surrounding shelf-sea, emphasizing the importance of in situ temperature measurements for investigating MHWs in SWMEs.
4.1. Characteristics and seasonality of MHWs in SWMEs
We found that MHWs observed in the harbor environment (PML) generally have a higher mean and maximum intensity than those at the open coast site (Leigh; Table 1). Part of the reason for this difference is that the harbor site experiences considerably higher mean annual day-to-day temperature variability (σ = 0.568°C) than the open coast (σ = 0.361°C). A consequence of the enhanced magnitude of temperature variability is that a larger temperature anomaly will be required at the harbor site to exceed the 90th percentile of previous temperatures at the location and “trigger” a MHW event based on the Hobday et al. (2016) MHW definition. The elevated mean and maximum intensity of MHWs at the harbor site are also likely to be attributable to the relatively shallow nature of the surrounding water body that would facilitate a faster and stronger response to atmospheric conditions (Panin and Foken, 2005; Deser et al., 2010). The harbor that encloses the PML site has a mean depth of 4.5 m (Otago Regional Council and Dunedin City Council, 1991), whilst waters surrounding Leigh are typically between 15 and 25 m (Ballantine and Gordon, 1979). As a consequence, the shallower waters in the harbor at PML would be expected to warm and cool more strongly if subjected to the same amount of radiative heat gain/loss as those at the open-coast site at Leigh. An increased sensitivity of harbor T to the overlying atmosphere compared to the open coastal site may also help explain why MHWs are generally of shorter duration (8.65 days) in the harbor than those at the Leigh (12.96 days), with MHWs potentially being set up and shut down more rapidly by synoptic weather patterns (Rodrigues et al., 2019). The weekly to fortnightly MHW duration timescale observed here, together with the mean and maximum intensities observed in this study, provide realistic boundary conditions for laboratory experiments investigating the impact of MHWs on a range of coastal marine animals and plants (Pegado et al., 2020; He et al., 2021; Strano et al., 2022). However, it should be noted that although the mean duration of events is on the fortnightly timescale, back-to-back MHWs can occur and cause heat stress on organisms for longer than this timescale (for example, a 10 day MHW followed by a few days respite, then a 20 day MHW immediately after giving near-continuous 30 days of heat stress; Figure 3). This result could be considered in future experimental designs investigating effects of MHWs on organisms and could be done by simulating repeated MHWs with some respite periods over a month or more, similar to He et al. (2021) and Zhao et al. (2022).
Also of interest is the relatively low number of severe (3 ≤ S < 4) and lack of extreme (4 ≤ S) MHWs detected in the timeseries from both sites. Several studies have cataloged the most extreme MHW events detected (Holbrook et al., 2020) or performed case studies of individual events (Salinger et al., 2020; Wei et al., 2021) but few investigate the number of events by category on a broad scale. A recent cataloge of MHW events around Australia and the Tasman Sea found that a large portion of the Tasman Sea, isolated parts of the eastern Indian Ocean and, importantly, the coastal ocean along the Great Australian Bight experienced, on average, at least one severe MHW day per year and between zero to one extreme MHW days per year for 2001–2020 (Kajtar et al., 2021). Although no count of events by category at each location was provided, the results of Kajtar et al. (2021) show that some areas had upward of four years and as many as 10 years with at least one severe MHW day. This is in stark contrast to the present study, where we found only one severe event at Leigh and two severe events at PML in records that extend over more than 50 years. A possible explanation is that due to the shallow nature of the two sites studied they are less effective heat reservoirs than the open ocean and heat usually dissipates through evaporative heat transfer too quickly before the severe MHW threshold is met (Panin and Foken, 2005). This means that MHW “remergence” is not likely to occur (as has been observed in large scale, multi-season events, e.g., Di Lorenzo and Mantua, 2016) and that there is little hysteresis in the system e.g between discreet events, seasons, and years. Alternatively, the temperature anomaly required to categorize a MHW as extreme is relatively high for both sites. At no point is the temperature anomaly greater than the 5.6°C (Leigh) or 7.1°C (PML) anomaly which classifies extreme MHWs (Hobday et al., 2018) at these sites. The Gupta et al. (2020) global analysis of the most extreme events found that ~1% (6%) of the most extreme event detected at each grid cells globally achieved a SST anomaly of 7°C (5°C), helping to explain why both the harbor and open coast sites would experience few to no extreme MHWs.
MHWs detected at Leigh and PML both show marked seasonality in the mean and maximum intensity of MHWs, as well as the monthly frequency of events (Figure 4), whilst other MHW metrics (duration, cumulative intensity, and severity) show no clear seasonality. This is somewhat consistent with previous work that has strong seasonality in MHW properties in the open-ocean (Oliver et al., 2018b; Gupta et al., 2020). Recent work by Gupta et al. (2020) found that MHWs tended to have greater maximum intensity, and severity, during summer months, suggesting this was likely due to shallow mixed layer depths, which allows for greater temperature increases for a set amount of heat input (Elzahaby et al., 2022). A seasonally varying mixed layer depth may not necessarily explain the seasonality in MHW intensity observed in the present study, as both locations considered in this study are SWMEs (≤15 m), it seems reasonable to assume they are relatively well mixed across all seasons by tides, wind, and waves (Simpson and Sharples, 2012), with the mixed-layer depth set by the water column depth. An alternative explanation for this seasonality in MHW metrics is the seasonality in the magnitude of anomalies in atmospheric variables such as air-sea heat fluxes (Liu et al., 2011) and wind speed (Bell and Goring, 1998) that are discussed in Section 4.2. The longest MHW detected at PML occurred in the middle of Austral winter 2013. This is of interest as although winter MHW events generally have a lower absolute T-value than those in summer, winter events can still negatively affect SWMEs (Atkinson et al., 2020) and the impacts of long-duration events such as this during winter are not well understood.
4.2. Role of local atmospheric processes in generating MHWs in SWMEs
The large number of MHWs detected in daily T records from two SWMEs allowed us to explore the extent of their coupling with MHWs occurring in the surrounding shelf-sea, which is important for understanding both their drivers and the potential applicability of MHW monitoring and prediction systems (Jacox et al., 2019; Boschetti et al., 2021). Consistent with a previous analysis of coastal MHWs (Schlegel et al., 2017b), not all of the MHWs identified at the open-coast or harbor site were associated with MHW conditions in the surrounding shelf-sea.
We found MHWs at the exposed coastal site at Leigh (Figure 1) often co-occurred with MHWs in the surrounding Hauraki Gulf, which spans 4,000 km2, with co-occurrence rates of 65–73% depending on location over the shelf (Figure 6a). A recent study (Mazzini and Pianca, 2022) of MHWs in a large, mid-latitude estuary has reported similarly high rates of MHW co-occurrence across an area of 12,000 km2, suggesting that MHWs often develop simultaneously throughout semi-enclosed coastal water bodies. The fact MHWs were often not limited to the coastal site at Leigh also emphasizes the potential applicability of real-time MHW monitoring at this location for the wider Hauraki Gulf in general (O'Callaghan et al., 2019). Whilst we found the average lag-lead time (±2 days) between co-occurring events was relatively short, the majority (92%) of the lag-leads tested were not significant (Figure 6c). This is also consistent with the recent study of estuarine MHWs by Mazzini and Pianca (2022), with the high rate of co-occurrence and non-significant lags suggestive that MHWs across the Hauraki Gulf are more closely associated with local air-sea heat fluxes rather than local oceanic heat advection (Mazzini and Pianca, 2022). Indeed, advective MHWs would be anticipated to affect the mid-shelf of the Hauraki Gulf several days or more prior to impacting T at the coastal station, with 5–10 days being the observed transport timescale for subtropical water from the shelf edge to the inner-Hauraki Gulf (Sharples, 1997). On the other hand, MHWs more closely associated with local air-sea heat fluxes (Schlegel et al., 2021) and/or reduced wind-driven vertical mixing (Gao et al., 2020) would be expected to occur near-simultaneously over a broad (100s km) region, consistent with the patterns observed here, within part of a shelf sea, and as also recently highlighted in a large estuary by Mazzini and Pianca (2022).
In contrast to the exposed coast site (Leigh), MHWs detected in the semi-enclosed harbor (PML) appear to be more strongly decoupled from MHWs occurring in the surrounding shelf-sea, with rates of MHWs co-occurring in the harbor and mid- to inner-shelf (<100 m) lying between 55 and 65% (Figure 6b). The absence of an offshore MHW in ~40% of the MHWS detected at this location highlights a key role likely played by local atmospheric forcing in generating MHWs in semi-enclosed harbors. Also notable is that the remaining 55% of MHWs at this location, which occurred in the presence of an offshore MHW, led MHWs in the surrounding shelf sea by a significant margin of 1–2 days. The observation that the harbor environment typically responds first to the conditions generating the MHW provides further evidence that atmospheric forcing is an important contributing factor for MHW generation at this location. Indeed, a relatively shallow, well-mixed harbor would be expected to respond more rapidly to atmospheric conditions (air-sea heat flux, wind events, etc.; Jacobs et al., 1997; Deser et al., 2010) that are known to generate MHWs in coastal water (Schlegel et al., 2017b) compared to deeper, seasonally-stratified waters over the shelf. The relatively short average duration (9–13 days; Table 1) of MHWs at both the exposed coast and harbor sites is also notable, as it aligns more closely with the approximately weekly timescales associated with synoptic scale weather features (Wallace and Hobbs, 2006) rather than the 70–100 day timescales associated with mesoscale variability in boundary currents (Lee et al., 1996; Stanton and Sutton, 2003; Archer et al., 2017). Synoptic weather has a demonstrated effect on sea level pressure around New Zealand, with Sturman et al. (1999) noting that there is an approximately weekly cycle in prevailing synoptic weather systems and the associated atmospheric pressure (depressions and anticyclones) over New Zealand, which is consistent with the mean duration of MHWs at our two study sites (9–13 days; Table 1). Kidson (2000) also found that atmospheric pressure fields over New Zealand are often dominated by particular synoptic weather types (e.g., blocking highs) over periods of ~15 days, again consistent with the mean duration of MHWs observed in this study. These results therefore emphasize atmospheric forcing as a key factor in either generating, or tipping the system over into, MHWs in SWMEs.
Using a statistical assessment of local atmospheric conditions during the detected MHWs (Figure 7), we also considered the role of specific local atmospheric drivers and associated mechanisms, such as air-sea heat fluxes and wind speed, in controlling the generation and decay of these events in SWMEs. We found that during the pre-event and onset phase, MHWs in SWMEs were associated with anomalously high atmospheric pressure, consistent with previous studies on open-ocean MHWs (Holbrook et al., 2019; Gupta et al., 2020). The anomalies observed in other variables are consistent with that expected from an atmospheric high pressure system; increased air temperature as a result of sinking air and adiabatic warming and reduced wind speeds (Ahrens, 2014) that leads to reduced latent heat flux from the ocean (Fairall et al., 2003). In the open-ocean and stratified parts of shelf-seas, reduced wind speeds associated with high pressure systems would also be anticipated to reduce vertical entrainment of cooler subsurface waters toward the surface (Simpson and Sharples, 2012), which has been identified as being an important factor in the generation and evolution of some MHWs (Fewings and Brown, 2019; Salinger et al., 2019; Darmaraki et al., 2020; Chen et al., 2021); however, the two SWMEs studied here are relatively shallow (4.5–15 m) and are likely to be vertically well-mixed (Taylor, 1981; Hunter and Tyler, 1987) such that the impact of reduced entrainment is likely to be negligible. Of these factors, the latent heat flux seems to be of most importance due to it being the most anomalous component of the air-sea heat flux budget. Similar results were also apparent when repeating this analysis for MHWs grouped by event duration and severity (Supplementary Figures 4–6), suggesting that the atmospheric anomalies identified are a robust feature generally associated with MHWs in SWMEs.
The pattern of atmospheric anomalies observed during the decline phase was more complex. We found a shift from anomalously high to low atmospheric pressure, together with a reduction in wind speed, air temperature, and latent heat flux anomalies; however, the direction of the air-sea heat fluxes and wind speed anomalies remained conducive to warming. Therefore, it is not entirely clear what the primary drivers of the decline phase at these locations are. Vogt et al. (2022) found that the decline phase was associated with increased heat loss to the atmosphere due to increased latent heat loss and while we found a decrease in this property during the decline, there was still anomalous latent heat loss to the atmosphere. A case study of two Mediterranean MHWs also found increased latent heat loss to be associated with the decline phase, but also implicated anomalously high wind speed and sensible cooling with increased vertical diffusion (Darmaraki et al., 2020). This is in contrast to the persistent low wind speed and generally non-anomalous air-sea heat fluxes found in our results. The role of advection in dissipating MHWs in the two SWME investigated here was not directly considered in our analysis. That said, one could hypothesize that there is a role played by advection in dissipating these events as was found by Schlegel et al. (2021). The open-coast site will experience unrestricted advection from the greater shelf, while the harbor site has a residence time of 1.5–3 tidal cycles (Heath, 1976), so it seems reasonable to infer that cold-water intrusions could contribute to MHW decline at these locations as well.
Our results suggest that atmospheric high pressure systems, through their associated air-sea heat fluxes, are an important factor contributing to the generation of MHWs in SWMEs. However, as extreme events, several factors rather than one alone, often add together to cause MHWs (e.g., Holbrook et al., 2019; Elzahaby et al., 2021), with only the atmospheric mechanisms investigated here. Variability in regional ocean heat content on interannual to decadal timescales has been identified as an important pre-conditioner for MHWs in the New Zealand region (Behrens et al., 2019), and the role of blocking high pressure systems identified here may simply be in pushing SSTs in an ocean state “primed” for MHWs over a local threshold. Indeed, whilst this study has found MHWs in SWMEs typically co-occur with high atmospheric pressure systems, it remains unclear how successfully this atmospheric factor alone can predict MHW occurrence, even with the ability to reliably predict the arrival and position of high-pressure systems up to a week in advance (American Meteorological Society, 2021), which is a topic left for future research.
Inter-annual variability in MHWs
A unique aspect of this study is the availability of daily in situ records that span over half a century at both sites, which facilitated an investigation of inter-annual variability and trends of MHWs in these two environments. Several years with increased MHW frequency, duration, and intensity have been identified at both sites in the early 1970s and 1980s, late 1990s and late (Figure 5). Analyses of the characteristics and drivers of recent extreme MHWs have been completed for events that occurred during austral summer 2017/2018 (Salinger et al., 2019) and 2018/2019 (Salinger et al., 2020), which overlaps with the recent peaks in frequency and MHW days reported in Section 3.2. Particularly strong MHWs that may merit further case-study investigation are those that occurred during 1974, 1999, and 2016, which are evident from peaks in at least 3 of the annualized MHW metrics considered in this study (e.g., frequency, duration, intensity; Figure 5). It is also apparent that MHWs at both sites tend to occur during the “warmer” years, when the interannual SST is elevated (Figures 5a,h). The magnitude of interannual variability in SST at these sites has been shown to be greater than the long-term trends (Shears and Bowen, 2017), and a similar pattern is evident in the MHW metrics documented here (Figure 5, Table 3). As a result, it seems likely that interannual changes in temperature and MHW occurrence will dominate over the long-term trend at these sites for some time.
There are several factors that may contribute to the observed interannual variability in SST and MHW metrics. Large-scale climate drivers including the El Niño-Southern Oscillation (ENSO) and Southern Annular Mode (SAM) have a demonstrated effect on SST anomalies around New Zealand (Sutton and Roemmich, 2001; Kidson and Renwick, 2002; Hopkins et al., 2010; Bowen et al., 2017; Shears and Bowen, 2017; Holbrook et al., 2019; Sutton and Bowen, 2019). A cursory evaluation of the annual Southern Oscillation Index (SOI) reveals that for both sites studied here, two thirds of MHWs (66 and 69%) occurred in years with a positive SOI, which correlates with La Niña conditions (Supplementary Figure 6). This is consistent with Holbrook et al. (2019) who also found La Niña conditions lead to an increase in SST anomalies around New Zealand and a ~30% increase in MHW days in the eastern Tasman Sea. ENSO may drive variability in MHW metrics through changes in air-sea heat fluxes (Fauchereau et al., 2003; Holbrook et al., 2019). Two record breaking MHWs around NZ during summer 2017/18 and 2018/19 have previously been attributed to the compound effect of anomalously low wind speed and vertical mixing associated with positive ENSO and SAM conditions (Salinger et al., 2019, 2020). However, ENSO variability in SSTs around New Zealand may also arise due to changes in vertical advection of heat into the upper ocean associated with adjustments in the depth of the thermocline forced by Rossby waves triggered by large-scale wind forcing in the South Pacific (Bowen et al., 2017). Recently, Behrens et al. (2019) and Li et al. (2020) have shown that such a Rossby wave mechanism is important for pre-conditioning the ocean by increasing the upper ocean heat content, making it easier for the ocean to be ‘tipped' into a MHW state through either atmospheric or advective forcing. This is important to note as there is likely to be some forecasting ability of years when MHWs will be more prevalent based on large-scale South Pacific wind forcing.
Whilst we have briefly considered relationships between interannual variability in MHWs metrics and the SOI, recent work by Chiswell (2021) highlights that other modes of atmospheric variability can also be important for generating MHW events around New Zealand. Chiswell (2021) found that MHWs occurring in the Tasman Sea, west of New Zealand, co-occur with events in the Atlantic, Indian, and Eastern-Pacific Oceans, due to stalling of a global wavenumber-4 atmospheric wave (Senapati et al., 2021) and argue that understanding this mode of variability is key to increasing MHW prediction skill. While an investigation into the contribution of a wavenumber-4 pattern to MHWs detected here is beyond the scope of this research, we expect an association given the dominance of atmospheric high pressure signal at both sites during the pre-event and onset phases of MHWs.
Long-term trends in MHWs
There was considerable spatial and seasonal variability in the magnitude of long-term trends in the characteristics of MHWs at both coastal stations (Table 3). At the southern site (PML) we found a significant increase in the mean annual duration and number of MHW days per year. In contrast, we found no evidence of a long-term increase in MHW characteristics at the northern site (Leigh); rather, there was a significant decrease in the maximum intensity of MHWs. This spatial variability in the direction of the mean annual long-term trends in MHW characteristics between the two coastal stations, located at the northern and southern limits of New Zealand, is consistent with analyses of long-term change in SST at these locations over the last half century, which show an increase in temperature at PML and no evidence of annual warming at Leigh (Shears and Bowen, 2017). It is also apparent that seasonal variation in the magnitude and occurrence of warming at PML and Leigh (Shears and Bowen, 2017) is manifested in seasonality of the MHW trends. For example, at PML the largest changes in annual mean duration and number of MHW days per year are seen during austral winter (Table 3), when the SST warming trend at this coastal station is strongest (Shears and Bowen, 2017). Similarly, at Leigh, long-term decreases in the maximum intensity of MHWs are strongest during austral spring and summer, during which time the long-term SST trend at this location is negative or neutral (Shears and Bowen, 2017). The spatial variability in long-term MHW trends at the two coastal stations is consistent with regional-scale trends in warming over the satellite era (1982–present), which show warming in coastal waters around most of the South Island and very weak warming along the northeast coast of the North Island (Shears and Bowen, 2017; Sutton and Bowen, 2019). These differing spatial trends in coastal SST around New Zealand have previously been attributed to changes in circulation associated with the spin-up of the South Pacific subtropical gyre under increased wind stress curl (Shears and Bowen, 2017). If there is continued spin-up of the gyre as predicted by Oliver and Holbrook (2014) then it seems plausible that coastal waters of southern New Zealand will experience a continuation of the MHW trends reported here. While we have not found significant positive MHW trends in northeastern New Zealand, we may yet see greater impacts of MHWs here as warming may still occur via other mechanisms (Shears and Bowen, 2017).
Previous studies have reported globally-averaged increases in the frequency, duration and intensity of MHWs over the past century and satellite-era (Oliver et al., 2018a,b; Plecha and Soares, 2020; Qiu et al., 2021), with projections indicating that these trends will continue well into the twenty-first century (Plecha and Soares, 2020; Qiu et al., 2021). Positive globally-averaged annual and seasonal trends in MHW metrics have also recently been reported in studies of coastal MHWs (Hu, 2021; Kajtar et al., 2021; Marin et al., 2021; Thoral et al., 2022). However, considerable spatial variability in the magnitude and occurrence of trends in MHW properties is also apparent along the coastlines of many countries in these studies (e.g., Figures 1, 3 in Oliver et al., 2018a and Figure 4 in Marin et al., 2021. The contrasting trends in MHW characteristics reported here, from two in situ coastal stations in New Zealand, highlight that increases in exposure of marine ecosystems to temperature extremes over the past century (e.g., Oliver et al., 2018a; Marin et al., 2021; Thoral et al., 2022 have not been ubiquitous, and that global and regionally-averaged trends can be strongly modified by complex warming patterns inshore of boundary currents (e.g., Shears and Bowen, 2017).
5. Conclusions
We have utilized the two longest (>50 year) daily in situ ocean temperature records available in the Southern Hemisphere to investigate MHWs in SWMEs, including on an open coastline and within a semi-enclosed harbor. These time series, collected at the northern and southern limits of New Zealand, captured a multi-decadal record of MHWs and enabled a statistical analysis of their characteristics, atmospheric drivers and long-term trends.
We found that MHWs in SWMEs generally occur over timescales consistent with large-scale atmospheric synoptic systems (9–13 days) and become more intense during the summer months. Consistent with a previous study on MHW co-occurrence, we found that a number of MHWs in SWMEs occur in the absence of MHWs in the surrounding shelf-sea, with this effect most apparent in semi-enclosed coastal waters, where the thermodynamics become more strongly coupled with the atmosphere than the surrounding ocean. Our results support a recent study which suggests that atmospheric heat flux is a dominant driver of estuarine MHWs, and further suggests that specific “weather-related” factors which may act as predictors of MHW events in SWMEs are similar to those in the open ocean, including the occurrence of blocking high pressure systems, low wind speed and reduced latent heat fluxes. At a synoptic timescale, numerical weather forecasting systems can reliably predict the arrival and position of high-pressure systems up to seven days in advance, which could support short-term coastal MHW forecasting. However, it remains unclear how successfully coastal MHWs can be predicted based on local atmospheric information alone, with the background upper ocean heat content also known to play an important role in preconditioning the ocean toward MHW occurrence.
The direction and seasonality of long-term trends in MHW properties reported here are consistent with those of long-term SST trends reported at the two coastal stations, suggesting that future trends in MHW properties at these locations will likely mirror projected SST trends. The differing magnitude and direction of long-term trends in MHW properties at these two coastal stations highlights the need for region-specific analysis of MHW risk around New Zealand, due to the heterogeneous impacts such trends may cause to nationally significant marine ecosystems, industry, and coastal communities.
Data availability statement
Publicly available datasets were analyzed in this study. This data can be found at: Leigh in situ data from 1967 to 2011: http://hdl.handle.net/2292/20612. Leigh in situ data from 2011 to present: http://hdl.handle.net/2292/25315. PML in situ data from 1953 to 2020: https://doi.org/10.5281/zenodo.6836865. ESA SST CCI dataset (Good et al., 2019) and the ERA5 atmospheric reanalysis (Hersbach et al., 2020) hosted on the Copernicus Climate Data Store: https://cds.climate.copernicus.eu/.
Author contributions
MR obtained funding for the research. FC undertook all analysis and wrote the manuscript. RS, MR, NC, NS, and MB discussed the results, contributed to their interpretation, and commented on the manuscript during its preparation. All authors contributed to the article and approved the submitted version.
Funding
This work was a contribution to the Moana Project (www.moanaproject.org) funded by the New Zealand Ministry of Business Innovation and Employment, contract number METO1801.
Acknowledgments
We acknowledge the foresight and dedication of the founders of the in situ datasets in the 1950s. We are grateful for all the people involved in the data collection. Notably these include:
• Doug Mackie (data acquisition at PML)
• Jo Evans (data acquisition and history of the Leigh record)
• Bill Ballantine and Elizabeth (Betty) Batham who championed the long term climate sampling at Leigh and PML, respectively
• All the researchers who have assisted with sampling, including our deepest gratitude and condolences to the family of Yue Gui (Alice) who was washed off the rocks at Leigh and drowned while collecting seawater samples.
We would also like to thank members from the Moana Project for their input and feedback on our experiments and interpretation of results, as well as the funding provided to support this work.
Conflict of interest
The authors declare that the research was conducted in the absence of any commercial or financial relationships that could be construed as a potential conflict of interest.
Publisher's note
All claims expressed in this article are solely those of the authors and do not necessarily represent those of their affiliated organizations, or those of the publisher, the editors and the reviewers. Any product that may be evaluated in this article, or claim that may be made by its manufacturer, is not guaranteed or endorsed by the publisher.
Supplementary material
The Supplementary Material for this article can be found online at: https://www.frontiersin.org/articles/10.3389/fclim.2022.1012022/full#supplementary-material
References
Ahrens, C. D. (2014). Essentials of Meteorology: An Invitation to the Atmosphere. Stamford, CT: Cengage Learning.
Amaya, D. J., Miller, A. J., Xie, S.-P., and Kosaka, Y. (2020). Physical drivers of the summer 2019 North Pacific marine heatwave. Nat. Commun. 11, 1–9. doi: 10.1038/s41467-020-15820-w
American Meteorological Society (2021). Weather Analysis and Forecasting. Technical report, American Meteorological Society-Statements. Available online at: https://www.ametsoc.org/index.cfm/ams/about-ams/ams-statements/statements-of-the-ams-in-force/weather-analysis-and-forecasting2/ (accessed June 5, 2022).
Araújo, R., Assis, J., Aguillar, R., Airoldi, L., Bárbara, I., Bartsch, I., et al. (2016). Status, trends and drivers of kelp forests in Europe: an expert assessment. Biodiver. Conserv. 25, 1319–1348. doi: 10.1007/s10531-016-1141-7
Archer, M. R., Roughan, M., Keating, S. R., and Schaeffer, A. (2017). On the variability of the East Australian Current: jet structure, meandering, and influence on shelf circulation. J. Geophys. Res. 122, 8464–8481. doi: 10.1002/2017JC013097
Atkinson, J., King, N. G., Wilmes, S. B., and Moore, P. J. (2020). Summer and winter marine heatwaves favor an invasive over native seaweeds. J. Phycol. 56, 1591–1600. doi: 10.1111/jpy.13051
Ballantine, W., and Gordon, D. (1979). New Zealand's first marine reserve, Cape Rodney to Okakari point, Leigh. Biol. Conserv. 15, 273–280. doi: 10.1016/0006-3207(79)90048-X
Banzon, V., Smith, T. M., Chin, T. M., Liu, C., and Hankins, W. (2016). A long-term record of blended satellite and in situ sea-surface temperature for climate monitoring, modeling and environmental studies. Earth Syst. Sci. Data 8, 165–176. doi: 10.5194/essd-8-165-2016
Behrens, E., Fernandez, D., and Sutton, P. (2019). Meridional oceanic heat transport influences marine heatwaves in the Tasman Sea on interannual to decadal timescales. Front. Mar. Sci. 6:228. doi: 10.3389/fmars.2019.00228
Behrens, E., Rickard, G., Rosier, S., Williams, J., Morgenstern, O., and Stone, D. (2022). Projections of future marine heatwaves for the oceans around New Zealand using New Zealand's earth system model. Front. Clim. 4:798287. doi: 10.3389/fclim.2022.798287
Bell, R., and Goring, D. (1998). Seasonal variability of sea level and sea-surface temperature on the north-east coast of New Zealand. Estuar. Coast. Shelf Sci. 46, 307–318. doi: 10.1006/ecss.1997.0286
Bennett, S., Wernberg, T., Connell, S. D., Hobday, A. J., Johnson, C. R., and Poloczanska, E. S. (2015). The “Great Southern Reef”: social, ecological and economic value of Australia's neglected kelp forests. Mar. Freshw. Res. 67, 47–56. doi: 10.1071/MF15232
Boschetti, F., Feng, M., Zhang, X., Hartog, J., and Hobday, A. (2021). “Statistical prediction of marine heatwaves via machine learning,” in Australian Meteorological and Oceanographic Society Conference 2021, 81. Available online at: https://amos.eventsair.com/amos-2021/abstract-book
Bowen, M., Markham, J., Sutton, P., Zhang, X., Wu, Q., Shears, N. T., et al. (2017). Interannual variability of sea surface temperature in the southwest Pacific and the role of ocean dynamics. J. Clim. 30, 7481–7492. doi: 10.1175/JCLI-D-16-0852.1
Chen, Z., Shi, J., Liu, Q., Chen, H., and Li, C. (2021). A persistent and intense marine heatwave in the Northeast Pacific during 2019-2020. Geophys. Res. Lett. 48:e2021GL093239. doi: 10.1029/2021GL093239
Chiswell, S. M. (2021). Atmospheric wavenumber-4 driven South Pacific marine heat waves and marine cool spells. Nat. Commun. 12, 1–8. doi: 10.1038/s41467-021-25160-y
Costanza, R., d'Arge, R., De Groot, R., Farber, S., Grasso, M., Hannon, B., et al. (1997). The value of the world's ecosystem services and natural capital. Nature 387, 253–260. doi: 10.1038/387253a0
Darmaraki, S., Somot, S., Waldman, R., Sevault, F., Nabat, P., and Oliver, E. (2020). “Mediterranean marine heatwaves: on the comparison of the physical drivers behind the 2003 and 2015 events,” in EGU General Assembly Conference Abstracts. p. 12104. doi: 10.5194/egusphere-egu2020-12104
de Burgh-Day, C. O., Spillman, C. M., Smith, G., and Stevens, C. L. (2022). Forecasting extreme marine heat events in key aquaculture regions around New Zealand. J. South. Hemis. Earth Syst. Sci. 72, 58–72. doi: 10.1071/ES21012
Deser, C., Alexander, M. A., Xie, S.-P., and Phillips, A. S. (2010). Sea surface temperature variability: patterns and mechanisms. Annu. Rev. Mar. Sci. 2, 115–143. doi: 10.1146/annurev-marine-120408-151453
Di Lorenzo, E., and Mantua, N. (2016). Multi-year persistence of the 2014/15 North Pacific marine heatwave. Nat. Clim. Change 6, 1042–1047. doi: 10.1038/nclimate3082
DiCiccio, T. J., and Efron, B. (1996). Bootstrap confidence intervals. Stat. Sci. 11, 189–228. doi: 10.1214/ss/1032280214
Elzahaby, Y., and Schaeffer, A. (2019). Observational insight into the subsurface anomalies of marine heatwaves. Front. Mar. Sci. 6:745. doi: 10.3389/fmars.2019.00745
Elzahaby, Y., Schaeffer, A., Roughan, M., and Delaux, S. (2021). Oceanic circulation drives the deepest and longest marine heatwaves in the east Australian current system. Geophys. Res. Lett. 48:e2021GL094785. doi: 10.1029/2021GL094785
Elzahaby, Y., Schaeffer, A., Roughan, M., and Delaux, S. (2022). Why the mixed layer depth matters when diagnosing marine heatwave drivers using a heat budget approach. Front. Clim. 4:838017. doi: 10.3389/fclim.2022.838017
Fairall, C. W., Bradley, E. F., Hare, J., Grachev, A. A., and Edson, J. B. (2003). Bulk parameterization of air-sea fluxes: updates and verification for the COARE algorithm. J. Clim. 16, 571–591. doi: 10.1175/1520-0442(2003)016<0571:BPOASF>2.0.CO;2
Fauchereau, N., Trzaska, S., Richard, Y., Roucou, P., and Camberlin, P. (2003). Sea-surface temperature co-variability in the Southern Atlantic and Indian Oceans and its connections with the atmospheric circulation in the Southern Hemisphere. Int. J. Climatol. 23, 663–677. doi: 10.1002/joc.905
Fewings, M. R., and Brown, K. S. (2019). Regional structure in the marine heat wave of summer 2015 off the western United States. Front. Mar. Sci. 10:564. doi: 10.3389/fmars.2019.00564
Gao, G., Marin, M., Feng, M., Yin, B., Yang, D., Feng, X., et al. (2020). Drivers of marine heatwaves in the East China Sea and the South Yellow Sea in three consecutive summers during 2016-2018. J. Geophys. Res. 125:e2020JC016518. doi: 10.1029/2020JC016518
Golubeva, E., Kraineva, M., Platov, G., Iakshina, D., and Tarkhanova, M. (2021). Marine heatwaves in Siberian Arctic seas and adjacent region. Remote Sens. 13:4436. doi: 10.3390/rs13214436
Good, S. A., Embury, O., Bulgin, C. E., and Mittaz, J. (2019). ESA Sea Surface Temperature Climate Change Initiative (SST_cci): Level 4 Analysis Climate Data Record, Version 2.1.
Gorman, A. R., Hill, M. G., Orpin, A. R., Koons, P. O., Norris, R. J., Landis, C. A., et al. (2013). Quaternary shelf structures SE of the South Island, imaged by high-resolution seismic profiling. N. Z. J. Geol. Geophys. 56, 68–82. doi: 10.1080/00288306.2013.772906
Gupta, A. S., Thomsen, M., Benthuysen, J. A., Hobday, A. J., Oliver, E., Alexander, L. V., et al. (2020). Drivers and impacts of the most extreme marine heatwave events. Sci. Rep. 10, 1–15. doi: 10.1038/s41598-020-75445-3
He, G., Liu, X., Xu, Y., Liang, J., Deng, Y., Zhang, Y., and Zhao, L. (2021). Repeated exposure to simulated marine heatwaves enhances the thermal tolerance in pearl oysters. Aquat. Toxicol. 239:105959. doi: 10.1016/j.aquatox.2021.105959
Heath, R. A. (1976). Broad classification of New Zealand inlets with emphasis on residence times. N. Z. J. Mar. Freshw. Res. 10, 429–444. doi: 10.1080/00288330.1976.9515628
Hersbach, H., Bell, B., Berrisford, P., Hirahara, S., Horányi, A., Muñoz-Sabater, J., et al. (2020). The ERA5 global reanalysis. Q. J. R. Meteorol. Soc. 146, 1999–2049. doi: 10.1002/qj.3803
Hobday, A. J., Alexander, L. V., Perkins, S. E., Smale, D. A., Straub, S. C., Oliver, E. C., et al. (2016). A hierarchical approach to defining marine heatwaves. Prog. Oceanogr. 141, 227–238. doi: 10.1016/j.pocean.2015.12.014
Hobday, A. J., Oliver, E. C., Gupta, A. S., Benthuysen, J. A., Burrows, M. T., Donat, M. G., et al. (2018). Categorizing and naming marine heatwaves. Oceanography 31, 162–173. doi: 10.5670/oceanog.2018.205
Holbrook, N. J., Scannell, H. A., Gupta, A. S., Benthuysen, J. A., Feng, M., Oliver, E. C. J., et al. (2019). A global assessment of marine heatwaves and their drivers. Nat. Commun. 10, 1–13. doi: 10.1038/s41467-019-10206-z
Holbrook, N. J., Sen Gupta, A., Oliver, E. C., Hobday, A. J., Benthuysen, J. A., Scannell, H. A., et al. (2020). Keeping pace with marine heatwaves. Nat. Rev. Earth Environ. 1, 482–493. doi: 10.1038/s43017-020-0068-4
Hopkins, J., Shaw, A. G. P., and Challenor, P. (2010). The Southland front, New Zealand: variability and ENSO correlations. Contin. Shelf Res. 30, 1535–1548. doi: 10.1016/j.csr.2010.05.016
Hu, L. (2021). A global assessment of coastal marine heatwaves and their relation with coastal urban thermal changes. Geophys. Res. Lett. 48, e2021GL093260. doi: 10.1029/2021GL093260
Hunter, K. A., and Tyler, S. R. (1987). The distribution of zinc and reactive silicate in the Otago Harbour, New Zealand. Mar. Chem. 20, 377–387. doi: 10.1016/0304-4203(87)90069-7
Jacobs, A. F., Jetten, T. H., Lucassen, D., and Heusinkveld, B. G. (1997). Diurnal temperature fluctuations in a natural shallow water body. Agric. For. Meteorol. 88, 269–277. doi: 10.1016/S0168-1923(97)00039-7
Jacox, M. G., Alexander, M. A., Amaya, D., Becker, E., Bograd, S. J., Brodie, S., et al. (2022). Global seasonal forecasts of marine heatwaves. Nature 604, 486–490. doi: 10.1038/s41586-022-04573-9
Jacox, M. G., Tommasi, D., Alexander, M. A., Hervieux, G., and Stock, C. A. (2019). Predicting the evolution of the 2014–2016 California current system marine heatwave from an ensemble of coupled global climate forecasts. Front. Mar. Sci. 6:497. doi: 10.3389/fmars.2019.00497
Kajtar, J. B., Holbrook, N. J., and Hernaman, V. (2021). A catalogue of marine heatwave metrics and trends for the Australian region. J. South. Hemis. Earth Syst. Sci. 71, 284–302. doi: 10.1071/ES21014
Kalnay, E., Kanamitsu, M., Kistler, R., Collins, W., Deaven, D., Gandin, L., et al. (1996). The NCEP/NCAR 40-year reanalysis project. Bull. Am. Meteorol. Soc. 77, 437–472. doi: 10.1175/1520-0477(1996)077<0437:TNYRP>2.0.CO;2
Kanamitsu, M., Ebisuzaki, W., Woollen, J., Yang, S.-K., Hnilo, J., Fiorino, M., et al. (2002). NCEP-DOE AMIP-II reanalysis (R-2). Bull. Am. Meteorol. Soc. 83, 1631–1644. doi: 10.1175/BAMS-83-11-1631
Karnauskas, K. B. (2020). Physical diagnosis of the 2016 Great Barrier Reef bleaching event. Geophys. Res. Lett. 47, e2019GL086177. doi: 10.1029/2019GL086177
Kidson, J. W. (2000). An analysis of New Zealand synoptic types and their use in defining weather regimes. Int. J. Climatol. 20, 299–316. doi: 10.1002/(SICI)1097-0088(20000315)20:3<299::AID-JOC474>3.0.CO;2-B
Kidson, J. W., and Renwick, J. A. (2002). The Southern Hemisphere evolution of ENSO during 1981-99. J. Clim. 15, 847–863. doi: 10.1175/1520-0442(2002)015<0847:TSHEOE>2.0.CO;2
Kobayashi, S., Ota, Y., Harada, Y., Ebita, A., Moriya, M., Onoda, H., et al. (2015). The JRA-55 reanalysis: general specifications and basic characteristics. J. Meteorol. Soc. Jpn. Ser. II 93, 5–48. doi: 10.2151/jmsj.2015-001
Lee, T. N., Johns, W. E., Zantopp, R. J., and Fillenbaum, E. R. (1996). Moored observations of western boundary current variability and thermohaline circulation at 26.5 in the subtropical North Atlantic. J. Phys. Oceanogr. 26, 962–983. doi: 10.1175/1520-0485(1996)026<0962:MOOWBC>2.0.CO;2
Li, J., Roughan, M., and Kerry, C. (2022). Variability and drivers of ocean temperature extremes in a warming western boundary current. J. Clim. 35, 1097–1111. doi: 10.1175/JCLI-D-21-0622.1
Li, Z., Holbrook, N. J., Zhang, X., Oliver, E. C., and Cougnon, E. A. (2020). Remote forcing of Tasman Sea marine heatwaves. J. Clim. 33, 5337–5354. doi: 10.1175/JCLI-D-19-0641.1
Liu, J., Xiao, T., and Chen, L. (2011). Intercomparisons of air-sea heat fluxes over the Southern Ocean. J. Clim. 24, 1198–1211. doi: 10.1175/2010JCLI3699.1
Manighetti, B., and Carter, L. (1999). Across-shelf sediment dispersal, Hauraki Gulf, New Zealand. Mar. Geol. 160, 271–300. doi: 10.1016/S0025-3227(99)00024-9
Manta, G., de Mello, S., Trinchin, R., Badagian, J., and Barreiro, M. (2018). The 2017 record marine heatwave in the southwestern Atlantic shelf. Geophys. Res. Lett. 45, 12–449. doi: 10.1029/2018GL081070
Marin, M., Feng, M., Phillips, H. E., and Bindoff, N. L. (2021). A global, multiproduct analysis of coastal marine heatwaves: distribution, characteristics, and long-term trends. J. Geophys. Res. 126, e2021JC017930. doi: 10.1029/2020JC016708
Martin, C. L., Momtaz, S., Gaston, T., and Moltschaniwskyj, N. A. (2020). Estuarine cultural ecosystem services valued by local people in New South Wales, Australia, and attributes important for continued supply. Ocean Coast. Manage. 190:105160. doi: 10.1016/j.ocecoaman.2020.105160
Massey, F. J. Jr. (1951). The Kolmogorov-Smirnov test for goodness of fit. J. Am. Stat. Assoc. 46, 68–78. doi: 10.1080/01621459.1951.10500769
Mazzini, P., and Pianca, C. (2022). Marine heatwaves in the Chesapeake Bay. Front. Mar. Sci. 8:750265. doi: 10.3389/fmars.2021.750265
Merchant, C. J., Embury, O., Bulgin, C. E., Block, T., Corlett, G. K., Fiedler, E., et al. (2019). Satellite-based time-series of sea-surface temperature since 1981 for climate applications. Sci. Data 6, 1–18. doi: 10.1038/s41597-019-0236-x
Moana Project (2021). Marine Heatwave Forecast. Available online at: https://www.moanaproject.org/marine-heatwave-forecast (accessed January 4, 2022).
O'Callaghan, J., Stevens, C., Roughan, M., Cornelisen, C., Sutton, P., Garrett, S., et al. (2019). Developing an integrated ocean observing system for New Zealand. Front. Mar. Sci. 6:143. doi: 10.3389/fmars.2019.00143
Oliver, E., and Holbrook, N. (2014). Extending our understanding of South Pacific gyre “spin-up”: modeling the East Australian Current in a future climate. J. Geophys. Res. 119, 2788–2805. doi: 10.1002/2013JC009591
Oliver, E. C. J., Burrows, M. T., Donat, M. G., Sen Gupta, A., Alexander, L. V., Perkins-Kirkpatrick, S. E., et al. (2019). Projected marine heatwaves in the 21st century and the potential for ecological impact. Front. Mar. Sci. 6:734. doi: 10.3389/fmars.2019.00734
Oliver, E. C. J., Donat, M. G., Burrows, M. T., Moore, P. J., Smale, D. A., Alexander, L. V., et al. (2018a). Longer and more frequent marine heatwaves over the past century. Nat. Commun. 9, 1–12. doi: 10.1038/s41467-018-03732-9
Oliver, E. C. J., Lago, V., Hobday, A. J., Holbrook, N. J., Ling, S. D., and Mundy, C. N. (2018b). Marine heatwaves off eastern Tasmania: trends, interannual variability, and predictability. Prog. Oceanogr. 161, 116–130. doi: 10.1016/j.pocean.2018.02.007
Otago Regional Council and Dunedin City Council (1991). Otago Harbour Planning Study Report - State One Land Use and Development. Technical report, Otago Regional Council.
Panin, G. N., and Foken, T. (2005). Air-sea interaction including a shallow and coastal zone. J. Atmos. Ocean Sci. 10, 289–305. doi: 10.1080/17417530600787227
Pearce, A. F., and Feng, M. (2013). The rise and fall of the “marine heat wave”9D off Western Australia during the summer of 2010/2011. J. Mar. Syst. 111, 139–156. doi: 10.1016/j.jmarsys.2012.10.009
Pegado, M. R., Santos, C. P., Raffoul, D., Konieczna, M., Sampaio, E., Maulvault, A. L., et al. (2020). Impact of a simulated marine heatwave in the hematological profile of a temperate shark (Scyliorhinus canicula). Ecol. Indic. 114:106327. doi: 10.1016/j.ecolind.2020.106327
Perez, E., Ryan, S., Andres, M., Gawarkiewicz, G., Ummenhofer, C. C., Bane, J., et al. (2021). Understanding physical drivers of the 2015/16 marine heatwaves in the Northwest Atlantic. Sci. Rep. 11, 1–11. doi: 10.1038/s41598-021-97012-0
Pietri, A., Colas, F., Mogollon, R., Tam, J., and Gutierrez, D. (2021). Marine heatwaves in the Humboldt current system: from 5-day localized warming to year-long El Ni nos. Sci. Rep. 11, 1–12. doi: 10.1038/s41598-021-00340-4
Plecha, S. M., and Soares, P. M. M. (2020). Global marine heatwave events using the new CMIP6 multi-model ensemble: from shortcomings in present climate to future projections. Environ. Res. Lett. 15:124058. doi: 10.1088/1748-9326/abc847
Poole, M. A., and O'Farrell, P. N. (1971). The assumptions of the linear regression model. Trans. Instit. Br. Geogr. 145–158. doi: 10.2307/621706
Qiu, Z., Qiao, F., Jang, C. J., Zhang, L., and Song, Z. (2021). Evaluation and projection of global marine heatwaves based on CMIP6 models. Deep Sea Res. Part II 194:104998. doi: 10.1016/j.dsr2.2021.104998
Reyes, O., Manta, G., and Carrillo, L. (2022). Marine heatwaves and marine cold-spells on the Yucatan Shelf-break upwelling region. Contin. Shelf Res. 239:104707. doi: 10.1016/j.csr.2022.104707
Rodrigues, R. R., Taschetto, A. S., Sen Gupta, A., and Foltz, G. R. (2019). Common cause for severe droughts in South America and marine heatwaves in the South Atlantic. Nat. Geosci. 12, 620–626. doi: 10.1038/s41561-019-0393-8
Salinger, M. J., Diamond, H. J., Behrens, E., Fernandez, D., Fitzharris, B. B., Herold, N., et al. (2020). Unparalleled coupled ocean-atmosphere summer heatwaves in the New Zealand region: drivers, mechanisms and impacts. Clim. Change 162, 485–506. doi: 10.1007/s10584-020-02730-5
Salinger, M. J., Renwick, J., Behrens, E., Mullan, A. B., Diamond, H. J., Sirguey, P., et al. (2019). The unprecedented coupled ocean-atmosphere summer heatwave in the New Zealand region 2017/18: drivers, mechanisms and impacts. Environ. Res. Lett. 14:44023. doi: 10.1088/1748-9326/ab012a
Schaeffer, A., and Roughan, M. (2017). Subsurface intensification of marine heatwaves off southeastern Australia: the role of stratification and local winds. Geophys. Res. Lett. 44, 5025–5033. doi: 10.1002/2017GL073714
Schlegel, R. W., Oliver, E. C. J., and Chen, K. (2021). Drivers of marine heatwaves in the Northwest Atlantic: the role of air-sea interaction during onset and decline. Front. Mar. Sci. 8:627970. doi: 10.3389/fmars.2021.627970
Schlegel, R. W., Oliver, E. C. J., Perkins-Kirkpatrick, S., Kruger, A., and Smit, A. J. (2017a). Predominant atmospheric and oceanic patterns during coastal marine heatwaves. Front. Mar. Sci. 4:323. doi: 10.3389/fmars.2017.00323
Schlegel, R. W., Oliver, E. C. J., Wernberg, T., and Smit, A. J. (2017b). Nearshore and offshore co-occurrence of marine heatwaves and cold-spells. Prog. Oceanogr. 151, 189–205. doi: 10.1016/j.pocean.2017.01.004
Senapati, B., Dash, M. K., and Behera, S. K. (2021). Global wave number-4 pattern in the southern subtropical sea surface temperature. Sci. Rep. 11, 1–12. doi: 10.1038/s41598-020-80492-x
Sharples, J. (1997). Cross-shelf intrusion of subtropical water into the coastal zone of northeast New Zealand. Contin. Shelf Res. 17, 835–857. doi: 10.1016/S0278-4343(96)00060-X
Shears, N. T., and Bowen, M. M. (2017). Half a century of coastal temperature records reveal complex warming trends in western boundary currents. Sci. Rep. 7, 1–9. doi: 10.1038/s41598-017-14944-2
Simpson, J. H., and Sharples, J. (2012). Introduction to the Physical and Biological Oceanography of Shelf Seas. Cambridge: Cambridge University Press. doi: 10.1017/CBO9781139034098
Smale, D. A., Wernberg, T., Oliver, E. C. J., Thomsen, M., Harvey, B. P., Straub, S. C., et al. (2019). Marine heatwaves threaten global biodiversity and the provision of ecosystem services. Nat. Clim. Change 9, 306–312. doi: 10.1038/s41558-019-0412-1
Stanton, B., and Sutton, P. (2003). Velocity measurements in the East Auckland Current north-east of North Cape, New Zealand. N. Z. J. Mar. Freshw. Res. 37, 195–204. doi: 10.1080/00288330.2003.9517157
Strano, F., Micaroni, V., Davy, S. K., Woods, L., and Bell, J. J. (2022). Near-future extreme temperatures affect physiology, morphology and recruitment of the temperate sponge Crella incrustans. Sci. Tot. Environ. 823:153466. doi: 10.1016/j.scitotenv.2022.153466
Sturman, A. P., McGowan, H. A., and Spronken-Smith, R. A. (1999). Mesoscale and local climates in New Zealand. Prog. Phys. Geogr. 23, 611–635. doi: 10.1177/030913339902300407
Sutton, P. J. H. (2003). The Southland Current: a subantarctic current. N. Z. J. Mar. Freshw. Res. 37, 645–652. doi: 10.1080/00288330.2003.9517195
Sutton, P. J. H., and Bowen, M. (2019). Ocean temperature change around New Zealand over the last 36 years. N. Z. J. Mar. Freshw. Res. 53, 305–326. doi: 10.1080/00288330.2018.1562945
Sutton, P. J. H., and Roemmich, D. (2001). Ocean temperature climate off north-east New Zealand. N. Z. J. Mar. Freshw. Res. 35, 553–565. doi: 10.1080/00288330.2001.9517022
Tassone, S. J., Besterman, A. F., Buelo, C. D., Walter, J. A., and Pace, M. L. (2022). Co-occurrence of aquatic heatwaves with atmospheric heatwaves, low dissolved oxygen, and low pH events in estuarine ecosystems. Estuar. Coasts 45, 707–720. doi: 10.1007/s12237-021-01009-x
Taylor, F. (1981). Phytoplankton and nutrients in Goat Island Bay, New Zealand. Int. Rev. Gesamt. Hydrobiol. Hydrogr. 66, 377–406. doi: 10.1002/iroh.19810660310
Techera, E., and Winter, G. (2019). Marine Extremes: Ocean Safety, Marine Health and the Blue Economy. Oxon: Routledge. doi: 10.4324/9780429491023
Thomsen, M. S., Mondardini, L., Alestra, T., Gerrity, S., Tait, L., South, P. M., et al. (2019). Local extinction of bull kelp (Durvillaea spp.) due to a marine heatwave. Front. Mar. Sci. 6:84. doi: 10.3389/fmars.2019.00084
Thoral, F., Montie, S., Thomsen, M. S., Tait, L. W., Pinkerton, M. H., and Schiel, D. R. (2022). Unravelling seasonal trends in coastal marine heatwave metrics across global biogeographical realms. Sci. Rep. 12, 1–13. doi: 10.1038/s41598-022-11908-z
Thrush, S. F., Townsend, M., Hewitt, J. E., Davies, K., Lohrer, A. M., Lundquist, C., et al. (2013). “Natural and managed ecosystems: the many uses and values of estuarine ecosystems,” in Ecosystem Services in New Zealand-Conditions and Trends, eds J. Dymond (Lincoln, NB: Manaaki Whenua Press), 226–237.
Vogt, L., Burger, F. A., Griffies, S. M., and Frölicher, T. L. (2022). Local drivers of marine heatwaves: A global analysis with an earth system model. Front. Clim. 4:847995. doi: 10.3389/fclim.2022.847995
Wallace, J. M., and Hobbs, P. V. (2006). Atmospheric Science: An Introductory Survey, Vol. 92. New York, NY: Elsevier.
Wei, X., Li, K.-Y., Kilpatrick, T., Wang, M., and Xie, S.-P. (2021). Large-scale conditions for the record-setting Southern California marine heatwave of August 2018. Geophys. Res. Lett. 48:e2020GL091803. doi: 10.1029/2020GL091803
World Meteorological Organization (2017). WMO Guidelines on the Calculation of Climate Normals. Geneva: World Meteorological Organization.
Zeldis, J. R., Walters, R. A., Greig, M. J., and Image, K. (2004). Circulation over the northeastern New Zealand continental slope, shelf and adjacent Hauraki Gulf, during spring and summer. Contin. Shelf Res. 24, 543–561. doi: 10.1016/j.csr.2003.11.007
Zhao, L., Masanja, F., Xu, Y., Liang, F., Liang, J., He, G., et al. (2022). Exploring HSP90 as a biomarker for marine heatwaves in pinctada maxima. Front. Mar. Sci. 9:913920. doi: 10.3389/fmars.2022.913920
Keywords: marine heatwave, extreme event, shallow water marine ecosystem, coastal oceanography, New Zealand, estuary, harbor, ocean warming
Citation: Cook F, Smith RO, Roughan M, Cullen NJ, Shears N and Bowen M (2022) Marine heatwaves in shallow coastal ecosystems are coupled with the atmosphere: Insights from half a century of daily in situ temperature records. Front. Clim. 4:1012022. doi: 10.3389/fclim.2022.1012022
Received: 04 August 2022; Accepted: 11 October 2022;
Published: 03 November 2022.
Edited by:
Svenja Ryan, Woods Hole Oceanographic Institution, United StatesReviewed by:
Ivan Pérez-Santos, University of Los Lagos, ChileAida Alvera-Azcárate, University of Liège, Belgium
Copyright © 2022 Cook, Smith, Roughan, Cullen, Shears and Bowen. This is an open-access article distributed under the terms of the Creative Commons Attribution License (CC BY). The use, distribution or reproduction in other forums is permitted, provided the original author(s) and the copyright owner(s) are credited and that the original publication in this journal is cited, in accordance with accepted academic practice. No use, distribution or reproduction is permitted which does not comply with these terms.
*Correspondence: Felix Cook, ZmVsaXguY29va0Bwb3N0Z3JhZC5vdGFnby5hYy5ueg==