 Miguel Agulles
 Camilo Melo-Aguilar2,3
- 1Centre Oceanogràfic de Balears, Instituto Español de Oceanografía (CSIC-IEO), Palma, Spain
- 2Universidad Complutense de Madrid (UCM), Madrid, Spain
- 3Universitat de les Illes Baleares (UIB), Palma, Spain
The sun and sea tourism is key for economy of the southern European countries. This economic sector is expected to be severely affected by climate change due to the projected loss of beaches, loss of thermal comfort, water restrictions or extreme events, among other impacts. Thus, adaptation strategies need to be developed urgently. To do so, it is necessary to first conduct an assessment of the risk of loss of tourism attractiveness to guide the development of such strategies. Furthermore, uncertainties in the different factors are considered into the risk analysis. In this study we analyze the risk of loss of tourism attractiveness due to climate change in the Spanish Mediterranean destinations, in the Western Mediterranean, as a case study. To do so, the Vulnerability Sourcebook methodology is adopted and modified to incorporate the uncertainties in the different elements of the impact chains. The increase in heat stress and the loss of beach availability have been identified as the climate change induced hazards that will affect the most the region attractiveness. Also, the impact chains have been constructed and several climatic and socioeconomic indicators have been considered after a knowledge co-production process with selected stakeholders. The weights assigned to each indicator have been obtained from an analytic hierarchy process based on the results of a consultation with sector experts. The results of the impact chain operationalization have shown that exposure and vulnerability in all the touristic destinations in the region are very similar and that the hazard will largely increase in the next decades, specially under the future scenario SSP585 or the RCP8.5. However, the final risk does not seem to suffer a large increase because of the relatively small weight assigned to the hazard. In other words, the exposure (e.g., typology of the tourists and touristic activities) or the vulnerability (e.g., capacity to put in place adaptation strategies) would be more important than the projected change in the hazard (e.g., heat stress increase or beach reduction). The benefits and limitations of the methodology are discussed and some suggestions for the validation of the assessment are proposed.
Introduction
In recent decades, the tourism sector has become one of the most important global economic activities mainly due to technology, information and reduction of boundaries (Peric, 2005). Tourism is a major global economic sector that has undergone tremendous growth over the last 50 years (UNWTO, 2018) and the global economic contribution of the tourism sector has continuously increased since then. The World Travel and Tourism Council (WTTC) estimates the sectorial contribution to global economy in 2015 was US$7.2 trillion (9.8% of the global GDP) and 284 million jobs (9.1% of jobs worldwide) (Wttc, 2016). In this context, the western Mediterranean is one of the favorite tourism destinations (Rovira Soto and Anton Clav, 2017) and the tourism activity has a great impact in the economy of the region (Coccossis and Koutsopoulou, 2020).
Climate change is one of the key future challenges for both developed and developing countries, and therefore for their economic activities, including tourism. With a growing population and a consequent rise of the demand for food, water and energy, and a gradually diminishing natural resource base, climate change will act as a “threat multiplier” (Board, 2007), aggravating resource scarcity and putting further stress on socio-ecological and economical systems. Severe floods, storms, droughts and heat waves as well as groundwater scarcity may change the socio-economic system of a region or country as we know it currently (Fritzsche et al., 2014).
The interaction between the tourism activity and climate change could be assessed from different points of view. From the one side, the global tourism system is currently almost entirely dependent on fossil fuel energy and directly contributes to an important share of greenhouse gas (GHG) emissions that interfere with the climate system (Scott et al., 2012; Gössling and Peeters, 2015). Between 2009 and 2013, tourism's global carbon footprint has increased from 3.9 to 4.5 GtCO2e, four times more than previously estimated, accounting for about 8% of global GHG emissions (Lenzen et al., 2018). Furthermore, the reliance on CO2 emissions offsetting would expose the sector to extensive and continued carbon liability costs along the century, and could be perceived as climate inaction which is contrary to sustainable tourism development (Scott et al., 2016). From the other side, there is a growing sectorial awareness of the vulnerability of tourism to climate change (Gössling and Scott, 2018). However, in spite of that vulnerability and the economic importance of the sector, the investigation of climate-induced impacts on tourism has not received sufficient attention and substantial knowledge gaps still remain (Enríquez and Bujosa Bestard, 2020). In particular, the differential climate change impacts faced by the tourism sector at a regional and destination country scale remains uncertain (Scott et al., 2019).
To reduce those knowledge gaps is not an easy task. For instance, differences in institutional settings, including divergent objectives, needs and priorities, represent a major barrier for the transfer of knowledge from academia to practice (Weichselgartner and Kasperson, 2009). Moreover, researchers look for models that are generalizable, whereas decision-makers require tailored answers, highlighting a disconnection between knowledge production in academia and the need for practical solutions by industry. Such discrepancies affect feedback loops among domains, leading to knowledge gaps, inaccessibility and lack of exchange (Loehr and Becken, 2021).
Regarding tourism in the Mediterranean, a large part of it is based on the “sun and sea” model with a clear seasonality peaking in summer. This type of tourism is potentially vulnerable to the global rise of temperatures that have led to an increase of heat waves in the last years (Lindsey and Dahlman, 2020; Miller et al., 2021). In fact, some authors have concluded that the Mediterranean region will become “too hot” for tourist comfort in the peak summer season by as early as the 2030s (Rutty and Scott, 2010). In addition, a permanent coastal flooding is expected due to the mean sea level rise in the Mediterranean (Agulles et al., 2021; Ciampa et al., 2021) which would reduce the beach resource. Water availability is also expected to be reduced in the coming decades which potentially could strongly affect the tourism activities which are responsible of a large part of water consumption in Mediterranean destinations (Garcia et al., 2022). Finally, the Mediterranean coastal zone is severely impacted by extreme climatic events (e.g., storm surges) coupled with human-induced pressures (e.g., uncontrolled building on coasts), resulting in a growing vulnerability (Satta et al., 2017). All these threats are particularly damaging in the archipelagos due to their high dependence on source markets and tourism economy (Mackay and Spencer, 2017; Vara et al., 2020; León et al., 2021).
In spite of the hints that climate change could have an impact on the tourism activity in the Mediterranean, it is important to produce actionable information for the stakeholders and to assess those impacts in a systematic way. The goal of this paper is to produce a holistic view to the risk of loss of touristic attractiveness due to climate change in Mediterranean coastal destinations. In order to produce a risk assessment useful for the design of adaptation policies and to reduce the above mentioned gap between academia and industry, we propose to follow the Vulnerability Sourcebook (Fritzsche et al., 2014; Zebisch et al., 2017) and the TANDEM framework for the co-production of knowledge (Daniels et al., 2019, 2020). Moreover, in the framework of the UNCHAIN project (https://www.unchain.no), funded by the EU JPI-AXIS program, the methodology has been extended to explicitly quantify the uncertainties associated to the risk computations.
This work is organized as follows. The conceptual framework for risk analysis and the sources of data are presented in section Material and methods. The results in section Results are organized following the module structure of the Vulnerability Sourcebook. The discussion is developed in section Discussion followed by the conclusions in section Conclusions.
Materials and methods
Conceptual framework for risk analysis
Following the IPCC AR5 (Mach et al., 2016), in the context of climate-related impacts, risk is defined as a combination of three interacting components: (1) climate-related hazards (including hazardous events and trends), (2) exposure in places and settings that could be adversely affected and (3) vulnerability of human and natural and socio-economical systems (see Figure 1). So, the risk concept is defined by “the potential for consequences (impacts) where something of value is at stake and where the outcome is uncertain” (Zebisch et al., 2017). Then, it is not enough to identify climate hazards (i.e., floods, heat waves, water scarcity etc.,) but also the grade of affection to the socio-economic system of the region under evaluation. That is, to quantify the possible consequences depending on the exposure and vulnerability components. (Mastrandrea et al., 2010; Fritzsche et al., 2014; Toimil et al., 2017; Leis and Kienberger, 2020).

Figure 1. Illustration of the core concepts of the IPCC WGII AR5. The risk of climate-related impacts results from the interaction of climate-related hazards (including hazardous events and trends) with the vulnerability and exposure of human and natural systems.
In this study, the risk assessment follows the approach proposed in the Vulnerability Sourcebook (Fritzsche et al., 2014), which is based on the concept of Impact Chain (IC). The impact chain is an analytical tool that helps to better understand, systemize and prioritize the factors that drive risk in the system of concern (Zebisch et al., 2017), so it lays the foundation for the entire risk assessment. Nine modules (from m1 to m9) sequentially built are required to complete the assessment (Figure 2). Here we present the results for the first seven modules. In those parts of the assessment where an interaction with stakeholders is required (modules 1 to 3), the TANDEM framework for co-production of knowledge (Daniels et al., 2019, 2020) has been applied. The Tandem framework provides a holistic approach for the co-design of climate services. The framework proposes iterative steps that the three parties (science, industry and police makers) can collectively follow to inform, guide and structure the transdisciplinary interaction for climate-resilient planning based on science knowledge (Daniels et al., 2019).

Figure 2. Structure of an impact chain following the vulnerability sourcebook modules.
In the framework of the UNCHAIN project, a new extension of the IC approach has been implemented in order to take into account the uncertainties linked to each element of the risk assessment (Melo-Aguilar et al., 2022). This will be briefly described here, and the reader is referred to Melo-Aguilar et al. (2022) for further details. In the IC framework, the risk is formulated as the weighted combination of hazard, exposure, and vulnerability indicators. A typical choice is to assume an arithmetic combination, although it could be any other:
where WH, WE and WV represent the relative weight in the final risk of the hazard (H), exposure (E) and vulnerability (V), respectively. At the same time, those three components are defined from a set of indicators:
where hi, ej and vk are the normalized indicators that determine the total hazard, exposure and vulnerability, respectively, and the w's represent the corresponding weights. So, the final risk can be formulated as a combination of scalar quantities:
The proposal of Melo-Aguilar et al. (2022) is to substitute all the scalar quantities by probability density functions (pdf's) that will describe not only the median value of the quantity but also the associated uncertainty. In consequence, the final risk will not be described by a scalar quantity but by a pdf assigning a probability to each value.
In practice, to implement this approach some choices have to be made to define the pdf's. For all those indicators from which enough information could be retrieved, we use a Gaussian function with an amplitude defined by the estimated uncertainties:
Where P represents the probability of having an indicator or weight value, X0 is the central most likely value as provided by the databases or the expert opinions and σ is the range of uncertainty. The uncertainty associated to the indicators could be inferred from the characteristics of the databases (e.g., spread of climate model results or temporal variability of indicator time series).
For those indicators from which a central value could not be identified or even from which there is no information, a homogeneous pdf is used:
where xmax and xmin determine the maximum and minimum possible values.
Regarding the weights assigned to the indicators, they can be derived from existing literature, stakeholder information or expert opinion. In our case, we derive them from expert opinion following the Analytical Hierarchical Protocol (AHP; Saaty, 1990), which is widely used in risk assessment studies (Lamata and Pelaez, 2002; Hsu et al., 2017; Tascon-Gonzalez et al., 2020). This method is based on the comparison by pairs between different choices, which is easier than to consider multiple variables. In particular we have developed an on-line poll to be answered by a wide variety of people with questions aiming at comparing the different indicators by pairs. In the end, from each answered poll we obtain a value for each weight, and the spread of values among all the answered polls define the range of uncertainty of that weight.
Once all the indicator and weights are compiled with their associated uncertainty, the risk is computed using the UNTIC tool (https://untic.pythonanywhere.com/) which is a friendly open-source web tool that do the required computations to propagate the uncertainties.
Study site and data sources
The study area includes the 11 Spanish provinces located in the western Mediterranean (Figure 3) which include some of the most important sun and sea tourism destination in the world (Lanquar, 2015). The source of information for most exposure and vulnerability indicators has been the Instituto Nacional de Estadística (INE; https://www.ine.es/), which is the responsible institute for statistics development in Spain. Detailed information is presented in Table 1. Regarding the climate hazards, two of them have been considered based on the stakeholder's feedback, the increase of heat stress and the loss of sand beach availability (see Section Developing impact chains). Regarding the former, the chosen indicator is the Heat Index (Schwingshackl et al., 2021), which combines relative humidity with the air temperature and is more representative of the perception of heat stress than only using the air temperature. Daily fields of Heat Index during summer months are obtained from an ensemble of 4 global climate simulations (CNRM-CM6-1, CNRM-ESM2, MIROC-ESLL and UKESM1-0-LL) which are part of the 6th phase of the Coupled Model Intercomparison Project (CMIP6, https://cds.climate.copernicus.eu/cdsapp#!/dataset/sis-extreme-indices-cmip6?tab=overview). Regarding beach availability, the hazard indicator considered is the percentage of beach surface loss with respect to the total beach surface. The data for this indicator has been retrieved from Agulles et al. (2021). Note that Agulles et al. (2021) focus on the Balearic Islands and not all the provinces considered here. However, all the provinces have a similar typology of sand beaches and sea level rise projections are very similar for all the region (Cramer et al., 2020). Thus, it is safe to assume that the beach loss in all the provinces will evolve similarly to the Balearic Islands.
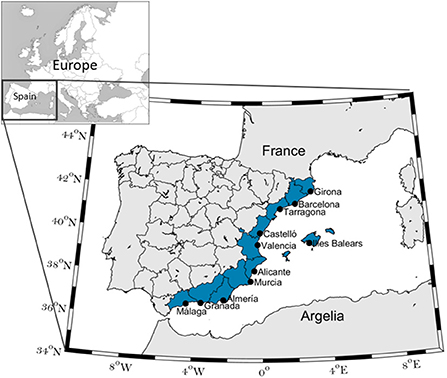
Figure 3. Study site with the provinces included in the study (blue area) and the main cities (black dots).
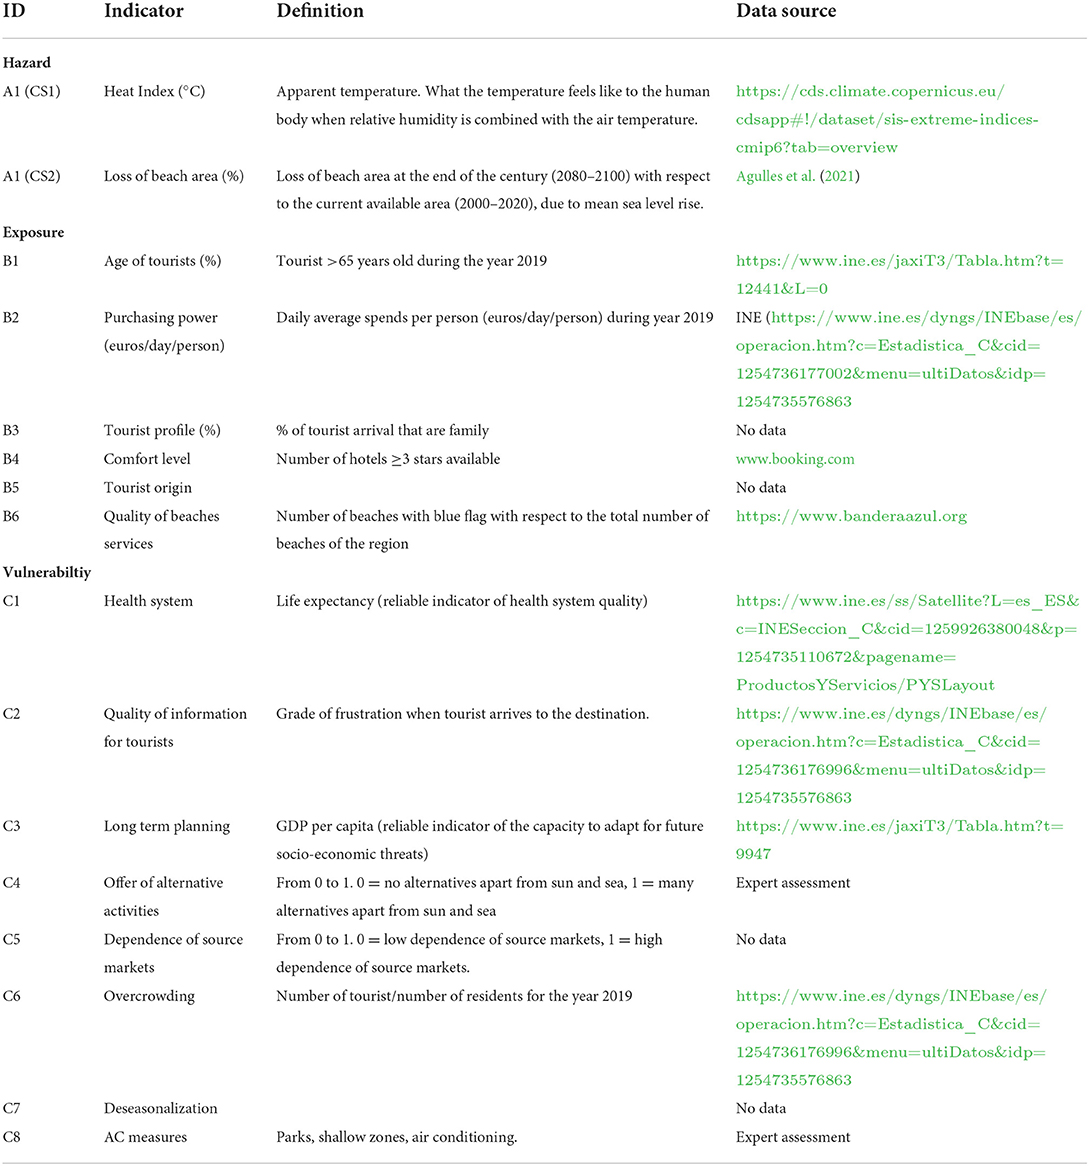
Table 1. Overview of the indicators selected for the impact chains.
All indicators have been aggregated to the province level. The hazard indicators have been computed for the present conditions (2000–2020) and for the end of the century (2080–2100) under the SSP245/RCP4.5 and the SSP585/RCP8.5 greenhouse gas emission scenarios (GHG, https://www.ipcc.ch/report/emissions-scenarios/). Note that the heat index is computed using the more recent SSP scenarios while the beach availability is derived from RCP scenarios as there has not been an update of the Agulles et al. (2021) work with the new scenarios. Nevertheless, the chosen scenarios are very similar in terms of global warming. The exposure and vulnerability indicators have been kept constant to the present conditions in order to highlight how the change in the climate would modify the risk.
Results
Preparing the risk assessment
Following the TANDEM approach (Daniels et al., 2019, 2020), peer to peer interviews have been designed for the co-production of knowledge with experts of the tourism sector coming from academia, industry and regional government. Aiming at having a productive exchange to obtain the most reliable information from them, the interviews were designed to fit the background of the interlocutor and had an average duration of 1 h. Also, all the interviews had the same initial structure, but they were flexible enough to be adapted depending on the feedback from the stakeholder.
The structure of the interviews was designed as follows. First, we briefly introduced the research team to the expert in order to break the ice and to define the position of the interviewer and the interviewee. I.e., to let him/her know that his/her expertise was required to fill some knowledge gaps in a relevant issue that also affects he/she. Some initial questions about the tourism sector status were included in order to have a first unbiased opinion of how climate change was placed among the expert concerns. After this, the threats for the society linked to climate change were presented from a technical point of view, but at the same time understandable and complemented with observational evidence from the last years in the region of interest. Then, the UNCHAIN project goals and the concept of risk were introduced.
Following the introduction, several direct questions were asked to figure out what aspects of climate change may have the largest impact on the sector (e.g., “would water scarcity be a problem? do you foresee any problems linked to the increase of temperature”?). Depending on the hazards that were identified by the expert, several questions were prepared to identify what aspects could play a role in the tourist perception of destination attractiveness (e.g., “do you think all the tourists will be similarly affected by temperatures higher than normal? “Do all types of tourists value the beach quality?”). Also, other questions were prepared to identify the vulnerability aspects and what factors may help for adaptation or mitigation (see the document “List of questions for stakeholders” in the Supplementary Information).
In a final part, some questions were included to get information about what indicators would be the most useful to operationalize the impact chains once defined. To conclude the interview, a final discussion was prepared to rethink about what was discussed and to identify strengths and weaknesses of the sector in front of future adaptation strategies.
Developing impact chains
The peer-to-peer interviews were conducted with eleven experts, four from the administration (a general director from the regional government, a tourism councilor and two technicians), six from the industry (hotel managers, coordinators from hotel associations) and one member from the academia. From the analysis of the interviews, two main hazards potentially affecting the tourism attractiveness were identified: the increase of heat stress and the loss of beach surface. Accordingly, based on the experts' inputs, two impact chains were defined (see Figures 4, 5).
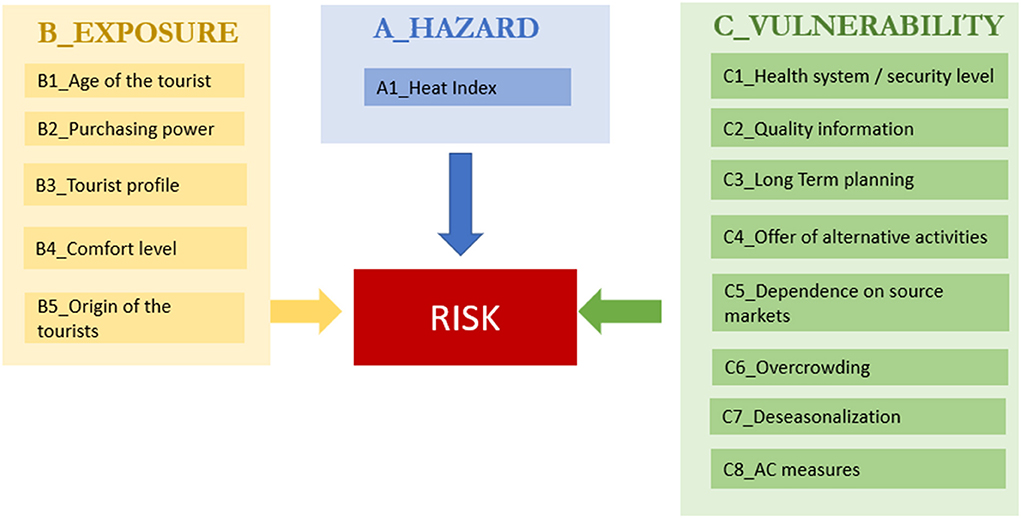
Figure 4. Impact chain 1, corresponding to the “Risk of loss of attractiveness due to an increase in the heat stress”.
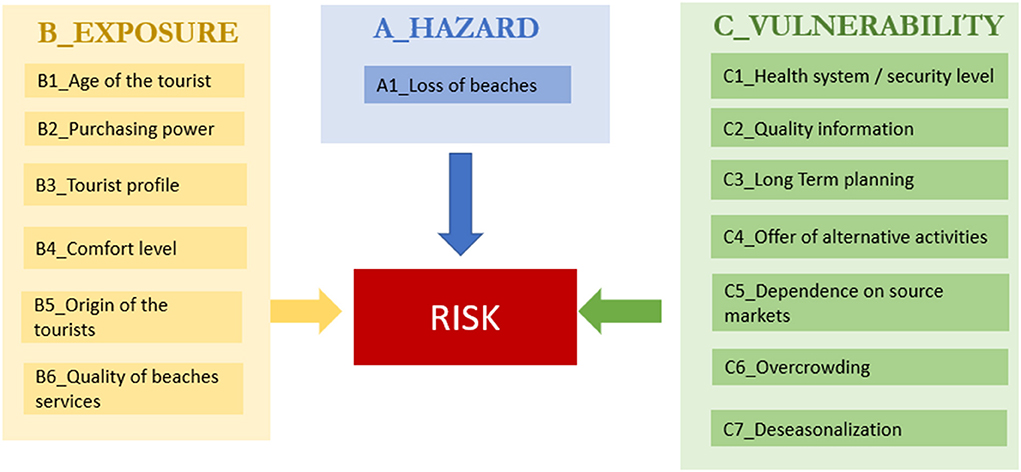
Figure 5. Impact chain 2, corresponding to the “Risk of loss of attractiveness due to a reduction of beach availability”.
Regarding to the first Impact Chain: “Risk of loss of attractiveness due to an increase in the heat stress” 14 indicators have been selected (Figure 4). Regarding the exposure of the tourists to the increase of heat stress, all the experts agreed that in order to quantify the comfort level of the tourist when a heat wave is happening during their holidays, the status of the hotel is relevant (B4), since they can stay in the hotel premises enjoying the services provided (AC, pool, bar, spa etc.,), to avoid the outdoors high temperatures. Also, the perception of discomfort is related to their purchasing power (B2). The age of the tourist (B1) is another obvious indicator when the tourist faces a heat wave, as heat has a stronger impact on older people with respect to younger ones (Zhang et al., 2018). Also, the origin of the tourists can modify the perception of heat (B5, e.g., tourists from Mediterranean countries are more familiar with the warm events). Finally, the type of activities the tourists are conducting could also affect (B3, e.g., only beach related activities, sightseeing, hiking, biking,).
Concerning the vulnerability part, the experts agreed on considering that the quality of the health system and the level of safety (C1) may affect the attractiveness. The quality of the information provided to the tourists (C2, e.g., early-warning systems) can help to reduce the negative feelings induced by heat stress. Long term planning (C3) and coordination among different administrations and the industry is a key aspect that is needed for a successful implementation of adaptation strategies. The capacity to offer alternative activities less affected by heat (C4) can improve the tourist perception as well as the availability of AC measures (C7, e.g., fountains, green areas, projects of fresh air recirculation in buildings, etc...). Conversely, the level of overcrowding (C6) can have a negative impact as the massification of touristic areas can add up to the feeling of discomfort. Finally, two vulnerability aspects were pointed out as potentially relevant. The first one was the dependency on source markets (C5), as a strong dependence on a few foreign markets, reduce the flexibility to attract tourists from countries less sensitive to heat stress. The second one was the level of seasonality in the tourist arrivals (C8). A tourist destination strongly dependent on the arrivals during the hotter summer period would suffer more than another one which is able to shift a significant part of the arrivals to other cooler seasons.
For the second impact chain (IC2): “Risk of loss of tourism attractiveness due to the reduction of beach availability”, the experts identified almost the same indicators as potentially relevant for the risk assessment (see Figure 5). The only difference is that they have considered that the quality of beach services (B5) should be taken into account as an additional element of exposure. Conversely, the vulnerability indicator related to the availability of AC measures was obviously discarded.
Identifying and selecting indicators
The heat stress can be defined in many ways (e.g., from raw temperature, physiological parameters, heat wave indices, etc...). In our case, for this hazard indicator, we have chosen the Heat Index (Schwingshackl et al., 2021), which combines relative humidity with the air temperature and is more representative of the perception of heat stress than only using the air temperature. The average of the heat index for the summer period (June, July and August) is considered as a measure of the heat stress. For the beach availability, the hazard indicator considered is the percentage of beach surface loss due to sea level rise with respect to the total beach surface in present conditions.
Concerning the characteristics of the tourists, several indicators have been defined. The age of the tourists (B1) is represented by an indicator measuring the percentage of tourists older than 65 years with respect to the total number of tourists. This gives a reasonable view of the share of exposed population to heat stress and beach availability. The averaged wealth of the tourists in a destination (B2) is quantified by the daily average spend per person. Finally, the origin of the tourists (B5) is represented by the percentage of tourists from warm countries (i.e., with temperatures similar to the destination) with respect to the total number of arrivals.
The characteristics of the destination are also represented in the impact chains. The level of accommodation comfort (B4) in a destination is defined as the fraction of hotels with more than 2 stars. The quality of beach services (B6) is described by the number of beaches with blue flags with respect to the total number of beaches in the region. The quality of the health system at the destination (C1/ is represented by the life expectancy and the long-term planning capacity (C3) is measured by the GDP per capita, as it is commonly related (i.e., countries with higher GDP have the political structures that allow long-term planning). An overcrowding index (C6) is defined as the number of tourists over the number of residents and the tourism seasonality (C7) is defined as the ratio of summer tourists over the annual average of tourist arrivals.
There are other elements of the impact chains that could not be quantified objectively. For those elements qualitative indicators have been developed based on expert opinion. These are the type of activities conducted by tourists (B3), the quality of tourist information (C2), the offer of activities not related to sun and sea tourism (C4), the dependence on source markets (C5) or the existence of cooling infrastructures (C8).
Data acquisition and management
The data required for the above identified indicators have been obtained from the databases described in Section Study site and data sources and Table 1 and aggregated to province level (see Supplementary Table 1). For those indicators where no information was available at all, the associated pdf is set to a homogeneous pdf where all values between 0 and 1 are equally likely (i.e., maximum uncertainty).
Normalization of indicator data
In order to homogenize the different indicators, which are expressed in diverse units, the original data has been normalized to a scale from 0 to 1. For the quantitative indicators, this has been done using a linear transformation. Data below a pre-defined minimum threshold correspond to a value of 0, data above a pre-defined maximum threshold correspond to a maximum value of 1 and for the values in the middle the following formula has been applied:
where I is the original value of the indicator and Imin and Imax are the minimum and maximum thresholds, which have been subjectively set by the experts (Table 2).
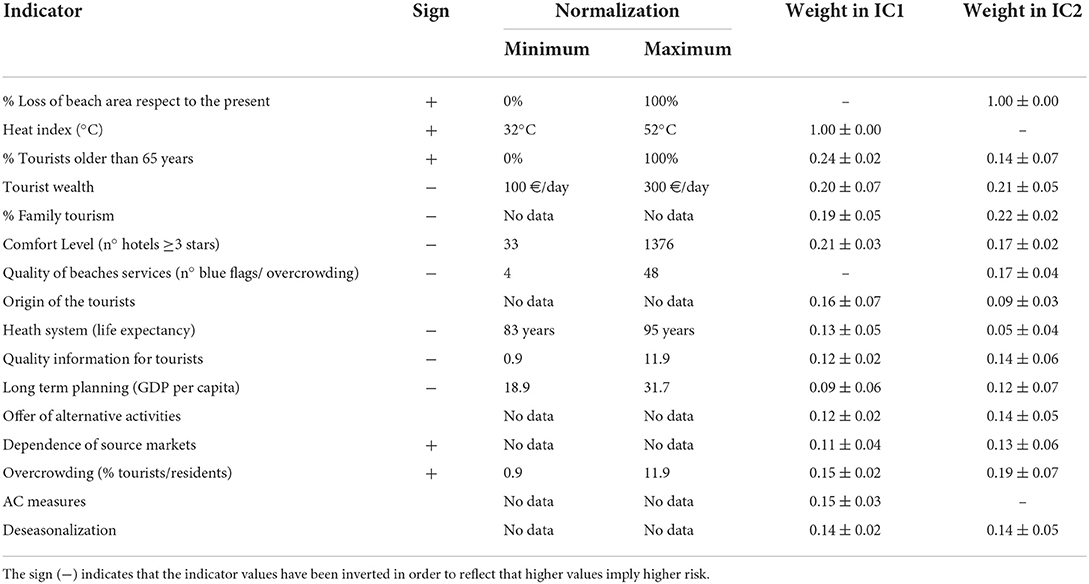
Table 2. Normalization thresholds and weights assigned for each indicator in the two ICs.
For qualitative indicators based on expert opinions four categories were set (low, mid-low, mid-high, and high). The experts were asked to fit the indicator value into one of those categories. Then, they were transformed to a numerical value (0.12, 0.37, 0.62, and 0.87, respectively) with an associated homogeneous uncertainty of 0.25.
Finally, it must be noted that all indicators have been defined in a way that higher values imply higher risk.
Weighting and aggregating of indicators
The AHP based on the results from the polls described in Section Conceptual framework for risk analysis, has allowed to quantify the weight associated to the indicators along with their uncertainties. It must be noted that the participatory poll (see the document “List of questions for stakeholders” in the Supplementary Information) has been designed to obtain the weights among indicators (level 2, weights in equation 2), and also the relative importance among the risk components (level 1, weights in equation 1, see next section).
In the IC-1 (“risk of loss of attractiveness due to an increase in the heat stress”), all the exposure indicators have similar weights with values ranging from 0.16 to 0.24. The associated uncertainties are relatively small being between 0.02 and 0.07, which represents a noise-to-signal ratio below 0.4 in all cases (i.e., the magnitude of the uncertainty is less than a 40% of the weight value). For the vulnerability indicators, the weights are also very similar, with values between 0.09 and 0.15. The associated uncertainty ranges from 0.02 to 0.06 and represents a noise-to-signal ratio also below 0.4 in all cases except for indicator C3 (Capacity for long term planning), which reaches a noise-to-signal ratio of 0.7 (see Table 2).
In the IC-2 (“Risk of loss of attractiveness due to a reduction of beach availability”), most of the exposure indicators have a similar weight, although the indicators B3 (related to the type of tourist activities) and B2 (related to the tourist wealth) have slightly higher weights. Conversely, the indicator B6 (country of origin) is the one with the lowest weight. The associated uncertainty ranges from 0.02 and 0.07 and the noise-to-signal ratio is lower than 0.25 except for B1 (tourist age) for which the uncertainty is about half of the weight value. The weights obtained for the vulnerability indicators are similar for most of them with some exceptions. The weights for C1 (quality of the health system) and C7 (presence of cooling infrastructures) are relatively small while C6 (overcrowding) is the one with the largest weight. The associated uncertainties are larger in this case, with values ranging from 0.04 to 0.07, which represents a noise-to-signal ratio between 0.35 and 0.65 (see Table 2).
The aggregated indicators for each impact chain are presented in Figures 6, 7 for present conditions and for the end of the century under the two GHG scenarios. The value of each indicator is presented in Supplementary Table 1.
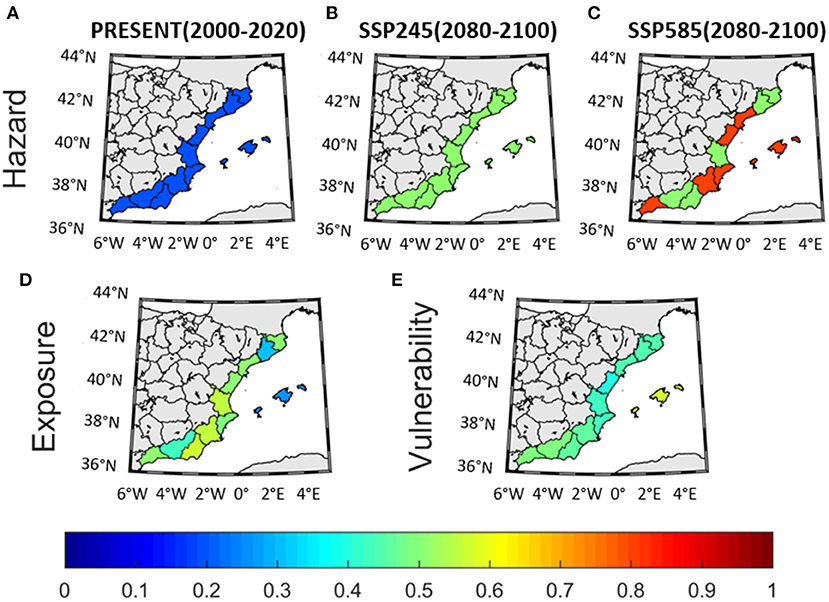
Figure 6. Aggregated indicators for impact chain 1, corresponding to the “Risk of loss of attractiveness due to an increase in the heat stress”. (A) Hazard value in present conditions (200–2020), (B) at the end of the century (2080–2100) under SSP245 and (C) under SSP585. (D) Exposure and (E) Vulnerability. Note that (D,E) have the same values for present and future.
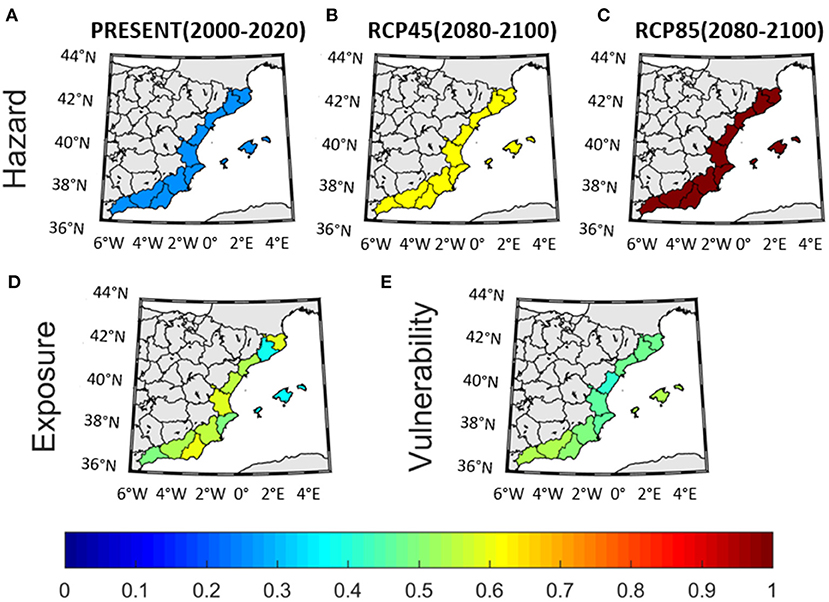
Figure 7. Aggregated indicators for impact chain 2, corresponding to the “Risk of loss of attractiveness due to a reduction of beach availability”. (A) Hazard value in present conditions (200–2020), (B) at the end of the century (2080–2100) under RCP45 and (C) under RCP85. (D) Exposure and (E) Vulnerability. Note that (D,E) have the same values for present and future.
Regarding the IC-1, the hazard in present climate is low everywhere, as the summer average of heat index is below 31°C in all provinces. Under scenario RCP4.5 the index increases through the XXI century reaching a range of values between 32.2 and 35.4°C, which is equivalent to medium threat for heat disorders. Under scenario RCP8.5 the values reach a range between 37.5 and 40.5°C which implies a high threat for heat disorders. The lowest value (0.30) is found in the Balearic Islands and is driven by the higher comfort of the accommodation (B4) and the profile of the tourists choosing that destination (B3). The higher values (0.55) are obtained in Valencia and Almeria. In the former, the age of the tourists (B1) pushes toward higher values while in the later the comfort level (B4) of the accommodation drives the exposure to lower values. Concerning the vulnerability, the values are more homogeneous ranging from 0.42 to 0.55. The reason for this homogeneity is that all destinations show very similar values in most of the indicators. The exception is on the quality of the information provided (C2) and the overcrowding (C6), which is very diverse among the destinations. The associated uncertainties (see Supplementary Table 2) are lower than a 10 % of the aggregated values and the distribution shape is close to a Gaussian distribution (see Supplementary Figure 1).
For the IC-2, the hazard values are very homogeneous in all the destinations at any temporal horizon (see Supplementary Table 3). The reason is that the sandy beaches in all the region have very similar characteristics (i.e., grain size, beach slope) and the projected changes in sea level and waves in the whole region are expected to be fairly homogeneous. In consequence, the hazard at the end of the century in all destinations will reach medium values under scenario RCP4.5 and will be very high under scenario RCP8.5. The exposure in the Balearic Islands is again the lowest (0.39) and in Valencia and Almeria the highest (0.58) for the same reasons that in IC-1. The vulnerability is again rather homogeneous and similar to what was found in IC-1. Concerning the uncertainties (see Supplementary Table 3 and Supplementary Figure 2), they are lower than a 10% keeping an almost Gaussian shape.
Aggregating risk components to risk
Concerning the weights of the risk components, the results are similar in the two impact chains (Table 3). The weight of the hazard on the final risk is 0.13 and 0.21 for the IC-1 and IC-2, respectively. The exposure is more relevant in the IC-1 with a weight of 0.52 and a weight of 0.38 in the IC-2 while the vulnerability is more influential in IC-2 (0.41) than in IC-1 (0.34). The associated uncertainties are smaller in the IC-1, with values around 0.10, than in IC-2 with values ranging from 0.15 to 0.23.
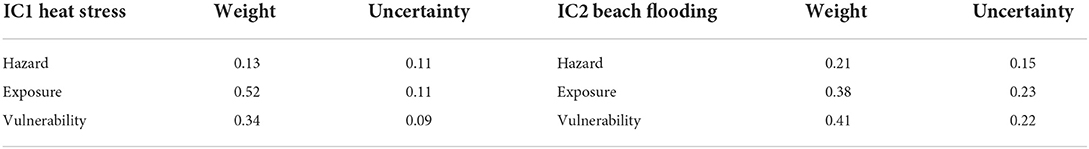
Table 3. Weights and uncertainties among level-1 components of the risk for both impact chains.
Using those weights to combine the aggregated indicators presented above, we obtain the final risk for present conditions and for the end of the century under GHG scenarios (Figures 8, 9 and Table 4). Concerning the IC-1, the risk associated to the heat stress increases with time under both GHG scenarios. In present conditions it takes values in the range of 0.37–0.49 and goes up 0.40-0.52 under scenario RCP4.5 and to 0.40–0.55 under scenario RCP8.5. The relatively small change is linked to the low importance experts gave to the heat stress in front of the exposure and vulnerability. In other words, they considered that the potential loss of attractiveness of the destination depends more on the typology of the tourists and the activities they perform than to the actual magnitude of the heat stress.
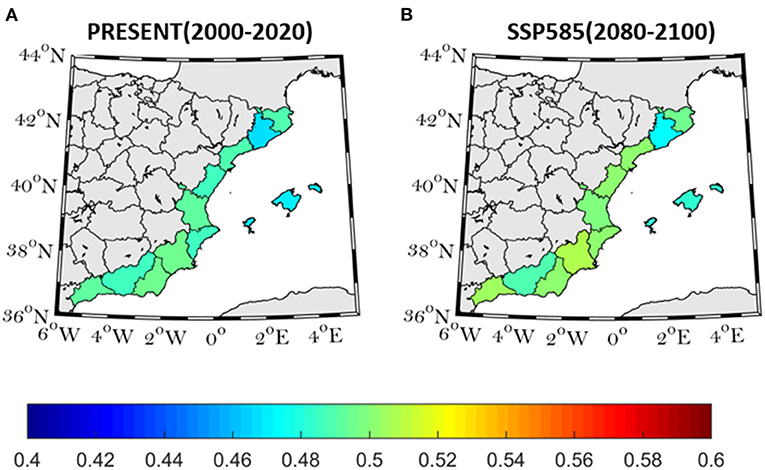
Figure 8. Final risk of the impact chain 1, corresponding to the “Risk of loss of attractiveness due to an increase in the heat stress”. For (A) present conditions (2000–2020) and (B) for the end of the century (2080–2100) under SSP585 scenario.
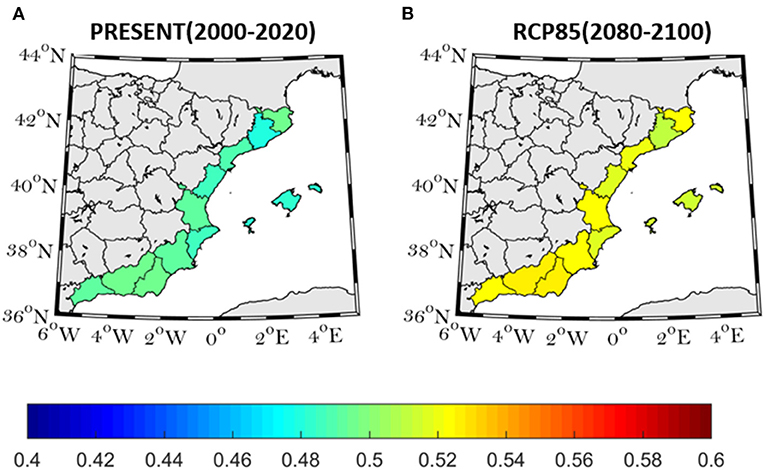
Figure 9. Final risk of the impact chain 2, corresponding to the “Risk of loss of attractiveness due to a reduction of beach availability”. For (A) present conditions (2000–2020) and (B) for the end of the century (2080–2100) under RCP85 scenario.
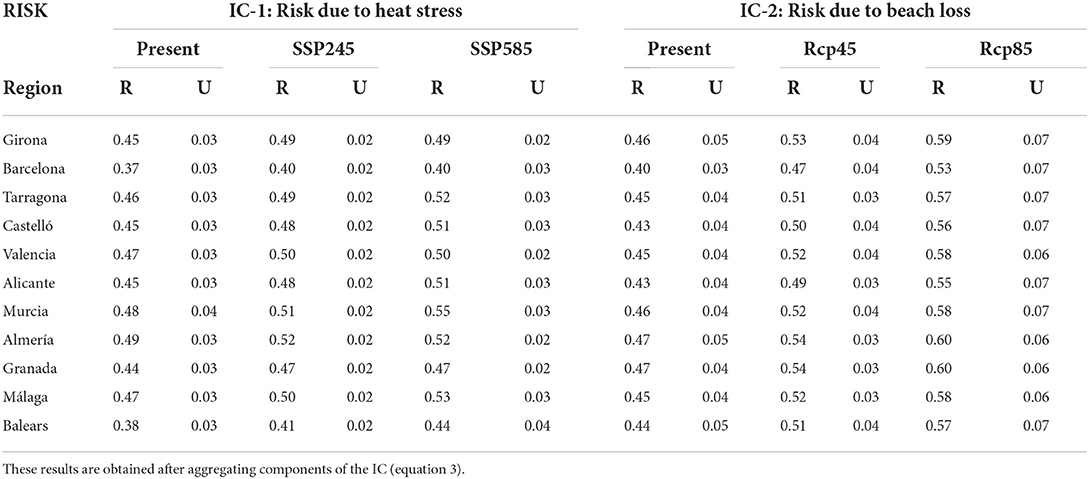
Table 4. Final risk (R) and uncertainties (U) for each province (in rows) and for the two study cases, IC-1 and IC-2 for the present climate and under GHG scenarios (columns).
For the risk associated to the loss of beach availability, we find that the risk increases from mid-low present values (0.40–0.47) to mid-high values at the end of the century under scenario RCP 4.5 (0.47–0.54) and under scenario RCP8.5 (0.53–0.60). Despite the large increase in the hazard, the final risk does not change that much because of the relatively low weight experts assigned to the hazard in front of the exposure and vulnerability.
For both ICs, the propagated uncertainties remain relatively low, suggesting the results are little affected by the lack of information in some of the indicators or to the uncertainties associated to the weight estimates.
Discussion
Risk assessment of the loss of attractiveness of touristic destinations due to climate change has provided some unexpected results. First, experts have only identified the increase of heat stress and loss of beach availability as relevant climate change associated impacts that would have an effect on sun and sea tourism. In particular, the projected reduction of water availability has not been considered as a threat. Climate projections suggest a reduction of 10–20% of water availability due to the reduction of precipitation and the increase of evapotranspiration (Cramer et al., 2020). Most experts have not considered this quantity as a significant change compared to the impact that water management and/or the total number of tourists have on the water availability.
Another unexpected result is that the risk estimates for the end of the century do not show big changes with respect to present conditions under any of the scenarios. This is although, at the end of the century and under scenario SSP585, all the regions would be under quasi-permanent heat wave conditions during the whole summer or that more than 60% of the area of sandy beaches will be lost. The reason for this result is that experts considered that the exposure and vulnerability of the region have more importance than the increasing hazard (about four times more in the case of the heat stress and twice in the case of beach loss). In other words, the underlying idea is that the tourist typology (e.g., age, origin, activities) and/or the socio-economic characteristics of the destination are more influential on the attractiveness than the environmental changes. In any case, there was a broad agreement considering that despite that, loss of beach surface was of more concern than the increase in heat stress.
Another aspect that is interesting to explore is the sensitivity of the risk to changes in the different indicators. In particular, it is worth analyzing what would be the potential reduction in the risk if changes in the sensitivity or the exposure occurred. This can be done with the UNTIC tool (Melo-Aguilar et al., 2022) to propagate the uncertainties to the sensitivity analysis. However, a first simplified approach could be to directly derive the sensitivities from the risk definition. Namely, the sensitivity to a given indicator ( or ) of a risk defined by (equation 2) would simply be:
with WE and WV the weights computed in Table 3. Therefore, in order to infer the potential reduction in risk induced by a change in the aggregated indicators, it would be enough to multiply that change by the corresponding weight. For the IC1, and provided that averaged aggregated exposure and vulnerability are 0.48 and 0.47, respectively, the risk associated to the increase in the heat stress could be reduced up to 0.25 and 0.16. In other words, a maximum reduction in the exposure or vulnerability (indicators going to 0) in the region would reduce the risk up to those values. Doing the same computation for the IC2, we found that the maximum risk reduction that could be reached through the reduction of the exposure or vulnerability would be 0.19 and 0.18, respectively.
This potential reduction in the risk is relatively big and opens the door to the design of adaptation strategies ahead the threats the tourism sector faces because of climate change. The downside of this is that getting a reduction in the exposure and vulnerability is far from being a simple issue. Both components are composed by a variety of indicators covering from the typology of tourists to the quality of the heath system. Thus, actions should be taken in multiple aspects. In order to illustrate this, we have computed the sensitivity of the final risk in the IC1 to each individual exposure indicator (Figure 10) for the Barcelona province. Reducing any of the indicators to 0 (i.e., maximum reduction of one of the aspects of the exposure), would not change the final risk more than 0.05. Also, some of the indicators have more room for improvement (e.g., B2, increase of the tourist's wealth) than others (e.g., B1, age of the tourists). In any case, the analysis helps to anticipate in which of the exposure or vulnerability aspects the benefits of action would be potentially larger.
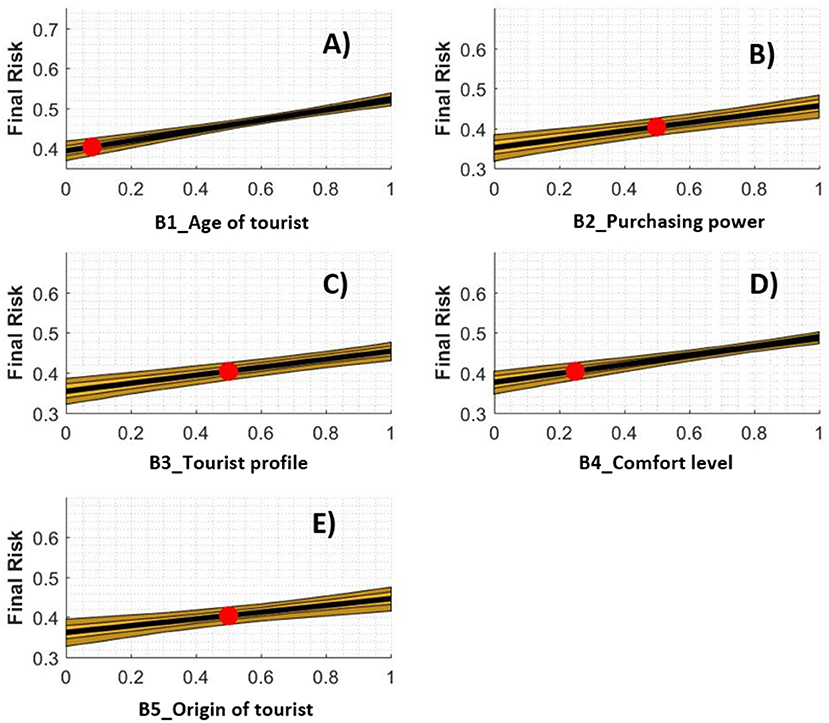
Figure 10. Sensitivity of the risk of loss of tourism attractiveness due to heat stress (IC1) in the Balearic Islands to changes in single exposure indicators (black lines), represented in each subplot by (A) Age of tourist, (B) Purchasing power, (C) Tourist profile, (D) Comfort level, and (E) Origin of tourist. The red dot indicates the present value for each indicator and the orange patch represents the range of uncertainty. Note that the vertical axis is different in each subplot. Values normalized from 0 to 1.
Regarding the methodology used for the risk assessment, the application of the UNTIC methodology (Melo-Aguilar et al., 2022) has proven to be very convenient in order to accommodate uncertainties in the impact chain framework. In particular, those aspects that were poorly known (i.e., indicators for which no information was found) could be also included in the computation. The absence of knowledge was then translated to an increase in the uncertainty associated to the final risk. In our case, the final uncertainty was low enough to question the conclusions, meaning that the lack of information did not jeopardize the study.
Another important aspect is the critical role that the weighting has on the final quantification of the risk. A small change in the weights of the aggregated indicators can dramatically change the conclusions of the assessment. In order to minimize this issue, we have opted to use the AHP to include in an optimal way the expert knowledge. However, even the AHP does not prevent the fact that some biases can exist in the expert's answers. For instance, they have given their opinion about tourist reaction in face of extreme heat. But in practice, this is a situation that has barely happened in the past, so they may be underestimating the role of heat stress in the tourist perception. This critical dependence of the risk assessment on subjective judgement is a common feature in all the approaches.
Melo-Aguilar et al. (2022), have suggested that a way to partially overcome this limitation would be to do a retroanalysis of the risk in the past, or in analog situations, in order to see if the results of the assessment matched the observed impacts of the hazard. In our case, for IC1, this could be done through the analysis of long time series of satisfaction surveys. Comparing the survey results in periods when the tourists have experienced heat waves with the results in normal periods, could give us an estimate of the sensitivity of risk to changes in the hazard. This in turn, would allow to validate the weights used and the risk assessment in general. For IC2, as the beach availability has not changed much locally in the last years, the satisfaction surveys between different regions could be used for the same purpose. Unfortunately, up to our knowledge, there are no such homogenized and long enough time series that would allow such analysis, therefore the results could not be validated until such data will be generated.
Conclusions
A risk assessment has been conducted on the potential loss of tourist attractiveness for sun and sea tourism in the western Mediterranean due to climate change. Through a participatory process following the Vulnerability sourcebook (Fritzsche et al., 2014) and the TANDEM framework for co-production of knowledge (Daniels et al., 2019, 2020), the main relevant hazards have been identified. These are the increase of heat stress and the loss of beach availability. Then, the corresponding impact chains have been developed to consider the exposure and vulnerability aspects that may shape the final risk. The weights of the different indicators have been determined based on expert judgement through the analytical hierarchy process (Lamata and Pelaez, 2002). Also, uncertainties in the indicators and the weights have also been considered thanks to the implementation of a new extension of the risk methodology developed in the framework of the UNCHAIN project (Melo-Aguilar et al., 2022).
The results showed that exposure and vulnerability in all the touristic destinations in the region are very similar, and the hazard will largely increase in the next decades, specially under the GHG scenario (SSP585/RCP8.5). However, the final risk does not seem to suffer a large increase because of the relatively small weight assigned to the hazard. In other words, the exposure (e.g., typology of the tourists and touristic activities) or the vulnerability (e.g., capacity to put in place adaptation strategies) would be more important than the projected change in the hazard (e.g., heat stress increase or beach reduction). Translated to the consequences climate change may have on the tourism sector, our results suggest that the sun and sea tourism would be resilient up to certain extent to the increase in temperature and the loss of comfort in the beaches. If the sector ensures the exposure and vulnerability remain low, the impacts of climate change would be reduced. However, it is worth noting that the sensitivity analysis performed shows that keeping low values for the exposure and vulnerability could only be done through combined actions in all the individual aspects of those components, which may be complex in practice as they would require the commitment and collaboration of different actors (i.e., government, industry, and academia).
The methodology applied has proven to be robust and allows to accommodate in a natural way the gaps of knowledge in the indicators or weights. Therefore, it could also be applied to any risk assessment in which uncertainties may play a relevant role. Additionally, it must be noted that the assessment lacks a formal validation, as it is common in similar assessments. In our case, the establishment of long-term series of tourist perception of tourist attractiveness (i.e., through homogenized satisfaction surveys) would help to calibrate and validate the results of the assessments. It is also worth highlighting that the main conclusion of this work is mainly driven by the relative low importance experts give to extreme heat or low beach comfort in front of other aspects that drives the attractiveness of the destination. However, this may be a biased result as this is a situation that has barely happened in the past, so they may be underestimating the role of those hazards in the tourist perception. The above proposed long-term series of tourist perception could help to reassess our results when periods of extreme heat or reduced beach will be considered in the surveys.
Data availability statement
The original contributions presented in the study are included in the article/Supplementary material, further inquiries can be directed to the corresponding author/s.
Author contributions
MA, GJ, and CM-A designed the study and the experiments, were responsible for data processing and analysis. GJ organized the structure of the manuscript and MA and GJ wrote the manuscript. All authors reviewed, contributed to the article, and approved the submitted version.
Funding
Support was provided by the Spanish Ministry of Science and Innovation through the grant PCI2019-103680 funded by MCIN/AEI/ 10.13039/501100011033 and by the European Union.
Acknowledgments
The authors would like to thank all the UNCHAIN partners for their support and constructive comments, and especially to Åsa Gerger Swartling and Karin André for their help in the design of the interviews and to C. Aall for constructive comments on the manuscript. The authors also appreciate the time and attention dedicated by the stakeholders for providing their expert opinions. Also, we thank to the INE for providing almost all the datasets used in this study and Copernicus Climate Data center for making available the CMIP6 simulations.
Conflict of interest
The authors declare that the research was conducted in the absence of any commercial or financial relationships that could be construed as a potential conflict of interest.
Publisher's note
All claims expressed in this article are solely those of the authors and do not necessarily represent those of their affiliated organizations, or those of the publisher, the editors and the reviewers. Any product that may be evaluated in this article, or claim that may be made by its manufacturer, is not guaranteed or endorsed by the publisher.
Supplementary material
The Supplementary Material for this article can be found online at: https://www.frontiersin.org/articles/10.3389/fclim.2022.1019892/full#supplementary-material
References
Agulles, M., Jordà, G., and Lionello, P. (2021). Flooding of sandy beaches in a changing climate. The Case of the Balearic Islands (NW Mediterranean). Front. Mar. Sci. 8, 1–15. doi: 10.3389/fmars.2021.760725
Board, C. N. A. M. A. (2007). National security and the threat of climate change. Available online at: https://www.cna.org/archive/CNA_Files/pdf/nationalsecurityandthethreatofclimatechange.pdf
Ciampa, F., Seifollahi-Aghmiuni, S., Kalantari, Z., and Ferreira, C. S. S. (2021). Flood mitigation in mediterranean coastal regions: problems, solutions, and stakeholder involvement. Sustain. 13, 1–22. doi: 10.3390/su131810474
Coccossis, H., and Koutsopoulou, A. (2020). Measuring and monitoring sustainability of coastal tourism destinations in the Mediterranean. Tour. An Int. Interdiscip. J. 68, 482–498. doi: 10.37741/t.68.4.8
Cramer, W., Guiot, J., Marini, K., Secretariat, M., and Bleu, P. (2020). Climate and environmental change in the mediterranean basin–current situation and risks for the future. First Mediterr. Assess. Report. MedECC (Mediterranean Expert. Clim. Environ. Chang. Union Mediterr. Plan Bleu, UNEP/MAP, Marseille, Fr.
Daniels, E., Bharwani, S., and Butterfield, R. (2019). The Tandem Framework: a Holistic Approach to Co-designing Climate Services. New York: JSTOR.
Daniels, E., Bharwani, S., Gerger Swartling, Å., Vulturius, G., and Brandon, K. (2020). Refocusing the climate services lens: introducing a framework for co-designing “transdisciplinary knowledge integration processes” to build climate resilience. Clim. Serv. 19, 1–15. doi: 10.1016/j.cliser.2020.100181
Enríquez, A. R., and Bujosa Bestard, A. (2020). Measuring the economic impact of climate-induced environmental changes on sun-and-beach tourism. Clim. Change 160, 203–217. doi: 10.1007/s10584-020-02682-w
Fritzsche, K., Schneiderbauer, S., Bubeck, P., Kienberger, S., Buth, M., Zebisch, M., et al. (2014). The Vulnerability Sourcebook: Concept and Guidelines for Standardised Vulnerability Assessments. p. 171.
Garcia, C., Deyà-Tortella, B., Lorenzo-Lacruz, J., Morán-Tejeda, E., Rodríguez-Lozano, P., Tirado, D., et al. (2022). Zero tourism due to COVID-19: an opportunity to assess water consumption associated to tourism. J. Sustain. Tour.. doi: 10.1080/09669582.2022.2079652. [Epub ahead of print].
Gössling, S., and Peeters, P. (2015). Assessing tourism's global environmental impact 1900–2050. J. Sustain. Tour. 23, 639–659. doi: 10.1080/09669582.2015.1008500
Gössling, S., and Scott, D. (2018). The decarbonisation impasse: global tourism leaders' views on climate change mitigation. J. Sustain. Tour. 26, 2071–2086. doi: 10.1080/09669582.2018.1529770
Hsu, T. W., Shih, D. S., Li, C. Y., Lan, Y. J., and Lin, Y. C. (2017). A study on coastal flooding and risk assessment under climate change in the mid-western coast of Taiwan. Water 9, 1–13. doi: 10.3390/w9060390
Lamata, M. T., and Pelaez, J. I. (2002). A method for improving the consistency of judgements. Int. J. Uncertainty, Fuzziness Knowlege-Based Syst. 10, 677–686. doi: 10.1142/S0218488502001727
Lanquar, R. (2015). “Tourism in the Mediterranean,” in Economic and social development of the southern and eastern mediterranean countries. Berlin: Springer, p. 111–126. doi: 10.1007/978-3-319-11122-3_8
Leis, J. L., and Kienberger, S. (2020). Climate risk and vulnerability assessment of floods in Austria: mapping homogenous regions, hotspots and typologies. Sustain 12, 6458. doi: 10.3390/su12166458
Lenzen, M., Sun, Y. Y., Faturay, F., Ting, Y. P., Geschke, A., Malik, A., et al. (2018). The carbon footprint of global tourism. Nat. Clim. Chang. 8, 522–528. doi: 10.1038/s41558-018-0141-x
León, C. J., Giannakis, E., Zittis, G., Serghides, D., Lam-González, Y. E., García, C., et al. (2021). Tourists' preferences for adaptation measures to build climate resilience at coastal destinations. Evidence Cyprus. Tour. Plan. Dev.. doi: 10.1080/21568316.2021.1958914. [Epub ahead of print].
Lindsey, R., and Dahlman, L. (2020). Climate Change: Global Temperature. Available online at: https://www.climate.gov/ (accessed March 22, 2021).
Loehr, J., and Becken, S. (2021). The tourism climate change knowledge system. Ann. Tour. Res. 86, 103073. doi: 10.1016/j.annals.2020.103073
Mach, K. J., Mastrandrea, M. D., Bilir, T. E., and Field, C. B. (2016). Understanding and responding to danger from climate change: the role of key risks in the IPCC AR5. Clim. Change 136, 427–444. doi: 10.1007/s10584-016-1645-x
Mackay, E. A., and Spencer, A. (2017). The future of Caribbean tourism: competition and climate change implications. Worldw. Hosp. Tour. Themes 9, 44–59. doi: 10.1108/WHATT-11-2016-0069
Mastrandrea, M. D., Field, C. B., Stocker, T. F., Edenhofer, O., Ebi, K. L., Frame, D. J., et al. (2010). Guidance note for lead authors of the IPCC fifth assessment report on consistent treatment of uncertainties.
Melo-Aguilar, C., Agulles, M., and Jordá, G. (2022). Introducing uncertainties in the impact chain risk assessment framework: the UNTIC tool. Preprints. 2022090436. doi: 10.20944/preprints202209.0436.v1
Miller, S., Chua, K., Coggins, J., and Mohtadi, H. (2021). Heat waves, climate change, and economic output. J. Eur. Econ. Assoc. 19, 2658–2694. doi: 10.1093/jeea/jvab009
Peric, V. (2005). “Tourism and globalization,” in Proceedings of the 6th International Conference of the Faculty of Management Koper, p. 24–26.
Rovira Soto, M. T., and Anton Clavé, S. (2017). Second homes and urban landscape patterns in Mediterranean coastal tourism destinations. Land Use Policy 68, 117–132. doi: 10.1016/j.landusepol.2017.07.018
Rutty, M., and Scott, D. (2010). Will the Mediterranean become “Too Hot” for tourism? A reassessment. Tour. Hosp. Plan. Dev. 7, 267–281. doi: 10.1080/1479053X.2010.502386
Saaty, T. L. (1990). How to make a decision: the analytic hierarchy process. Eur. J. Oper. Res. 48, 9–26. doi: 10.1016/0377-2217(90)90057-I
Satta, A., Puddu, M., Venturini, S., and Giupponi, C. (2017). Assessment of coastal risks to climate change related impacts at the regional scale: the case of the Mediterranean region. Int. J. Disaster Risk Reduct. 24, 284–296. doi: 10.1016/j.ijdrr.2017.06.018
Schwingshackl, C., Sillmann, J., Vicedo-Cabrera, A. M., Sandstad, M., and Aunan, K. (2021). Heat stress indicators in CMIP6: estimating future trends and exceedances of impact-relevant thresholds. Earth's Futur. 9, e2020EF001885. doi: 10.1029/2020EF001885
Scott, D., Gössling, S., Hall, C. M., and Peeters, P. (2016). Can tourism be part of the decarbonized global economy? The costs and risks of alternate carbon reduction policy pathways. J. Sustain. Tour. 24, 52–72. doi: 10.1080/09669582.2015.1107080
Scott, D., Hall, C. M., and Gössling, S. (2019). Global tourism vulnerability to climate change. Ann. Tour. Res. 77, 49–61. doi: 10.1016/j.annals.2019.05.007
Scott, D., Hall, C. M., and Stefan, G. (2012). Tourism and Climate Change: Impacts, Adaptation and Mitigation. London: Routledge. doi: 10.4324/9780203127490
Tascon-Gonzalez, L., Ferrer-Julià, M., Ruiz, M., and Garcia-Melendez, E. (2020). Social vulnerability assessment for flood. Water 12, 558. doi: 10.3390/w12020558
Toimil, A., Losada, I. J., Díaz-Simal, P., Izaguirre, C., and Camus, P. (2017). Multi-sectoral, high-resolution assessment of climate change consequences of coastal flooding. Clim. Change 145, 431–444. doi: 10.1007/s10584-017-2104-z
Vara, A., de la Gutiérrez, C., González-Alemán, J. J., and Gaertner, M. Á. (2020). Intercomparison study of the impact of climate change on renewable energy indicators on the mediterranean islands. Atmosphere. 11, 1036. doi: 10.3390/atmos11101036
Weichselgartner, J., and Kasperson, R. (2009). Barriers in the science-policy-practice interface: toward a knowledge-action-system in global environmental change research. Glob. Environ. Chang. 20, 266–277. doi: 10.1016/j.gloenvcha.2009.11.006
Zebisch, M., Schneiderbauer, S., Renner, K., Below, T., Brossmann, M., Ederer, W., et al. (2017). Risk supplement to the vulnerability sourcebook. Guidance on how to apply the vulnerability sourcebook's approach with the new IPCC AR5 concept of climate risk. Bonn. Available online at: http://www.adaptationcommunity.net/wp-content/uploads/2017/10/GIZ-2017_Risk-Supplement-to-the-Vulnerability-Sourcebook.pdf
Keywords: impact chain uncertainties, risk, tourism attractiveness, climate change impacts, AHP
Citation: Agulles M, Melo-Aguilar C and Jordà G (2022) Risk of loss of tourism attractiveness in the Western Mediterranean under climate change. Front. Clim. 4:1019892. doi: 10.3389/fclim.2022.1019892
Received: 15 August 2022; Accepted: 23 September 2022;
Published: 11 October 2022.
Edited by:
Åsa Gerger Swartling, Stockholm Environment Institute, SwedenReviewed by:
Daniel Zacarias, Eduardo Mondlane University, MozambiqueClaudio Fabian Szlafsztein, Federal University of Pará, Brazil
Copyright © 2022 Agulles, Melo-Aguilar and Jordà. This is an open-access article distributed under the terms of the Creative Commons Attribution License (CC BY). The use, distribution or reproduction in other forums is permitted, provided the original author(s) and the copyright owner(s) are credited and that the original publication in this journal is cited, in accordance with accepted academic practice. No use, distribution or reproduction is permitted which does not comply with these terms.
*Correspondence: Miguel Agulles, bWlndWVsLmFndWxsZXNAaWVvLmNzaWMuZXM=