 Riordan Correll-Brown1
 Emory H. Wellman2
 Devon O. Eulie3
 Steven B. Scyphers4
 Carter S. Smith5
 Mariko A. Polk6
 Rachel K. Gittman2*
- 1Department of Chemical and Biomolecular Engineering, University of Maryland, College Park, MD, United States
- 2Department of Biology, Coastal Studies Institute, East Carolina University, Greenville, NC, United States
- 3Department of Environmental Sciences, University of North Carolina Wilmington, Wilmington, NC, United States
- 4Marine Science Center, Northeastern University, Nahant, MA, United States
- 5Nicholas School of the Environment, Duke University Marine Lab, Beaufort, NC, United States
- 6Department of Biology and Marine Biology, University of North Carolina Wilmington, Wilmington, NC, United States
Rising sea levels, extreme weather events, and unsustainable coastal zone development pose serious threats to growing coastal communities. Human actions, such as shoreline development and hardening in at-risk areas, can damage nearshore ecosystems and exacerbate existing risks to coastal populations. A comprehensive understanding of shoreline changes in response to development, storm events, and sea-level rise is needed to effectively mitigate coastal hazards and promote adaptive and resilient coastlines. To determine whether human modification of shorelines can be accurately quantified and assessed over time, we evaluated past and present shoreline mapping and classification efforts in the United States. We coupled a review of available US shoreline data with a survey of coastal planners and managers involved with US state shoreline mapping programs. Using these data, we estimated the current extent of shoreline modification along the Atlantic, Pacific, and Gulf US coasts. However, we found that quantifying shoreline modifications over time nationally—or even within a single state—is currently infeasible due to changes in shoreline resolution associated with advances in shoreline mapping methodologies and a lack of regularly updated shoreline maps. State-level analysis from surveys revealed that 20 US coastal states have undertaken shoreline mapping projects, with sixteen tracking shoreline type and/or condition. However, of the 36 shoreline maps and databases identified, only half (18) were updated regularly or had planned updates. Lacking shoreline change data, coastal communities risk accepting increasingly degraded coastal zones and making poor management decisions based on shifted baselines. Thus, we recommend increasing the scale and funding for several ongoing innovative shoreline mapping efforts. These efforts are particularly focused on improving and standardizing shoreline mapping techniques, as well as establishing accurate baselines for shoreline conditions in the United States. Without accurate baselines and regular, consistent updates to shoreline data, managers cannot manage shorelines in a way that effectively mitigates coastal hazards while also promoting socio-ecological resilience in a changing climate.
Introduction
Global coastal zones are home to dense and increasing populations. Although the world's coast represents only 20% of the global land area, it hosts 41% of the world's population (Martínez et al., 2007). Twenty-one of the world's 33 megacities, each containing more than 8 million people, lie within 100 km of the coast (Martínez et al., 2007). In the United States (US), 14 of the 20 largest cities are situated on the coast, with the rate of land consumption in these areas often greatly outpacing the growth rate of the population (Pew Oceans Commission, 2003). From 2003 to 2015 alone, the US coastal population increased by 14.3 million people (Martínez et al., 2007), and there is no indication that this growth will slow in the coming decades (Neumann et al., 2015).
Rapid coastal population growth has significant social and environmental implications. The development, resource extraction, and pollution associated with growing populations will place increasing burdens on coastal ecosystems (Martínez et al., 2007; Titus et al., 2009). Population growth is occurring in areas which are highly vulnerable to coastal hazards, posing risks to residents. On the US East Coast, roughly 60% of land lying below the benchmark of one meter above sea level is projected to be developed and populated, according to current state and local government land-use plans (Titus et al., 2009). In these areas of low elevation, the threats of storm surge, sea-level rise (SLR), and flooding are most acute. Even conservative SLR estimates (0.9 meters by 2100) place 4.2 million US coastal residents at risk of inundation in just 80 years (Hauer et al., 2016). Present-day extreme flooding events will occur more commonly in the coming decades due to rising sea levels, with the odds of extreme coastal flooding in most parts of the US doubling every 5 years (Taherkhani et al., 2020). Alterations in storm climatology are also expected to increase the frequency and severity of these flood events (Trenberth, 2005; Elsner et al., 2008).
In what Burby (2006) dubs the “safe development paradox,” governments inadvertently facilitate the destruction of hazardous areas by making them appear safe for human development, placing more people and property at risk than would have been endangered without these initial ameliorating actions. For example, construction of the New Orleans levee system spurred unprecedented urbanization in newly protected high-risk, reclaimed wetlands between Lake Pontchartrain and the Mississippi River floodplains. By convincing residents that the region was safe and therefore enabling development, the perceived protection conferred by engineering efforts exacerbated the devastation of Hurricane Katrina (Burby, 2006; Freudenburg et al., 2009); a similar situation has unfolded on Galveston Island, Texas (Dolan and Wallace, 2012).
As the dangers to coastal zones and their inhabitants mount with climate change and continued development, a premium has been placed on coastal protection. Homeowners and developers commonly use shoreline hardening techniques to protect against floods and prevent erosion (Hartig et al., 2011; Dethier et al., 2017), aiming to create a static shoreline. Shoreline hardening is particularly common in coastal urban areas with high housing density (Gittman et al., 2015). Depending on the ecological and hydrodynamic setting, hardened structures may include seawalls, bulkheads, riprap revetments, or breakwaters (sensu Figure 1 in Gittman et al., 2015). Shorelines are hardened to provide benefits like flood prevention and erosion control; however, hard structures can have numerous negative impacts on coastal habitats. Shoreline hardening can scour shore zones and contribute to erosion, starve downstream shore zones of sediment, and fragment intertidal habitats (Vona et al., 2020). This fragmentation can lead to reductions in genetic diversity and population stability (Douglass and Pickel, 1999; Hartig et al., 2011). Hardened shorelines can also reduce biodiversity by decreasing the abundance of local flora and fauna (Morley et al., 2012; Gittman et al., 2016). Hard structures can alter the structure and function of local ecological communities by changing food webs from consumer- to producer-dominant (Martins et al., 2009) and facilitating the spread of invasive species (Thompson et al., 2002; Bulleri and Airoldi, 2005).
Although individual hardening projects may have small spatial footprints, their cumulative geomorphological and ecological effects can manifest at the regional scale, illustrating the broad reach of their negative impacts (Peterson and Lowe, 2009; Dethier et al., 2016; Kornis et al., 2017). Coastal managers require detailed shoreline data to effectively manage the coastal zone (Goncalves and Awange, 2017) and to monitor its constituent restored and natural coastal systems (Narayan et al., 2016; Arkema et al., 2017). Without baseline data describing the position, type, and condition of shorelines, it is impossible to estimate the true socio-ecological impacts of human development on coastal ecosystems and supported services (Halpern et al., 2008; Bugnot et al., 2020). Further, identification of possible adaptation pathways for mitigating hazard and climate-change related impacts on coastal communities and ecosystems requires analyses of the uncertainties and risks associated with current coastal conditions (Buurman and Babovic, 2016). Otherwise, incremental efforts taken to reduce risk outside of intentional adaptation pathways, such as construction of traditional shoreline hardening structures to protect coastal communities, may be maladaptive (Magnan et al., 2020). The ability to conduct such analyses is dependent on the availability of accurate and current data on the condition of coastal shorelines. The feasibility and desirability of potential risk reduction tools are not static, but rather fluctuate based on the climatic and socio-economic conditions of the system (Magnan and Duvat, 2020). When they lack dynamic data, coastal communities risk accepting of increasingly degraded coastal zones and increasingly hardened shorelines, a phenomenon known as “shifting baseline syndrome”(Pauly, 1995). Shifting baseline syndrome is the measure of the current state of a system against a reference point (baseline) that is perceived to be the norm, which may not be a historical or accurate reflection of the system's pristine baseline (Soga and Gaston, 2018). Although coastal development has been occurring for centuries along coastlines, having an accurate baseline for current shore conditions would be helpful for management decisions moving forward.
The goal of this study was to critically assess whether coastal managers and scientists are collecting and have access to shoreline hardening and modification data necessary to establish baseline shoreline conditions and to quantify changes in shoreline conditions over time in the United States. A comprehensive assessment of shoreline hardening could be used to evaluate complex socio-economic factors influencing coastal development decisions (Scyphers et al., 2014, 2015, 2019; Smith and Scyphers, 2019; Stafford and Guthrie, 2020; Gittman et al., 2021). The ecological effects of shoreline armoring are well-documented, as are the environmental benefits of nature-based alternatives such as living shorelines (Bilkovic and Mitchell, 2013; Mitchell and Bilkovic, 2019). Living shorelines' ability to reduce erosion has also been studied (Gittman et al., 2014; Bilkovic and Mitchell, 2017). However, the lack of side-by-side comparisons of the physical protective capabilities of natural or nature-based vs. hardened shoreline management strategies has been identified as a major hurdle in the wider promotion and adoption of nature-based shoreline management (Arkema et al., 2017; Morris et al., 2018). Comprehensive surveys of shoreline hardening can help facilitate these comparisons.
Here, we assess the current state of shoreline modification mapping across the US. We evaluate publicly available geospatial data to provide an updated estimate of the extent of hardened shoreline along the Atlantic, Pacific, and Gulf coasts of the United States, and to determine whether rates of shoreline modification, particularly shifts from natural to hardened shorelines, can be accurately quantified over time nationally or at the state-level (Figure 1A). Further, we present an overview of shoreline mapping efforts within 22 coastal states, drawing on information obtained from a review of state coastal management webpages, online databases, and responses from an email questionnaire sent to coastal managers within each state (Figure 1B). Finally, we make recommendations for developing standardized shoreline mapping approaches and highlight specific policies and practices currently being developed that could be used to assist coastal managers in adaptively managing and conserving shorelines.
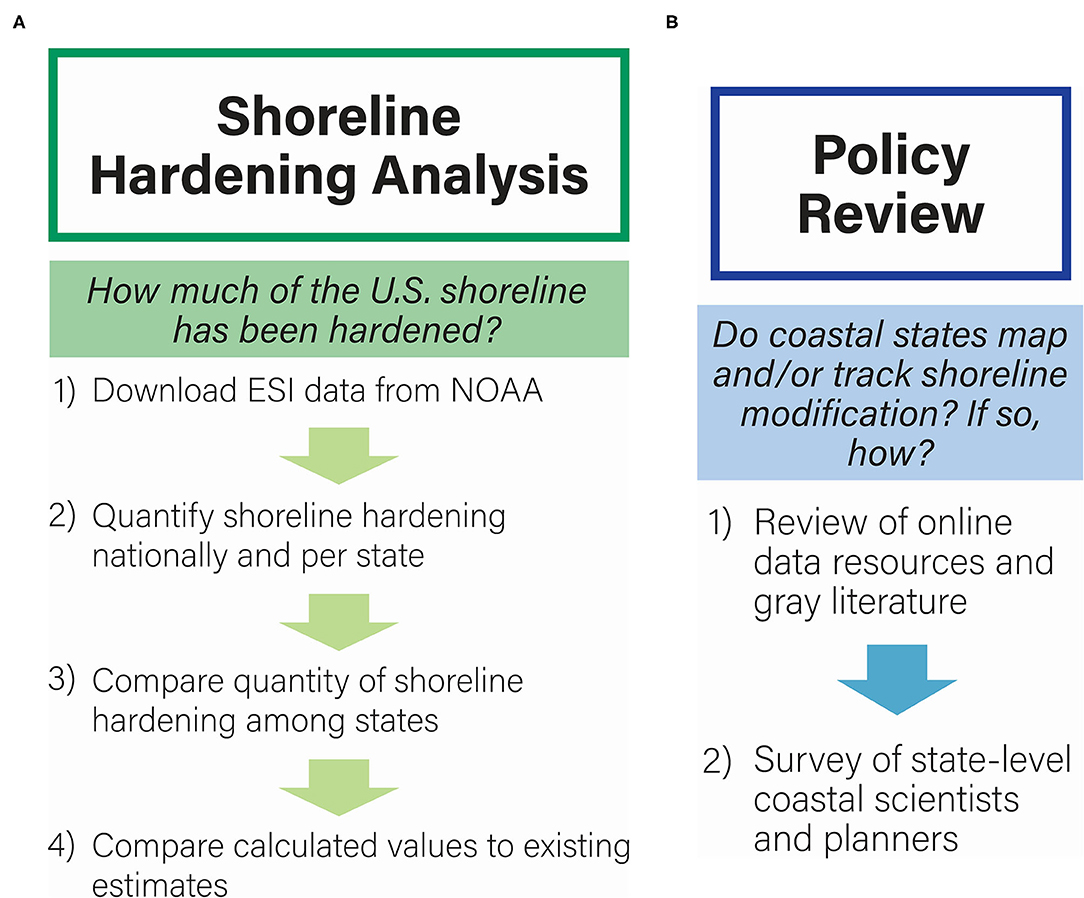
Figure 1. Conceptual diagram outlining the steps used to (A) estimate the total (length) and proportion of hardened shoreline to total shoreline for each coastal state based on NOAA ESI data; and (B) conduct the state-by-state shoreline mapping review.
Methods
Shoreline Hardening Analysis
Within the US, there is no complete, standardized dataset identifying each stretch of human-modified shoreline and the specific modification that has occurred (e.g., hardening, such as breakwaters, revetment, bulkhead, seawall; or restoration, such as marsh planting and oyster reef restoration). However, some attempts to amalgamate national and state-level shoreline modification monitoring efforts into singular datasets have been made, with varying resolutions, accuracies, degrees of completion, and methodologies. In our attempt to quantify shoreline modifications on a national level, we utilized one of the longest standing and most complete sources of shoreline modification data, the National Oceanic and Atmospheric Administration's (NOAA) Office of Response and Restoration (OR&R) Environmental Sensitivity Index (ESI), first collated in 1982 (NOAA, 2019).
ESI data are derived from a variety of sources at the local and national levels; including pre-existing datasets provided by state agencies and universities, aerial imagery, NOAA Continually Updated Shoreline Product (CUSP) data, NOAA national shoreline data, data from NOAA's coastal change analysis program (C-CAP) and data collected specifically for the ESI update effort (Petersen et al., 2019). During the update process, NOAA works with regional resource experts who advise on the use of data from specific regions (Petersen et al., 2019).
In order to provide accurate shoreline classifications, these baseline data are supplemented with specific information on shoreline type. These data are derived from ground and aerial surveys from early ESI classification efforts; low-altitude aerial imagery from Google Earth, Bing, and ShoreZone; and additional coastal habitat maps (Petersen et al., 2019). In some instances where earlier ground data are outdated or aerial imagery is unclear, new overflight data collections or ground observations are performed, but this costly and time-consuming process is limited to select areas (Petersen et al., 2019). The scale for ESI datasets must be 1:24,000 or larger, though published guidelines recommend using a scale no larger than 1:4,000 for shoreline classification (Petersen et al., 2019).
Although originally developed for emergency managers to model impacts from oil spills, previous work by Gittman et al. (2015) determined that ESI data contain the most comprehensive and current shoreline modification information available for US shorelines. As part of the ESI's shoreline sensitivity ranking systems, shorelines are ranked into 29 standardized classifications and subclasses based on their physical and biological characteristics (Supplementary Table S1). These characteristics include exposure to wave and tidal energy, shore slope, substrate type, biological productivity and sensitivity, and the presence of anthropogenic modifications. ESI data were first analyzed for the purpose of quantifying shoreline hardening in the US in 2015 (Gittman et al., 2015). Since that study, 19 of the 22 originally analyzed states have provided either partially or completely updated ESI data, with update dates ranging from 2014 to 2016 (Supplementary Tables S2, S4—Alabama, California, and Mississippi have not provided updates).
In this study, we examined both (1) whether shorelines are hardened and (2) how they are hardened (e.g., riprap, seawalls, combination). Following methodology by Gittman et al. (2015), we imported ESI data to ArcGIS 10.7 software and calculated linear kilometers of shoreline using the Calculate Geometry tool (ESRI, 2020). ESI shoreline rankings of 1B (exposed, solid man-made structures), 6B (riprap), 8B (sheltered, solid, man-made structures), and 8C (sheltered riprap) were binned as modified shoreline and sub-binned as riprap (6B, 8C), seawall (1B, 8B), or “combination” if the segments of shoreline contained multiple types of hardening techniques (e.g., a segment classified as 6B and 8B). Any segment of shoreline containing one or more of these ESI ranks was binned in one of these categories, even if it also contained natural shoreline types (e.g., a segment classified as 8B and 10A would be classified as 8B). Recent work has suggested that different types of hardening (e.g., seawall vs. riprap) and different combinations of hardening and natural shoreline (e.g., seawall with and without marsh vegetation) do not have equivalent ecological impacts (Bilkovic and Mitchell, 2013; Gittman et al., 2016; Kornis et al., 2017). The intent of this study was to quantify all combinations shoreline hardening to allow for direct comparison with previous work by Gittman et al. (2015). Comparisons of ecological impact of different combinations of hardening is beyond the scope of this study.
Review of State-Level Shoreline Modification Monitoring Efforts
To better understand how individual states map and track shoreline modification and condition, we conducted a gray literature review with keyword searches in common internet search engines (see Supplemental Materials), state agency websites, and publicly available digital data. After our initial keyword search, we contacted coastal scientists and planners involved with each state's respective shoreline mapping program (Supplementary Table S2). We asked the following questions about each state's shoreline modification monitoring and mapping efforts: (1) Does this state have a coastal mapping program? (2) Does the program track shoreline hardening, shoreline type, shoreline position change all, or none? (3) Are the data from this program publicly available? (4) When were these data last updated? (5) Are the data updated on a set schedule? If we did not receive an initial response, we followed up the initial email with two additional messages.
Results and Discussion
Shoreline Hardening in the United States
In total, of the 277,633 km of shoreline surveyed in the contiguous US, 28,357 km were modified with hard structures (i.e., seawall, riprap, or combination), representing ~10% of the contiguous U.S. shoreline (Figure 2, Supplementary Table S3). Overall, “solid man-made structures” (ESI types 1B and 8B) were the most prevalent type of shoreline modification, representing 17,211 km or 61% of hard structures; this category includes “[solid, non-riprap] revetments, seawalls, piers, and docks constructed of concrete or wood” (NOAA, 2019). Riprap (types 6B and 8C) and combinations of multiple shoreline types composed the remaining hardened structures (10,305 and 844 km, respectively). The majority (13,431 km) of solid, man-made structures were classified as ESI type 8B, meaning they are located on shorelines sheltered from wave energy and strong tidal currents rather than exposed shorelines (Supplementary Table S1).
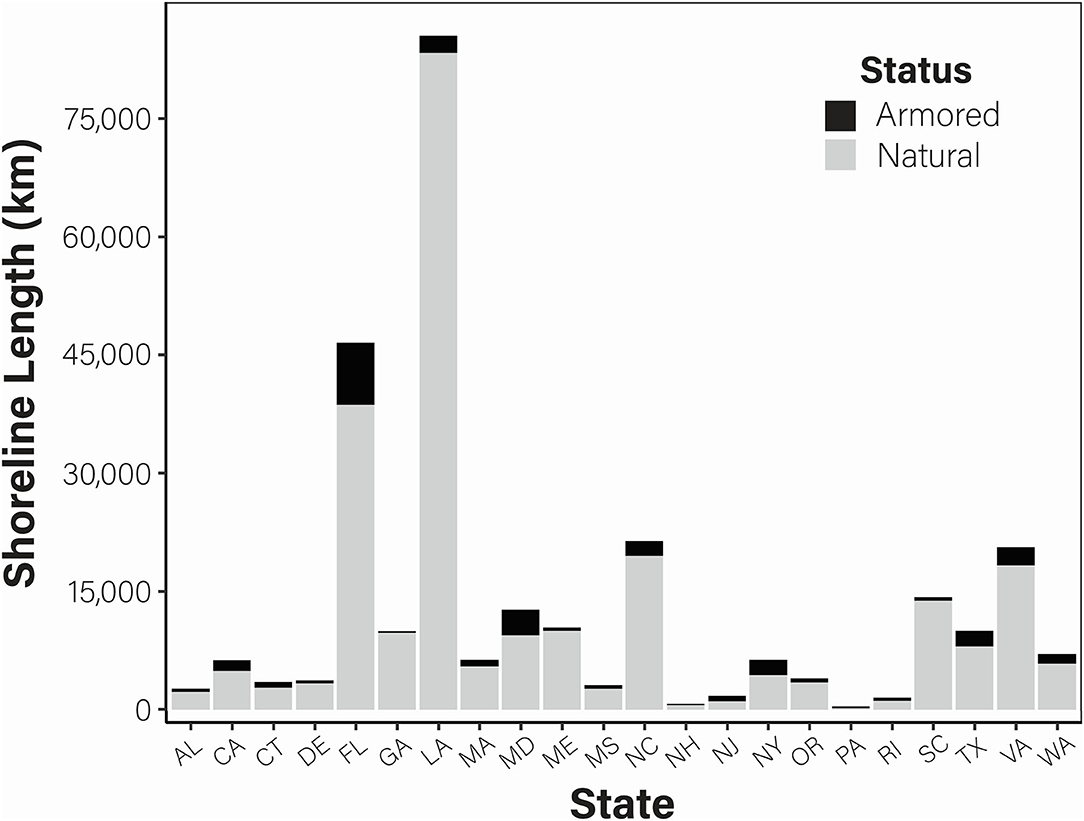
Figure 2. Total length of natural (gray) and armored (black) shoreline in each U.S. coastal state. Note that direct comparisons of shoreline estimates across states are limited because the most recent update year and methodologies for mapping the shoreline varies from state to state. These data represent the best available national estimate of shoreline hardening in the United States.
Despite these national trends, the most common type of hardening varied among states (Supplementary Table S1). The state with the greatest amount of hardened shoreline relative to its total shoreline was Pennsylvania, with 54%, followed by New Jersey (36%) and New York (30%) (Figure 3). North Carolina and New Hampshire had the least hardening relative to their total shorelines, with around 8% of their shorelines hardened (Figure 3, Supplementary Table S3). However, it should be noted that states with large amount of shoreline have more to harden and thus the total length of hardened shoreline is also important to consider (Figure 2, Supplementary Table S3). Further, the shorelines of the Great Lakes were not included in this analysis, thus estimates of shoreline length and hardening for states bordering the Great Lakes will not include those shorelines. The state with the greatest amount of hardened shoreline overall was Florida (7,848 km) while the state with the smallest amount was New Hampshire (53 km). Previous work suggests that shoreline hardening is often associated with densely populated coastlines (e.g., around New York City), to protect both commercial and residential development and infrastructure (Dugan et al., 2011; Gittman et al., 2015). Outside of metropolitan areas, shoreline hardening may be occurring in response to heightened vulnerability of coastal development and infrastructure to storm events, such as hurricanes on the Atlantic Coast.
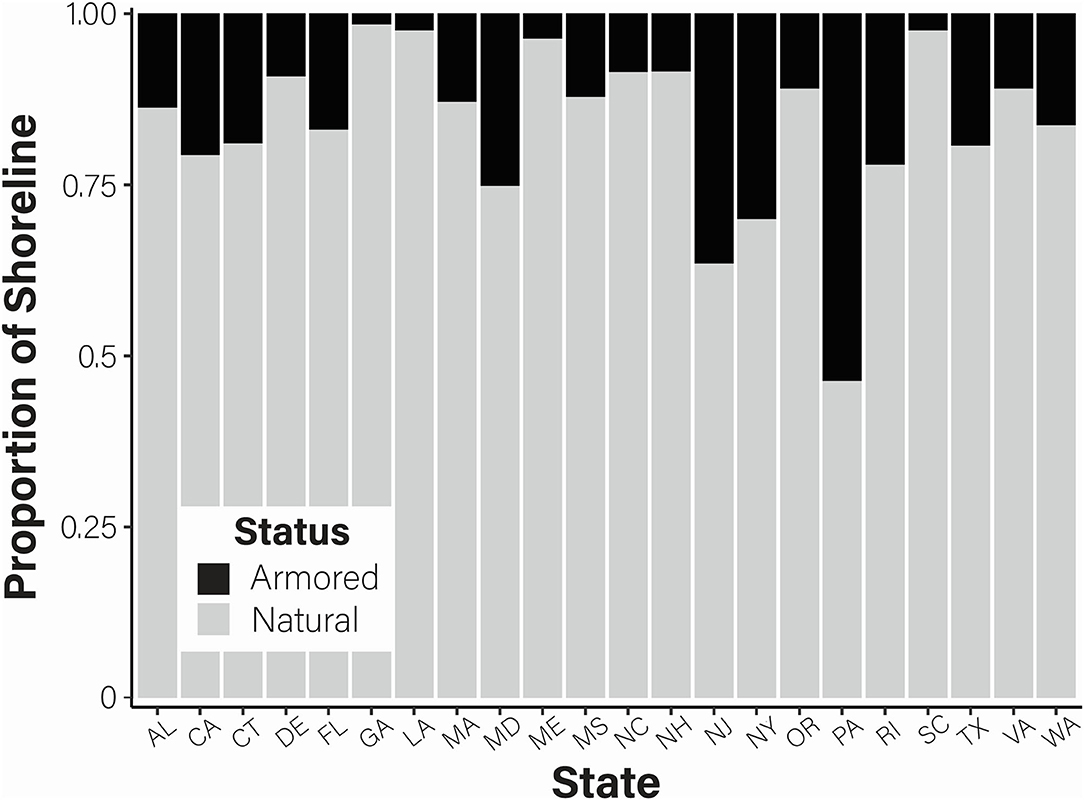
Figure 3. Proportion of natural (gray) and armored (black) shoreline in each U.S. coastal state. Note that direct comparisons of shoreline estimates across states are limited because the most recent update year and methodologies for mapping the shoreline varies from state to state. These data represent the best available national estimate of shoreline hardening in the United States.
Comparison to Previous Shoreline Hardening Estimates
Since the original study conducted by Gittman et al. (2015), the relative amount of hardened shoreline in the U.S. has declined by ~4%, from 14 to 10%. However, our study expanded the amount of shoreline analyzed by 117,465 km (173%) and found that the absolute length of armoring increased by 5,515 km (124%). Therefore, although hardening percentages decreased based on the updated data, the total amount of hardening increased. An expanded mapping range (e.g., mapping further upstream) and changes in map resolution likely contributed to this discrepancy. When small stretches of the same shoreline (1–5 km) were compared between this study and the 2015 study datasets for different years (e.g., 2011 vs. 2016 in North Carolina, Supplementary Table S2) they differed in resolution, with more detailed reticulation of the shoreline being represented in 2016 data. Further, when a shoreline is hardened, the shoreline length can change, via reduced reticulations of the shoreline, thus making shoreline comparisons over time challenging. While ESI data provide an overview of shoreline type and armoring throughout the US, our results show that they cannot be used to easily—or accurately—track alteration in the extent of hardening over time. Comparison of individual state datasets from different time periods that use different shoreline delineation and characterization methodology, in combination with differing resolution of data can result in the “coastline paradox.” The coastline paradox posits that the delineation of shoreline length is characterized by fractal dimension, whereby shoreline length increases as data resolution increases and vice versa (Mandelbrot, 1967). These differences in shoreline length and resolution prevented us from estimating changes in hardening over time or calculating annual rates of shoreline hardening. These data discrepancies and availability issues are not unique to our study. Rather, US states and federal agencies consistently fail to collect the types (or quantities) of data necessary to evaluate program outcomes and efficacy (Bernd-Cohen and Gordon, 1999).
State-Level Shoreline Mapping Review
Although shoreline mapping and data management methods varied across states, our review of state-level shoreline mapping efforts revealed that 20 coastal states have mapped either their entire shoreline or a portion of their shorelines at least once. More specifically, 16 states track shoreline type and/or modification in a variety of ways, with states creating modification databases, mapping nearshore habitats, tracking shoreline structure permits, or mapping hard shore structures (Table 1, Supplementary Table S4). Additionally, 15 states track changes to shoreline profiles over time. Of those, nine states map positional change over their entire coastline, while six states calculate positional change rates only for select shoreline segments, usually in areas of high erosion risk, like beaches.

Table 1. Summary of state-level shoreline mapping programs.
We initially attempted to distinguish between states that had ongoing coastal mapping initiatives and those that had mapped their shorelines in the past; however, we found it difficult to make this distinction. Some states have several, disparate and separately funded shoreline mapping efforts, of which some are active and others inactive, and other states have programs that are inactive due to funding availability. Despite the large number of mapping programs across the 22 states surveyed, only a few of the resulting shoreline maps and databases have plans for updates (Table 1, Supplementary Table S4). Out of the state shoreline mapping programs examined, nine are either continuously updated or updated on a regular interval, while another nine states have plans for updates which depend upon funding and the availability of parent datasets (Table 1, Supplementary Table S4). Many states supplement their mapping efforts with data from nationwide efforts to track shoreline type and positional change, including ESI data, the United States Geological Survey (USGS) National Assessment of Shoreline Change (NASC), the NOAA National Shoreline, and NOAA CUSP.
Like state-specific datasets, these national shoreline mapping efforts have their own unique methodologies, resolutions, and update frequencies. For example, NASC is an effort to calculate shoreline change rates and trends for open-ocean coasts, using shoreline data from NOAA historical survey topographic sheets, USGS Light Detection and Ranging (LIDAR), data from the Army Corps of Engineers, and digitized shorelines from various coastal management departments in specific states (Hapke et al., 2010). Although the data sources vary, the methods that NASC researchers employ to assess rates of shoreline change are internally consistent (Hapke et al., 2010). The Army Corps of Engineers (USACE) is utilizing this USGS shoreline change data in its ongoing National Shoreline Management Study (NSMS). The policy-focused national project involves a series of regional reports on the mechanisms behind coastal erosion, the economic and environmental effects of these shoreline changes, and existing federal, state, and local erosion management initiatives (Grandpre et al., 2018). Another national mapping initiative, NOAA National Shoreline, is a vector shoreline map based on converted NOAA National Ocean Service historical survey topographic sheets and aerial imagery. Mapping dates range from 1855 to the present, with differential update schedules based on geographic segment (National Geodetic Survey, 2021a). Lastly, NOAA CUSP is a continuous map of the US shoreline; generally delineated based on the Mean High-Water line. It covers a wider area than the NOAA National Shoreline and is updated more frequently (National Geodetic Survey, 2021b). CUSP draws on both NOAA and non-NOAA sources, including vectors and lidar from the National Geodetic Survey, USGS, NOAA Digital Coast, the National Wetlands Inventory, the US Department of Agriculture, and commercial satellites (National Geodetic Survey, 2021a). Due to the broad data sources used to create each of these respective datasets, standardization is limited across data sources. For example, the scale of individual sources of data can influence the overall accuracy and completeness of the collated information (e.g., NOAA CUSP source scales can range from 1:1,000 to 1:24,000, full or partial shoreline delineation by individual states); which can result in increased risk of error and broader interpretation of shoreline characteristics like location, habitat type, and presence and type of shoreline modification (Moore, 2000).
In our correspondence with state coastal managers, several challenges related to shoreline mapping recurred. These challenges included (1) a lack of funding for mapping and classification efforts; (2) lack of a consistent update schedule (intertwined with challenge 1); (3) non-intuitive data storage conventions or locations (e.g., data were often hard to find, even when they existed); and (4) incompatibility between various maps and datasets, given that mapping products are often produced by different organizations and not standardized. With the exception of Massachusetts' MORIS and Alabama's Center for the Advancement of Science in Space (CASIS), most states lacked a central coastal data repository. Thus, we cannot ensure that all relevant state datasets were identified and included. Additional coastal datasets, which were not identified by our standardized search terms, posted on state websites, or brought to our attention by coastal managers, may likely exist and limit the extent of this review of monitoring efforts. Similarly, while state shoreline profile maps could often be obtained upon request, they were not always readily available through online portals, which can be an impediment to data accessibility and may in turn influence shifting baseline syndrome. These data acquisition challenges highlight the need for a comprehensive central repository of shoreline monitoring data at the state and/or national levels.
Shifting Baselines in Shoreline Management
Coastal development and change occur over multiple temporal scales, from the short-term storm surge and damage caused by extreme storms to the long-term change due to ambient wave attack of a shoreline. Over time, increasing amounts of unsustainable coastal development and concomitant degradation of natural resources can result in shifting baseline syndrome (Sundblad and Bergström, 2014). The three primary causes of shifting baseline syndrome are: (1) lack of data; (2) loss of familiarity; and (3) loss of interaction (Soga and Gaston, 2018). This study has elucidated the lack of recognized standards for shoreline delineation and characterization at both the national and state levels. This study has also illuminated limitations to state-driven monitoring efforts due to challenges that include lack of funding, inconsistent update schedules, data storage issues, and compatibility issues related to varying data management standards. Coastal managers and scientists involved with shoreline monitoring programs further identified issues associated with inconsistent data, poor resolution, and data gaps, inhibiting transfer of data to coastal communities regarding hardening of their shorelines and, therefore, the loss of intertidal habitats that can support local economies. Without accurate data quantifying how the amount and location of shoreline modifications is changing over time, coastal managers cannot make informed decisions about the socio-ecological impacts of shoreline modification. Further, community perceptions of what constitutes a natural or socio-ecologically acceptable shoreline condition may shift over time, resulting in continued degradation of coastal ecosystems.
With a lack of data comes a loss of knowledge of an area's natural history. Select groups within a community (e.g., scientists, academics, naturalists, coastal managers) serve as warehouses of natural history knowledge (Soga and Gaston, 2018). However, the presence of these experts within a community does not necessarily translate to knowledge transference to the broader population (Fanini et al., 2019). Current and projected immigration of populations to coastal zones are resulting in more and newer coastal community members who may not have generational or local historic knowledge of an area's ecological baselines, resulting in a shifting of these baselines in the community consciousness. This loss of knowledge is further complicated by individual property management decisions and subsequent legacy effects. When individual homeowners choose to harden their shorelines, their neighbors are more likely to harden their shorelines as well, resulting in cascading impacts within an area (Scyphers et al., 2015; Gittman et al., 2021). Waterfront homeowners are also more likely to prefer to repair or keep their existing hard structure (e.g., revetment, bulkhead, seawall; Scyphers et al., 2015) rather than replace it with a more natural alternative; despite the negative ecological and geomorphological impacts of hard structures. Accurate data and improved understanding of shoreline hardening impacts, particularly threshold effects at regional scales, could better enable coastal managers and private landowners to weight the costs and benefits in shoreline stabilization decisions (Dayton et al., 2000; Soga and Gaston, 2018).
A Call for Improved Shoreline Mapping and Monitoring Programs
As coastal populations grow and development follows, hardening will continue to impact US shorelines. Recent analysis indicates that there is a serious lack of data describing the extent of coastal armoring (Bugnot et al., 2020). In fact, Gittman et al.'s (2015) assessment of US shoreline armoring is one of the few recent attempts to quantify the total amount of armoring. Today, 86% of national exclusive economic zones lack data on shoreline armoring (Bugnot et al., 2020). Efforts must therefore be made to improve the quality and degree of shoreline mapping. Without detailed, consistent data, managers and scientists will be unable to reliably track increased construction of armored structures. At best, the body of knowledge assessing links between human activity and shoreline hardening has been described as “patchy and insufficient” (Paterson et al., 2014). Indeed, the information pertaining to shoreline armoring and more specifically, seawalls and groins, represent a gap in the coastal management knowledge base (Paterson et al., 2014). Marine spatial planning (MSP) hinges on the ability to determine which coastal systems are—and more importantly, are not—compatible with human use. Continuous classification data are therefore critical to spatio-temporal assessment of coastal ecosystems as part of MSP (Crowder and Norse, 2008; Frazão Santos et al., 2013). Ehler and Douvere (2009) set a high bar for coastal management bodies, arguing that data used in MSP efforts must be “up-to-date, objective, reliable, relevant, and comparable.” Without the necessary data to illustrate or measure hardening, coastal managers and residents may not recognize the shifted baselines that normalize increasingly developed and armored coastlines over time (Sundblad and Bergström, 2014). Fortunately, several innovative coastal programs across the country can provide models for mapping at the local, state, and federal levels that could mitigate these concerns.
At the national scale, in their quest to “map once, use many times,” NOAA and the Inter-agency Working Group on Ocean and Coastal Mapping advocates for data sharing and the use of standards in data collection, processing, and storage to reduce redundancy and promote widest possible use of marine mapping data (NOAA, 2021). A key component of such efforts is NOAA's spatial prioritization process. When planning marine mapping and research efforts, NOAA may choose to identify regional mapping priorities by dividing the project area into subregions and designating an advisory team composed of regional stakeholders (Costa et al., 2019). These stakeholders can review existing data and communicate to NOAA any gaps and/or areas of priority. Using an online application, participants use virtual “coins” to identify and comment on their priority areas, including requests for the data needed (Costa et al., 2019). NOAA can therefore maximize its ability to collect and provide useful, relevant marine, and coastal data. Such efforts to promote integrated ocean and coastal mapping foster effective collaboration and communication between state and federal governments, while reducing the likelihood of collecting unnecessary or redundant data (pers. comm. A. Lanier).
Once collected, the utility of coastal and marine data can be maximized through application of data standards like the Coastal and Marine Ecological Classification Standard (CMECS). CMECS is a nested, hierarchical classification system which includes assessment of anthropogenic substrates and structures in its “geoform” category. CMECS is the national standard for describing ecological data, having been endorsed by the Federal Geographic Data Committee (2012). As of 2020, federal agencies and research funded by them are required to use classification standards like CMECS (US Ocean Policy Committee, 2020). Although the US National Estuarine Research Reserve System (NERRS) maintains its own classification system, CMECS and this NERRS standard can now be crosswalked (pers. comm. K. Rose). CMECS has been successfully used to describe data collected by both individual researchers and larger state- or national-level efforts (Wright, 2020). As compared to ESI data, CMECS provides a more rigorous and appropriate methodology of shoreline classification, especially given the goal of tracking and mapping shoreline armoring.
Finally, updates to shoreline modification maps could be completed by linking shoreline modification permitting to mapping efforts at the national level. Section 404 of the Clean Water Act authorizes the US Army Corps of Engineers to issue general permits for actions which the Corps has determined will have “minimal adverse environmental effects,” both individually and cumulatively (Brandon, 2016). Despite its central role in permitting and regulating shoreline hardening the Corps collects little, if any, data regarding the shore modifications permitted. Given that the cumulative negative impacts of shoreline hardening manifest on a larger scale than that on which the projects are built (Peterson and Lowe, 2009; Dethier et al., 2016; Kornis et al., 2017), such data are vital to quantify and remediate the negative impacts of armoring. All individual permit applications and nationwide permit verification requests are processed through an automated internal system, where requested amounts of impacts and proposed compensatory mitigation are also recorded (Federal Register, 2016). Amending current permitting regulations to require pre-construction notifications (PCNs) for all bank stabilization and shoreline hardening projects would provide the Corps with valuable data regarding the type, location, and size of armored structures that have been granted permits (Brandon, 2016). Such data would be instrumental in the Corps' assessment of the cumulative impacts of hardening, fulfilling the requirements of the National Environmental Policy Act (NEPA). Greater knowledge of armoring extent might also allow for strategic future permitting decisions, perhaps assisting in the promotion of nature-based stabilization techniques (Brandon, 2016).
Given the challenges of standardizing and funding shoreline mapping at the national or even international level, several coastal states have also developed innovative strategies to leverage existing coastal data or resources to improve shoreline modification mapping efforts. For example, as permits for new structures are approved and construction is completed, Oregon's Parks and Recreation Department updates the state's “shoreline armoring line” dataset, thus facilitating regularly updated geospatial tracking of shoreline armoring in the state (pers. comm. M. Reed). Between 2009 and 2012, the Geological Survey of Alabama (GSA) mapped 829 miles of Alabama's coast, classifying shorelines in real time during vessel-based surveys (Jones et al., 2009; Jones and Tidwell, 2011, 2012). The resolution of the AL shoreline data produced exceeds that of ESI data and is used for shoreline vulnerability assessments (pers. comm. S. Jones).
Within coastal states, local and county governments are also taking action to map and characterize their shorelines with the goal of identifying viable climate-adaptation pathways. For example, extensive high-resolution shoreline mapping and characterization revealed that reconstructing dunes and cobble beaches are viable options for sea-level rise hazard protection along the Stinson Beach shoreline in lieu of hardening in Marin County, CA (Marin County Community Development Agency, 2018). Although local or grassroots shoreline mapping efforts will likely result in discrepancies in methodology and resolution that will make state or national level comparisons of shoreline condition challenging, consensus building in support of funding and development of a shoreline mapping plan may be more easily achieved at the local level. Barnett et al. (2014) suggest that if individuals within a community can identify common goals for the future of their community, local governments have improved chances of garnering support for risk reduction and adaptation to protect the future of that community. Thus, local coastal adaptation planning efforts should be considered and incorporated, when possible, into future shoreline mapping approaches and funding plans.
Creating consistent, reliable shoreline maps on a large scale is a challenge, so drawing inspiration from successful efforts is an important way to tackle the issue. Identifying mapping priorities can help ensure that limited resources are being used to map the most relevant areas, while employing standardized classification systems can make data easier to compare across time and location, mitigating the risk of shifting baseline syndrome. Linking permitting and mapping systems and utilizing local mapping and adaption efforts can also make it easier to map shorelines and track change efficiently and comprehensively over large geographic areas.
Conclusion
Unfortunately, even the most comprehensive shoreline mapping plans can be hindered by the absence of a consistent update schedule, complicating efforts to understand shoreline change at the local, regional, and national levels. Shoreline mapping and assessment efforts could be improved through several avenues. First, the extent and resolution of data should be standardized to facilitate easy comparisons between different areas and timepoints. In an effort to guide and assist state-level or local coastal managers, we recommend creation of a set of detailed guidelines to instruct managers in methods to implement suggested improvements to their mapping programs (structural and budgetary). Second, when possible, both federal agencies and states should commit to regular update intervals and secure funding for these mapping efforts using classification standards (for example, CMECS, as described above) to enhance utility of mapping data for multiple uses and promote consistency among mapping bodies. Finally, state-level and national-level permitting of shoreline modification should be directly linked to shoreline mapping updates. Although many of these strategies have been piloted at the local or state-level, these strategies must be scaled up and adequately funded to ensure effective management and conservation of shorelines.
Author Contributions
RC-B and RG conceived and outlined the framework for this research. RC-B extracted and summarized the NOAA ESI data, conducted the shoreline mapping search, and contacted the coastal managers with the assistance of RG. RC-B, EW, and RG wrote the initial draft of the manuscript. All authors contributed to writing, editing, and revising subsequent drafts of the paper. EW created the figures. RC-B, EW, and RG created the tables.
Funding
Funding for this work was provided by a National Science Foundation Graduate Research Fellowship to EW (award # 213673-720101) and grants to RG from the National Oceanographic and Atmospheric Administration via the Southeastern Aquatic Resources Partnership (award # A19-0052-001), U.S. Fish and Wildlife Service via the Atlantic Coast Fish Habitat Partnership (award # F19AP00230), and the North Carolina Policy Collaboratory (award # 20170 12593 221010 KOAST).
Conflict of Interest
The authors declare that the research was conducted in the absence of any commercial or financial relationships that could be construed as a potential conflict of interest.
Publisher's Note
All claims expressed in this article are solely those of the authors and do not necessarily represent those of their affiliated organizations, or those of the publisher, the editors and the reviewers. Any product that may be evaluated in this article, or claim that may be made by its manufacturer, is not guaranteed or endorsed by the publisher.
Acknowledgments
We thank the editor and reviewers for their thoughtful comments that greatly improved the manuscript. We also thank J. B. Ruhl for the invitation to submit to this special issue, Coordinating Climate Change Adaptation as Risk Management, in Frontiers in Climate.
Supplementary Material
The Supplementary Material for this article can be found online at: https://www.frontiersin.org/articles/10.3389/fclim.2022.719109/full#supplementary-material
References
Arkema, K. K., Griffin, R., Maldonado, S., Silver, J., Suckale, J., and Guerry, A. D. (2017). Linking social, ecological, and physical science to advance natural and nature-based protection for coastal communities: advancing protection for coastal communities. Ann. N. Y. Acad. Sci. 1399:1. doi: 10.1111/nyas.13322
Barnett, J., Graham, S., Mortreux, C., Fincher, R., Waters, E., and Hurlimann, A. (2014). A local coastal adaptation pathway. Nat. Clim. Chang. 4, 1103–1108. doi: 10.1038/nclimate2383
Bernd-Cohen, T., and Gordon, M. (1999). State coastal program effectiveness in protecting natural beaches, dunes, bluffs, and rocky shores. Coast. Manage. 27, 187–217. doi: 10.1080/089207599263839
Bilkovic, D. M., and Mitchell, M. M. (2013). Ecological tradeoffs of stabilized salt marshes as a shoreline protection strategy: effects of artificial structures on macrobenthic assemblages. Ecol. Eng. 61, 469–481. doi: 10.1016/j.ecoleng.2013.10.011
Bilkovic, D. M., and Mitchell, M. M. (2017). “Designing living shoreline salt marsh ecosystems to promote coastal resilience,” in Chapter in Living Shorelines: The Science and Management of Nature-Based Coastal Protection, eds D. M. Bilkovic, M. Mitchell, M. La Peyre, and J. Toft (Taylor & Francis Group: CRC Press), 293–316.
Brandon, T. O.. (2016). Nationwide permit 13, shoreline armoring, and the important role of the US Army Corps of Engineers in coastal climate change adaptation. Environ. Law 46, 537–576. Available online at: https://ssrn.com/abstract=3030797
Bugnot, A. B., Mayer-Pinto, M., Airoldi, L., Heery, E. C., Johnston, E. L., Critchley, L. P., et al. (2020). Current and projected global extent of marine built structures. Nat. Sustain. 4, 33–41. doi: 10.1038/s41893-020-00595-1
Bulleri, F., and Airoldi, L. (2005). Artificial marine structures facilitate the spread of a non-indigenous green alga, Codium fragile ssp. tomentosoides, in the north Adriatic Sea. J. Appl. Ecol. 42:6. doi: 10.1111/j.1365-2664.2005.01096.x
Burby, R. J.. (2006). Hurricane katrina and the paradoxes of government disaster policy: bringing about wise governmental decisions for hazardous areas. Ann. Am. Acad. Pol. Soc. Sci. 604, 171–191. doi: 10.1177/0002716205284676
Buurman, J., and Babovic, V. (2016). Adaptation pathways and real options analysis: An approach to deep uncertainty in climate change adaptation policies. Policy Soc. 35, 137–150. doi: 10.1016/j.polsoc.2016.05.002
Costa, B., Buja, K., Kendall, M., Williams, B., and Kraus, J. (2019). Prioritizing area for future seafloor mapping, research, and exploration offshore of California, Oregon, and Washington. NOAA Technical Memorandum NOS NCCOS 264 (Silver Spring, MD).
Crowder, L., and Norse, E. (2008). Essential ecological insights for marine ecosystem-based management and marine spatial planning. Mar. Pol. 32, 772–778. doi: 10.1016/j.marpol.2008.03.012
Dayton, P. K., Sala, E., Tegner, M. J., and Thrush, S. (2000). Marine reserves: parks, baselines, and fishery enhancement. Bull. Mar. Sci. 66, 617–634.
Dethier, M. N., Raymond, W. W., McBride, A. N., Toft, J. D., Cordell, J. R., Ogston, A. S., et al. (2016). Multiscale impacts of armoring on Salish Sea shorelines: evidence for cumulative and threshold effects. Estuar. Coast. Shelf. Sci. 175, 106–117. doi: 10.1016/j.ecss.2016.03.033
Dethier, M. N., Toft, J. D., and Shipman, H. (2017). Shoreline armoring in an Inland sea: science-based recommendations for policy implementation: implementation of shoreline armoring policy. Conserv. Lett. 10:5. doi: 10.1111/conl.12323
Dolan, G., and Wallace, D. J. (2012). Policy and management hazards along the Upper Texas coast. Ocean Coast. Manag. 59, 77–82. doi: 10.1016/j.ocecoaman.2011.12.021
Douglass, S. L., and Pickel, B. H. (1999). The tide doesn't go out anymore - the effect of bulkheads on Urban Bay shorelines. Shore Beach 67, 19–25.
Dugan, J. E., Airoldi, L., Chapman, M. G., Walker, S. J., and Schlacher, T. (2011). “Estuarine and coastal structures: environmental effects, a focus on shore and nearshore structures,” in Treatise on Estuarine and Coastal Science, eds E. Wolanski and D. McLusky (New York, NY: Academic Press), 17–41.
Ehler, C., and Douvere, F. (2009). Marine Spatial Planning: A Step-by-Step Approach Toward Ecosystem-Based Management. Intergovernmental Oceanographic Commission and Man and the Biosphere Programme. IOC Manual and Guides No. 53, ICAM Dossier No. 6. Paris: UNESCO.
Elsner, J. B., Kossin, J. P., and Jagger, T. H. (2008). The increasing intensity of the strongest tropical cyclones. Nature 455, 92–95. doi: 10.1038/nature07234
ESRI (2020). ArcGIS (Version 10.7). ESRI Inc. Available online at: https://www.esri.com/en-us/arcgis/products/arcgis-pro/overview
Fanini, L., Plaiti, W., and Papageorgiou, N. (2019). Environmental education: constraints and potential as seen by sandy beach researchers. Estuar. Coast. Shelf Sci. 218, 173–178. doi: 10.1016/j.ecss.2018.12.014
Federal Geographic Data Committee (2012). Coastal and Marine Ecological Classification Standard. FGDC-STD-018-2012. Available online at: https://www.fgdc.gov/standards/projects/cmecs-folder/cmecs-index-page
Federal Register (2016). Proposal to Reissue and Modify Nationwide Permits. Washington, DC: Department of the Army, Corps of Engineers. 33 CFR Chapter II, RIN 0710-AA73.
Frazão Santos, C., Michel, J., Neves, M., Janeiro, J., Andrade, F., and Orbach, M. (2013). Marine spatial planning and oil spill risk analysis: finding common grounds. Mar. Pollut. Bull. 74, 73–81. doi: 10.1016/j.marpolbul.2013.07.029
Freudenburg, W. R., Grambling, R., Laska, S., and Erikson, K. T. (2009). Catastrophe in the Making: The Engineering of Katrina and Disasters of Tomorrow. Washington, DC: Island Press.
Gittman, R. K., Fodrie, F. J., Popowich, A. M., Keller, D. A., Bruno, J. F., Currin, C. A., et al. (2015). Engineering away our natural defenses: an analysis of shoreline hardening in the US. Front. Ecol. Environ. 13:6. doi: 10.1890/150065
Gittman, R. K., Popowich, A. M., Bruno, J. F., and Peterson, C. H. (2014). Marshes with and without sills protect estuarine shorelines from erosion better than bulkheads during a Category 1 hurricane. Ocean Coast. Manag. 102, 94–102. doi: 10.1016/j.ocecoaman.2014.09.016
Gittman, R. K., Scyphers, S. B., Baillie, C. J., Brodmerkel, A., Grabowski, J. H., Livernois, M., et al. (2021). Reversing a tyranny of cascading shoreline-protection decisions driving coastal habitat loss. Conserv. Sci. Prac. 3:e490. doi: 10.1111/csp2.490
Gittman, R. K., Scyphers, S. B., Smith, C. S., Neylan, I. P., and Grabowski, J. H. (2016). Ecological consequences of shoreline hardening: a meta-analysis. Bioscience 66, 763–773. doi: 10.1093/biosci/biw091
Goncalves, R. M., and Awange, J. L. (2017). Three most widely used GNSS-based shoreline monitoring methods to support integrated coastal zone management policies. J. Surv. Eng. 143:3. doi: 10.1061/(ASCE)SU.1943-5428.0000219
Grandpre, R., Vogt, C., Frey, G., McPherson, M., and O'Donnell, A. (2018). California Regional Assessment: National Shoreline Management Study. Report No. 2018-R-07. U.S. Army Corps of Engineers, Institute for Water Resources, Alexandria, VA. Available online at: https://usace.contentdm.oclc.org/utils/getfile/collection/p16021coll2/id/2962
Halpern, B. S., Wibridge, S., Selkoe, K. A., Kappel, C. V., Micheli, F., D'Agrosa, C., et al. (2008). A global map of human impact on marine ecosystems. Science 319:5865. doi: 10.1126/science.1149345
Hapke, C. J., Himmelstoss, E. A., Kratzmann, M., List, J. H., and Thieler, E. R. (2010). National Assessment of Shoreline Change—Historical Shoreline Change Along the New England and Mid-Atlantic coasts. Reston, VA: US Geological Survey Open-File Report 2010–1118.
Hartig, J. H., Zarull, M. A., and Cook, A. (2011). Soft shoreline engineering survey of ecological effectiveness. Ecol. Eng. 37, 1231–1238. doi: 10.1016/j.ecoleng.2011.02.006
Hauer, M. E., Evans, J. M., and Mishra, D. R. (2016). Millions projected to be at risk from sea-level rise in the continental United States. Nat. Clim. Change 6, 691–695. doi: 10.1038/nclimate2961
Jones, S. C., Tidwell, D. K., and Darby, S. B. (2009). Comprehensive Shoreline Mapping, Baldwin and Mobile Counties, Alabama: Phase I. Tuscaloosa, AL: Open File Report 0921.
Jones, S. C., and Tidwell, D. K. (2011). Comprehensive Shoreline Mapping, Baldwin and Mobile Counties, Alabama: Phase II. Tuscaloosa, AL: Open File Report 1106.
Jones, S. C., and Tidwell, D. K. (2012). Comprehensive Shoreline Mapping, Baldwin and Mobile Counties, Alabama: Phase III. Tuscaloosa, AL: Open File Report 1204.
Kornis, M. S., Breitburg, D., Balouskus, R., Bilkovic, D. M., Davias, L. A., Giordano, S., et al. (2017). Linking the abundance of estuarine fish and crustaceans in nearshore waters to shoreline hardening and land cover. Estuaries Coasts 40, 1464–1486. doi: 10.1007/s12237-017-0213-6
Magnan, A. K., and Duvat, V. E. (2020). Towards adaptation pathways for atoll islands. Insights from the Maldives. Reg. Environ. Change. 20:119. doi: 10.1007/s10113-020-01691-w
Magnan, A. K., Schipper, E. L. F., and Duvat, V. K. E. (2020). Frontiers in climate change adaptation science: advancing guidelines to design adaptation pathways. Curr. Clim. Change Rep. 6, 166–177. doi: 10.1007/s40641-020-00166-8
Mandelbrot, B.. (1967). How long is the coast of Britain? Statistical self-similarity and fractional dimension. Science 156, 636–638. doi: 10.1126/science.156.3775.636
Marin County Community Development Agency (2018). Marin Ocean Coast Sea Level Rise Adaptation Report. Available online at: https://www.marincounty.org/-/media/files/departments/cd/planning/slr/c-smart/2019/181211_csmart_adaptation_report_final_small.pdf?la=en
Martínez, M. L., Intralawan, A., Vázquez, G., Pérez-Maqueo, O., Sutton, P., and Landgrave, R. (2007). The coasts of our world: ecological, economic and social importance. Ecol. Econ. 63, 254–272. doi: 10.1016/j.ecolecon.2006.10.022
Martins, G. M., Amaral, A. F., Wallenstein, F. M., and Neto, A. I. (2009). Influence of a breakwater on nearby rocky intertidal community structure. Mar. Environ. Res. 67, 237–245. doi: 10.1016/j.marenvres.2009.03.002
Mitchell, M., and Bilkovic, D. M. (2019). Embracing dynamic design for climate-resilient living shorelines. J. Appl. Ecol. 56, 1099–1105. doi: 10.1111/1365-2664.13371
Morley, S. A., Toft, J. D., and Hanson, K. M. (2012). Ecological effects of shoreline armoring on intertidal habitats of a puget sound urban estuary. Estuar. Coast. 35, 774–784. doi: 10.1007/s12237-012-9481-3
Morris, R. L., Konlechner, T. M., Ghisalberti, M., and Swearer, S. E. (2018). From grey to green: efficacy of eco-engineering solutions for nature-based coastal defence. Glob. Chang. Biol. 24, 1827–1842. doi: 10.1111/gcb.14063
Narayan, S., Beck, M. W., Reguero, B. G., Losada, I. J., van Wesenbeeck, B., Pontee, N., et al. (2016). The effectiveness, costs and coastal protection benefits of natural and nature-based defences. PLoS ONE 11:e0154735. doi: 10.1371/journal.pone.0154735
National Geodetic Survey (2021a). NOAA NGS Continually Updated Shoreline Product (CUSP). Available online at: https://shoreline.noaa.gov/data/datasheets/cusp.html
National Geodetic Survey (2021b). NOAA National Shoreline. Available online at: https://shoreline.noaa.gov/data/datasheets/index.html
Neumann, B., Vafeidis, A. T., Zimmermann, J., and Nicholls, R. J. (2015). Future coastal population growth and exposure to sea-level rise and coastal flooding - a global assessment. PLoS ONE 10:e0118571. doi: 10.1371/journal.pone.0118571
NOAA (2019). Environmental Sensitivity Index (ESI) Maps and Data. Office of Response and Restoration. Available online at: https://response.restoration.noaa.gov/resources/environmental-sensitivity-index-esi-maps
NOAA (2021). Next Generation ESI Workshop: Looking Back One Year Later. Office of Response and Restoration Last updated December 11, 2021. Available online at: https://response.restoration.noaa.gov/sites/default/files/ESI-Workshop-Report_Dec2021_Final.pdf
Ocean Policy Committee (2020). National Strategy for Mapping, Exploring, and Characterizing the United States Exclusive Economic Zone. Available online at: https://oeab.noaa.gov/wp-content/uploads/2021/01/2020-national-strategy.pdf
Paterson, S. K., Loomis, D. K., and Young, S. E. (2014). The human dimension of changing shorelines along the US North Atlantic Coast. Coast. Manag. 42:1. doi: 10.1080/08920753.2013.863724
Pauly, D.. (1995). Anecdotes and the shifting baseline syndrome of fisheries. Trends Ecol. Evol. 10:10. doi: 10.1016/S0169-5347(00)89171-5
Petersen, J., Nelson, D., Marcella, T., Michel, J., Atkinson, M., White, M., et al. (2019). Environmental Sensitivity Index Guidelines, Version 4.0. Silver Spring, MD: NOAA Technical Memorandum NOS OR&R 52.
Peterson, M. S., and Lowe, M. R. (2009). Implications of cumulative impacts to estuarine and marine habitat quality for fish and invertebrate resources. Rev. Fisher. Sci. 17, 505–523. doi: 10.1080/10641260903171803
Pew Oceans Commission (2003). America's Living Oceans: Charting a Course for Sea Change. Arlington, VA: Recommendations for a New Ocean Policy.
Scyphers, S. B., Beck, M. W., Furman, K. L., Haner, J., Josephs, L. I., Lynskey, R., et al. (2019). A waterfront view of coastal hazards: contextualizing relationships among geographic exposure, shoreline type, and hazard concerns among coastal residents. Sustainability. 11:6687. doi: 10.3390/su11236687
Scyphers, S. B., Picou, J. S., and Powers, S. P. (2014). Participatory conservation of coastal habitats: the importance of understanding homeowner decision making to mitigate cascading shoreline degradation: participatory conservation of coastlines. Conserv. Lett. 8, 41–49. doi: 10.1111/conl.12114
Scyphers, S. B., Picou, J. S., and Powers, S. P. (2015). Participatory conservation of coastal habitats: the importance of understanding homeowner decision making to mitigate cascading shoreline degradation. Conserv. Lett. 8, 41–49.
Smith, C. S., and Scyphers, S. (2019). Past hurricane damage and flood zone outweigh shoreline hardening for predicting residential-scale impacts of Hurricane Matthew. Environ. Sci. Policy 101, 46–53. doi: 10.1016/j.envsci.2019.07.009
Soga, M., and Gaston, K. J. (2018). Shifting baseline syndrome: causes, consequences, and implications. Front. Ecol. Environ. 16:4. doi: 10.1002/fee.1794
Stafford, S., and Guthrie, A. G. (2020). What drives property owners to modify their shorelines? A case study of Gloucester County, Virginia. Wetlands 40, 1739–1750. doi: 10.1007/s13157-020-01358-6
Sundblad, G., and Bergström, U. (2014). Shoreline development and degradation of coastal fish reproduction habitats. Ambio 43, 1020–1028. doi: 10.1007/s13280-014-0522-y
Taherkhani, M., Vitousek, S., Barnard, P. L., Frazer, N., Anderson, T. R., and Fletcher, C. H. (2020). Sea-level rise exponentially increases coastal flood frequency. Sci. Rep. 10:6466. doi: 10.1038/s41598-020-62188-4
Thompson, R. C., Crowe, T. P., and Hawkins, S. J. (2002). Rocky intertidal communities: past environmental changes, present status and predictions for the next 25 years. Environ. Conserv. 29:2. doi: 10.1017/S0376892902000115
Titus, J. G., Hudgens, D. E., Trescott, D. L., Craghan, M., Nuckols, W. H., Hershner, C. H., et al. (2009). State and local governments plan for development of most land vulnerable to rising sea level along the US Atlantic coast. Environ. Res. Lett. 4:4. doi: 10.1088/1748-9326/4/4/044008
Trenberth, K.. (2005). Uncertainty in hurricanes and global warming. Science 308, 1753–1754. doi: 10.1126/science.1112551
Vona, I., Gray, M. W., and Nardin, W. (2020). The impact of submerged breakwaters on sediment distribution along marsh boundaries. Water 12:1016. doi: 10.3390/w12041016
Wright, J.. (2020). Coastal & Marine Ecological Classification Standard Community Forum. Available online at: https://my.usgs.gov/confluence/display/CMECSIG/CMECS+Community+Forum+Home
Keywords: coastal protection, shoreline hardening, coastal management, hazard adaptation, shoreline mapping
Citation: Correll-Brown R, Wellman EH, Eulie DO, Scyphers SB, Smith CS, Polk MA and Gittman RK (2022) Shifting Baselines May Undermine Shoreline Management Efforts in the United States. Front. Clim. 4:719109. doi: 10.3389/fclim.2022.719109
Received: 01 June 2021; Accepted: 04 January 2022;
Published: 26 January 2022.
Edited by:
Hiba Baroud, Vanderbilt University, United StatesReviewed by:
Moh Ravan, University of Stuttgart, GermanyJason Toft, University of Washington, United States
Pamela Mason, William & Mary, United States
Matthew Kornis, Green Bay FWCO, United States
Copyright © 2022 Correll-Brown, Wellman, Eulie, Scyphers, Smith, Polk and Gittman. This is an open-access article distributed under the terms of the Creative Commons Attribution License (CC BY). The use, distribution or reproduction in other forums is permitted, provided the original author(s) and the copyright owner(s) are credited and that the original publication in this journal is cited, in accordance with accepted academic practice. No use, distribution or reproduction is permitted which does not comply with these terms.
*Correspondence: Rachel K. Gittman, Z2l0dG1hbnIxN0BlY3UuZWR1