 Isabella Chiaravalloti1*
 Nicolas Theunissen1
 Shuang Zhang2
 Jiuyuan Wang1Fengchao Sun3
 Ayesha A. Ahmed1Evelin Pihlap1
 Christopher T. Reinhard4Noah J. Planavsky1,5
- 1Department of Earth and Planetary Sciences, Yale University, New Haven, CT, United States
- 2Department of Oceanography, Texas A&M University, College Station, TX, United States
- 3School of the Environment, Yale University, New Haven, CT, United States
- 4School of Earth and Atmospheric Sciences, Georgia Institute of Technology, Atlanta, GA, United States
- 5Yale Center for Natural Carbon Capture, Yale University, New Haven, CT, United States
Nitrous oxide (N2O) is a potent and long-lived greenhouse gas that accounts for roughly 6% of global anthropogenic greenhouse gas emissions, and it has risen from its preindustrial concentration of 270 ppb N2O to 332 ppb N2O as a result of human activities. The majority of anthropogenic N2O emissions (52–80%) come from agricultural settings due to high rates of reactive nitrogen fertilizer application. Amending soils with fine-grained basalt is gaining traction as a carbon dioxide removal (CDR) pathway, and model simulations suggest that this process may also significantly decrease soil N2O emissions. Here, we continuously measure N2O fluxes from large-scale maize mesocosms in a greenhouse setting and use a machine learning framework to assess the relative importance of the levers on N2O fluxes. We observe significant decreases in cumulative N2O emissions (between 29–32%) from mesocosm systems with basalt addition. We find that basalt application rate, soil pH, and surface soil moisture are the strongest levers on N2O emissions depending on the system settings. These results provide empirical support for a potentially significant co-benefit of deploying enhanced rock weathering of silicates (ERW) on managed lands, particularly those subject to elevated rates of reactive nitrogen input.
1. Introduction
The increase in greenhouse gas concentrations and air pollutants since preindustrial times has already begun to have significant climate, ecological, and economic repercussions, some of which may already be irreversible (IPCC, 2021; FAO, 2022). These impacts will continue to increase in severity with additional warming (IPCC, 2021), which is probable as anthropogenic warming is projected to exceed the Paris Accord target of 1.5°C under almost all emissions scenarios (Tebaldi et al., 2021). Given the challenge of meeting key international climate goals (Lee et al., 2023), there has been an increased focus on atmospheric CDR and other negative emissions technologies. However, for many CDR pathways—particularly those that intersect with the agricultural sector—there is still significant uncertainty about the impacts of management practice on soil N2O emissions (Guenet et al., 2021).
N2O is a long-lived greenhouse gas with a perturbation lifetime of ~116 years (Prather et al., 2015), and has up to 298 times the global warming potential of carbon dioxide (CO2) (Myhre et al., 2013). Its concentration has risen 23% from the pre-industrial concentration of 270 ppb to the current atmospheric concentration of 332 ppb, with a rate of increase of 0.85 ppb per year in recent decades (IPCC, 2021). Agriculture comprises 52–80% of anthropogenic N2O emissions (Kroeze et al., 1999; Davidson, 2009; Williams and Crutzen, 2010; Syakila and Kroeze, 2011; Zaehle et al., 2011; Park et al., 2012; Ciais et al., 2013; Tian et al., 2020), and this is largely due to incomplete microbial nitrification and denitrification processes under conditions of intense nitrogen fertilizer application (Butterbach-Bahl et al., 2013; Snider et al., 2015; IPCC, 2021). Importantly, these emissions are expected to increase in the coming century due to the increased demand for food for a growing population and the reliance of agriculture on nitrogen fertilizers (Ciais et al., 2013). As a result, it is critical to evaluate any shift in agricultural practice for its impact on N2O emissions, including those designed to capture CO2. For example, many forms of agricultural CDR, such as reduced tillage practices (Mei et al., 2018; Guenet et al., 2021; Jiang et al., 2022), organic amendments such as manure or compost (Zhou et al., 2017; Shakoor et al., 2021), or irrigation to increase soil organic content (McGill et al., 2018), can significantly increase soil N2O fluxes. In contrast, ERW is a mode of CDR that has the potential to significantly decrease N2O fluxes (Blanc-Betes et al., 2020; Val Martin et al., 2023).
Initial work provides strong support for the contention that ERW with basalt in agricultural lands has the potential to simultaneously offset a significant component of total anthropogenic CO2 emissions and increase agricultural yields (Kantola et al., 2017; Beerling et al., 2018, 2020; Kelland et al., 2020; Vakilifard et al., 2021; Zhang et al., 2022). The basic idea behind CDR through ERW in agricultural settings is simple—soil CO2 readily reacts with a range of cation-rich minerals, leading to a net removal of carbon from the atmosphere. Initial estimates of the extent of carbon removal through ERW in agricultural lands suggest a capture potential of roughly 10% of total anthropogenic carbon emissions at a cost of $80-$180 per metric ton of CO2 removed (Beerling et al., 2020), lower than recent estimates of the social cost of carbon ($185) (e.g., Rennert et al., 2022). ERW also deacidifies soils, increasing soil pH by releasing base cations and forming bicarbonate, which is significant given that agricultural N2O fluxes are inversely related to soil pH (e.g., Kantola et al., 2017; Zhang et al., 2018; Hénault et al., 2019).
There are several mechanistic links between soil pH and N2O emission rates. First, increasing soil pH alters nitrification and denitrification rates, favoring more complete denitrification (production of N2, rather than N2O, during dissimilatory nitrate reduction) (Barton et al., 2013a,b; Samad et al., 2016; Abalos et al., 2020; Vázquez et al., 2020). Second, elevated soil pH can potentially lead to more favorable assembly conditions for the N2O reductase enzyme, nosZ, enhancing N2O consumption within soils (Stevens et al., 1998; Bergaust et al., 2010; Liu et al., 2010; Bakken et al., 2012). Lastly, increased plant productivity at higher pH allows plants to sequester bioavailable nitrogen more efficiently and therefore reduces the availability nitrogen in soils for N2O production (Abalos et al., 2020). Model-based assessments at the site scale (Blanc-Betes et al., 2020) and at regional/global scales (Val Martin et al., 2023) suggest strong potential for basalt amendments to reduce N2O emissions from cropland soils. Here, we provide a new perspective on the links between N2O emissions and ERW by providing continuous measurements of N2O fluxes in large-scale maize mesocosms grown in an environmentally controlled setting.
2. Materials and methods
2.1. Overview
We grew maize (zea mays, Reid's Yellow Dent Open Pollinated Corn Seed, Bradley Seed Brand) in a Yale Science Building research greenhouse (affiliated with Yale University's Marsh Botanical Garden's plant growth facility) controlled by an Argus Prime automation system with and without basalt amendments under average growing season conditions. We measured greenhouse gas fluxes, soil pH, topsoil Sikora buffer pH, pore water alkalinity, temperature, soil moisture, and total nutrient of the soil and corn plant matter. We performed two iterations of the experiment (Run 1, Run 2) in the same mesocosms. System settings and measurements taken for each iteration of the experiment are listed in Table 1.

Table 1. Experimental settings and measurements.
2.2. System settings
All maize was grown in 121-liter containers with a 55.88 cm diameter. We chose to use large containers relative to those used in other ERW mesocosm experiments [e.g., ~55-liter (Amann et al., 2020), and ~7.8-liter (Buckingham et al., 2022)] given that small column experiments may lead to differences in soil and system behavior that can alter ERW rates and may alter N2O fluxes. In each container, we planted 8 corn seeds at close to standard agricultural densities (8–12 inches apart) and thinned to 4 stalks after 2 weeks if necessary, selecting the smaller stalk to be removed in all cases. We applied fertilizer at a rate of 242 kg N/ha both to ensure a visible N2O flux peak (as N2O fluxes increase with increased fertilizer applications rates Huang et al., 2014; Roy et al., 2014) and because many farms in major corn producing states apply high rates of nitrogen fertilizer (Xia et al., 2021). Each container received fertilizer via injection of urea-ammonium-nitrate fertilizer in a row 5 cm away from the seeds to minimize risk of seed burning.
We also measured or modulated other factors in addition to soil pH that have been documented to impact N2O fluxes, including soil moisture, soil texture, crop type, fertilizer timing and application rate, soil organic carbon content, temperature, and upper soil modification (tilling practice) (Dobbie and Smith, 2001; Stehfest and Bouwman, 2006; Shcherbak et al., 2014; Jiang et al., 2022; Vangeli et al., 2022). Soil moisture is typically observed to have a positive correlation with N2O fluxes, as it decreases the soil oxygen concentration and stimulates denitrifying activity (Dobbie and Smith, 2001; Butterbach-Bahl et al., 2013). Soil organic carbon content also plays a significant and complex role in soil nitrogen cycling but is typically positively correlated with N2O fluxes (Stehfest and Bouwman, 2006). Soil texture and clay content impacts N2O fluxes as more porous soils have increased oxygen availability, stifling denitrification and decreasing N2O fluxes (Mei et al., 2018). Tilling, on average, is likely to increase soil oxygen availability and decrease soil organic carbon content, which together should lead to decreased N2O fluxes (Mei et al., 2018). Fertilizer application rate also directly impacts the amount of bioavailable nitrogen in the soil that can be emitted as N2O (Roy et al., 2014; Shcherbak et al., 2014), and timing fertilizer application during the growing season decreases N2O emissions as plant uptake reduces the potential of N2O formation from soil nitrogen pools (McGill et al., 2018; Shakoor et al., 2021). Temperature has also been found to be positively correlated with N2O flux, as it stimulates microbial community activity and soil respiration (Dobbie and Smith, 2001; Lai et al., 2019).
We kept variables affecting N2O fluxes as constant as possible with the Argus Prime automation system between containers within each iteration of the experiment except for soil pH, which was adjusted via the basalt amendments. The system was programed to mimic average July conditions in Spring Grove, Illinois, USA. We chose to aim for 60% saturated soil moisture—in our mesocosms corresponding to a volumetric water content (VWC) of 25—in order to ensure a significant N2O flux (Sehy et al., 2003; Skiba and Ball, 2006; Roy et al., 2014). We maintained consistent soil moisture via automated irrigation lines dispensing reverse osmosis water through a Netafim NetBow 10-in drip ring via the Argus Prime system, and a porous drainage medium placed at the bottom of each container. We ended the experiment once the N2O fluxes returned to baseline values, typically 24 to 29 days after fertilizer addition.
Basalt feedstock was sourced from waste fines at the East Haven Trap Rock Quarry and prepared by passage through a 0.79 mm sieve. A summary of the following analyses can be found in Table 2. We performed particle size distribution analysis on the sieved basalt with a Microtrac Flowsync Particle Size and Shape Analyzer (Supplementary material 1). We performed BET analysis for the sieved basalt on an Anton Paar Nova 800 (Supplementary material 2). Major and trace element analysis of sieved basalt feedstock was performed using the Ultratrace Aqua Regia complete chemical method at Actlabs (41 Bittern Street, Ancaster, Ontario, L9G 4V5 Canada) (Supplementary material 3). Based on petrographic work, the feedstock is a weakly carbonized metabasalt with traces of secondary quartz veins. Applied feedstock was homogenized in the upper 10 cm of soil in order to simulate disc tillage. Control containers received the same “tilling practice” without any basalt application to surface soil.
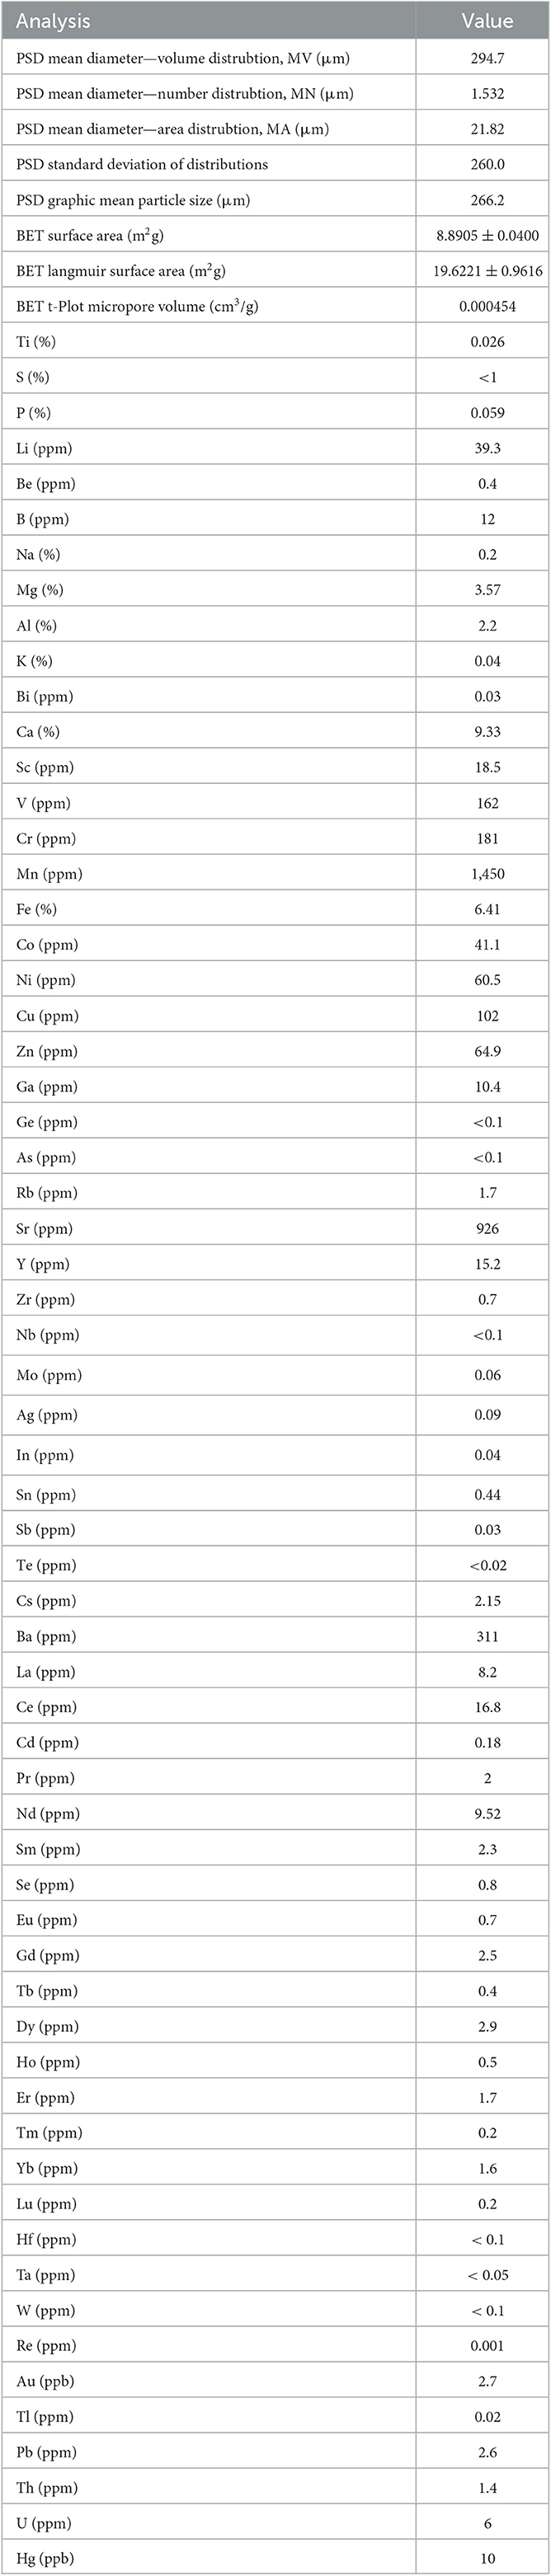
Table 2. Summary of analyses on basalt feedstock.
2.3. Measurements
Weekly pore water samples were taken using Rhizon samplers inserted at three different soil depths (15 cm, 35 cm, and 50 cm) for pore water alkalinity measurements. We calculated alkalinity using a Thermo Scientific Orion Star T920 redox titrator with 0.0501N HCl as the titrant. We performed reproducibility tests and found an error of 1.4% between samples of our sample size (4 mL). Weekly soil moisture (in the form of VWC) measurements were taken at three different soil depths (15 cm, 35 cm, and 50 cm) using a Spectrum Technologies TDR 150 soil moisture meter with an accuracy of ±3.0% VWC. Surface soil was also collected to measure soil pH (with a 1:2.5 soil: water ratio) and to measure Sikora buffer pH. The buffer pH was measured via the Sikora method (Sikora, 2006), with reproducibility tests showing a standard deviation of ±0.024 pH units. The surface soil temperature of each container was continuously monitored by the Eosense automated soil flux chambers (eosAS-LT/LO). All total nutrient analyses of the soil and corn plant matter were performed by Agvise Laboratories, Inc. (804 Highway 15 W, P.O. Box 510, Northwood, ND 58267) (Supplementary material 4, 5).
N2O fluxes were measured with a Picarro Cavity Ringdown Spectrometer model G2508 paired with 10 Eosense automated soil flux chambers (eosAS-LT/LO) and an Eosense recirculating multiplexer (eosMX) (Anthony and Silver, 2020; Eosense, 2020, 2022). A 10-min measurement period was used, with a linear fit and a pre- and post-delay of 1.5 min, to ensure high-resolution flux measurements while measuring the maximum number of samples per container each day. The mass spectrometer was calibrated at the start of the iterations.
2.4. Experiment iterations and different settings
We performed two iterations of the experiment (Run 1, Run 2) with the same conditions as described above. After Run 1, the corn plants were terminated at the end of the peak N2O flux period by cutting the stalk at ground level, to prepare the experiment for Run 2. The second iteration (Run 2) only received new corn seeds and fertilizer, and it did not receive new soil, tilling, basalt, leaf compost, or acid. Run 2 can be treated as a second growing season on soil that had previously been amended during Run 1.
2.5. Data analysis
To calculate total emissions, the flux measurements for each container were integrated over the length of the run using the trapz function from scipy.integrate in Python. Difference in means of cumulative emissions was tested for statistical significance with the two-tailed t-test function from scipy.stats in Python. Manual measurements were linearly interpolated to line up with the continuous flux measurements. The instantaneous flux data, weekly manual measurement data (excluding alkalinity), and application rate data were then fed into the machine learning algorithm in R to predict the instantaneous N2O fluxes from various levers and to assess the relative importance of those levers in regulating the N2O fluxes.
Given the high-dimensional nonlinear pattern in our data, we adopted a machine learning technique to predict N2O fluxes and to quantitatively evaluate the relative importance of each parameter in driving variation in N2O flux. Compared with traditional numerical methods, machine learning has the advantage of being able to approximate arbitrary nonlinear functions with large sets of intertwined parameters, in situations where a physio-chemical based algorithm might be insufficient. Here, we employ the random forest (RF) algorithm (Ho, 1995; Breiman, 2001), a decision tree-based algorithm in which an ensemble prediction is produced from many sub-models (i.e., decision tree) with each “tree” model making independent predictions for the variable of interest (in our case, N2O flux) using assigned input variables (i.e., predictor variables, such as basalt application rate, temperature, soil pH, etc.). The construction of the RF model is conducted in R (R Core Team, 2017) using the “ranger” package (Wright and Ziegler, 2017). We first randomly divide the data into a training dataset (75% of the entire dataset) and a test dataset (25% of the dataset). The training dataset is then used to build our RF model and the test dataset is used to test the performance of our trained RF model on unseen data. During the training process, we form an ensemble of 600 trees with a minimal node size of 3. To determine the relative importance of each feature in driving the change of predicted N2O flux, we adopt the permutation method embedded within the RF model by first calculating the prediction accuracy using the original data then calculating the prediction accuracy again using perturbed data (sequentially perturbing a single predictor variable at a time). The difference between the two accuracy values is the permutation importance for this specific predictor variable and the average difference among all trees gives the RF permutation importance of this variable.
3. Results
3.1. Run 1
The N2O fluxes in Run 1 returned to baseline values 24 days after beginning this iteration of the experiment (Figure 1). The N2O fluxes in Run 1 (between 1.5 and 2.25 nmol N2O/m2s) were similar to common agricultural N2O fluxes during the N2O spike after nitrogen fertilizer application (Lu et al., 2021). There was an obvious negative correlation between N2O flux and soil pH—in basalt-amended mesocosms, soil pH increased while N2O fluxes were smaller (Figure 1A).
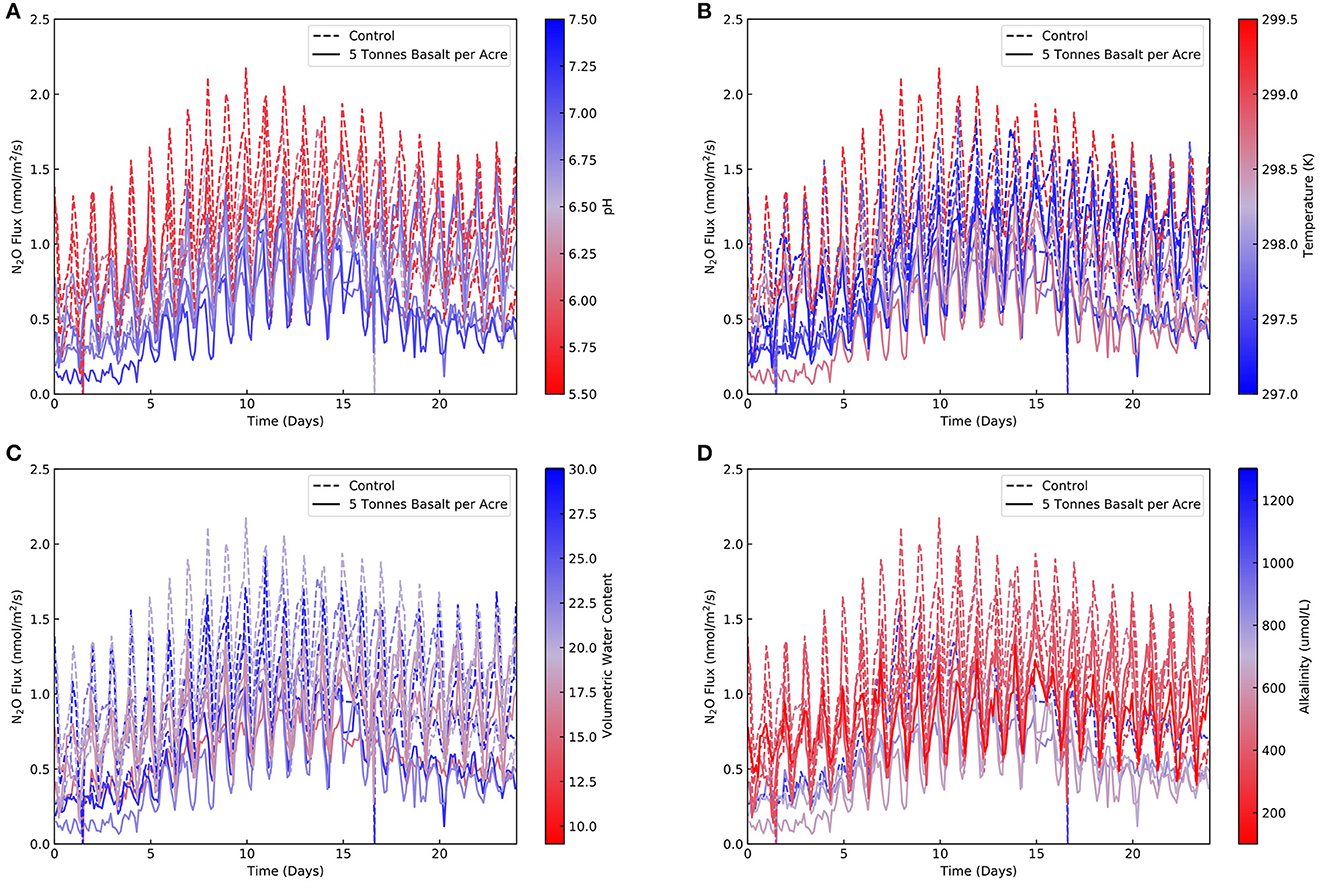
Figure 1. N2O fluxes (nmol/m2/s) relative to days (from start of Run 1) color coded by (A) pH (B) temperature (K) (C) top soil moisture (VWC) (D) alkalinity (umol/L). The dashed lines represent control containers, and the solid lines represent basalt amended containers.
The cumulative N2O emissions were higher in the control group than the basalt amended containers (Figure 2 and Table 3) and followed the negative correlation between N2O emissions and soil pH (Figure 3A). There was also an inverse correlation between porewater alkalinity and N2O emissions (Figure 3D). In Run 1, there weren't any obvious correlations between N2O emissions and soil moisture or temperature (Figures 3B, C). The statistical analysis revealed that Run 1 did have statistically significant difference of means between the basalt amended containers and the control containers, and it showed that Run 1′s results rejected the null hypothesis (Table 4).
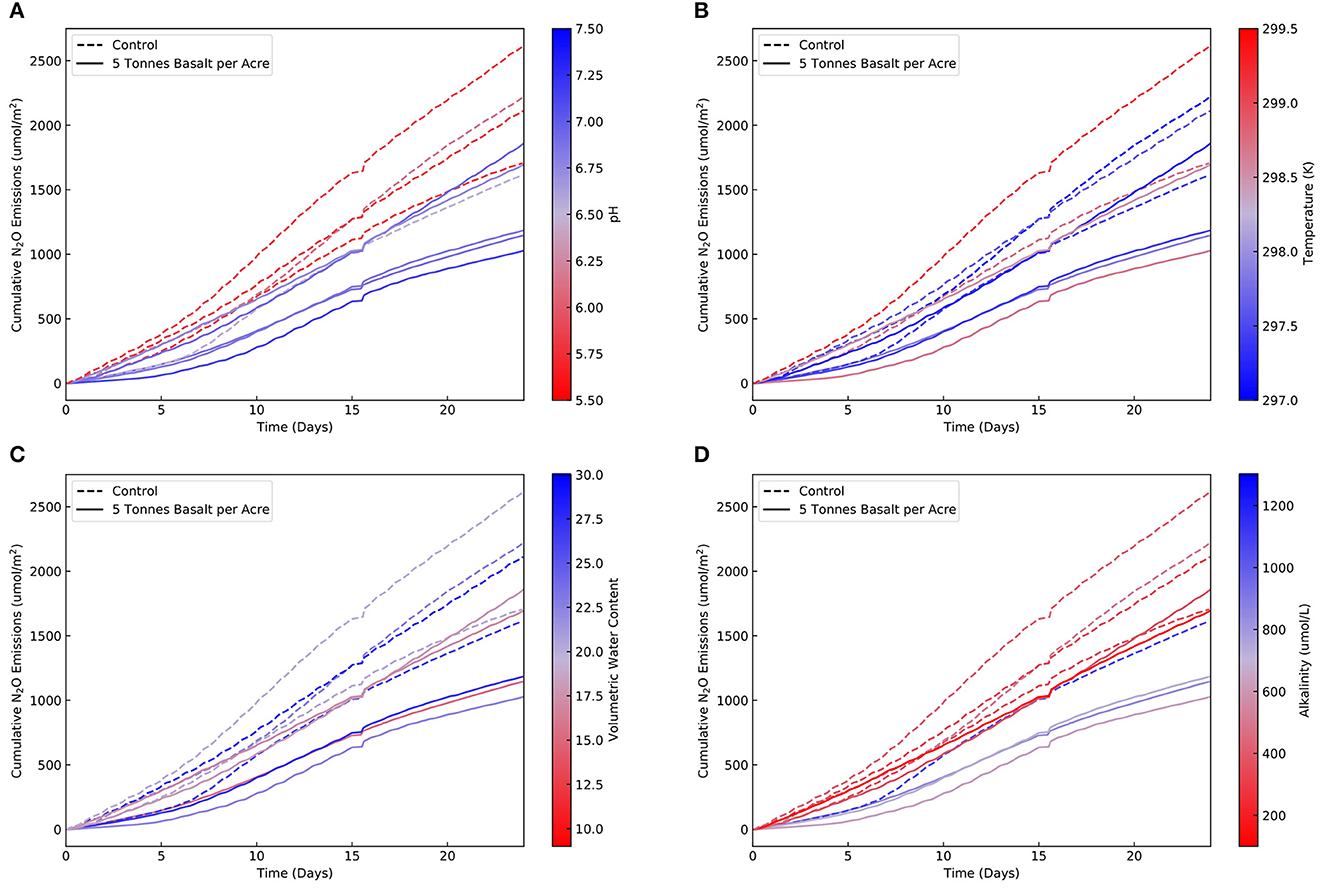
Figure 2. Cumulative N2O emissions (umol/m2) relative to days (from start of Run 1) color coded by (A) pH (B) temperature (K) (C) top soil moisture (VWC) (D) alkalinity (umol/L). The dashed lines represent control containers, and the solid lines represent basalt amended containers.
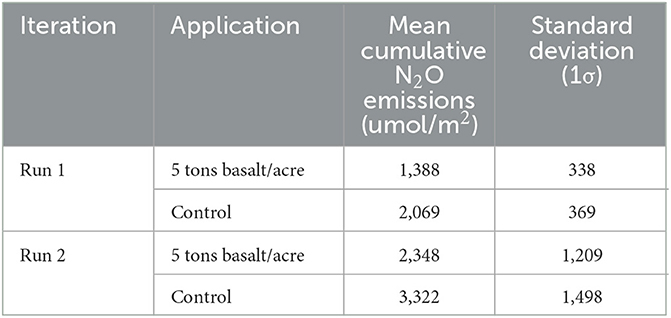
Table 3. Cumulative N2O emissions from run 1 and run 2.
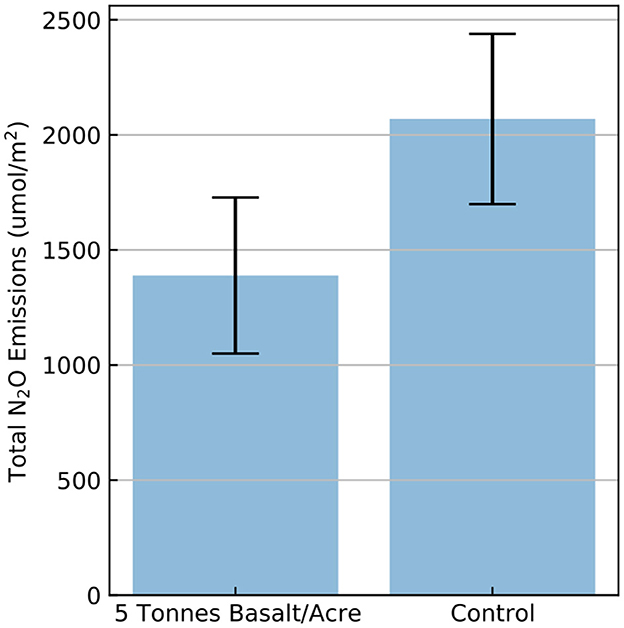
Figure 3. Bar graph showing the mean cumulative N2O emissions (umol/m2) over the experiment period (24 days) for Run 1. Error bars represent standard deviation (1σ).
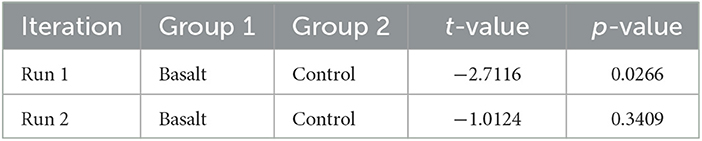
Table 4. T-test– comparison of means from run 1 and run 2.
In Run 1, soil pH increased in the basalt amended containers and remained consistent in the control containers (Supplementary Figure 1 and Supplementary material 6). Buffer pH was higher in the basalt amended containers than in the control containers (Supplementary material 6). The alkalinity at 15 cm was variable in the first 14 days of the experiment but then began to increase slightly in the control containers and more rapidly in the basalt amended containers (Supplementary Figure 2 and Supplementary material 6). Temperature in Run 1 was consistent for each container diurnally but varied spatially with the largest disparity between the containers being ~3°C (Supplementary Figure 5 and Supplementary material 7). The soil moisture was consistent through time for each individual container but varied between containers with the range being ~17 VWC (Supplementary Figure 6 and Supplementary material 6).
We found statistically significant differences in mean value between the control and basalt amended containers in the following categories: pH, Sikora buffer pH, ammonium-nitrate, calcium, sulfur, zinc, iron, manganese, copper, base saturation percent calcium, exchangeable acidity, and calcium carbonate equivalency (Supplementary material 8). Of these, relative to the control containers, the basalt amended containers had higher pH, Sikora buffer pH, calcium, sulfur, base saturation percent calcium, and calcium carbonate equivalency. Of the statistically significant differences, relative to the control containers, the basalt amended containers had lower ammonium-nitrate, zinc, iron, manganese, copper, and exchangeable acidity.
We also found a statistically significant difference in mean between the initial and final measurements on the basalt amended containers in the following categories: pH, Sikora buffer pH, salts, nitrate-nitrogen, calcium, sulfur, iron, manganese, copper, chlorine, cation exchange capacity, base saturation of potassium and calcium, exchangeable acidity, and calcium carbonate equivalency (Supplementary material 8). Of these, there were increases in pH, Sikora buffer pH, salts, nitrate-nitrogen, calcium, sulfur, chlorine, cation exchange capacity, base saturation percent calcium, and calcium carbonate equivalency. There were statistically significant decreases in iron, manganese, copper, potassium base saturation, and exchangeable acidity.
Between the initial and final measurements on the control containers, we found a statistically significant difference in mean across the following categories: organic matter, nitrate-nitrogen, potassium, sulfur, chlorine, and potassium base saturation (Supplementary material 8). Of these, there were increases in organic matter, nitrate-nitrogen, sulfur, and chlorine. There were statistically significant decreases in potassium and potassium base saturation.
We found no statistically significant difference in any plant tissue nutrient values between the control and the basalt amended containers (Supplementary material 8).
3.2. Run 2
The N2O fluxes returned to baseline values 29 days after beginning this iteration of the experiment (Figure 4). Control 1 (container 2) had an anomalously high N2O flux (between 4 and 14 nmol N2O/m2s) at the beginning of the experiment. All other containers had expected values for N2O fluxes ranging from 0.25 to 2.5 nmol N2O/m2s. The N2O emissions for Run 2 did not strongly correlate with soil pH or soil amendment, but they did correlate with soil moisture (Figure 5C). To better visualize the data in case control 1′s N2O flux was anomalous, we show the N2O fluxes and cumulative N2O emissions without control 1 for Run 2 (Figures 4, 5). Plots including control 1 are located in the supplemental info (Supplementary Figures 9, 10). The average cumulative N2O emissions from the basalt amended containers were lower than those from the control containers (Figure 6 and Table 3). However, there was no statistically significant difference between the means of the N2O emissions from the basalt amended containers and the control containers (Table 4).
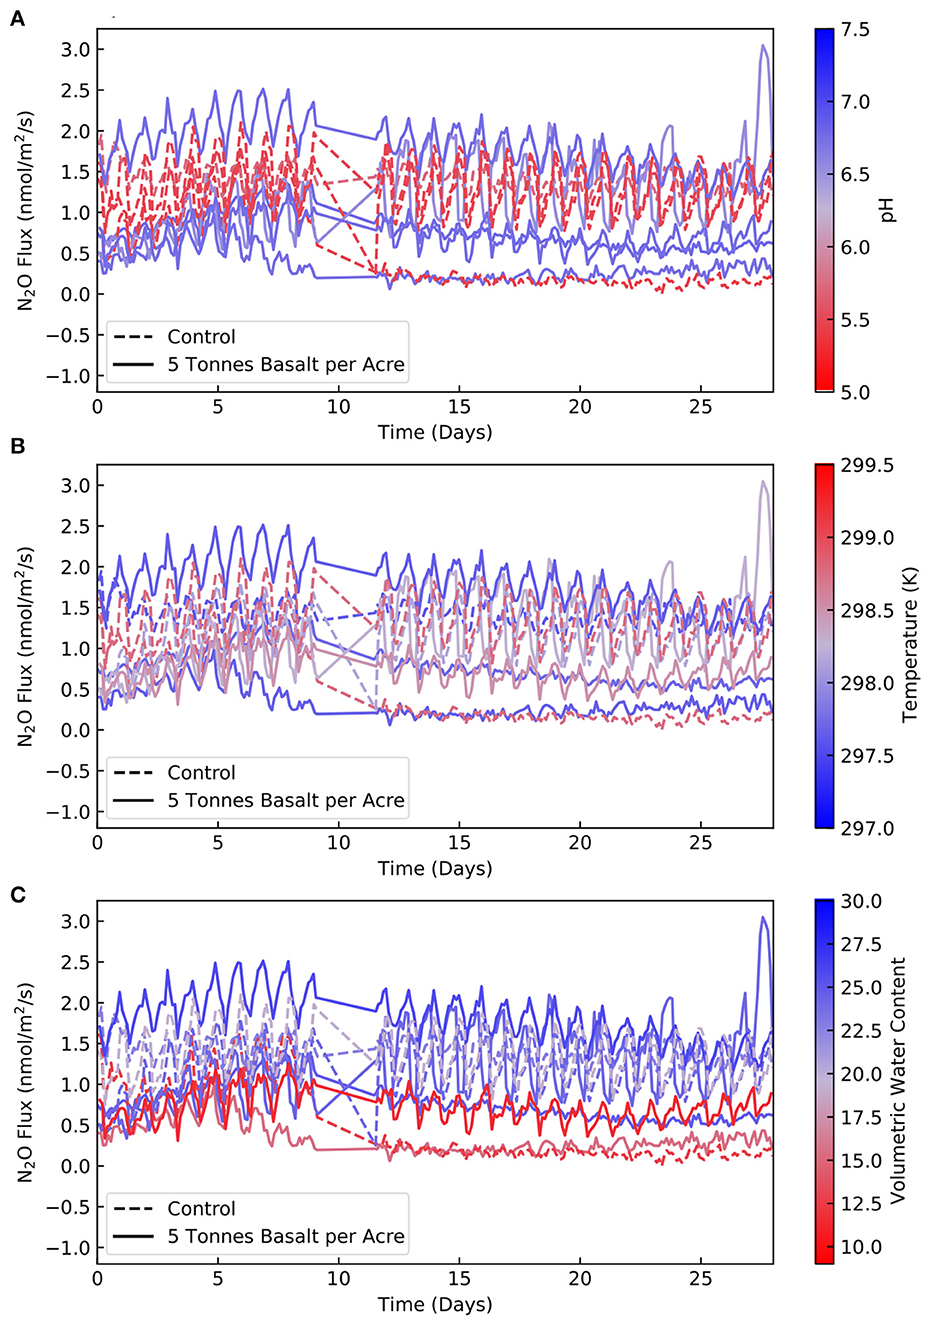
Figure 4. N2O fluxes (nmol/m2/s) relative to days (from start of Run 2) color coded by (A) pH (B) temperature (K) (C) top soil moisture (VWC). The dashed lines represent control containers, and the solid lines represent basalt amended containers. Note that a crash in the Eosense software caused a 2.5-day gap in measurement between early on Day 9 to midday on Day 11. This figure excludes control 1.
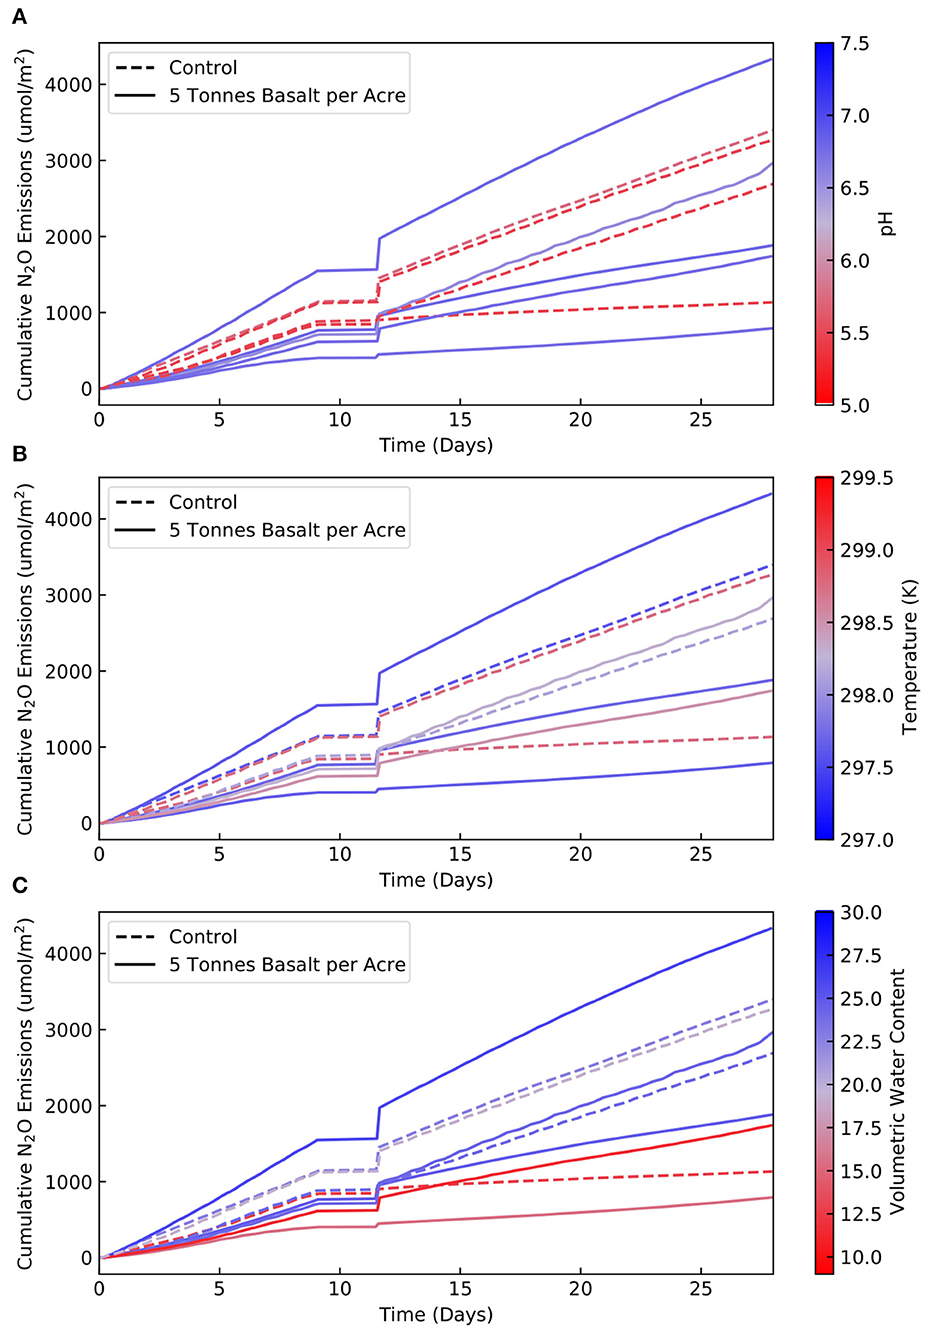
Figure 5. Cumulative N2O emissions (umol/m2) relative to days (from start of Run 2) color coded by (A) pH (B) temperature (K) (C) top soil moisture (VWC). The dashed lines represent control containers, and the solid lines represent basalt amended containers. Note that a crash in the Eosense software caused a 2.5-day gap in measurement between early on Day 9 to midday on Day 11. This figure excludes control 1.
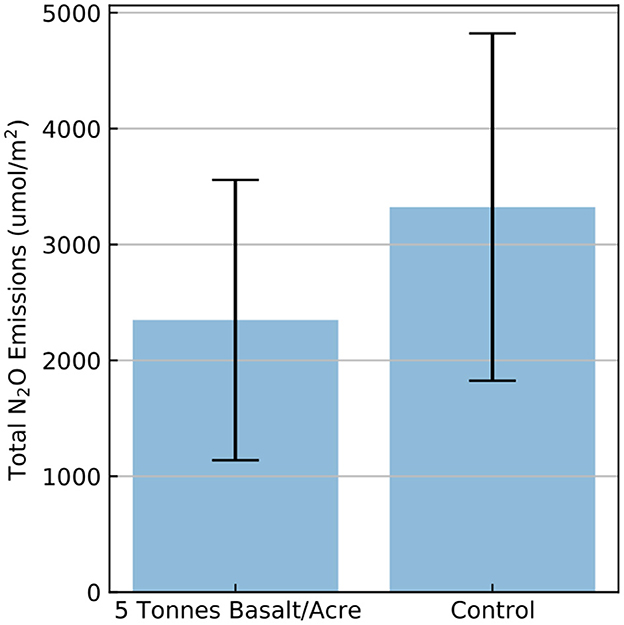
Figure 6. Bar graph showing the mean cumulative N2O emissions (umol/m2) over the experiment period (29 days) for Run 2. Error bars represent standard deviation (1σ).
Soil pH and buffer pH both remained relatively constant through time (as no new basalt was added) and were both higher in the basalt amended containers than the control containers (Supplementary Figure 11 and Supplementary material 9). Soil moisture for each container was relatively stable, but between containers the largest range was ~20 VWC (Supplementary Figure 12 and Supplementary material 9). The temperature in Run 2 behaved similarly to Run 1 and was consistent for each container diurnally but varied spatially with the largest disparity between the containers being ~3°C (Supplementary Figure 15 and Supplementary material 10).
3.3. Machine learning framework: run 1 and run 2
The RF framework yielded an R2 of 0.97 on the training data and an R2 of 0.82 on the test data (Supplementary Figures 16, 17). The permutation importance technique performed on the data from Run 1 indicated that Sikora buffer pH (negative correlation) had the highest relative importance, followed by basalt application rate (negative correlation), soil pH (negative correlation), time (positive correlation), middle soil moisture (negative correlation), top soil moisture (positive correlation), bottom soil moisture (negative correlation), then temperature (negative correlation) (Figure 7A and Supplementary Figure 20).
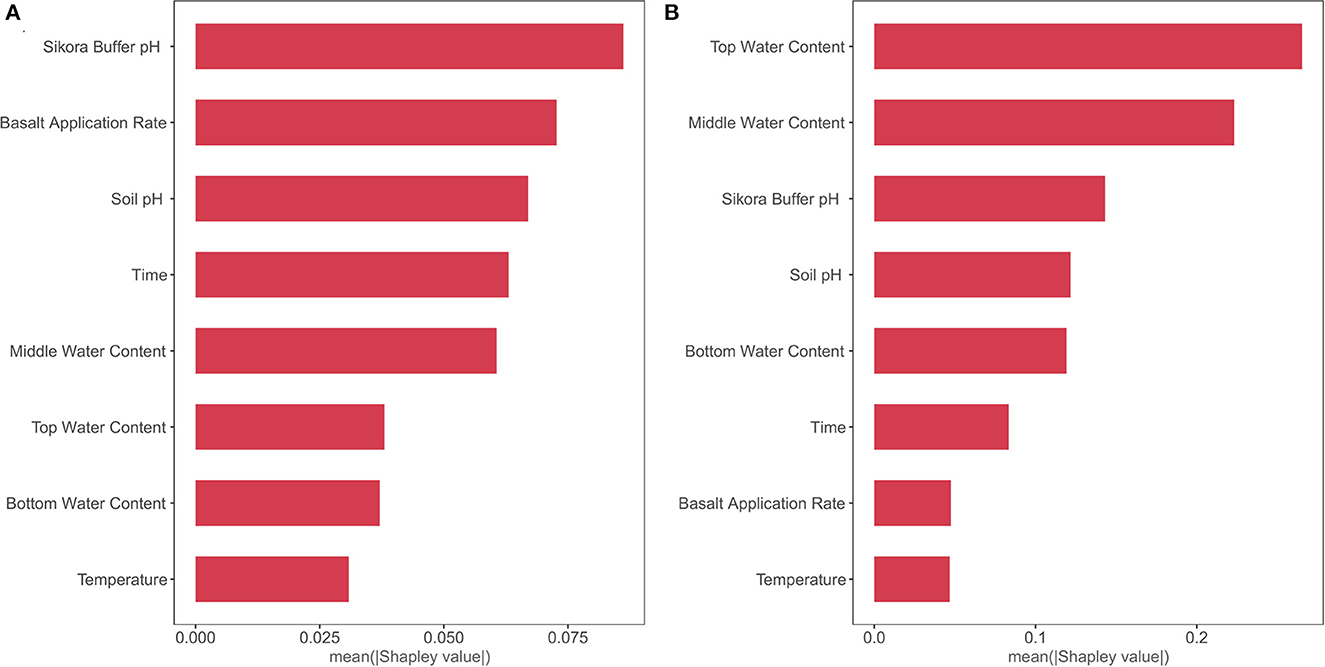
Figure 7. Relative importance of levers on N2O fluxes as indicated by the permutation importance technique performed by the RF framework for (A) Run 1 and (B) Run 2.
For Run 2, the RF framework yielded an R2 of 0.99 on the training data and an R2 of 0.94 on the test data (Supplementary Figures 21, 22). In Run 2, the permutation importance technique performed on the data indicated that top soil moisture (positive correlation) had the highest relative importance, followed by middle soil moisture (positive correlation), Sikora buffer pH (negative correlation), soil pH (negative correlation), bottom soil moisture (positive correlation), time (negative correlation), basalt application rate (negative correlation), then temperature (negative correlation) (Figure 7B and Supplementary Figure 25).
Despite the basalt application rate being a binary variable (0 or 5 tons basalt per acre) within our data set, we chose to include it when training and testing the data with the machine learning framework to collate basalt-related impacts that go beyond pH or other weekly measured responses (e.g., soil structure, nutrient release, etc.). Analyses performed excluding basalt application rate as a variable are included in the supplemental info (Supplementary Figures 26–37).
3.4. Machine learning framework: runs 1 and 2 combined
Because Runs 1 and 2 were similar and Run 2 can function as another growing season on the same soil as Run 1, we analyzed the combined data with our machine learning framework. It yielded an R2 value of 0.98 for the training data and an R2 value of 0.91 for the test data (Supplementary Figures 38, 39). In the combined analysis, the permutation importance technique performed on the data indicated that Sikora buffer pH (negative correlation) had the highest relative importance, followed by middle soil moisture (positive correlation), basalt application rate (negative correlation), soil pH (negative correlation), top soil moisture (positive correlation), time (positive correlation), bottom soil moisture (negative correlation), then temperature (negative correlation) (Figure 8 and Supplementary Figure 42). Analyses performed excluding basalt application rate as a variable are included in the supplemental info (Supplementary Figures 43–48).
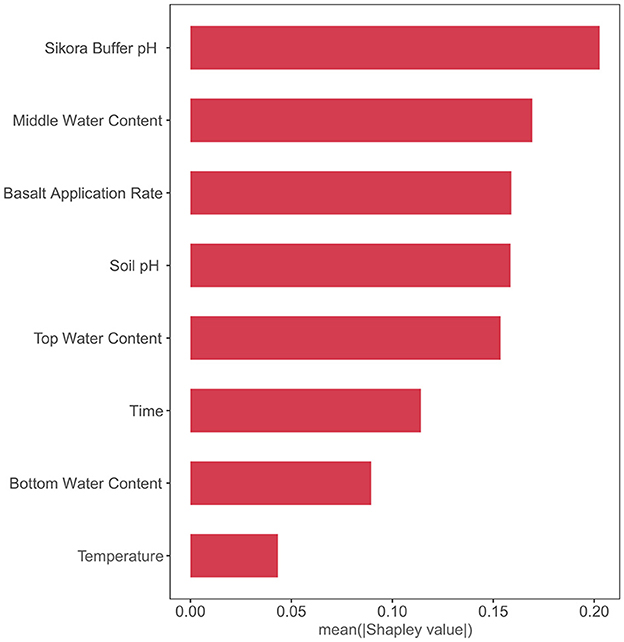
Figure 8. Relative importance of levers on N2O fluxes as indicated by the permutation importance technique performed by the RF framework for Runs 1 and 2 combined.
4. Discussion
4.1. Run 1
Run 1 had a N2O peak period (24 days) consistent with those seen in agricultural settings (Roy et al., 2014; Maier et al., 2022). The N2O fluxes (between 1.5 and 2.25 nmol N2O/m2s) were also similar to typical agricultural values (Lu et al., 2021). The fact that soil pH, buffer pH, and pore water alkalinity all increased through time are all signals for significant basalt weathering. As expected, there was also an obvious negative correlation between soil pH and N2O flux, likely due to the links between soil pH and microbial activity and nitrous oxide reductase assembly (Stevens et al., 1998; Bergaust et al., 2010; Liu et al., 2010; Bakken et al., 2012; Barton et al., 2013a,b; Samad et al., 2016; Abalos et al., 2020; Vázquez et al., 2020). Since alkalinity is released as basalt weathers, and if basalt application increases soil pH and decreases N2O fluxes, then we would naturally expect an alkalinity increase with decreased N2O fluxes.
The RF framework was successful in predicting N2O fluxes, with an R2 of 0.82 on the test data, suggesting that the current parameters fed into the machine learning framework can largely capture the variation of observed N2O flux. Because Sikora buffer pH, basalt application rate, and soil pH were ranked as the top three in relative importance for predicting N2O fluxes, this indicates that basalt application played a key role in mitigating N2O fluxes during this iteration of the experiment. The middle soil moisture was ranked as more important for predicting N2O fluxes than the top soil moisture. While top soil moisture was positively correlated with N2O fluxes, as expected, middle soil moisture was unexpectedly negatively correlated with N2O fluxes. Time showed a nonlinear relationship with N2O fluxes that Spearman's rank coefficient was unable to capture, but the analysis indicated that time was positively correlated with N2O fluxes. The fact that soil pH had a slightly smaller correlation coefficient than basalt application rate could indicate that basalt application exerts important influences on N2O production beyond increasing the pH, for instance changing soil structure in ways that reduce N2O production.
4.2. Run 2
Run 2 also had a N2O peak period (29 days) that was consistent with average agricultural N2O peaks after fertilization. Additionally, all of Run 2′s containers had N2O fluxes (between 0.25 and 14 nmol N2O/m2s) within average expected agricultural ranges (1–50 nmol N2O/m2s) (Huang et al., 2014; Huddell et al., 2021; Su et al., 2021; Maier et al., 2022). These fluxes were slightly higher than N2O fluxes from Run 1, which we attribute to soil settling between iterations of the experiment given that we did not homogenize the top 10 cm of soil during this iteration of the experiment. With a more compact soil structure, there would be less aeration in the soil and therefore enhanced denitrifier activity, leading to higher N2O fluxes. This may also explain why the soil moisture was more consistent within each container relative to Run 1. The cause of the higher N2O fluxes in control 1 (4–14 nmol N2O/m2s) relative to the other containers (0.25–2.5 nmol N2O/m2s) is not clear, as it did not have a notably lower soil pH, higher temperature, or higher soil moisture than any of the other control (or basalt amended) containers. However, we have poor constraints on soil structure in the mesocosm, and this can significantly affect the extent of soil anoxic conditions and in particular the development and maintenance of anoxic microzones that could promote N2O production.
For Run 2, the RF framework was successful in predicting N2O fluxes again, with an R2 of 0.94 on the test data. However, in this iteration of the experiment, top and middle soil moisture (which were both positively correlated with N2O flux) were ranked higher than Sikora buffer pH, soil pH, and basalt application rate. The ability for moisture to saturate the soil more readily (from the settling of the soil) likely allowed soil moisture to be the dominant lever in Run 2. Because soil moisture was a stronger lever than Sikora buffer pH, soil pH, and basalt application rate, even though the latter three were still all negatively correlated with N2O flux, this may explain why Run 2 did not have any statistically significant difference in mean cumulative N2O emissions between the basalt amended containers and the control containers despite the lower cumulative N2O emissions on average in the basalt amended containers. The lower average emissions suggest that basalt amendments decrease N2O emissions by increasing soil pH, and the lack of statistical significance could be due to another more dominant lever—in this case, soil moisture, as suggested by the machine learning framework. This implication that soil structure plays an important role in N2O fluxes agrees with observations suggesting that tilling practices strongly influence N2O fluxes (Mei et al., 2018; Kim et al., 2021; Jiang et al., 2022).
4.3. Runs 1 and 2 combined
The combined data from Runs 1 and 2 were also successfully predicted by the RF framework, with an R2 of 0.91 for the test data. In this test, the permutation importance technique showed that while Sikora buffer pH was ranked highest in relative importance, followed by middle soil moisture, the N2O flux was similarly sensitive to Sikora buffer pH, middle soil moisture, basalt application rate, soil pH, and top soil moisture. This suggests that both soil moisture and basalt application had strong predictive power for determining N2O fluxes. This also suggests that ERW is a more dominant lever overall, and it decreases N2O fluxes by removing acidity from the soil system.
5. Conclusion
Results from our continuous empirical N2O flux measurements in large-scale maize mesocosms add to growing support for the notion that ERW with basalt is likely an effective strategy for mitigating soil N2O emissions in agricultural systems (Kantola et al., 2017; Beerling et al., 2018, 2020; Kelland et al., 2020; Vakilifard et al., 2021; Zhang et al., 2022). We observe clear evidence of decreased soil N2O fluxes with increasing soil pH during basalt weathering, with additional modulation of N2O fluxes due to other effects of basalt amendment such as improved soil structure. Our observations also support the widely held view that soil moisture is a key player in determining soil N2O fluxes (e.g., Dobbie and Smith, 2001; Butterbach-Bahl et al., 2013). The addition of fine-grained basalt into some soil types may increase water retention and thus N2O fluxes, and therefore assuming model based N2O flux estimates may be problematic in some soil types. It is also important to note that the scale of change in N2O fluxes will vary with different basalt feedstocks, application rates, and soil types, but our work bolsters the general idea that ERW can decrease N2O fluxes. Therefore, further mesocosm and field-scale studies are needed for more accurate greenhouse gas accounting. Nonetheless, our results support model simulations indicating that basalt addition can significantly decrease soil N2O emissions (Blanc-Betes et al., 2020; Val Martin et al., 2023). This bolsters the case that ERW can lead to a decrease in agricultural greenhouse gas emissions both by capturing CO2 and by reducing fluxes of N2O to the atmosphere. This could also help shape the perception of ERW as a CDR technology and provide new insights on its value in the carbon market as an emissions reduction technology. These results are inspiring for field-scale research on the link between ERW and N2O emissions in the future for a nuanced understanding of this relationship in a realistic outdoor environment.
Data availability statement
The original contributions presented in the study are included in the article/Supplementary material, further inquiries can be directed to the corresponding author.
Author contributions
IC, NT, CR, and NP conceived and designed the experiment. IC, NT, JW, FS, AA, and EP aided in experimental setup and sampling. SZ developed the machine learning analysis and wrote a section of the manuscript. IC and NT performed statistical analysis and in-house wet-lab chemistry. IC written the first draft of the manuscript. All authors contributed to discussions about the data, manuscript revision, read, and approved the submitted version.
Funding
The authors declare that this study received funding from the Yale Center for Natural Carbon Capture. The funder was not involved in the study design, collection, analysis, interpretation of data, the writing of this article, or the decision to submit it for publication.
Acknowledgments
The authors would like to acknowledge Andrew Knudsen and Maria Val Martin for their insights that aided the efforts of the authors. NP acknowledges support from the Yale Center for Natural Carbon Capture.
Conflict of interest
The authors declare that the research was conducted in the absence of any commercial or financial relationships that could be construed as a potential conflict of interest.
Publisher's note
All claims expressed in this article are solely those of the authors and do not necessarily represent those of their affiliated organizations, or those of the publisher, the editors and the reviewers. Any product that may be evaluated in this article, or claim that may be made by its manufacturer, is not guaranteed or endorsed by the publisher.
Supplementary material
The Supplementary Material for this article can be found online at: https://www.frontiersin.org/articles/10.3389/fclim.2023.1203043/full#supplementary-material
Supplementary Material 1. Full report of particle size analysis on the basalt feedstock.
Supplementary Material 2. Full report of BET analysis on the basalt feedstock.
Supplementary Material 3. Full chemical analysis of the basalt feedstock.
Supplementary Material 4. Total nutrient analysis of the soils.
Supplementary Material 5. Total nutrient analysis of the corn plant matter.
Supplementary Material 6. Manual measurements from Run 1.
Supplementary Material 7. Cavity Ringdown Spectrometer flux data from Run 1.
Supplementary Material 8. Statistical analysis results from all data.
Supplementary Material 9. Manual measurements from Run 2.
Supplementary Material 10. Cavity Ringdown Spectrometer flux data from Run 2.
References
Abalos, D., Liang, Z., Dörsch, P., and Elsgaard, L. (2020). Trade-offs in greenhouse gas emissions across a liming-induced gradient of soil pH: role of microbial structure and functioning. Soil Biol. Biochem. 150, 108006. doi: 10.1016/j.soilbio.2020.108006
Amann, T., Hartmann, J., Struyf, E., de Oliveira Garcia, W., Fischer, E. K., Janssens, I., et al. (2020). Enhanced Weathering and related element fluxes – a cropland mesocosm approach. Biogeosciences 17, 103–119. doi: 10.5194/bg-17-103-2020
Anthony, T. L., and Silver, W. L. (2020). Field Deployment of Picarro G2508 and Eosense eosAC/eosMX in Perennially or Periodically Flooded Soils. Eosense Application Note AN041. Available online at: https://eosense.com/picarro-application-note-field-deployment-of-picarro-g2508-and-eosense-eosac-eosmx-in-perennially-or-periodically-flooded-soils/ (accessed June 10, 2023).
Bakken, L. R., Bergaust, L., Liu, B., and Frostegård, Å. (2012). Regulation of denitrification at the cellular level: a clue to the understanding of N2O emissions from soils. Philos. Trans. R. Soc. B Biol. Sci. 367, 1226–1234. doi: 10.1098/rstb.2011.0321
Barton, L., Gleeson, D. B., Maccarone, L. D., Zúñiga, L. P., and Murphy, D. V. (2013a). Is liming soil a strategy for mitigating nitrous oxide emissions from semi-arid soils? Soil Biol. Biochem. 62, 28–35. doi: 10.1016/j.soilbio.2013.02.014
Barton, L., Murphy, D. V., and Butterbach-Bahl, K. (2013b). Influence of crop rotation and liming on greenhouse gas emissions from a semi-arid soil. Agri. Ecosyst. Environ. 167, 23–32. doi: 10.1016/j.agee.2013.01.003
Beerling, D. J., Kantzas, E. P., Lomas, M. R., Wade, P., Eufrasio, R. M., Renforth, P., et al. (2020). Potential for large-scale CO2 removal via enhanced rock weathering with croplands. Nature 583, 242–248. doi: 10.1038/s41586-020-2448-9
Beerling, D. J., Leake, J. R., Long, S. P., Scholes, J. D., Ton, J., Nelson, P. N., et al. (2018). Farming with crops and rocks to address global climate, food and soil security. Nature Plants 4, 138–147. doi: 10.1038/s41477-018-0108-y
Bergaust, L., Mao, Y., Bakken, L. R., and Frostegård, Å. (2010). Denitrification Response Patterns during the Transition to Anoxic Respiration and Posttranscriptional Effects of Suboptimal pH on Nitrogen Oxide Reductase in Paracoccus denitrificans. Appl. Environ. Microbiol. 76, 6387–6396. doi: 10.1128/AEM.00608-10
Blanc-Betes, E., Kantola, I. B., Gomez-Casanovas, N., Hartman, M., Parton, W., Lewis, et al. (2020). In silico assessment of the potential of basalt amendments to reduce N2O emissions from bioenergy crops. GCB Bioenergy, 13, 224–241. doi: 10.1111/gcbb.12757
Buckingham, F. L., Henderson, G. M., Holdship, P., and Renforth, P. (2022). Soil core study indicates limited CO2 removal by enhanced weathering in dry croplands in the UK. Appl. Geochem. 147, 105482. doi: 10.1016/j.apgeochem.2022.105482
Butterbach-Bahl, K., Baggs, E. M., Dannenmann, M., Kiese, R., and Zechmeister-Boltenstern, S. (2013). Nitrous oxide emissions from soils: How well do we understand the processes and their controls? Philos. Trans. R. Soc. B Biol. Sci. 368(1621), 20130122. doi: 10.1098/rstb.2013.0122
Ciais, P., Sabine, C., Bala, G., Bopp, L., Brovkin, V., Canadell, J., et al. (2013). Carbon and Other Biogeochemical Cycles: Vol. The Physical Science Basis (Contribution of Working Group I to the Fifth Assessment Report of the Intergovernmental Panel on Climate Change). Cambridge: Cambridge University Press.
Davidson, E. A. (2009). The contribution of manure and fertilizer nitrogen to atmospheric nitrous oxide since 1860. Nat. Geosci. 2, 659–662. doi: 10.1038/ngeo608
Dobbie, K. E., and Smith, K. A. (2001). The effects of temperature, water-filled pore space and land use on N 2 O emissions from an imperfectly drained gleysol: factors controlling N2O emission from soil. Eur. J. Soil Sci. 52, 667–673. doi: 10.1046/j.1365-2389.2001.00395.x
Eosense (2020). Using the eosMX to Coordinate Automated Sampling from Soil Gas Wells. Eosense: Application Article. Available online at: https://eosense.com/application-article-using-the-eosmx-recirculating-multiplexer-with-manual-chambers/ (accessed June 10, 2023).
Eosense (2022). Measuring Net Ecosystem Exchange with the eosAC-LT/LO. Eosense: EosAC-LT/LO Application Article. Available online at: https://eosense.com/measuring-nee/ (accessed June 10, 2023).
Guenet, B., Gabrielle, B., Chenu, C., Arrouays, D., Balesdent, J., Bernoux, M., et al. (2021). Can N2O emissions offset the benefits from soil organic carbon storage? Glob. Chan. Biol. 27, 237–256. doi: 10.1111/gcb.15342
Hénault, C., Bourennane, H., Ayzac, A., Rati,é, C., Saby, N. P. A., Cohan, J.-P., et al. (2019). Management of soil pH promotes nitrous oxide reduction and thus mitigates soil emissions of this greenhouse gas. Scientific Reports, 9, 20182. doi: 10.1038/s41598-019-56694-3
Ho, T. K. (1995). Random decision forests. In: Proceedings of 3rd International Conference on Document Analysis and Recognition. Montreal, QC: IEEE. p. 278–282.
Huang, H., Wang, J., Hui, D., Miller, D. R., Bhattarai, S., Dennis, S., et al. (2014). Nitrous oxide emissions from a commercial cornfield (zea mays) measured using the eddy covariance technique. Atmos. Chem. Phy. 14, 12839–12854. doi: 10.5194/acp-14-12839-2014
Huddell, A., Neill, C., Maracahipes-Santos, L., Cerri, C. E. P., and Menge, D. (2021). Nitric and nitrous oxide fluxes from intensifying crop agriculture in the seasonally dry tropical Amazon–Cerrado border region. Agrosyst. Geosci. Environ. 4, e20169. doi: 10.1002/agg2.20169
IPCC (2021). Climate Change 2021: The Physical Science Basis. Contribution of Working Group I to the Sixth Assessment Report of the Intergovernmental Panel on Climate Change. Cambridge: Cambridge University Press.
Jiang, Q., Madramootoo, C. A., and Qi, Z. (2022). Soil carbon and nitrous oxide dynamics in corn (Zea mays L.) production under different nitrogen, tillage and residue management practices. Field Crops Res. 277, 108421. doi: 10.1016/j.fcr.2021.108421
Kantola, I. B., Masters, M. D., Beerling, D. J., Long, S. P., and DeLucia, E. H. (2017). Potential of global croplands and bioenergy crops for climate change mitigation through deployment for enhanced weathering. Biol. Lett. 13, 20160714. doi: 10.1098/rsbl.2016.0714
Kelland, M. E., Wade, P. W., Lewis, A. L., Taylor, L. L., Sarkar, B., Andrews, M. G., et al. (2020). Increased yield and CO2 sequestration potential with the C4 cereal Sorghum bicolor cultivated in basaltic rock dust-amended agricultural soil. Glob. Change Biol. 26, 3658–3676. doi: 10.1111/gcb.15089
Kim, S. U., Lee, H. H., Moon, S. M., Han, H. R., and Hong, C. O. (2021). Nitrous oxide emissions and maize yield as influenced by nitrogen fertilization and tillage operations in upland soil. Appl. Biol. Chem. 64, 18. doi: 10.1186/s13765-021-00593-7
Kroeze, C., Mosier, A., and Bouwman, L. (1999). Closing the global N2O budget: A retrospective analysis 1500-1994. Glob. Biogeochem. Cycles 13, 1–8. doi: 10.1029/1998GB900020
Lai, T. V., Farquharson, R., and Denton, M. D. (2019). High soil temperatures alter the rates of nitrification, denitrification and associated N2O emissions. J. Soils Sediments 19, 2176–2189. doi: 10.1007/s11368-018-02238-7
Lee, H., Calvin, K., Dasgupta, D., Krinner, G., Mukherji, A., Thorne, P., et al. (2023). AR6: Synthesis Report of the IPCC Sixth Assessment Report (Climate Change 2023). Geneva: IPCC.
Liu, B., Mørkved, P. T., Frostegård, Å., and Bakken, L. R. (2010). Denitrification gene pools, transcription and kinetics of NO, N2O and N2 production as affected by soil pH: Gene transcription, gas kinetics as affected by soil pH. FEMS Microbiol. Ecol. 72, 407–417. doi: 10.1111/j.1574-6941.2010.00856.x
Lu, C., Yu, Z., Zhang, J., Cao, P., Tian, H., and Nevison, C. (2021). Century-long changes and drivers of soil nitrous oxide (N2O) emissions across the contiguous United States. Glob. Chang. Biol. 28, 2505–2524. doi: 10.1111/gcb.16061
Maier, R., Hörtnagl, L., and Buchmann, N. (2022). Greenhouse gas fluxes (CO2, N2O and CH4) of pea and maize during two cropping seasons: Drivers, budgets, and emission factors for nitrous oxide. Sci. Total Environ. 849, 157541. doi: 10.1016/j.scitotenv.2022.157541
McGill, B. M., Hamilton, S. K., Millar, N., and Robertson, G. P. (2018). The greenhouse gas cost of agricultural intensification with groundwater irrigation in a Midwest U.S. row cropping system. Glob. Change Biol. 24, 5948–5960. doi: 10.1111/gcb.14472
Mei, K., Wang, Z., Huang, H., Zhang, C., Shang, X., Dahlgren, R. A., et al. (2018). Stimulation of N2O emission by conservation tillage management in agricultural lands: a meta-analysis. Soil Tillage Res. 182, 86–93. doi: 10.1016/j.still.2018.05.006
Myhre, G., Shindell, D., Bréon, F.-M., Collins, W., Fuglestvedt, J., Huang, J., et al. (2013). 8 Anthropogenic and Natural Radiative Forcing. Cambridge: Cambridge University Press. p. 82.
Park, S., Croteau, P., Boering, K. A., Etheridge, D. M., Ferretti, D., Fraser, P. J., et al. (2012). Trends and seasonal cycles in the isotopic composition of nitrous oxide since 1940. Nat. Geosci. 5, 261–265. doi: 10.1038/ngeo1421
Prather, M. J., Hsu, J., DeLuca, N. M., Jackman, C. H., Oman, L. D., Douglass, A. R., et al. (2015). Measuring and modeling the lifetime of nitrous oxide including its variability. J. Geophy. Res. Atmosp. 120, 5693–5705. doi: 10.1002/2015JD023267
R Core Team (2017). Using Boosted Regression Trees and Remotely Sensed Data to Drive Decision-Making. R: A Language and Environment for Statistical Computing. Available online at: https://www.R-project.org/ (accessed June 10, 2023).
Rennert, K., Errickson, F., Prest, B. C., Rennels, L., Newell, R. G., Pizer, W., et al. (2022). Comprehensive evidence implies a higher social cost of CO2. Nature. 610:687–692. doi: 10.1038/s41586-022-05224-9
Roy, A. K., Wagner-Riddle, C., Deen, B., Lauzon, J., and Bruulsema, T. (2014). Nitrogen application rate, timing and history effects on nitrous oxide emissions from corn (Zea mays L.). Can. J. Soil Sci. 94, 563–573. doi: 10.4141/cjss2013-118
Samad, M. S., Bakken, L. R., Nadeem, S., Clough, T. J., de Klein, C. A. M., Richards, K. G., et al. (2016). High-resolution denitrification kinetics in pasture soils link N2O emissions to pH, and denitrification to C mineralization. PLoS ONE 11, e0151713. doi: 10.1371/journal.pone.0151713
Sehy, U., Ruser, R., and Munch, J. C. (2003). Nitrous oxide fluxes from maize fields: Relationship to yield, site-specific fertilization, and soil conditions. Agricult. Ecosyst. Environ. 99, 97–111. doi: 10.1016/S0167-8809(03)00139-7
Shakoor, A., Shahzad, S. M., Chatterjee, N., Arif, M. S., Farooq, T. H., Altaf, M. M., et al. (2021). Nitrous oxide emission from agricultural soils: application of animal manure or biochar? A global meta-analysis. J. Environ. Manag. 285, 112170. doi: 10.1016/j.jenvman.2021.112170
Shcherbak, I., Millar, N., and Robertson, G. P. (2014). Global metaanalysis of the nonlinear response of soil nitrous oxide (N2O) emissions to fertilizer nitrogen. Proc. National Acad. Sci. 111, 9199–9204. doi: 10.1073/pnas.1322434111
Sikora, F. J. (2006). A Buffer that Mimics the SMP Buffer for Determining Lime Requirement of Soil. Soil Sci. Soc. Am. J. 70, 474–486. doi: 10.2136/sssaj2005.0164
Skiba, U., and Ball, B. (2006). The effect of soil texture and soil drainage on emissions of nitric oxide and nitrous oxide. Soil Use Manag. 18, 56–60. doi: 10.1111/j.1475-2743.2002.tb00050.x
Snider, D. M., Venkiteswaran, J. J., Schiff, S. L., and Spoelstra, J. (2015). From the ground up: global nitrous oxide sources are constrained by stable isotope values. PLoS ONE, 10, e0118954. doi: 10.1371/journal.pone.0118954
Stehfest, E., and Bouwman, L. (2006). N2O and NO emission from agricultural fields and soils under natural vegetation: Summarizing available measurement data and modeling of global annual emissions. Nutr. Cycl. Agroecosyst. 74, 207–228. doi: 10.1007/s10705-006-9000-7
Stevens, R. J., Laughlin, R. J., and Malone, J. P. (1998). Soil pH affects the processes reducing nitrate to nitrous oxide and di-nitrogen. Soil Biol. Biochem. 30, 1119–1126. doi: 10.1016/S0038-0717(97)00227-7
Su, C., Kang, R., Huang, W., and Fang, Y. (2021). Temporal patterns of N2O fluxes from a rainfed maize field in Northeast China. Front. Environ. Sci. 9, 668084. doi: 10.3389/fenvs.2021.668084
Syakila, A., and Kroeze, C. (2011). The global nitrous oxide budget revisited. Greenhouse Gas Measure. Manag. 1, 17–26. doi: 10.3763/ghgmm.2010.0007
Tebaldi, C., Debeire, K., Eyring, V., Fischer, E., Fyfe, J., Friedlingstein, P., et al. (2021). Climate model projections from the Scenario Model Intercomparison Project (ScenarioMIP) of CMIP6. Earth Syst. Dynam. 12, 253–293. doi: 10.5194/esd-12-253-2021
Tian, H., Xu, R., Canadell, J. G., Thompson, R. L., Winiwarter, W., Suntharalingam, P., et al. (2020). A comprehensive quantification of global nitrous oxide sources and sinks. Nature 586, 248–256. doi: 10.1038/s41586-020-2780-0
Vakilifard, N., Kantzas, E. P., Edwards, N. R., Holden, P. B., and Beerling, D. J. (2021). The role of enhanced rock weathering deployment with agriculture in limiting future warming and protecting coral reefs. Environ. Res. Lett. 16, 094005. doi: 10.1088/1748-9326/ac1818
Val Martin, M., Blanc-Betes, E., Fung, K. M., Kantzas, E. P., Kantola, I. B., Chiaravalloti, I., et al. (2023). Improving nitrogen cycling in a land surface model (CLM5) to quantify soil N2O, NO and NH3 emissions from enhanced rock weathering with croplands. Geosci. Model Dev. Discuss. 1–32. doi: 10.5194/gmd-2023-47
Vangeli, S., Posse, G., Beget, M. E., Otero Estrada, E., Valdettaro, R. A., Oricchio, P., et al. (2022). Effects of fertilizer type on nitrous oxide emission and ammonia volatilization in wheat and maize crops. Soil Use Manag. 38, 1519–1531. doi: 10.1111/sum.12788
Vázquez, E., Teutscherova, N., Pastorelli, R., Lagomarsino, A., Giagnoni, L., and Renella, G. (2020). Liming reduces N2O emissions from Mediterranean soil after-rewetting and affects the size, structure and transcription of microbial communities. Soil Biol. Biochem. 147, 107839. doi: 10.1016/j.soilbio.2020.107839
Williams, J., and Crutzen, P. J. (2010). Nitrous oxide from aquaculture. Nature Geosci. 3, 143–143. doi: 10.1038/ngeo804
Wright, M. N., and Ziegler, A. (2017). ranger: a fast implementation of random forests for high dimensional data in C++ and R. J. Stat. Softw. 77, 1–17. doi: 10.18637/jss.v077.i01
Xia, Y., Kwon, H., and Wander, M. (2021). Developing county-level data of nitrogen fertilizer and manure inputs for corn production in the United States. J. Cleaner Prod. 309, 126957. doi: 10.1016/j.jclepro.2021.126957
Zaehle, S., Ciais, P., Friend, A. D., and Prieur, V. (2011). Carbon benefits of anthropogenic reactive nitrogen offset by nitrous oxide emissions. Nat. Geosci. 4, 601–605. doi: 10.1038/ngeo1207
Zhang, G., Kang, J., Wang, T., and Zhu, C. (2018). Review and outlook for agromineral research in agriculture and climate mitigation. Soil Res. 56, 113. doi: 10.1071/SR17157
Zhang, S., Planavsky, N. J., Katchinoff, J., Raymond, P. A., Kanzaki, Y., Reershemius, T., et al. (2022). River chemistry constraints on the carbon capture potential of surficial enhanced rock weathering. Limnol. Oceanography, 67. doi: 10.1002/lno.12244
Keywords: basalt, maize, nitrous oxide, enhanced silicate weathering, agriculture
Citation: Chiaravalloti I, Theunissen N, Zhang S, Wang J, Sun F, Ahmed AA, Pihlap E, Reinhard CT and Planavsky NJ (2023) Mitigation of soil nitrous oxide emissions during maize production with basalt amendments. Front. Clim. 5:1203043. doi: 10.3389/fclim.2023.1203043
Received: 10 April 2023; Accepted: 07 June 2023;
Published: 22 June 2023.
Edited by:
Claudete Gindri, Costa University Corporation, ColombiaReviewed by:
Alcindo Neckel, Faculdade Meridional (IMED), BrazilBinoy K. Saikia, North East Institute of Science and Technology (CSIR), India
Copyright © 2023 Chiaravalloti, Theunissen, Zhang, Wang, Sun, Ahmed, Pihlap, Reinhard and Planavsky. This is an open-access article distributed under the terms of the Creative Commons Attribution License (CC BY). The use, distribution or reproduction in other forums is permitted, provided the original author(s) and the copyright owner(s) are credited and that the original publication in this journal is cited, in accordance with accepted academic practice. No use, distribution or reproduction is permitted which does not comply with these terms.
*Correspondence: Isabella Chiaravalloti, aXNhYmVsbGEuY2hpYXJhdmFsbG90aUB5YWxlLmVkdQ==