 Joël Arnault1,2*
 Anthony Musili Mwanthi3,4
 Tanja Portele2
 Lu Li5Thomas Rummler1
 Benjamin Fersch2Mohammed Abdullahi Hassan4Titike Kassa Bahaga4Zhenyu Zhang1,2
 Eric Mensah Mortey6,7
 Ifeany Chukwudi Achugbu8,9
 Hassane Moutahir2
 Souleymane Sy1
 Jianhui Wei2
 Patrick Laux2
 Stefan Sobolowski5Harald Kunstmann1,2
- 1Institute of Geography, University of Augsburg, Augsburg, Germany
- 2Institute of Meteorology and Climate Research, Karlsruhe Institute of Technology, Garmisch-Partenkirchen, Germany
- 3University of Nairobi, Nairobi, Kenya
- 4Intergovernmental Authority on Development (IGAD) Climate Prediction and Applications Center, Nairobi, Kenya
- 5Norwegian Research Center (NORCE), Bjerknes Centre for Climate Research, Bergen, Norway
- 6West African Science Service Center on Climate Change and Adapted Land Use (WASCAL), Université Abdou Moumouni, Niamey, Niger
- 7Earth Observation Research and Innovation Centre, University of Energy and Natural Resources, Sunyani, Ghana
- 8Department of Water Resources Management and Agrometeorology, Federal University Oye-Ekiti, Oye-Ekiti, Nigeria
- 9WASCAL, Federal University of Technology Akure, Akure, Nigeria
Afforestation as a climate change mitigation option has been the subject of intense debate and study over the last few decades, particularly in the tropics where agricultural activity is expanding. However, the impact of such landcover changes on the surface energy budget, temperature, and precipitation remains unclear as feedbacks between various components are difficult to resolve and interpret. Contributing to this scientific debate, regional climate models of varying complexity can be used to test how regional climate reacts to afforestation. In this study, the focus is on the gauged Nzoia basin (12,700 km2) located in a heavily farmed region of tropical Africa. A reanalysis product is dynamically downscaled with a coupled atmospheric-hydrological model (WRF-Hydro) to finely resolve the land-atmosphere system in the Nzoia region. To overcome the problem of Nzoia river flooding over its banks we enhance WRF-Hydro with an overbank flow routing option, which improves the representation of daily discharge based on the Nash-Sutcliffe efficiency and Kling-Gupta efficiency (from −2.69 to 0.30, and −0.36 to 0.63, respectively). Changing grassland and cropland areas to savannas, woody savannas, and evergreen broadleaf forest in three synthetic numerical experiments allows the assessment of potential regional climate impacts of three afforestation strategies. In all three cases, the afforestation-induced decrease in soil evaporation is larger than the afforestation-induced increase in plant transpiration, thus increasing sensible heat flux and triggering a localized negative feedback process leading to more precipitation and more runoff. This effect is more pronounced with the woody savannas experiment, with 7% less evapotranspiration, but 13% more precipitation, 8% more surface runoff, and 12% more underground runoff predicted in the Nzoia basin. This study demonstrates a potentially large impact of afforestation on regional water resources, which should be investigated in more detail for policy making purposes.
1. Introduction
The intertwined relationship between landcover change and climate change is well recognized but highly complex and not fully understood (e.g., Dale, 1997; Pielke et al., 2011; de Noblet-Ducoudré et al., 2012; Bright et al., 2017; Lejeune et al., 2017, 2018; Duveiller et al., 2018; Davin et al., 2020; Sy and Quesada, 2020; Achugbu et al., 2023; Breil et al., 2023; Liu et al., 2023; Mortey et al., 2023; Mwanthi et al., 2023; Smiatek and Kunstmann, 2023; Wang et al., 2023). According to Duveiller et al. (2018), the agricultural expansion in the tropics has intensified global warming, an effect which could be mitigated locally with an afforestation policy. Such agricultural expansion also has a local effect on the availability of water resources, as shown for example by Githui et al. (2010) for the Nzoia basin in tropical Africa.
A better understanding of how changes to landcover modify climate at the regional scale is crucial for developing and assessing climate change mitigation strategies (e.g., Wulfmeyer et al., 2014; Harper et al., 2018; Roe et al., 2019; Duveiller et al., 2020). For afforestation, besides a greater carbon sequestration potential, local temperature changes would be dominated by two competing processes that are enhanced evaporative cooling and enhanced radiative heating due to a lower albedo (Bonan, 2008). As pointed out by Breil et al. (2021), the evaporative cooling effect triggered by afforestation is also modulated by the saturation deficit of the near-surface atmosphere, which adds additional complexity to afforestation effects on temperature. Wulfmeyer et al. (2014), Liu et al. (2023), and Wang et al. (2023) brought evidence that afforestation in an arid region can trigger more precipitation, although enhanced precipitation can be associated with deforestation as well (Achugbu et al., 2023).
Land-atmosphere processes are represented in a simplified manner in regional climate models, which allow investigating the climatic response to afforestation at a regional scale (Davin et al., 2020). However, this modeling approach is hindered by large uncertainties in the numerical results that likely arise from the simplifying assumptions that are among its assets (e.g., de Noblet-Ducoudré et al., 2012; Lejeune et al., 2017; Davin et al., 2020). In the case of a model ensemble experiment for Europe, Davin et al. (2020) could not identify a robust temperature change related to afforestation. The effect of landcover change on precipitation in such numerical experiments is even more uncertain with low signal-to-noise ratios (e.g., Laux et al., 2017). These model uncertainties could be partly alleviated by improving the realism of the physical processes included in the model itself (de Noblet-Ducoudré et al., 2012).
Regional climate models' representation of land-atmosphere interactions is usually limited to a vertical transfer of energy and water at the land-atmosphere interface. This is a crude approximation of terrestrial hydrology at the river basin scale. Studies with coupled atmospheric-hydrological models, such as with the hydrologically enhanced Weather Research and Forecasting model WRF-Hydro (Gochis et al., 2020), have shown that the consideration of surface and subsurface lateral flow improves the simulated runoff and modifies the atmospheric branch of the simulated water cycle, with generally more evapotranspiration and more precipitation (e.g., Rummler et al., 2019; Zhang et al., 2019; Fersch et al., 2020; Arnault et al., 2021; Furnari et al., 2022).
Applying the uncoupled version of the WRF-Hydro hydrological model, Achugbu et al. (2022) investigated the impact of landcover change scenarios on evapotranspiration and runoff in a Sahelian West African river basin. Achugbu et al. (2022) confirmed that the increase of evapotranspiration associated with afforestation leads to a decrease in river discharge.
In another hydrological model experiment on landcover change for the Nzoia basin in tropical Africa, Githui et al. (2010) attributed the runoff increase between 1973 and 2001 to an increase of agricultural area and a reduction of forested area. However, the uncoupled hydrological modeling approach does not account for potential feedbacks between the terrestrial hydrological system and the overlying atmosphere, especially for precipitation. As such, the landcover change effect on climate is only partially addressed in such uncoupled model studies (Githui et al., 2010).
A more comprehensive effect of landcover change on both the terrestrial and atmospheric branches of the water cycle can in principle be evaluated with the atmospheric-hydrological coupled version of WRF-Hydro, although no such study is known to us so far. Our study therefore aims at presenting the first landcover change experiment with the coupled WRF-Hydro, exemplarily investigated for the hypothetical case of afforestation in the Nzoia basin. The choice of the study region is motivated by (1) its location in the tropics, (2) an expanding agricultural area which raises the question of the potential benefits of an afforestation policy, and (3) the availability of river discharge data to assess the ability of the model to represent water resources in this region. The objective of the study is to evaluate, from a coupled atmospheric-hydrological modeling point of view, whether a climate change mitigation policy such as afforestation in a tropical region would be hydrologically significant, particularly in terms of precipitation and river discharge.
In the following, Section 2 details the study region and available datasets, the WRF-Hydro model, a model extension to account for overbank flow, the calibration and evaluation strategy and the landcover change experiments. The results are discussed in Section 3, and concluding remarks are finally given in Section 4.
2. Materials and method
2.1. Study region and datasets
The Nzoia basin is situated in the tropical zone at the northeastern edge of Lake Victoria in western Kenya, as shown in Figure 1. It covers an area of about 12,700 km2 with altitudes ranging from 1,140 m.a.s.l in the lower plains near Lake Victoria to 4,300 m.a.s.l in the northern mountainous areas. The precipitation regime in the region is trimodal, with precipitation peaks in April-May, in August, and in October, and with annual precipitations varying from around 1,000 mm in the lowlands to above 2,000 mm in the highlands (Githui et al., 2010). More than half of the Nzoia basin is covered by agricultural areas, which leads to over-exploitation of resources and land degradation to fulfill the growing food demand of increasing population (Githui et al., 2010).
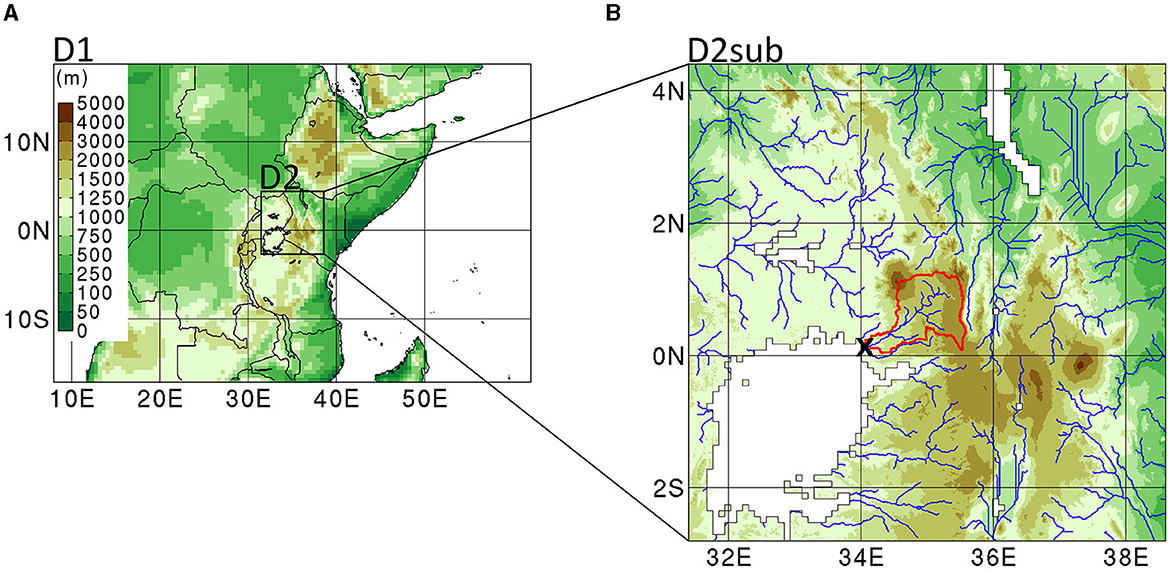
Figure 1. Topography (in m above sea level) of (A) the outer and inner domains D1 and D2 at 50 and 10 km resolution, respectively, and (B) the sub-domain D2sub at 1 km resolution coupled with D2 for water routing computations. The black rectangle in (A) gives the location of D2. The red contour line, blue curved lines, and black cross in (B) give the locations of the Nzoia basin, main rivers, and outlet gauge station 1EEF01, respectively. The topography color scale provided by the color bar on the left side of (A) is the same for both panels.
The climatic characteristics in the Nzoia basin are evaluated with gridded observational products of precipitation, temperature, energy fluxes, and discharge data. The Integrated Multi-satellitE Retrievals for Global precipitation measurement dataset (IMERG; Huffman et al., 2014) is a near-global and daily product, provided on a regular grid with a 0.1° horizontal resolution and available for the period 2001–2020. The Climate Research Unit temperature dataset (CRU; Harris et al., 2014) is a global and monthly product provided on a regular grid with a 0.5° horizontal resolution and available for the period 2001–2020. The energy fluxes dataset from the machine-learning based initiative to upscale biosphere-atmosphere fluxes from FLUXNET sites to continental and global scales (FLUXCOM; Jung et al., 2019) is a global and monthly product provided on a regular grid with a 0.5° horizontal resolution and available for the period 2001–2013 for FLUXCOM. The discharge data comes from the gauge station 1EEF01 located at the basin outlet (0.124°N, 34.090°E), as displayed in Figure 1B, and was provided by the Water Resource Authority of Kenya as a daily timeseries for the period 2009–2017.
2.2. Coupled WRF-Hydro modeling setup
The regional climate model WRF-Hydro selected for this study is based on version 4.4 of the Weather Research and Forecasting model (WRF; Skamarock et al., 2019) coupled with the version 5.2 of the WRF-Hydro hydrological module (Gochis et al., 2020). WRF-Hydro resolves the equations of atmospheric motion on a three-dimensional grid over a limited area, with a set of parameterization options to represent subgrid scale physical processes, such as radiation, turbulence, cumulus convection, cloud microphysics, and terrestrial hydrology. The two model domains shown in Figure 1 are selected for this study. The outer domain covers most of East Africa with an area of 4,000 km × 6,000 km at 50 km resolution and 50 vertical levels up to 10 hPa. The initial condition and lateral boundaries of the outer domain are constrained by the air pressure, geopotential, zonal and meridional winds, temperature and water vapor provided by the ERA5 reanalysis (Hersbach et al., 2020) on pressure levels at a six-hourly interval, with a 0.25° resolution. The inner domain, which encompasses the study region with an area of 800 km × 800 km at 10 km resolution and the 50 vertical levels, is driven by the outer domain using a one-way nesting method. The equations of atmospheric motions in the outer and inner domains are resolved at 180 s and 60 s timesteps, respectively, to ensure numerical stability.
The outer and inner domains share the following physics parameterization setup: the long-wave and short-wave radiation schemes of Dudhia (1989) and Mlawer et al. (1997), the Mellor-Yamada-Nakanishi-Niino Level-2.5 version turbulence scheme of Nakanishi and Niino (2004), the cumulus convection scheme of Grell and Freitas (2014), the six-class microphysics scheme of Hong and Lim (2006), and the community Noah land surface model with multi-parameterization options of Niu et al. (2011) referred to as Noah-MP. This choice of physics parameterization is motivated by its relatively good performance in terms of basin-average daily precipitation for the Nzoia basin during the period chosen for discharge calibration, with a correlation coefficient of 0.74 and a percentage bias of 7 %, as displayed in Figure 2A. Additionally, the inner domain includes lateral terrestrial flow with the WRF-Hydro hydrological module (Gochis et al., 2020).
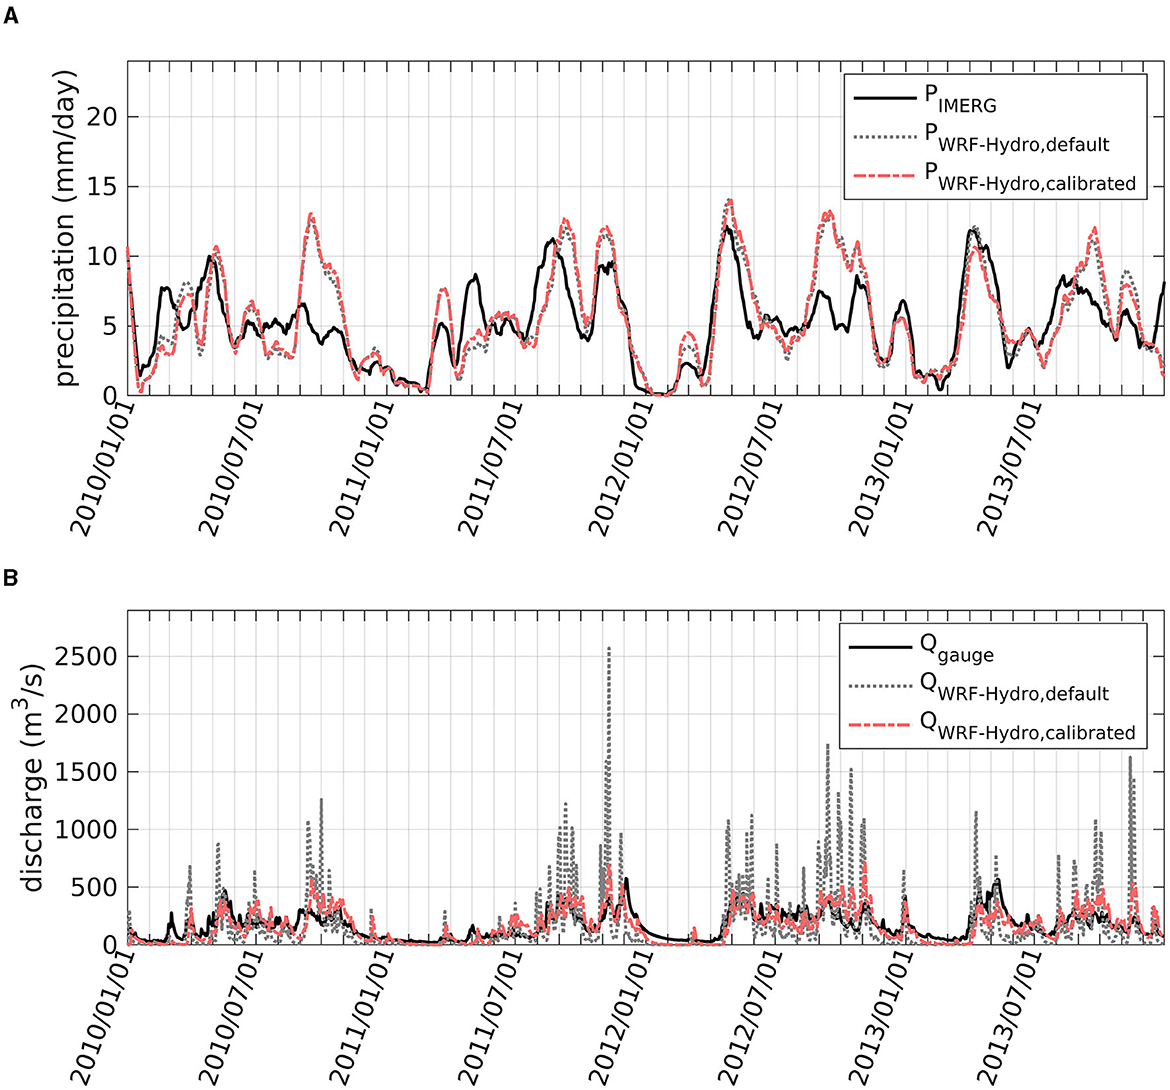
Figure 2. (A) Daily timeseries of Nzoia basin-averaged precipitation P (in mm/day) for a four-year period spanning from 1st January 2010 to 31st December 2013 and filtered with a 30-day Gaussian filter, as derived from the observational product IMERG and from the inner domain of the default and calibrated WRF-Hydro simulations. (B) Daily timeseries of discharge Q (in m3/s) at the Nzoia basin outlet for a four-year period spanning from 1st January 2010 to 31st December 2013, as derived from the gauge measurement and from the default and calibrated WRF-Hydro simulations. The calibrated simulation employs the modified WRF-Hydro source code presented in Section 2.3 with the best set of parameters values according to the calibration exercise illustrated in Figure 3, that is (Hthres = 6 m, S = 0.01, M045).
Noah-MP is the land surface module in WRF-Hydro and describes the fate of snow cover, vegetation canopy, and soil moisture within a soil column of 2-m depth divided into four layers, to update the upward energy and water vapor fluxes at the lower boundary of the modeled atmosphere. The upward water vapor flux provided by Noah-MP is divided into five components that are the snow sublimation, the intercepted canopy water evaporation, the plant transpiration, the soil water evaporation below the canopy, and the soil water evaporation outside the canopy. Moreover, the plant stomatal resistance is calculated according to the Ball-Berry option (Eq. B1 in Niu et al., 2011) and the leaf area index is derived from a leaf dynamics model (Eq. 10 in Niu et al., 2011). The parameters used in these equations, such as, among others, root zone depth, carboxylation rate, leaf reflectance, leaf transmittance, leaf turnover, leaf stress death coefficient and leaf maintenance respiration, are prescribed as a function of landcover classes from the moderate resolution imaging spectroradiometer (MODIS) landcover map (Friedl et al., 2002). The soil hydraulic parameters are prescribed as a function of soil classes from the State Soil Geographic/Food and Agriculture Organization soil database (FAO, 1991). The initial condition of the land surface state is deduced from the ERA5 reanalysis.
The WRF-Hydro routing modules are activated for the inner domain through a coupling between the inner domain grid at 10 km resolution and the subgrid at 1 km resolution displayed in Figure 1B, generated with the WRF-Hydro Pre-processing Tool and the digital elevation data from the hydrological data and maps based on Shuttle Elevation Derivatives at Multiple Scales (HydroSHEDS) database (Lehner et al., 2008). At each time step, the surface water and soil moisture variables from Noah-MP are disaggregated on the subgrid, routed overland, in the subsurface, and in the river channels according to diffusive wave formulations detailed in Gochis et al. (2020), and aggregated back to the Noah-MP grid. The disaggregation between the coarse grid and fine subgrid is obtained with a so-called disaggregation factor, which is defined for each variable as the ratio between the variable value on the fine subgrid and its corresponding value on the coarse grid and is updated at the end of each time step (Gochis et al., 2020). The aggregation is done as a linear averaging, so that the soil moisture field on the coarse grid is updated with the averaged effect of terrestrial water transport resolved on the fine subgrid. This fully coupled formulation allows for a comprehensive description of the water cycle at basin scale.
As in the WRF-Hydro setup of Arnault et al. (2016) for a West African Sahelian river basin, no groundwater bucket option is considered, because the baseflow produced with this approach would bring more water into the stream compared to what is observed. The groundwater bucket option being disabled, the water percolating below the 2-m soil column is considered as pure groundwater recharge, which can be calibrated with the so-called SLOPE parameter (e.g., Rummler et al., 2019) referred to as the percolation parameter S.
2.3. Two-way land–river water flow model extension
A WRF-Hydro simulation using the setup detailed in section 2.2 with default parameters produces too high daily discharge peaks according to gauge observation, as displayed in Figure 2B, with a Nash-Sutcliffe efficiency (NSE, Nash and Sutcliffe, 1970) of −2.68 and a percentage bias of −5%. Furthermore, the ratio of total discharge to the total volume of precipitation is 23% according to the observational data, and 20% according to the simulation. This shows that the total amount of discharge obtained with the default WRF-Hydro setup is approximately well calibrated, although the surface runoff generation occurs too quickly.
The usual approach to improve the WRF-Hydro simulated discharge is to calibrate the most sensitive parameters, such as the percolation parameter, the runoff-infiltration parameter, the lateral hydraulic conductivity factor, the overland roughness factor, the retention depth factor, and the river roughness Manning coefficients (Senatore et al., 2015; Rummler et al., 2019; Zhang et al., 2019; Camera et al., 2020; Fersch et al., 2020; Gochis et al., 2020; Li et al., 2020). However, the preliminary sensitivity experiments summarized in Table 1 show that the tuning of these parameters keeps on producing the high discharge peaks characterized by a negative NSE. These unrealistically high discharge peaks can be only minorly improved at the expense of larger underestimation of the total discharge. This suggests a process is missing in WRF-Hydro to slow down the simulated runoff generation in the case of the Nzoia basin.
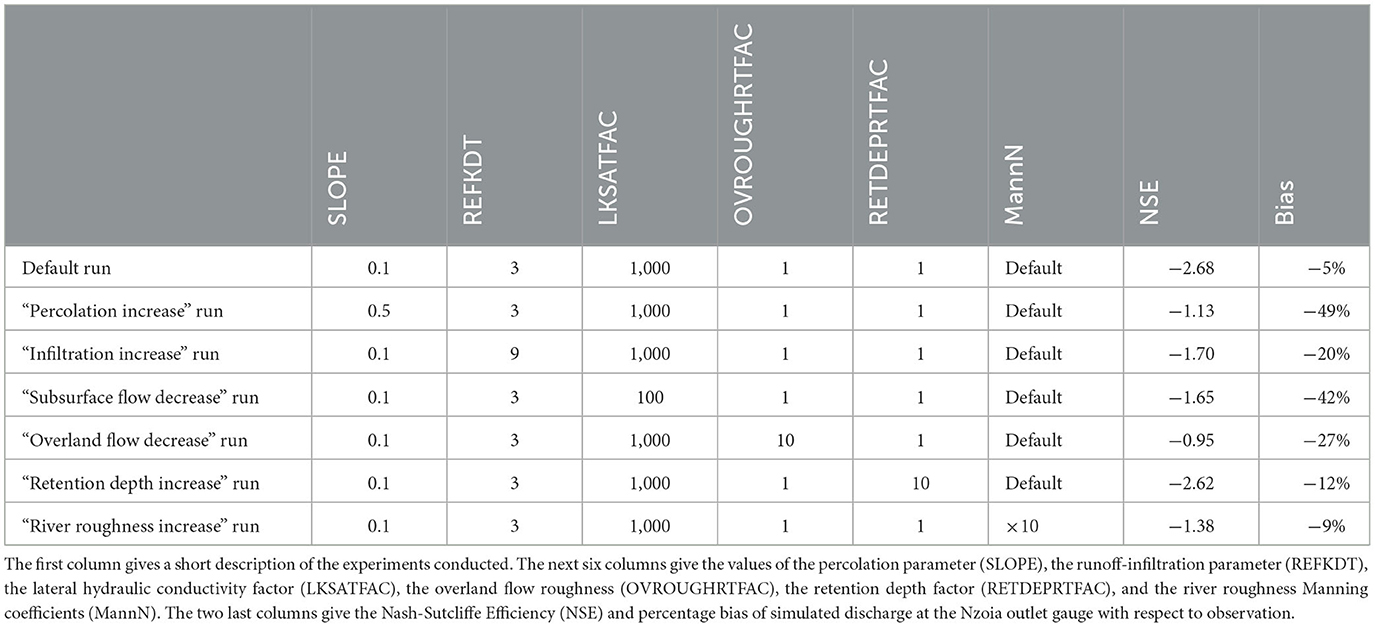
Table 1. List of model parameter sets employed in a series of preliminary experiments with the WRF-Hydro setup of section 2.2, and their corresponding Nzoia discharge results for a 4-year simulation period beginning on 1st January 2010.
As mentioned by Onencan et al. (2016), the Nzoia basin is prone to floods as the river flow pushes over its banks. Such an overbank flow is not considered in WRF-Hydro, which could be a reason for the much smoother observed discharge peaks compared to the simulated ones in Figure 2B. In order to circumvent this issue, the WRF-Hydro source code has been updated with an overbank flow option to allow for water flow between land and river in a two-way manner. In default WRF-Hydro, the surface water enters a channel if it exceeds the retention depth and never comes back to the land (Gochis et al., 2020). With the overbank flow option, a new parameter, referred to as the overbank flow parameter Hthres in meters, is introduced. When the water head in a channel pixel exceeds Hthres, then it does not receive the water flow originating from the upstream channel pixel, and this upper channel pixel water flow is moved toward the land surface instead.
To achieve this in a numerically balanced manner, the upstream channel pixel water flow calculated in the channel flow module is saved at each time step in an additional model variable. In the overland flow routing module, when the river head exceeds Hthres, the upstream channel pixel water flow is added to the surface water and removed from the channel inflow. In this numerical framework the channel inflow can be negative due to the removed water from the channel which has been brought back to the land. However, since this overbank flow process occurs only when the channel pixel is completely filled with water, that is with a water head of Hthres, this additional process intrinsically cannot generate negative streamflow in the channels. As shown in Figures 2B, 3 the tuning of Hthres results in a clear improvement of the simulated discharge results, which is detailed in the following sections.
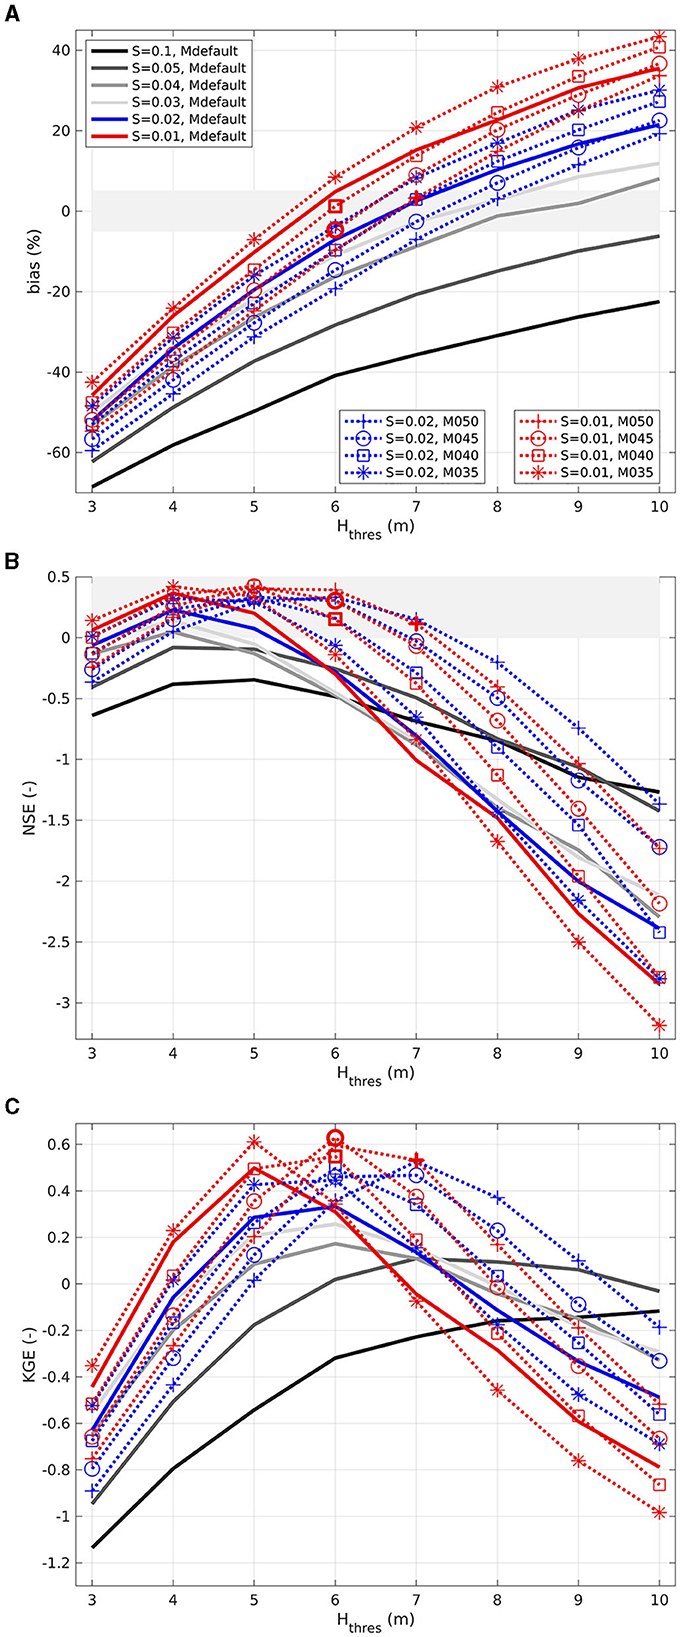
Figure 3. Performance of the simulated discharge at the Nzoia river gauge location with the WRF-Hydro setup of Sections 2.2 and 2.3, in terms of (A) percentage bias, (B) Nash-Sutcliffe efficiency NSE and (C) Kling-Gupta efficiency KGE, as a function of the overbank flow parameter Hthres (in m) on the x-axis, percolation parameter S (–) with the colored lines, and river roughness Manning coefficients M (–) of Table 2 with the plain lines and symbolled dashed lines. The three configurations with a bias lower than +/– 5 % and a positive NSC, namely the configurations using (Hthres = 6 m, S = 0.01, M040), (Hthres = 6 m, S = 0.01, M045), and (Hthres = 7 m, S = 0.01, M050), are highlighted with bolded symbols. KGE in (C) is calculated with a bias scaling factor set to 3 (see Section 2.4) to favor the less biased good result, in this case with (Hthres = 6 m, S = 0.01, M045).
2.4. River discharge calibration strategy
A four-year period, beginning on 1st January 2010, is chosen for the calibration of the WRF-Hydro discharge, using the setup of Section 2.2 enhanced with the overbank flow option of Section 2.3. This period is considered to be long enough to obtain robust calibration results with WRF-Hydro. No spin-up period is considered as no apparent spurious effects were detected at the beginning of the simulation, such as a spurious discharge peak that would be triggered by a too wet initial soil condition for example, as demonstrated by the daily timeseries shown in Figure 2. It is emphasized that the basin-averaged daily timeseries of precipitation simulated by WRF-Hydro is remarkably close to the IMERG observational dataset in Figure 2A, which justifies the suitability of this coupled setup for discharge calibration.
The simulated discharge is calibrated manually by tuning three sensitive parameters, namely the percolation parameter S, the overbank flow parameter Hthres, and the river roughness Manning coefficients. The reason behind this calibration strategy is that reducing Hthres smooths the discharge peaks but also removes too much water from the channels, which can be corrected by decreasing S to partially seal the soil column bottom and force more water to exfiltrate back to the surface. Reducing the Manning coefficients also tends to reduce water accumulation in the streams so that Hthres is less often reached, thus allowing to further modulate the overbank flow effect. The channel network displayed in Figure 1B has five stream orders in the Nzoia basin, which means that five Manning coefficients need to be calibrated in this case, as shown in Table 2.
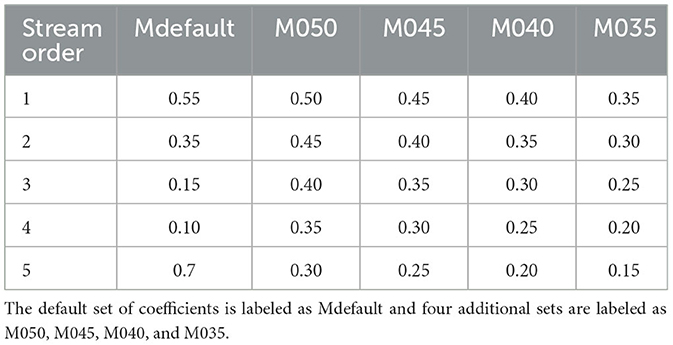
Table 2. List of river roughness Manning coefficients as a function of stream order tested in the WRF-Hydro calibration experiment of Section 2.4.
For this calibration exercise the four-year WRF-Hydro simulation is run 8 × 6 = 48 times for all combinations among eight Hthres values (3, 4, 5, 6, 7, 8, 9, 10, in meters) and six S values (0.1, 0.05, 0.04, 0.03, 0.02, 0.01) with the default Manning coefficients Mdefault given in Table 2. Additionally, 8 × 2 × 4 = 64 runs are conducted for all combinations among the eight Hthres values, two S values (0.02, 0.01), and four sets of Manning coefficients M050, M045, M040, M035 given in Table 2. This makes a total of 112 calibration runs to identify a robust set of parameters' values for the Nzoia river discharge simulation with the WRF-Hydro setup of Sections 2.2 and 2.3.
The simulated discharge timeseries are assessed with three skill scores: the percentage bias, the Nash-Sutcliffe efficiency (NSE, Nash and Sutcliffe, 1970), and the Kling-Gupta efficiency (KGE, Gupta et al., 2009), as shown in Figure 3 and discussed in Section 3.1, with the best discharge result being displayed in Figure 2B. In this study the KGE formulation employs a bias scaling factor sβ set to 3 (see Eq. 11 of Gupta et al., 2009) to enhance the discrimination of biased results.
2.5. Landcover change numerical experiment strategy
To conduct afforestation experiments for the Nzoia basin with WRF-Hydro, the calibrated WRF-Hydro from section 2.4 is used to generate a reference 20-year simulation from 1st January 2001. The realism of the reference result is evaluated with the observational datasets presented in Section 2.1, as displayed in Figures 4–6 and discussed in Section 3.2. This evaluation is important to assess to which extent the model is suitable for a landcover change numerical experiment (de Noblet-Ducoudré et al., 2012; Sy et al., 2017).
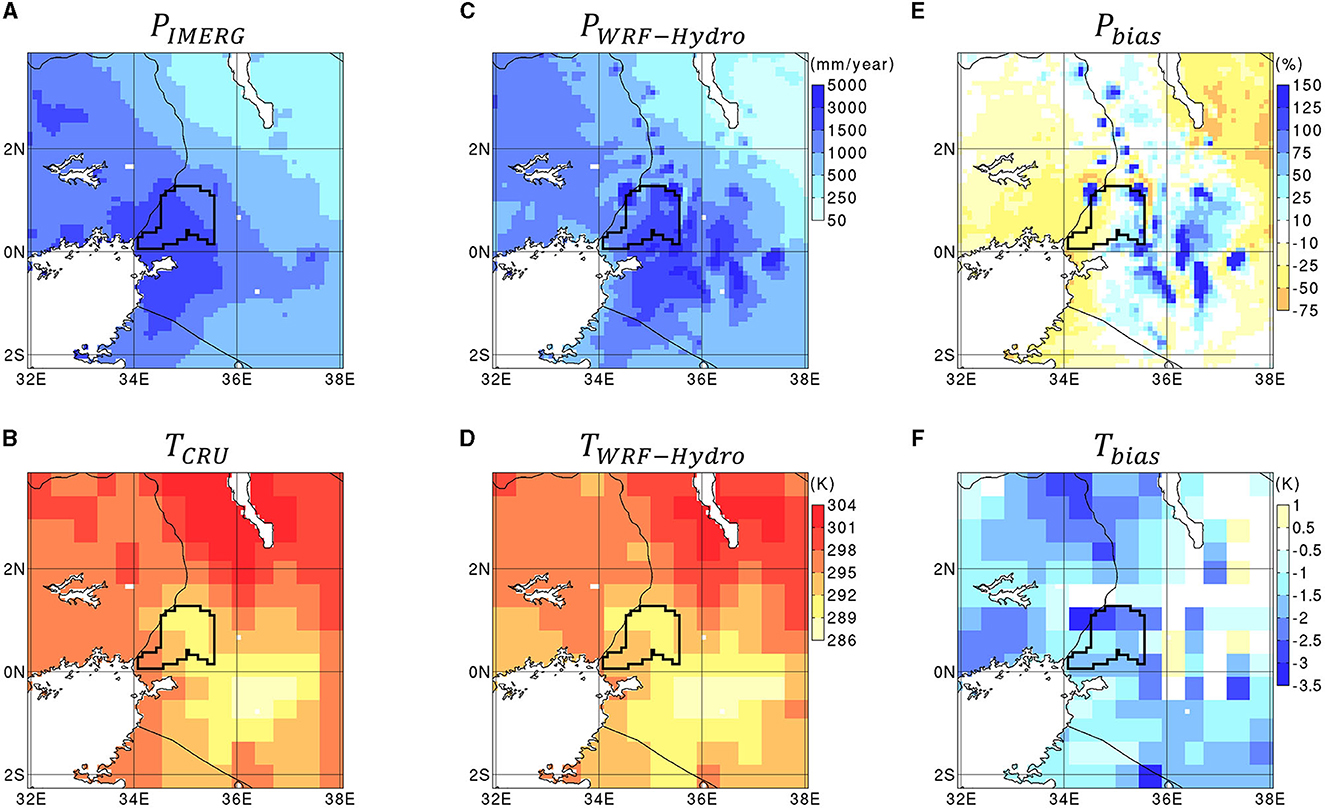
Figure 4. Maps of (A) annual precipitation P (in mm/year) from the observational product IMERG, (B) mean temperature T (in K) from the observational product CRU, (C, D) annual precipitation and mean temperature from the inner domain of the WRF-Hydro reference simulation, (E) precipitation bias (in %) between IMERG and WRF-Hydro reference, and (F) temperature bias (in K) between CRU and WRF-Hydro reference. Mean values are calculated for a 20-year period spanning from 1st January 2001 to 31st December 2020. The annual precipitation maps (A, C) have the same color scale indicated by the color bar on the right side of (C), and the mean temperature maps (B, D) also have the same color scale indicated by the color bar on the right side of (D).
The default landcover map considered in the reference simulation, which is displayed in Figure 7A, is modified in a synthetic manner according to three extreme afforestation scenarios. All grasslands and croplands areas in the Nzoia basin, which represents about 54% of the basin area, are replaced with a more natural vegetation category: savannas in scenario 1 (Figure 7B), woody savannas in scenario 2 (Figure 7C), and evergreen broadleaf forest in scenario 3 (Figure 7D). The 20-year simulation is reconducted for each of these three scenarios, and the differential results with respect to the reference are displayed in Figures 8–11, Table 3, and discussed in Section 3.3. The robustness of the areal climate change signal induced by the afforestation scenarios is assessed in a bootstrap approach by calculating for each model pixel the percentage of 17-year subset mean differences, among the 1,140 possible 17-year subset combinations out of the 20 simulated years, that have the same sign as the 20-year mean difference. The areal climate change signal is considered to be robust at the model pixels where this percentage exceeds 90%. The choice of 17 years for the subset size is motivated by the fact it is the highest subset size allowing to generate more than one thousand combinations.
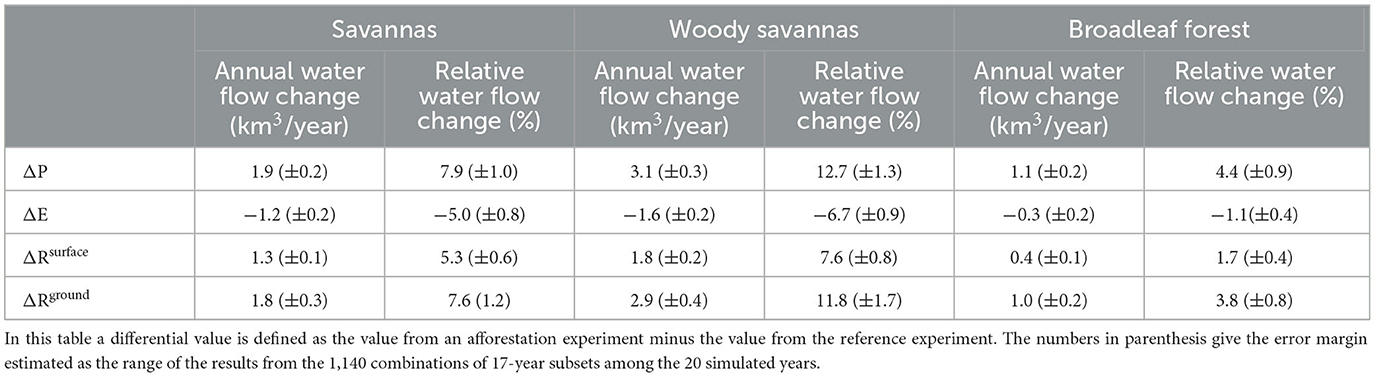
Table 3. Simulated annual water flow changes in km3/year, and relative annual water flow changes as a percentage of the reference annual precipitation, induced by afforestation type for precipitation ΔP, total evapotranspiration ΔE, surface runoff ΔRsurface, underground runoff ΔRground, as derived from the differences between the reference WRF-Hydro simulation and the savannas, woody savannas, evergreen broadleaf forest WRF-Hydro simulations during the period spanning from 1st January 2001 to 31st December 2020.
The result of these extreme and purely synthetic afforestation experiments aims at giving an indication of the largest climatic impact that could be expected with an afforestation policy in the region of the Nzoia basin in tropical Africa, and to which extent this climatic impact depends on the vegetation cover type.
3. Results and discussion
3.1. Calibrated discharge
The results of the three skill scores in terms of percentage bias (Figure 3A), NSE (Figure 3B), and KGE (Figure 3C) from the experimental discharge simulations of 2010–2013 are summarized in Figure 3. Figure 3A confirms that reducing S (Hthres) increases (reduces) discharge. With the tested sets of Manning coefficients M050, M045, M040, and M035 (see Table 2), it also appears that discharge increases with decreasing river roughness, thus reducing the river-emptying effect of overbank flow. According to the NSE in Figure 3B, the best-simulated discharge performances are generally obtained for the configurations with a pronounced dry bias, such as for example with the four following parameters values sets (S = 0.01, Hthres = 4 m, M035), (S = 0.01, Hthres = 5 m, M040), (S = 0.01, Hthres = 5 m, M045), (S = 0.01, Hthres = 6 m, M050), with NSEs of 0.42, 0.42, 0.42, 0.39, respectively, and with biases of −24, −15, −20, −10%, respectively.
To distinguish the least biased best-performing configuration, a KGE formulation with an enhanced bias scaling factor is considered in Figure 3C. Accordingly, the best KGE is obtained for (Hthres = 6, S = 0.01, M045), with an NSE of 0.30 and a bias of −5%, as displayed in Figure 2B, so that (Hthres = 6, S = 0.01, M045) is the retained set of parameters values for the 20-year WRF-Hydro simulations presented in the following sections.
It is noted that an NSE of 0.30 remains relatively weak, but lies in the range of published discharge performances with WRF-Hydro for various river basins in the world (e.g., Senatore et al., 2015; Arnault et al., 2016, 2018; Kerandi et al., 2017; Rummler et al., 2019; Zhang et al., 2019; Camera et al., 2020; Fersch et al., 2020; Li et al., 2020; Sofokleous et al., 2023). As highlighted by Senatore et al. (2015), simulated discharge performance with WRF-Hydro is intrinsically limited by the quality of simulated precipitation, which is a drawback of the atmospheric-hydrological coupled modeling approach. Still, the WRF-Hydro results over the calibration period are realistic (Figure 2), which gives us confidence that the climate response to landcover change will be plausible.
3.2. Climatology evaluation
Climatological results for the period 2001–2020 are evaluated with maps of annual precipitation and mean temperature in Figure 4, with maps of mean energy fluxes in Figure 5, and with mean monthly timeseries for the Nzoia basin in Figure 6.
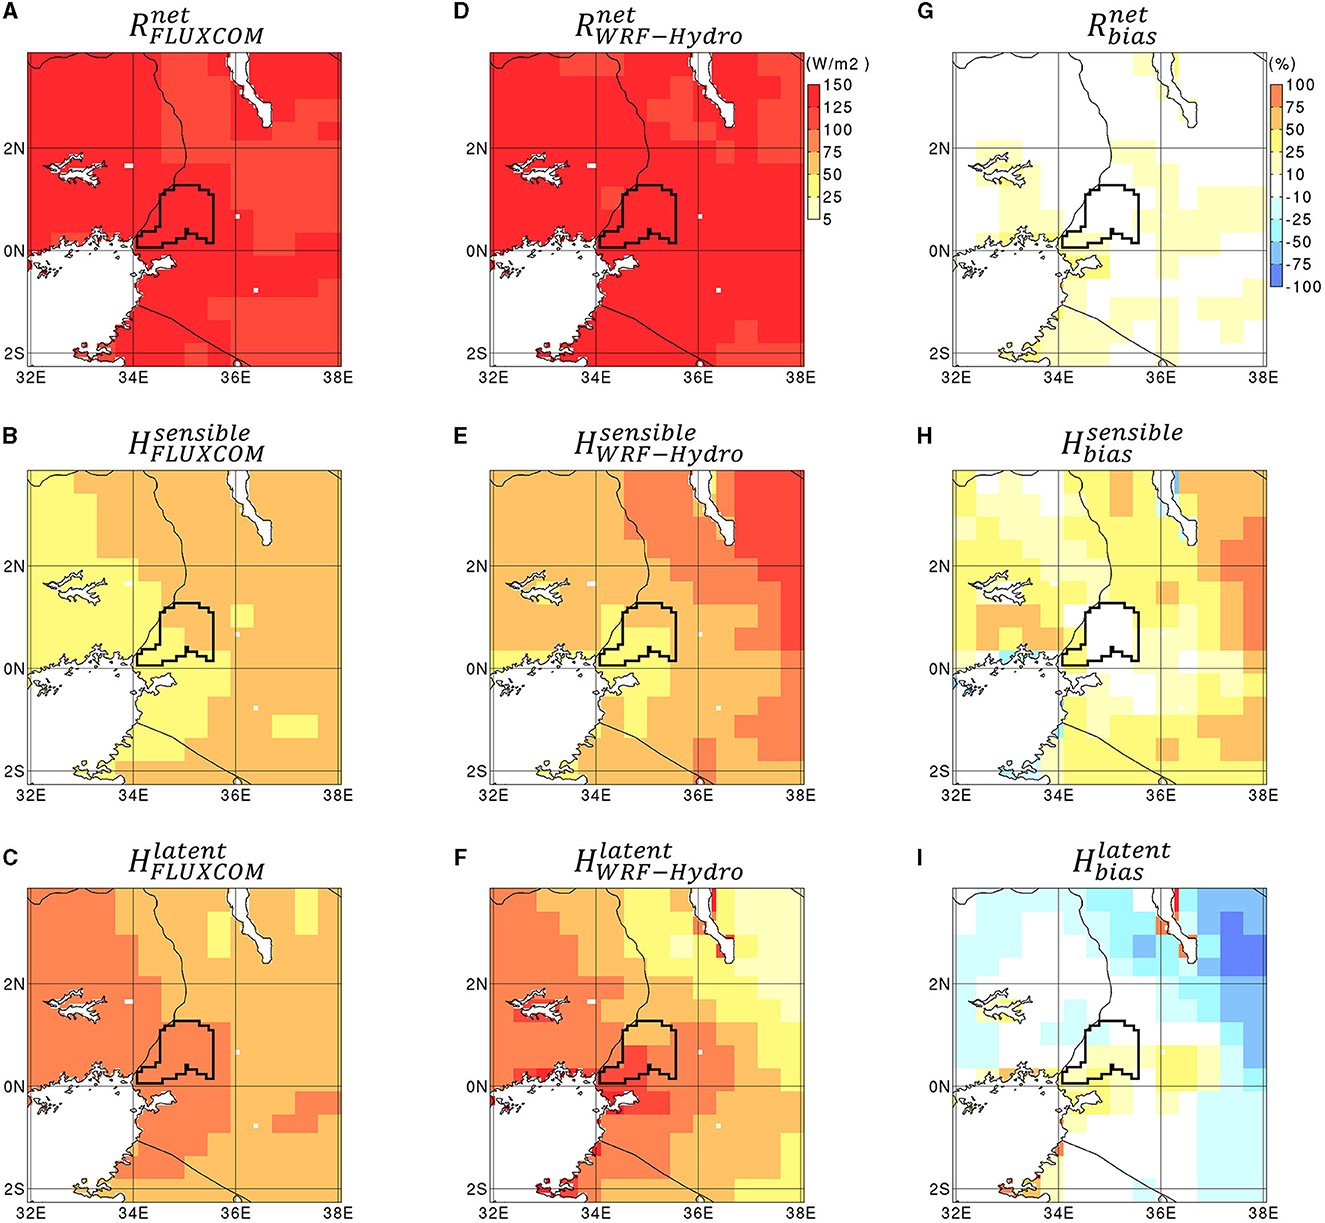
Figure 5. Maps of (A) mean net radiation flux Rnet (in W/m2), (B) mean sensible heat flux Hsensible (in W/m2) and (C) mean latent heat flux Hlatent (in W/m2) from the observational product FLUXCOM, (D–F) mean net radiation, sensible and latent heat fluxes from the inner domain of the WRF-Hydro reference simulation, (G–I) net radiation, sensible and latent heat fluxes biases (in %) between FLUXCOM and WRF-Hydro reference. Mean values are calculated for a thirteen-year period spanning from 1st January 2001 to 31st December 2013, when the FLUXCOM data is available. The energy flux maps (A–F) have the same color scale indicated by the color bar on the right side of (D), and the energy flux bias maps (G–I) also have the same color scale indicated by the color bar on the right side of (G).
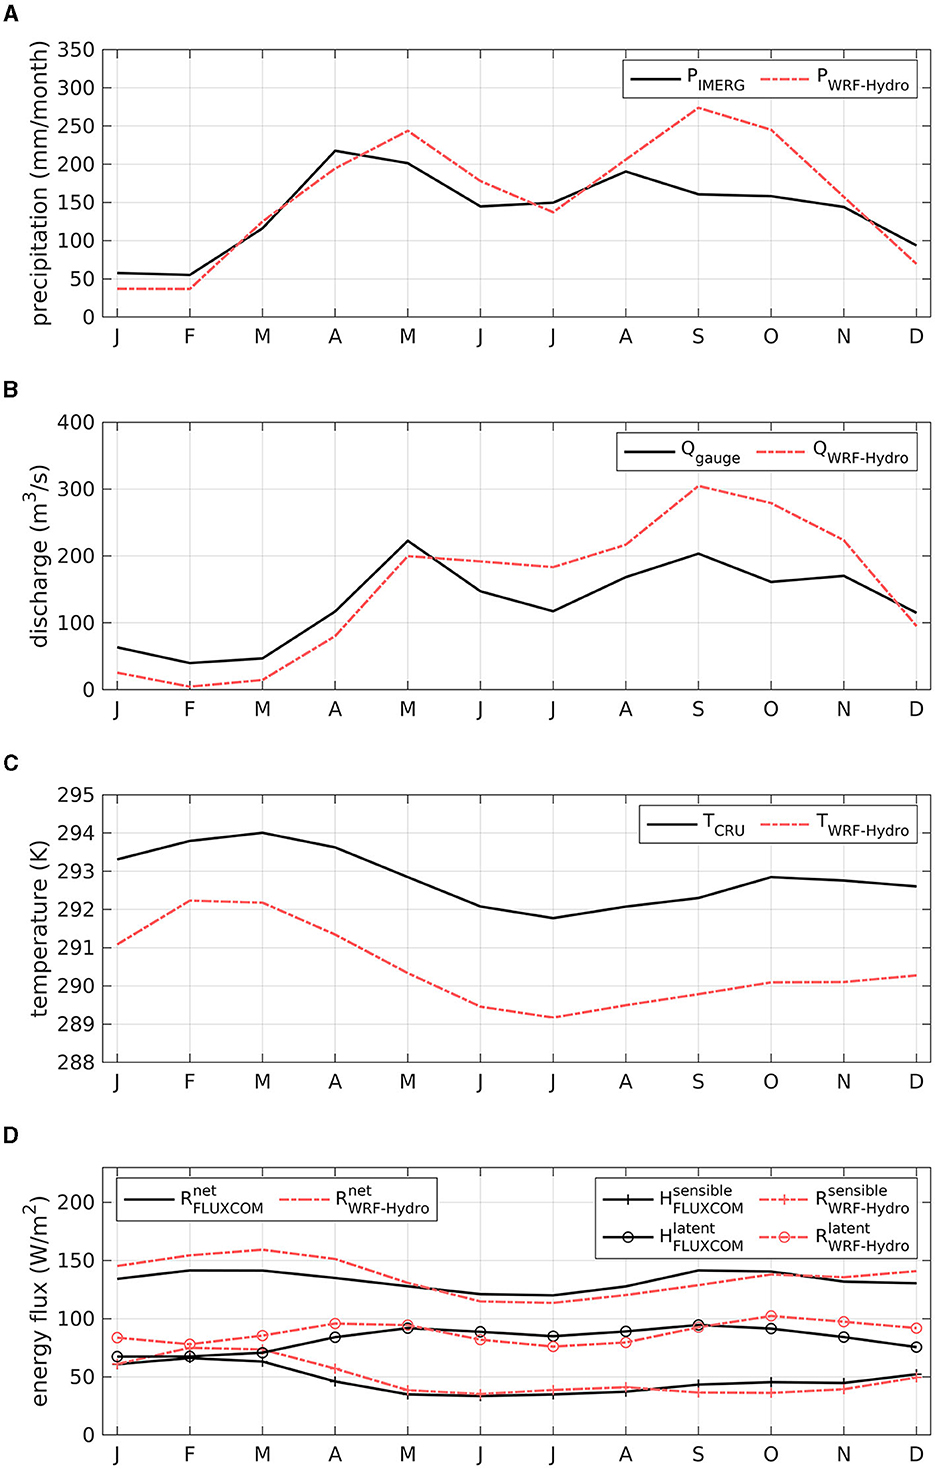
Figure 6. Climatological monthly timeseries of (A) Nzoia basin-averaged precipitation P (in mm/month), (B) Nzoia basin outlet discharge Q (in m3/s), (C) Nzoia basin-averaged temperature T (in K), (D) Nzoia basin-averaged net radiation, sensible and latent heat fluxes Rnet, Hsensible, Hlatent (in W/m2), as derived from (A) the observational product IMERG, (B) the gauge measurement, (C) the observational product CRU, (D) the observational product FLUXCOM, and from the inner domain of the WRF-Hydro reference simulation. Climatological monthly values of (A) precipitation, (B) discharge, (C) temperature, (D) energy flux values are calculated from (A) a 20-year period spanning from 1st January 2001 to 31st December 2020, (B) a nine-year period spanning from 1st January 2009 to 31st December 2017, (C) a 20-year period spanning from 1st January 2001 to 31st December 2020, and (D) for a thirteen-year period spanning from 1st January 2001 to 31st December 2013, when the corresponding observational data is available.
The annual precipitation pattern from WRF-Hydro in Figure 4C resembles that from IMERG in Figure 4A, with a southwest-northeast gradient and enhanced amounts toward Lake Victoria. However, as can be seen in the bias map of Figure 4E, WRF-Hydro is drier in the lowlands and much wetter in the highlands. The fact that IMERG does not display clearly enhanced precipitation in mountainous areas is a well-known limitation of satellite-derived products (Pradhan et al., 2022). Furthermore, the 1,000 mm of annual precipitation in the parts of the Nzoia basin close to Lake Victoria described by Githui et al. (2010) cannot be seen in IMERG, but do appear in WRF-Hydro. Still, according to the timeseries in Figure 6A, IMERG captures the three precipitation peaks, exactly in April-May, in August, and in October as mentioned by Githui et al. (2010), whereas WRF-Hydro only exhibits two precipitation peaks in May and September with an overall precipitation bias of +13%. This precipitation overestimation is also reflected in the mean monthly discharge timeseries of Figure 6B, with a discharge bias of +16%, despite an underestimation of low flow between January and March. These results indicate that the simulated climate in the Nzoia basin with the calibrated WRF-Hydro setup presented in Section 2 is too wet, even though this positive bias was not so pronounced during the period 2010–2013 used for discharge calibration (Figure 2A). As highlighted by the multi-physics ensembles of Otieno et al. (2018, 2020), the WRF precipitation bias in the region northeast of Lake Victoria largely depends on the choice of cumulus convection scheme, which suggests that future research efforts should focus on further adapting the atmospheric modeling setup of Section 2 to improve WRF-Hydro precipitation results.
The mean temperature patterns from WRF-Hydro in Figure 4D and from CRU in Figure 4B are remarkably similar, however, there is a cold bias over much of the region (Figure 4F). This cold bias is even more pronounced in the mean monthly timeseries (Figure 6C), between 2 and 3 K, which is potentially due to unresolved high-elevation cold temperatures in the CRU data. The large amounts of simulated precipitation in September–October may also have enhanced the cold bias at that time.
The mean values and patterns of net radiation, sensible, and latent heat flux from WRF-Hydro in Figures 5D–F and from FLUXCOM in Figures 5A–C are relatively similar, especially in the region of the Nzoia basin. This is confirmed by the timeseries in Figure 6D which reveals only small discrepancies. The overestimation of latent heat flux from October to April could be related to the large precipitation overestimation in September–October and too wet soils in the subsequent months. The underestimation of latent heat flux from June to August could be related to the underestimation of net radiation during that period, and potentially also inaccuracy in the vegetation parameters. Nevertheless, these results indicate that the WRF-Hydro setup captures the surface energy partitioning, and especially the evapotranspiration flux, realistically.
3.3. Afforestation impacts
The climatological differences induced by the extreme and synthetic afforestation scenarios presented in Section 2.5 and Figure 7 are visualized as differential maps of annual precipitation, mean temperature, mean energy fluxes, mean evaporation fluxes, and mean runoff fluxes in Figures 8–10, and as differential mean monthly timeseries of the terrestrial water budget terms for the Nzoia basin in Figure 11. The surface runoff flux shown in Figures 10, 11 is calculated as the sum of overland flow and channel inflow and is added to the WRF-Hydro outputs following the procedure detailed in Arnault et al. (2019).
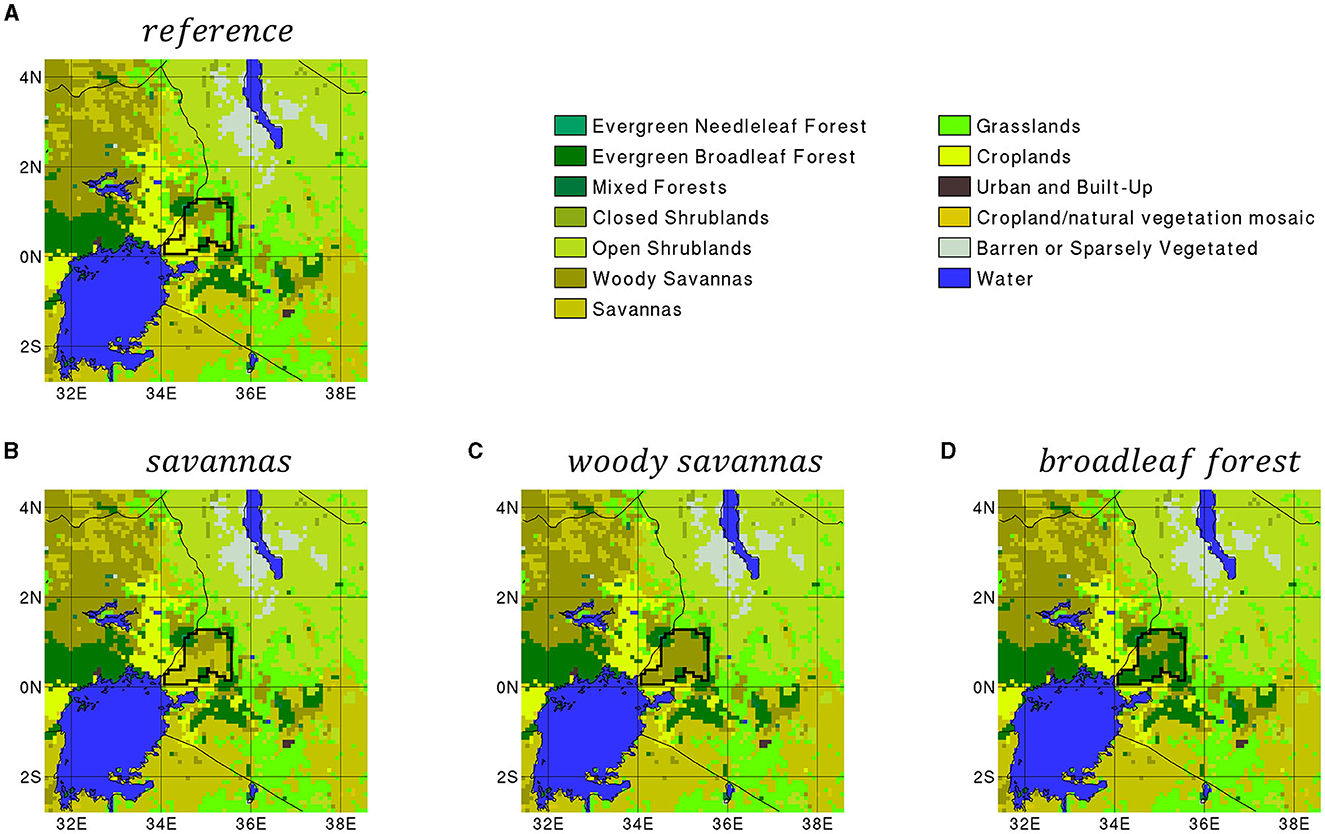
Figure 7. Maps of landcover distribution in the inner domain following the MODIS classification, as used in (A) the reference WRF-Hydro simulation, (B) the savannas WRF-Hydro simulation, (C) the woody savannas WRF-Hydro simulation, and (D) the evergreen broadleaf forest WRF-Hydro simulation. The black contour line in all panels indicates the location of the Nzoia basin where the landcover change experiment is conducted. Landcover outside the Nzoia basin is maintained as in the reference. The color classification of MODIS landcover classes is provided in the upper right side of the figure.
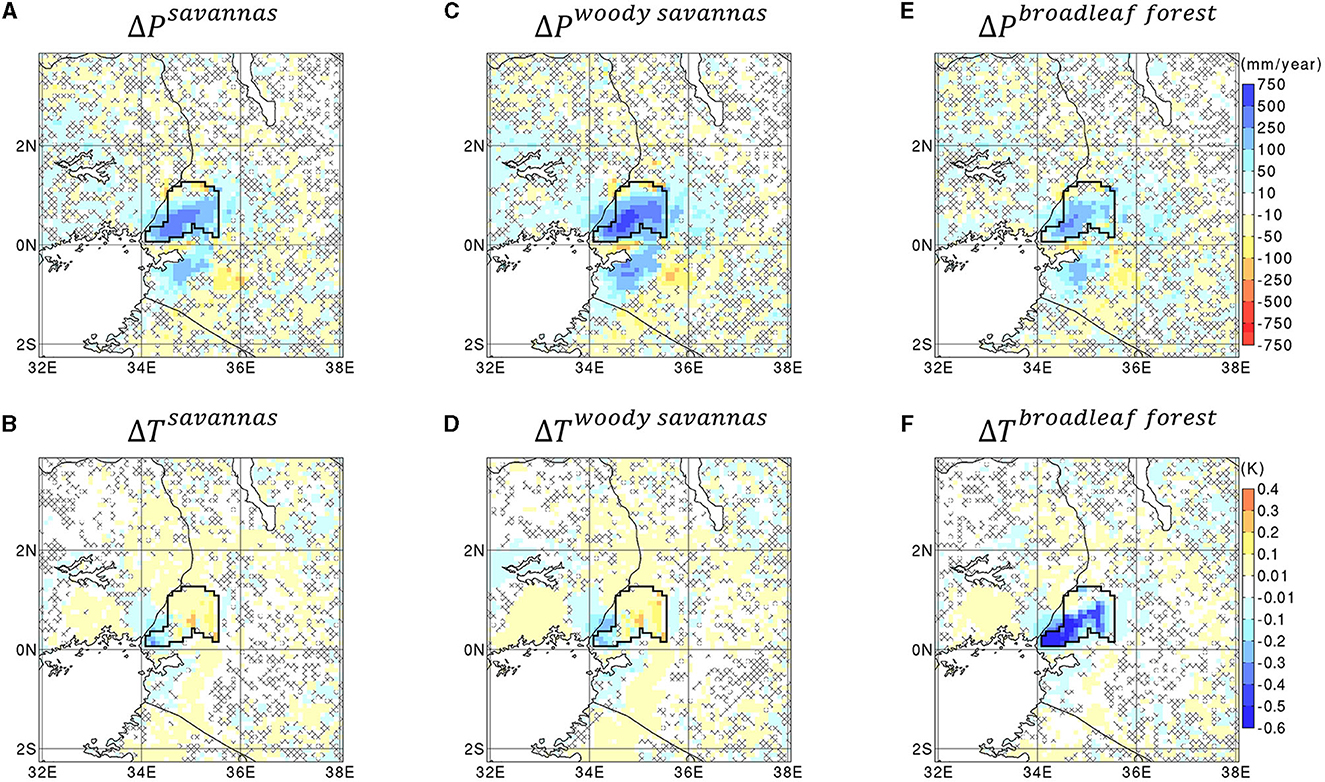
Figure 8. Maps of (A, C, E) annual precipitation difference ΔP displayed as a percentage of the annual IMERG precipitation and (B, D, F) mean temperature difference ΔT (in K) between the reference WRF-Hydro simulation and the (A, B) savannas, (C, D) woody savannas, (E, F) evergreen broadleaf forest WRF-Hydro simulations. Mean differential values are calculated as the mean value from the afforestation experiments minus the mean value from the reference experiment, for a 20-year period spanning from 1st January 2001 to 31st December 2020. The annual differential precipitation maps (A, C, E) have the same color scale indicated by the color bar on the right side of (E), and the mean differential temperature maps (B, D, F) also have the same color scale indicated by the color bar on the right side of (F). In all maps, the crossed areas correspond to the areas where the climate change signal is not robust, that is where <90% of the 1,140 subsets of 17-year mean differences have the same sign as the 20-year mean difference.
Remarkably, all savannas, woody savannas and evergreen broadleaf forest scenarios result in a robust precipitation increase in the Nzoia basin and near surrounding areas toward the South, West and East, as displayed in Figures 8A, C, E. There is also a robust but small precipitation decrease over the highest mountains of the Nzoia basin and also outside of the basin toward the Southwest and Southeast, which indicates that the tested afforestation scenarios in the Nzoia basin increase precipitation locally at the expense of other regions, to some extent.
Concerning temperature, only the evergreen broadleaf forest scenario in Figure 8F robustly induces a cooling on the annual scale in the Nzoia basin, up to 0.5 K, whereas the savannas and woody savannas scenarios in Figures 8B, D rather robustly induce a very slight warming in the Nzoia basin. The reason for this model behavior can be partially elucidated with the maps of mean energy flux differences in Figure 9.
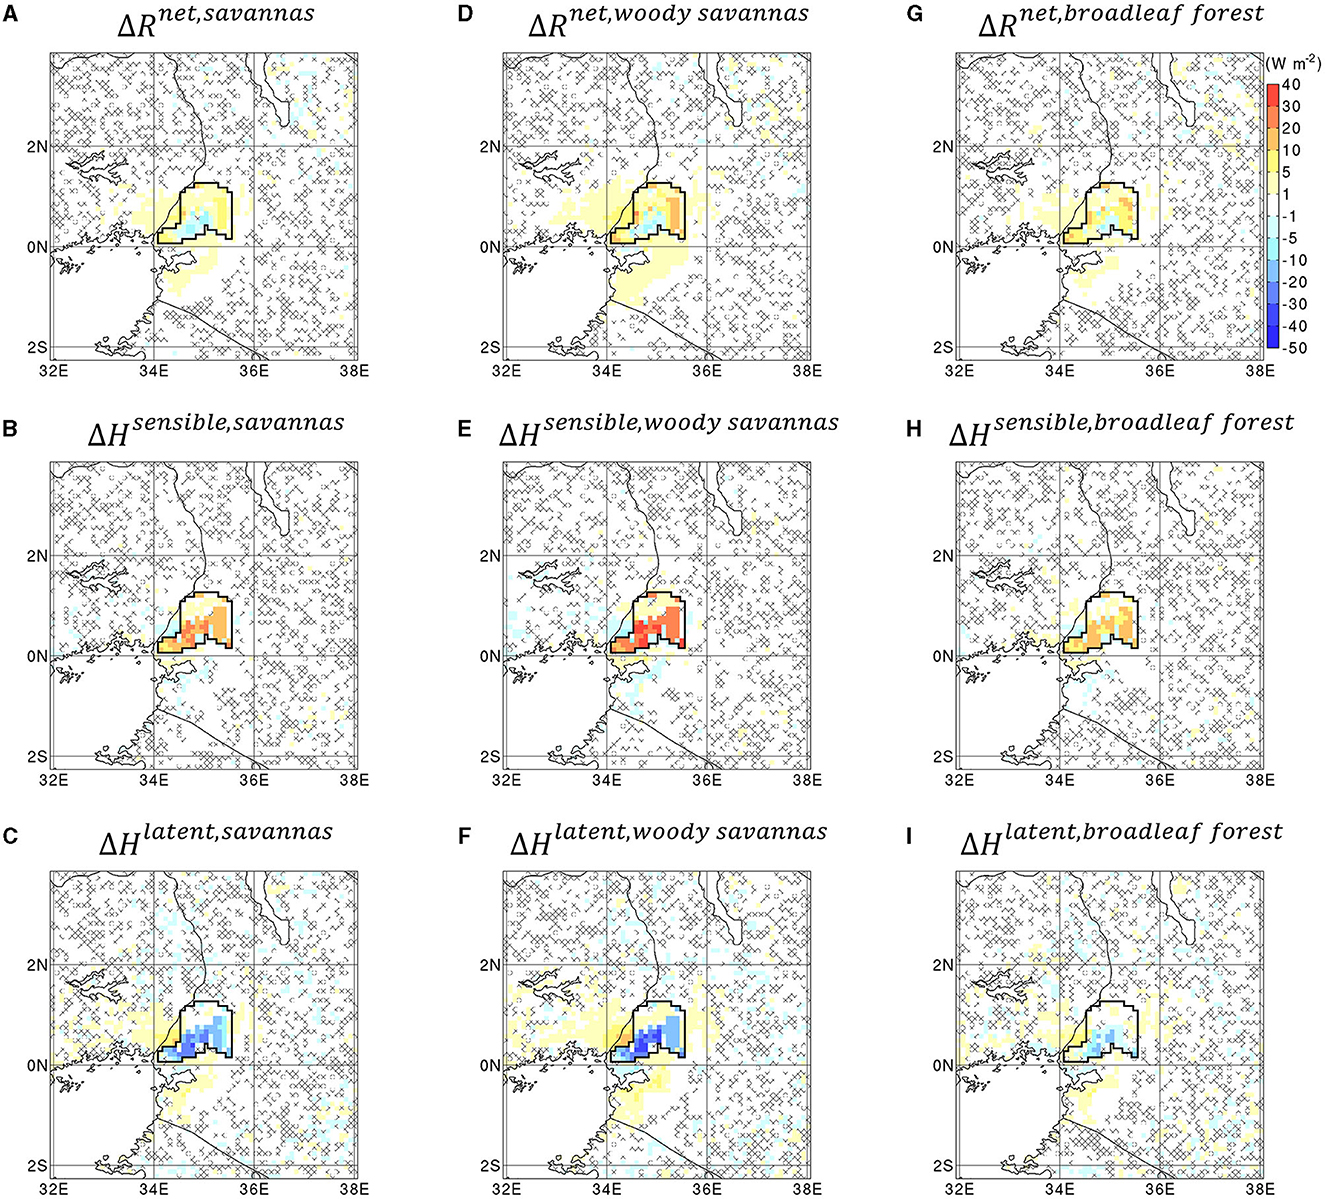
Figure 9. Maps of (A, D, G) mean net radiation flux difference ΔRnet (in W/m2), (B, E, H) mean sensible heat flux difference ΔHsensible (in W/m2), and (C, F, I) mean latent heat flux difference ΔHlatent (in W/m2) between the reference WRF-Hydro simulation and the (A–C) savannas, (D–F) woody savannas, (G–I) evergreen broadleaf forest WRF-Hydro simulations. Mean differential values are calculated as the mean value from the afforestation experiments minus the mean value from the reference experiment, for a 20-year period spanning from 1st January 2001 to 31st December 2020. All differential energy flux maps have the same color scale indicated by the color bar on the right side of (G). In all maps, the crossed areas correspond to the areas where the climate change signal is not robust, that is where <90% of the 1,140 subsets of 17-year mean differences have the same sign as the 20-year mean difference.
Remarkably, savannas, woody savannas, and evergreen broadleaf forest scenarios result in a robust slight increase in net radiation flux in Figures 9A, D, G, a robust large increase in sensible heat flux in Figures 9B, E, H, and a robust large decrease in latent heat flux in Figures 9C, F, I in the Nzoia basin. The slight increase in net radiation flux, which is related to the cloud cover change associated with the precipitation increase, the surface albedo change associated with the landcover change and a skin temperature change, is much smaller in amplitude compared to the changes in sensible and latent heat fluxes and is not discussed further.
The large decrease in latent heat flux, especially for the savannas and woody savannas scenarios in Figures 9C, F, is surprising, but consistent with the large sensible heat increase in Figures 9B, E, and the slight temperature increase in Figures 8B, D. For the case of the evergreen broadleaf forest scenario, the latent heat-decrease in Figure 9H and sensible heat increase in Figure 9I are much less pronounced. Temperature still decreases in this case (Figure 8F), which is related to the fact that the energy fluxes in Noah-MP are calculated above the canopy, whereas the temperature includes a below-canopy cooling effect that is much more efficient for the evergreen broadleaf forest type (Noah-MP, Niu et al., 2011). The in-situ measurements of Ceperley et al. (2017) in the West African Sahelian region confirm that savannas can increase the sensible heat flux in comparison to agricultural land, although Ceperley et al. (2017) attributed this heating enhancement to a larger number of exposed rocks rather than a diminution of latent heat as in our modeled case.
Among our afforestation modeling experiments the sensible heat flux increase is largest in the case of the woody savannas scenario in Figure 9E, and is associated with the largest precipitation increase in Figure 8C. This is an indication that simulated precipitation increase in these experiments is the result of enhanced atmospheric heating and enhanced convective instability induced by a reduction of the latent heat, which corresponds to the negative feedback process described for example by Taylor et al. (2012).
The latent heat flux decrease triggered by the afforestation scenarios is related to a robust large decrease in soil evaporation flux in the Nzoia basin (see Figures 10A, E, I), that is only partially balanced by a robust smaller increase in plant evapotranspiration flux (see Figures 10B, F, J). Indeed, the calculation of the soil evaporation in Noah-MP also considers the soil evaporation which happens below the canopy. Thus, according to Noah-MP the savannas and woody savannas vegetation types are more efficient in reducing soil evaporation loss compared to grasslands and croplands. This soil water loss-reducing effect is almost completely canceled in the case of the evergreen broadleaf forest scenario, where the plant evapotranspiration flux in Figure 10J is very much enhanced as expected. It is worth noting that a comprehensive panel of in-situ observations would be needed to verify these detailed model behaviors (Ceperley et al., 2017; Bliefernicht et al., 2018).
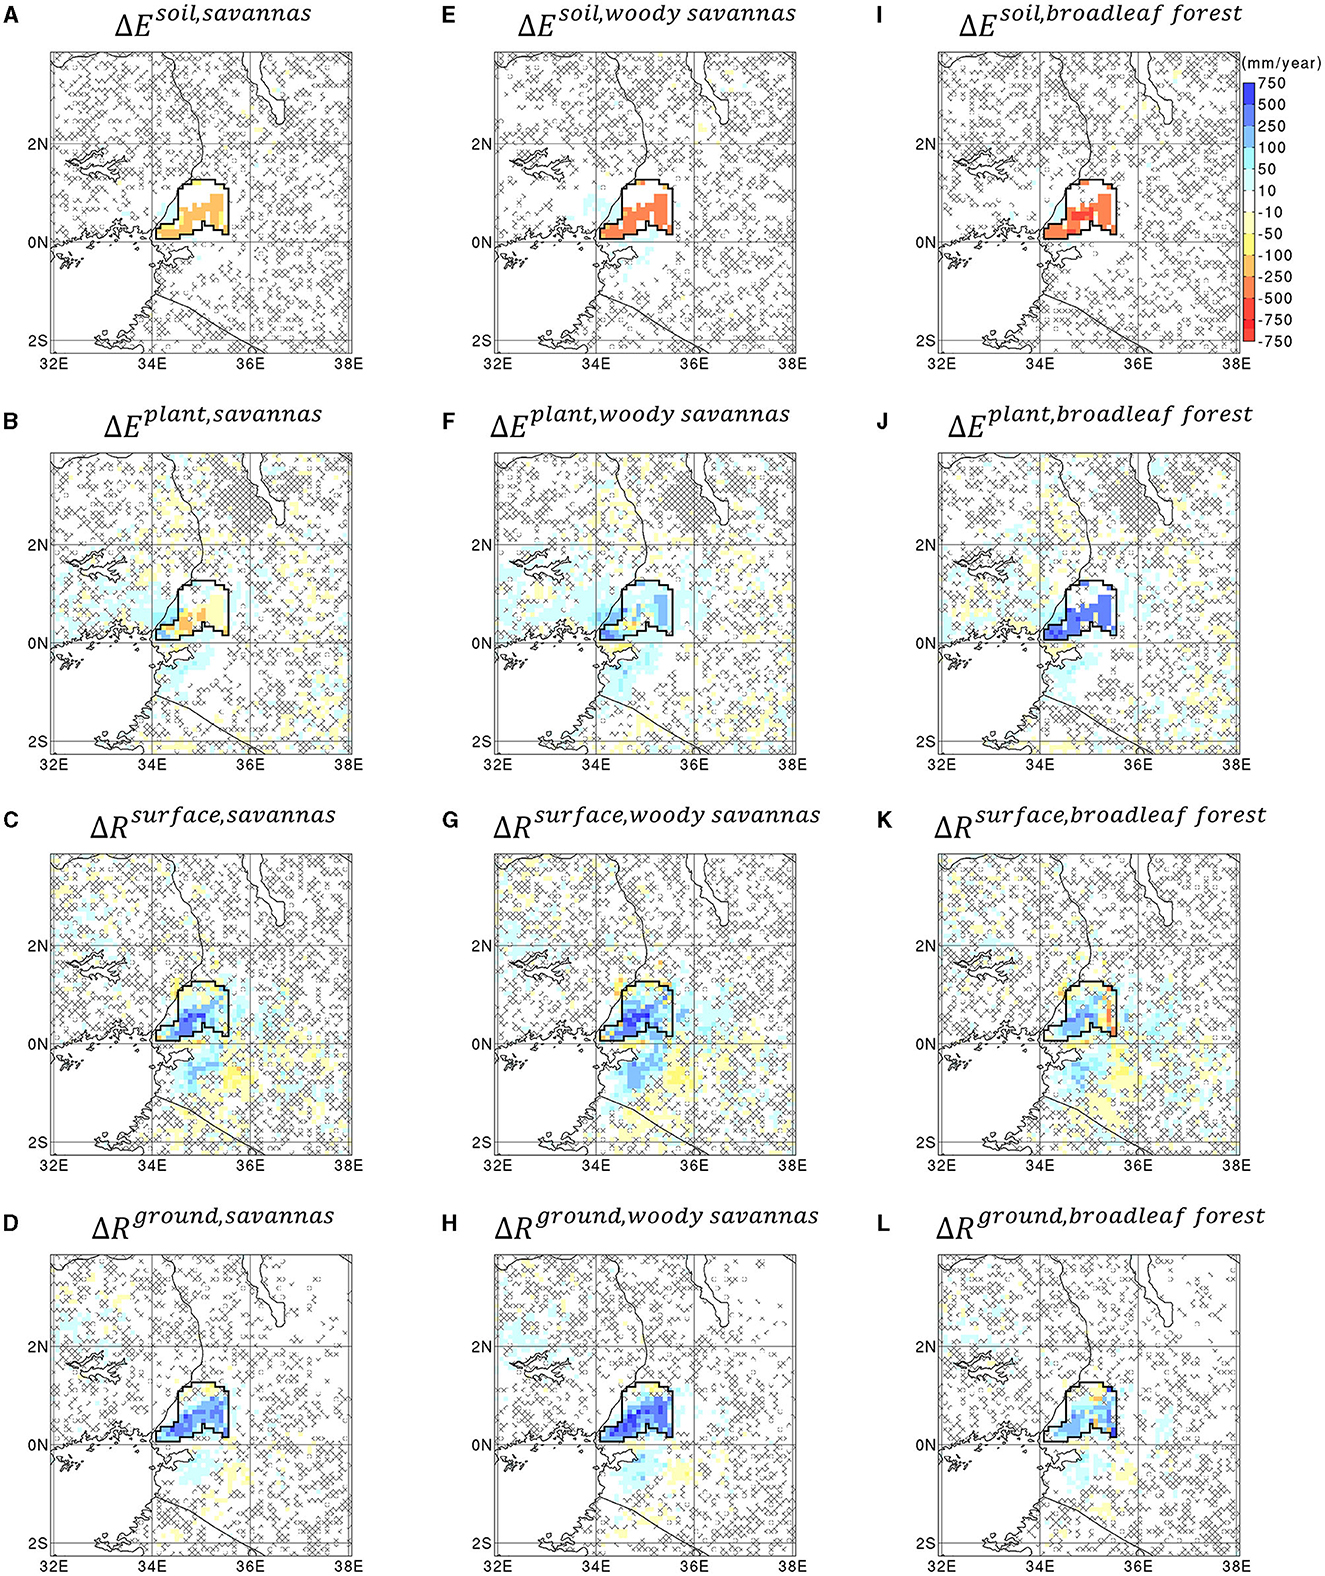
Figure 10. Maps of (A, E, I) annual soil evaporation difference ΔEsoil (in % of IMERG annual precipitation), (B, F, J) annual plant evapotranspiration difference ΔEplant (in % of IMERG annual precipitation), (C, G, K) annual surface runoff difference ΔRsurface (in % of IMERG annual precipitation), and (D, H, L) annual underground runoff difference ΔRground (in % of IMERG annual precipitation), between the reference WRF-Hydro simulation and the (A–D) savannas, (E–H) woody savannas, (I–L) evergreen broadleaf forest WRF-Hydro simulations. In (A, E, I) the soil evaporation is calculated as the sum of the soil evaporations outside and below the canopy. In (B, F, J) the plant evapotranspiration is calculated as the sum of the plant transpiration and intercepted canopy water evaporation. Mean differential values are calculated as the mean value from the afforestation experiments minus the mean value from the reference experiment, for a 20-year period spanning from 1st January 2001 to 31st December 2020. All differential water flux maps have the same color scale indicated by the color bar on the right side of (I). In all maps, the crossed areas correspond to the areas where the climate change signal is not robust, that is where <90% of the 1,140 subsets of 17-year mean differences have the same sign as the 20-year mean difference.
The overall robust increases in surface runoff flux (Figures 10C, G, K), and underground runoff flux (Figures 10D, H, L) in the Nzoia basin mainly arise from the precipitation increase triggered by the negative feedback process mentioned above. To a lesser extent the evapotranspiration flux decrease plays a role in this runoff increase, following the above-discussed water balance-based mechanism proposed for example by Achugbu et al. (2022) and more specifically for the Nzoia basin by Githui et al. (2010). The mean-monthly timeseries of Figure 11, Table 3 further illustrate the runoff increase response to a dual precipitation increase—evapotranspiration decrease, a process much exacerbated in the case of the woody savannas' scenario in Figure 11B and much attenuated in the case of the evergreen broadleaf forest scenario in Figure 11C. In the case of the woody savannas' scenario, water resources would be much increased, by about 13% for precipitation, 8% for surface runoff and 12% for underground runoff or groundwater recharge, as summarized in Table 3. The relatively narrow error margins displayed in Figure 11 and indicated in Table 3 demonstrate the significance of the simulated climate change signals presented in this article.
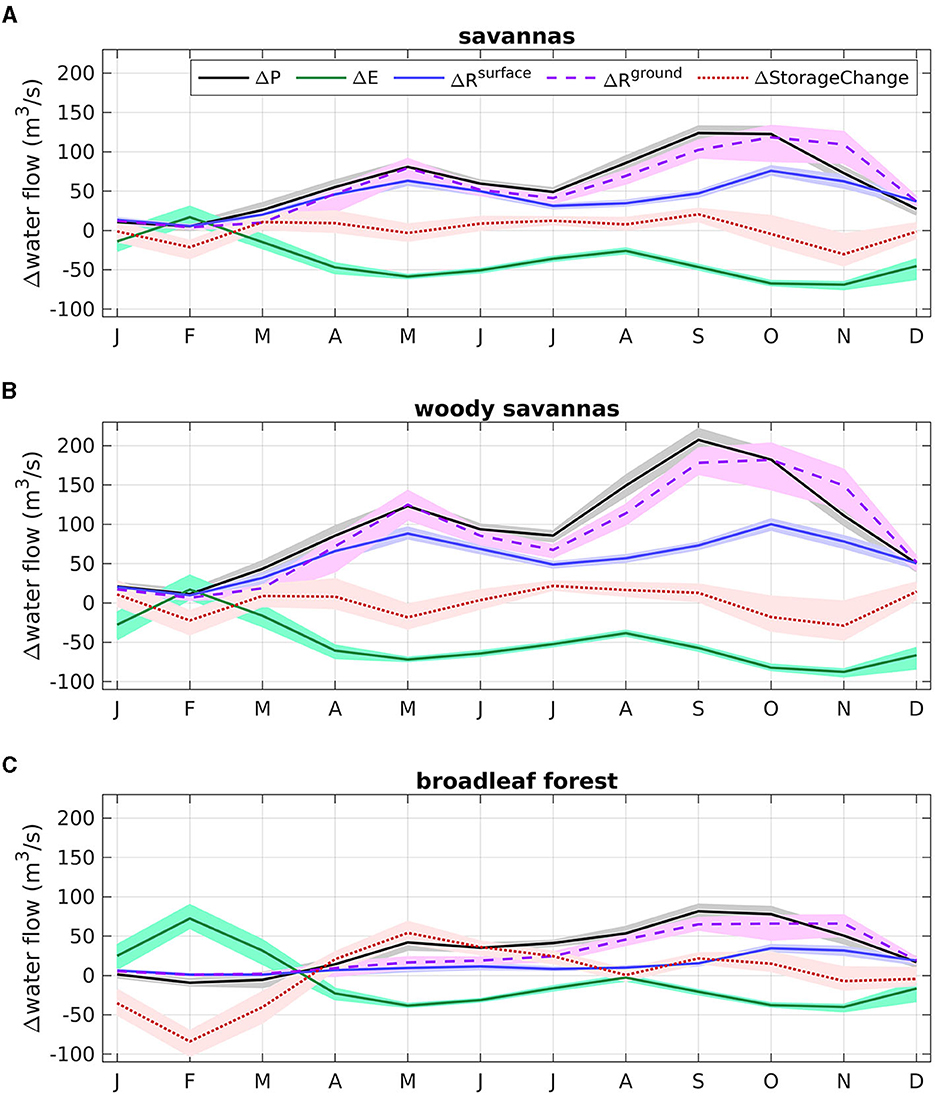
Figure 11. Climatological monthly timeseries of differential water flow terms of the terrestrial water budget spatially integrated in the area of the Nzoia basin, namely the differential precipitation ΔP (in m3/s), the differential total evapotranspiration ΔE (in m3/s), the differential surface runoff ΔRsurface (in m3/s), the differential underground runoff ΔRground (in m3/s), and the differential soil water storage change ΔStorageChange (in m3/s), between the reference WRF-Hydro simulation and the (A) savannas, (B) woody savannas, (C) evergreen broadleaf forest WRF-Hydro simulations. Climatological monthly differential values are calculated as the climatological monthly value from the afforestation experiments minus the climatological monthly value from the reference experiment. In each panel, the lines indicate the 20-year average monthly differences for the period spanning from 1st January 2001 to 31st December 2020. The shaded areas represent an error margin calculated as the spread obtained from the 1,140 subsets of 17-year average monthly differences among the 20 simulated years. The legend is provided in the upper-right side of (A).
It is recognized that the tested afforestation scenarios are idealized and difficult to apply in the real world, but they demonstrate the potential of landcover change to modulate climate change. More generally, these results highlight the importance of the coupled modeling approach for a comprehensive assessment of landcover change impacts on climate (Sy and Quesada, 2020).
4. Summary and concluding remarks
The first application of the coupled atmospheric-hydrological model WRF-Hydro to synthetic landcover change numerical experiments was presented, exemplarily realized for the case of the Nzoia basin in Kenya. As part of the calibration, WRF-Hydro was enhanced with an overbank flow option. With this additional realism, the calibrated discharge performance was greatly improved in the study basin. Then, the calibrated model was run for a 20-year historical period using the default landcover map, and three modified landcover maps according to the following afforestation scenarios: grasslands and croplands of the Nzoia basin replaced by (1) savannas, (2) woody savannas, (3) evergreen broadleaf forest. These synthetic afforestation scenarios led to robust results in the area of the Nzoia basin. A large reduction of the soil evaporation was only partially balanced by a smaller increase in plant evapotranspiration, which reduced the latent heat flux, increased the sensible heat flux, and finally triggered more precipitation, surface runoff, and groundwater recharge. This mechanism was particularly pronounced with the woody savannas scenario, but much attenuated with the evergreen broadleaf forest scenario, which suggests that an afforestation policy can have a large impact on the regional climate and water resources availability, depending on the planting strategy. For decision-makers, the woody savannas scenario would imply to build more infrastructures to store water and bring it to less humid parts of the country, protect the population from increased flood risks, and relocate the farmers having lost their land for cropping.
To increase the value of such idealized synthetic numerical results for decision-makers, observation and model improvement efforts should be jointly conducted. The establishment of in-situ measurement stations, as realized for example in West Africa (Bliefernicht et al., 2018), is crucial for validating the representation of physical processes in the model for a specific region. A parameter sensitivity study would be beneficial to better understand the physical mechanisms associated with the modeled impacts of afforestation on climate. Enhancing the horizontal resolution of the model grid would enable the implementation of more realistic landcover change scenarios, although this would require several additional tests to identify suitable sets of physics schemes for the atmospheric modeling, and to recalibrate the hydrological parameters. Additional model developments, such as soil parameterization (Zhang et al., 2023), groundwater coupling (Rummler et al., 2022), vegetation dynamics (Glotfelty et al., 2021; Warrach-Sagi et al., 2022), carbon-nitrogen biogeochemistry (Chang et al., 2018), should also be considered to further enhance the realism of simulated land-atmosphere interactions with coupled WRF-Hydro.
Data availability statement
The raw data supporting the conclusions of this article will be made available by the authors, without undue reservation.
Author contributions
JA, AM, TP, LL, SSo, and HK contributed to the conception and design of the study. AM, MH, TB, and ZZ contributed to observational data acquisition. BF maintained the linux cluster used for the simulations. JA developed the overbank flow module in WRF-Hydro, carried out the simulations for the calibration and afforestation experiments, and drafted the manuscript. AM, TP, LL, TR, BF, ZZ, EM, IA, HM, SSy, JW, PL, SSo, and HK brought their expertise to improve the analysis. All authors revised and approved the submitted version.
Funding
The open access publication of this article was supported by the German Science Foundation (DFG) sponsored Open Access Fund of the University of Augsburg. The research was supported by funding from the European Union's Horizon 2020 program through the Co-production of Climate Services for East Africa (CONFER, grant 869730), from the DFG through the Large-Scale and High-Resolution Mapping of Soil Moisture on Field and Catchment Scales Boosted by Cosmic-Ray Neutrons (COSMIC-SENSE, FOR 2694, grant KU 2090/12-2), and Multi-Scale Quantification and Modeling of Spatio-Temporal Dynamics of Ecosystem Processes by Smart Autonomous Sensor Networks (ECOSENSE, SFB 1537), from the Federal Ministry of Education and Research of Germany (BMBF) through the West African Science Service Center on Climate Change and Adapted Land Use (WASCAL) and the Concerted Regional Modeling and Observation Assessment for Greenhouse Gas Emissions and Mitigation Options under Climate and Land Use Change in West Africa (CONCERT), and from the Generalitat Valenciana and the European Social Fund (APOSTD20/2019-7956).
Acknowledgments
The simulations were conducted at the linux cluster of KIT/IMK-IFU in Garmisch-Partenkirchen. The Nzoia river discharge data was provided by the Water Resource Authority of Kenya. Special thanks go to Frank Neidl and Christoph Sörgel for the computer support and two reviewers for their suggestions to improve the manuscript.
Conflict of interest
The authors declare that the research was conducted in the absence of any commercial or financial relationships that could be construed as a potential conflict of interest.
Publisher's note
All claims expressed in this article are solely those of the authors and do not necessarily represent those of their affiliated organizations, or those of the publisher, the editors and the reviewers. Any product that may be evaluated in this article, or claim that may be made by its manufacturer, is not guaranteed or endorsed by the publisher.
References
Achugbu, I. C., Laux, P., Olufayo, A. A., Balogun, I. A., Dudhia, J., Arnault, J., et al. (2023). The impacts of land use and land cover change on biophysical processes in West Africa using a regional climate model experimental approach. Int. J. Climatol. 43, 1731–1755. doi: 10.1002/joc.7943
Achugbu, I. C., Olufayo, A. A., Balogun, I. A., Dudhia, J., McAllister, M., Adefisan, E. A., et al. (2022). Potential effects of land use land cover change on streamflow over the Sokoto Rima river basin. Heliyon 8, e09779. doi: 10.1016/j.heliyon.2022.e09779
Arnault, J., Fersch, B., Rummler, T., Zhang, Z., Quenum, G. M., Wei, J., et al. (2021). Lateral terrestrial water flow contribution to summer precipitation at continental scale – A comparison between Europe and West Africa with WRF-Hydro-tag ensembles. Hydrol. Process. 35, e14183. doi: 10.1002/hyp.14183
Arnault, J., Rummler, T., Baur, F., Lerch, S., Wagner, S., Fersch, B., et al. (2018). Precipitation sensitivity to the uncertainty of terrestrial water flow in WRF-Hydro: An ensemble analysis for Central Europe. J. Hydrometeorol. 19, 1007–1025. doi: 10.1175/JHM-D-17-0042.1
Arnault, J., Wagner, S., Rummler, T., Fersch, B., Bliefernicht, J., Andresen, S., et al. (2016). Role of runoff–infiltration partitioning and resolved overland flow on land–atmosphere feedbacks: A case study with the WRF-Hydro coupled modeling system for West Africa. J. Hydrometeorol. 17, 1489–1516. doi: 10.1175/JHM-D-15-0089.1
Arnault, J., Wei, J., Rummler, T., Fersch, B., Zhang, Z., Jung, G., et al. (2019). A joint soil-vegetation-atmospheric water tagging procedure with WRF-Hydro: Implementation and application to the case of precipitation partitioning in the upper Danube river basin. Water Resour. Res. 55, 6217–6243. doi: 10.1029/2019WR024780
Bliefernicht, J., Berger, S., Salack, S., Guug, S., Hingerl, L., Heinzeller, D., et al. (2018). The WASCAL hydrometeorological observatory in the sudan savanna of burkina faso and ghana. Vadose Zone J. 17, 180065. doi: 10.2136/vzj2018.03.0065
Bonan, G. B. (2008). Forests and climate change: Forcings, feedbacks, and the climate benefits of forests. Science 320, 1444–1449. doi: 10.1126/science.1155121
Breil, M., Davin, E. L., and Rechid, D. (2021). What determines the sign of the evapotranspiration response to afforestation in European summer? Biogeosciences 18, 1499–1510. doi: 10.5194/bg-18-1499-2021
Breil, M., Krawczyk, F., and Pinto, J. P. (2023). The response of the regional longwave radiation balance and climate system in Europe to an idealized afforestation experiment. Earth Syst. Dynam. 14, 243–253. doi: 10.5194/esd-14-243-2023
Bright, R. M., Davin, E., O'Halloran, T., Pongratz, J., Zhao, K., and Cescatti, A. (2017). Local temperature response to land cover and management change driven by non-radiative processes. Nat. Clim. Change 7, 296–302. doi: 10.1038/nclimate3250
Camera, C., Bruggeman, A., Zittis, G., Sofokleous, I., and Arnault, J. (2020). Simulation of extreme rainfall and streamflow events in small Mediterranean watersheds with a one-way-coupled atmospheric–hydrologic modelling system. Nat. Hazards Earth Syst. Sci. 20, 2791–2810. doi: 10.5194/nhess-20-2791-2020
Ceperley, N. C., Mande, T., van de Giesen, N., Tyler, S., Yacouba, H., and Parlange, M. B. (2017). Evaporation from cultivated and semi-wild Sudanian Savanna in west Africa. Hydrol. Earth Syst. Sci. 21, 4149–4167. doi: 10.5194/hess-21-4149-2017
Chang, K.-Y., Paw, U. K. T, and Chen, S.-H. (2018). The importance of carbon-nitrogen biogeochemistry on water vapor and carbon fluxes as elucidated by a multiple canopy layer higher order closure land surface model. Agr. Forest Meteorol. 259, 60–74. doi: 10.1016/j.agrformet.2018.04.009
Dale, V. H. (1997). The relationship between land-use change and climate change. Ecol. Appl. 7, 753–769. doi: 10.1890/1051-0761(1997)007[0753:TRBLUC]2.0.CO;2
Davin, E. L., Rechid, D., Breil, M., Cardoso, R. M., Coppola, E., Hoffmann, P., et al. (2020). Biogeophysical impacts of forestation in Europe: First results from the LUCAS (Land Use and Climate Across Scales) regional climate model intercomparison. Earth Syst. Dynam. 11, 183–200. doi: 10.5194/esd-11-183-2020
de Noblet-Ducoudré, N., Boisier, J.-P., Pitman, A., Bonan, G. B., Brovkin, V., Cruz, F., et al. (2012). Determining robust impacts of land-use-induced land cover changes on surface climate over North America and Eurasia: Results from the first set of LUCID experiments. J. Climate 25, 3261–3281. doi: 10.1175/JCLI-D-11-00338.1
Dudhia, J. (1989). Numerical study of convection observed during the Winter Monsoon Experiment using a mesoscale two-dimensional model. J. Atmos. Sci. 46, 3077–3107. doi: 10.1175/1520-0469(1989)046<3077:NSOCOD>2.0.CO;2
Duveiller, G., Caporaso, L., Abad-Viñas, R., Perugini, L., Grassi, G., Arneth, A., et al. (2020). Local biophysical effects of land use and land cover change: towards an assessment tool for policy makers. Land Use Policy 91, 104382. doi: 10.1016/j.landusepol.2019.104382
Duveiller, G., Hooker, J., and Cescatti, A. (2018). The mark of vegetation change on Earth's surface energy balance. Nat. Commun. 9, 1–12. doi: 10.1038/s41467-017-02810-8
Fersch, B., Senatore, A., Adler, B., Arnault, J., Mauder, M., Schneider, K., et al. (2020). High-resolution fully-coupled atmospheric–hydrological modeling: a cross-compartment regional water and energy cycle evaluation. Hydrol. Earth Syst. Sci. 24, 2457–2481. doi: 10.5194/hess-24-2457-2020
Friedl, M. A., Mc Iver, D. K., Hodges, J. C. F., Zhang, X. Y., Muchoney, D., Strahler, et al. (2002). Global land cover mapping from MODIS: algorithms and early results. Rem. Sens. Environ. 83, 287–302. doi: 10.1016/S0034-4257(02)00078-0
Furnari, L., Magnusson, L., Mendicino, G., and Senatore, A. (2022). Fully coupled high-resolution medium-range forecasts: Evaluation of the hydrometeorological impact in an ensemble framework. Hydrol. Process. 36, e14503. doi: 10.1002/hyp.14503
Githui, F., Mutua, F., and Bauwens, W. (2010). Estimating the impacts of land-cover change on runoff using the soil and water assessment tool (SWAT): case study of Nzoia catchment, Kenya. Hydrol. Sci. J. 54, 899–908. doi: 10.1623/hysj.54.5.899
Glotfelty, T., Ramírez-Mejía, D., Bowden, J., Ghilardi, A., and West, J. J. (2021). Limitations of WRF land surface models for simulating land use and land cover change in Sub-Saharan Africa and development of an improved model (CLM-AF v. 1.0). Geosci. Model Dev. 14, 3215–3249. doi: 10.5194/gmd-14-3215-2021
Gochis, D. J., Barlage, M., Cabell, R., Casali, M., Dugger, A., FitzGerald, K., et al. (2020). The WRF-Hydro® modeling system technical description, (Version 5.2.0). NCAR Technical Note. 108. Available online at: https://ral.ucar.edu/sites/default/files/public/projects/wrf-hydro/technical-description-user-guide/wrf-hydrov5.2technicaldescription.pdf
Grell, G. A., and Freitas, S. R. (2014). A scale and aerosol aware stochastic convective parameterization for weather and air quality modeling. Atmos. Chem. Phys. 14, 5233–5250. doi: 10.5194/acp-14-5233-2014
Gupta, H. V., Kling, H., Yilmaz, K. K., and Martinez, G. F. (2009). Decomposition of the mean squared error and NSE performance criteria: Implications for improving hydrological modelling. J. Hydrol. 377, 80–91. doi: 10.1016/j.jhydrol.2009.08.003
Harper, A. B., Powell, T., Cox, P. M., House, J., Huntingford, C., Lenton, T. M., et al. (2018). Land-use emissions play a critical role in land-based mitigation for Paris climate targets. Nat. Commun. 9, 2938. doi: 10.1038/s41467-018-05340-z
Harris, I., Jones, P. D., Osborn, T. J., and Lister, D. H. (2014). Updated high-resolution grids of monthly climatic observations - the CRU TS3.10 Dataset. Int. J. Climatol. 34, 623–642. doi: 10.1002/joc.3711
Hersbach, H., Bell, B., Berrisford, P., Hirahara, S., Horányi, A., Muñoz-Sabater, J., et al. (2020). The ERA5 global reanalysis. Q. J. R. Meteorol. Soc. 146, 1999–2049. doi: 10.1002/qj.3803
Hong, S.-Y., and Lim, J.-O. J. (2006). The WRF single-moment 6-class microphysics scheme (WSM6). J. Korean Meteor. Soc. 42, 129–151. Available online at: https://www.kci.go.kr/kciportal/ci/sereArticleSearch/ciSereArtiView.kci?sereArticleSearchBean.artiId=ART001017491 (accessed September 23, 2023).
Huffman, G., Bolvin, D., Braithwaite, D., Hsu, K., Joyce, R., and Xie, P. (2014). Integrated Multi-satellitE Retrievals for GPM (IMERG), version 4.4. NASA's Precipitation Processing Center. Available online at: https://disc.gsfc.nasa.gov/datasets/GPM_3IMERGDF_06/summary?keywords=IMERG final (accessed 14 March, 2022).
Jung, M., Koirala, S., Weber, U., Ichii, K., Gans, F., Camps-Valls, G., et al. (2019). The FLUXCOM ensemble of global land-atmosphere energy fluxes. Sci. Data 6, 74. doi: 10.1038/s41597-019-0076-8
Kerandi, N., Arnault, J., Laux, P., Wagner, S., Kitheka, J., and Kunstmann, H. (2017). Joint atmospheric-terrestrial water balances for East Africa: A WRF-Hydro case study for the upper Tana River basin. Theor. Appl. Climatol. 131, 1337–1355. doi: 10.1007/s00704-017-2050-8
Laux, P., Nguyen, P. N. B., Cullmann, J., Van, T. P., and Kunstmann, H. (2017). How many RCM ensemble members provide confidence in the impact of land-use land cover change? Int. J. Climatol. 37, 2080–2100. doi: 10.1002/joc.4836
Lehner, B., Verdin, K., and Jarvis, A. (2008). New global hydrography derived from spaceborne elevation data. Eos, Trans. Am. Geophys. Union 89, 93–94. doi: 10.1029/2008EO100001
Lejeune, Q., Davin, E. L., Gudmundsson, L., Winckler, J., and Seneviratne, S. I. (2018). Historical deforestation locally increased the intensity of hot days in northern mid-latitudes. Nat. Clim. Change 8, 386–390. doi: 10.1038/s41558-018-0131-z
Lejeune, Q., Seneviratne, S. I., and Davin, E. L. (2017). Historical landcover change impacts on climate: Comparative assessment of LUCID and CMIP5 multimodel experiments. J. Climate 30, 386–390. doi: 10.1175/JCLI-D-16-0213.1
Li, L., Pontoppidan, M., Sobolowski, S., and Senatore, A. (2020). The impact of initial conditions on convection-permitting simulations of a flood event over complex mountainous terrain. Hydrol. Earth Syst. Sci. 24, 771–791. doi: 10.5194/hess-24-771-2020
Liu, Y., Ge, J., Guo, W., Cao, Y., Chen, C., Luo, X., et al. (2023). Revisiting biophysical impacts of greening on precipitation over the Loess Plateau of China using WRF with water vapor tracers. Geophys. Res. Lett. 50, e2023GL102809. doi: 10.1029/2023GL102809
Mlawer, E. J., Taubman, S. J., Brown., P. D, Iacono, M. J., and Clough, S. A. (1997). Radiative transfer for inhomogeneous atmosphere: RRTM, a validated correlated-k model for the long-wave. J. Geophys. Res. 102, 16663–16682. doi: 10.1029/97JD00237
Mortey, E. M., Annor, T., Arnault, J., Inoussa, M. M., Madougou, S., Kunstmann, H., et al. (2023). Interactions between climate and land cover change over West Africa. Land 12, 355. doi: 10.3390/land12020355
Mwanthi, A. M., Mutemi, J. N., Dyer, E., James, R., Opijah, F. J., Webb, T., et al. (2023). Representation of land–atmosphere coupling processes over Africa in coupled model intercomparison project Phase 6. Clim. Dyn. 11, 22. doi: 10.1007/s00382-023-06710-0
Nakanishi, M., and Niino, H. (2004). An improved Mellor–Yamada level-3 model with condensation physics: Its design and verification. Bound.-Layer Meteorol. 112, 1–31. doi: 10.1023/B:BOUN.0000020164.04146.98
Nash, J. E., and Sutcliffe, J. V. (1970). River flow forecasting through conceptual models part I—A discussion of principles. J. Hydrol. 10, 282–290. doi: 10.1016/0022-1694(70)90255-6
Niu, G.-Y., Yang, Z.-L., Mitchell, K. E., Chen, F., Ek, M. B., Barlage, M., et al. (2011). The community Noah land surface model with multiparameterization options (Noah-MP): 1. Model description and evaluation with local-scale measurements. J. Geophys. Res. 116, D12109. doi: 10.1029/2010JD015139
Onencan, A., Kortmann, R., Kulei, F., and Enserin, B. (2016). MAFURIKO: Design of Nzoia Basin Location Based Flood Game. Procedia Eng. 159, 133–140. doi: 10.1016/j.proeng.2016.08.138
Otieno, G., Mutemi, J., Opijah, F., Ogallo, L., Artan, G., and Omondi, H. (2018). The impact of cumulus parameterization on rainfall simulations over East Africa. Atmosphere. Clim. Sci. 8, 355–371. doi: 10.4236/acs.2018.83024
Otieno, G., Mutemi, J., Opijah, F., Ogallo, L., and Omondi, H. (2020). The sensitivity of rainfall characteristics to cumulus parameterization schemes from a WRF Model. Part I: A case study over East Africa during wet years. Pure Appl. Geophys. 177, 1095–1110. doi: 10.1007/s00024-019-02293-2
Pielke, S.r. R. A, Pitman, A., Niyogi, D., Mahmood, R., McAlpine, C., Hossain, F., et al. (2011). Land use/land cover changes and climate: modeling analysis and observational evidence. Wiley Interdiscip. Rev. Clim. Change 2, 828–850. doi: 10.1002/wcc.144
Pradhan, R. K., Markonis, Y., Vargas Godoy, M. R., Villalba-Pradas, A., Andreadis, K. M., Nikolopoulos, E. I., et al. (2022). Review of GPM IMERG performance: A global perspective. Remote Sens. Environ 268, 112754. doi: 10.1016/j.rse.2021.112754
Roe, S., Streck, C., Obersteiner, M., Frank, S., Griscom, B., Drouet, L., et al. (2019). Contribution of the land sector to a 1.5? C world. Nat. Clim. Change 9, 817–828. doi: 10.1038/s41558-019-0591-9
Rummler, T., Arnault, J., Gochis, D., and Kunstmann, H. (2019). Role of lateral terrestrial water flow on the regional water cycle in a complex terrain region: Investigation with a fully coupled model system. J. Geophys. Res. Atmos. 124, 507–529. doi: 10.1029/2018JD029004
Rummler, T., Wagner, A., Arnault, J., and Kunstmann, H. (2022). Lateral terrestrial water fluxes in the LSM of WRF-Hydro: benefits of a 2D groundwater representation. Hydrol. Process. 36, e14510. doi: 10.1002/hyp.14510
Senatore, A., Mendicino, G., Gochis, D. J., Yu, W., Yates, D. N., and Kunstmann, H. (2015). Fully coupled atmosphere-hydrology simulations for the central Mediterranean: Impact of enhanced hydrological parameterization for short and long time scales. J. Adv. Model. Earth Syst. 7, 1693–1715. doi: 10.1002/2015MS000510
Skamarock, W. C., Klemp, B., Dudhia, J., Gill, O., Liu, Z., Berner, J., et al. (2019). A Description of the Advanced Research WRF Version 4. NCAR Technical Note NCAR/TN-556+STR, 145.
Smiatek, G., and Kunstmann, H. (2023). Potential impact of the pan-African Great Green Wall on Sahelian summer precipitation: A global modeling approach with MPAS. Earth Interact. 27, 220013. doi: 10.1175/EI-D-22-0013.1
Sofokleous, I., Bruggeman, A., Camera, C., and Eliades, M. (2023). Grid-based calibration of the WRF-Hydro with Noah-MP model with improved groundwater and transpiration process equations. J. Hydrol. 617, 128991. doi: 10.1016/j.jhydrol.2022.128991
Sy, S., Noblet-Ducoudré, N. D., Quesada, B., Sy, I., Dieye, A. M., Gaye, A. T., and Sultan, B. (2017). Land-surface characteristics and climate in west africa: models' biases and impacts of historical anthropogenically-induced deforestation. Sustainability 9, 1917. doi: 10.3390/su9101917
Sy, S., and Quesada, B. (2020). Anthropogenic land cover change impact on climate extremes during the 21st century. Environ. Res. Lett. 15, 034002. doi: 10.1088/1748-9326/ab702c
Taylor, C. M., de Jeu, R. A. M., Guichard, F., Harris, P. P., and Dorigo, W. A. (2012). Afternoon rain more likely over drier soils. Nature 489, 423–426. doi: 10.1038/nature11377
Wang, X., Zhang, Z., Zhang, B., Tian, L., Tian, J., Arnault, J., et al. (2023). Quantifying the impact of land use and land cover change on moisture recycling with convection-permitting WRF-tagging modeling in the agropastoral ecotone of northern China. J. Geophys. Res. Atmos. 128, e2022JD038421. doi: 10.1029/2022JD038421
Warrach-Sagi, K., Ingwersen, J., Schwitalla, T., Troost, C., Aurbacher, J., Jach, L., et al. (2022). Noah-MP with the generic crop growth model Gecros in the WRF model: Effects of dynamic crop growth on land-atmosphere interaction. J. Geophys. Res. Atmos. 127, e2022JD036518. doi: 10.1029/2022JD036518
Wulfmeyer, V., Branch, O., Warrach-Sagi, K., Bauer, H.-S., Schwitalla, T., and Becker, K. (2014). The Impact of plantations on weather and climate in coastal desert regions. J. Appl. Meteor. Climatol. 53, 1143–1169. doi: 10.1175/JAMC-D-13-0208.1
Zhang, Z., Arnault, J., Wagner, S., Laux, P., and Kunstmann, H. (2019). Impact of lateral terrestrial water flow on land-atmosphere interactions in the Heihe river basin in China: Fully coupled modeling and precipitation recycling analysis. J. Geophys. Res. Atmos. 124, 8401–8423. doi: 10.1029/2018JD030174
Keywords: regional climate modeling, WRF-Hydro, landcover change, vegetation atmosphere feedback, Nzoia basin, East Africa, river discharge, water resources
Citation: Arnault J, Mwanthi AM, Portele T, Li L, Rummler T, Fersch B, Hassan MA, Bahaga TK, Zhang Z, Mortey EM, Achugbu IC, Moutahir H, Sy S, Wei J, Laux P, Sobolowski S and Kunstmann H (2023) Regional water cycle sensitivity to afforestation: synthetic numerical experiments for tropical Africa. Front. Clim. 5:1233536. doi: 10.3389/fclim.2023.1233536
Received: 02 June 2023; Accepted: 18 September 2023;
Published: 03 October 2023.
Edited by:
Michael Bliss Singer, Cardiff University, United KingdomReviewed by:
Zhuoran Duan, Pacific Northwest National Laboratory (DOE), United StatesAnkur Dixit, Cornell University, United States
Copyright © 2023 Arnault, Mwanthi, Portele, Li, Rummler, Fersch, Hassan, Bahaga, Zhang, Mortey, Achugbu, Moutahir, Sy, Wei, Laux, Sobolowski and Kunstmann. This is an open-access article distributed under the terms of the Creative Commons Attribution License (CC BY). The use, distribution or reproduction in other forums is permitted, provided the original author(s) and the copyright owner(s) are credited and that the original publication in this journal is cited, in accordance with accepted academic practice. No use, distribution or reproduction is permitted which does not comply with these terms.
*Correspondence: Joël Arnault, am9lbC5hcm5hdWx0QGtpdC5lZHU=