- Center for Earth System Sciences and Sustainability, Institute for Geology, Universität Hamburg, Hamburg, Germany
To effectively monitor and verify carbon dioxide removal through enhanced weathering (EW), this study investigates the use of soil electrical conductivity (EC) and volumetric water content (θ) as proxies for alkalinity and dissolved inorganic carbon (DIC) in soil water. EC-θ sensors offer a cost-effective and straightforward alternative to traditional soil and water sampling methods. In a lab experiment, three different substrates were treated with NaHCO3 solutions to increase the alkalinity of the soil water and analyze the response. The combination of EC and θ to track the increase in carbonate alkalinity due to EW, and therefore CO2 consumption, is applicable for low cation exchange capacity (CEC) soil-substrates like the used quartz sand. However, the presence of organic material and pH-dependent CEC complicates the detection of clear weathering signals in soils. In organic-rich and clay-rich soils, only a high alkalinity addition has created a clear EC signal that could be distinguished from a non-alkaline baseline with purified water. Cation exchange experiments revealed that the used soil buffered alkalinity input and thereby might consume freshly generated alkalinity, initially mitigating CO2 uptake effects from EW application. Effective CEC changes with pH and pH buffering capacity by other pathways need to be considered when quantifying the CO2 sequestration potential by EW in soils. This should be estimated before the application of EW and should be part of the monitoring reporting and verification (MRV) strategy. Once the soil-effective CEC is raised, the weathering process might work differently in the long term.
1 Introduction
The problem of climate change has been known for decades, and the need for CO2 removal (CDR) from the atmosphere has been highlighted in recent years (IPCC, 2023). The recent AR6 IPCC synthesis report states that CDR is a crucial element in all future emission scenarios that limit global warming to 2°C (Babiker et al., 2022; IPCC, 2023). The use of negative emission technologies (NETs) will likely play a considerable role in climate change mitigation by removing ~10 Gt CO2 yr−1globally by midcentury and 20 Gt CO2 yr−1 needed by the end of the century (NASEM, 2019).
Chemical weathering of minerals is a natural process that has regulated the global carbon cycle on geological timescales (Walker et al., 1981; Berner, 2003). Enhanced weathering (EW) is understood as the acceleration of this natural chemical weathering process by the application of powdered rock to either the land surface or the ocean surface, thereby speeding up the reaction between minerals, water and CO2 (Schuiling and Krijgsman, 2006; Hartmann et al., 2013; Beerling et al., 2020).
Enhanced Weathering (EW) is a promising method that might be able to contribute significantly to the CDR goals (Schuiling and Krijgsman, 2006; Hartmann et al., 2013; Beerling et al., 2020; Goll et al., 2021), with estimated costs ranging from 50 to 200 USD globally (Fuss et al., 2018) and 45 to 472 USD in the Midwestern U.S (Zhang et al., 2023). The global potential of EW has been described by multiple studies (Renforth, 2012; Hartmann et al., 2013; Goll et al., 2021). First terrestrial EW field trials at smaller scales quantify the in-situ weathering rates and amounts of sequestered CO2 (Haque et al., 2020; Larkin et al., 2022).
However, the reliable quantification of carbon dioxide (CO2) sequestration is the most crucial building block for any CDR method to facilitate a CO2 certificate trading scheme. Like for most nature-based solutions, the measurement of CO2 removal by enhanced weathering in soils is relatively complex compared to technical approaches like direct air capture (DAC).
The small number of extensive local field-scale experiments conducted worldwide poses a significant obstacle to obtain a comprehensive evaluation of the EW effectiveness on a global scale. This limitation arises from the diversity of soils worldwide, each with its unique chemical and physical properties, which inhibits the extrapolation of findings from one local experiment to another. To measure the efficacy of this technology for terrestrial experiments, reliable and cost-effective measurements are necessary to facilitate more field trials. Similar to other nature-based NETs, CO2 sequestration quantification, also known as carbon accounting, is manifold (Brander et al., 2021).
In terrestrial EW experiments, finely crushed silicate rock powder is spread on arable land, where it is left to react under elevated pCO2 conditions in the soil (Brook et al., 1983; Romero-Mujalli et al., 2019), amplifying the chemical weathering reaction.
The Eq. 1 shows the chemical weathering reaction of wollastonite (CaSiO3) with carbonic acid (H2CO3). Wollastonite is a simple silicate mineral used here as an example of silicate weathering reactions in general.
The second part (bold) of Eq. 1 shows the weathering products. This idealized equation gives us the upper limit for CO2 sequestration by the weathering process. The released bicarbonate () is contributing to the total alkalinity (TA) of the water. The direct measurement of the TA usually involves acid titration of the water.
As a cheaper measurement to assess TA in natural waters for known environmental conditions, EC was suggested to track sequestered CO2 in the water (Amann and Hartmann, 2022). The amount of dissolved ions drives the EC of an aqueous solution. Those carry charge through the water and thereby conduct electric current.
As EC works as a predictor of TA for some natural waters (surface water or spring water from draining volcanic rock or loess catchment), it is tested to see if this relationship could be useful for alkalinity change detection in bulk soils with unsaturated water conditions. If and how soil bulk electrical conductivity (ECb) changes with added silicate minerals and released weathering products for EW field trials is unknown. The contribution of individual ions to the EC of the water (ECW) can be calculated (McCleskey et al., 2012). The ECW will increase with the released TA in a unique pattern depending on the composition of the dissolved mineral (Amann and Hartmann, 2022). When a specific mineral is added to the soil and chemically weathered by carbonic acid, it will gradually increase the DIC and TA in the soil water, thereby increasing the amount of ions in the soil water and the ECW. An increase in ECW must affect the ECb as well. However, the behavior of a bulk soil is complex because of chemical interactions between the solid and the liquid phase (Merkel and Planer-Friedrich, 2008). The ECb is driven by multiple pathways for electrical conduction, making a model for the contribution of dissolved species to the ECb more sophisticated (Rhoades et al., 1989; Hendrickx et al., 2002).
Different agricultural soil samples were treated with alkaline NaHCO3 solutions to simulate the release of weathering products after EW application to test whether ECb could be used to track the additional weathering signal and, thereby, the conversion of CO2 into TA. It is investigated how the ECb reacts to the added weathering products in the form of Na+ and TA, predominantly in the form of . Soil water samples were taken after the soils were treated with the NaHCO3 solutions to examine how the chemical composition of the soil water was changed.
This study aims to improve the understanding of relevant soil properties for EW experiments and processes that must be considered for quantifying CO2 removal and interpreting ECb data. For example, the CEC and pH buffering capacity of soils have yet to be considered for the assessment of CO2 sequestration. The weathering of non-carbonic soil acids must be accounted for (Dietzen and Rosing, 2023). A better understanding of the cation exchange processes in different soils, soil acidity and bulk soil ECb could facilitate the use of simpler low-cost measurements for carbon accounting of EW.
2 Methods
2.1 Testing soils
Three different substrates were used in this experiment to test the ECb response on the alkaline solution for different soil types. Two of the substrates are agricultural soils, and one substrate is pure quartz sand. The Carbon Drawdown Initiative provided the soils (Carbdown, 2022). The two soil samples originate from arable land in Bramstedt in Northern Germany and Fürth in Southern Germany. Those sites are being used for long-term EW field trials, and the soil samples have been taken before applying the silicate mineral powder on those sites. The soil samples were collected from the upper 30 cm of the soil, representing a typical deeper plowing depth (Baumhardt et al., 2008).
The Bramstedt test site is situated within a fen, an area characterized by wetlands. The field was initially used as grassland and cropland the years before the soil sampling took place. The soil in this location has some peat and a considerable organic matter content, resulting in a dark color. The soil is a strong loamy sand with a clay content of 12–17 %, as determined according to DIN 19682-2 (2014).
The Fürth test site was previously used for agriculture. It has a low inorganic carbon content and much lower organic carbon content than the soil from Bramstedt (Table 1). The soil type is identified as brown earth, which is also known as Cambisol or, for sandy soils, Brunic Arenosol (Amelung et al., 2018). Both types are characterized by little or no soil profile differentiation (IUSS Working Group WRB, 2022). The brown earth can be found in Europe, North- and South America, and southern parts of Siberia (Pehamberger and Gerzabek, 2009), making the findings comparable to other European agricultural sites.
To mimic non-reactive soil with minimal nutrients as well as low organic matter and clay content, resulting in low effective CEC, plain quartz sand (commercially available pool filter sand) was used (Table 1).
Soil samples were air-dried and sieved to 2 mm to break down the soil clods, remove bigger stones, and get a homogeneous mass, destroying any natural soil horizons. Therefore, the following experiments will treat the upper 30 cm soil sample as one homogeneous material.
2.2 Soil analysis
The soil samples for the mineralogical analysis were dried at 40°C and wet-milled. The bulk composition of the soil was measured by X-ray diffraction quantitative phase analysis (QPA, Bruker D8 Advance system).
The total organic carbon (TOC) and total inorganic carbon (TIC) were measured by splitting the soil sample into two representative parts. One part was treated with HCl to remove all TIC from the total carbon content (TC). Both samples were fused by open-system pyrolysis at 1,600–1,800°C, in which the amount of CO2/TC produced was measured by chromatography with the Carlo Erba EA1108 elemental analyzer. The TIC was then determined by subtracting the total organic carbon from the total carbon (TIC = TC − TOC).
The soil samples for the cation exchange capacity (CEC) measurement were dried at 110°C to lose adsorbed water and ground to < 500 μm. The CEC analysis is based on the exchange of the sample with Co-hexamine trichloride [Co(NH3)6]Cl3 (Co-Hex) (Orsini and Remy, 1976; Ciesielski et al., 1997) solution and the subsequent spectrophotometric analysis of the exchanged liquid using a Shimadzu UV-1280.
The Co-Hex solution is added to the dried soil sample. After the exchange reaction, the suspension is centrifuged and filtered, and absorption is measured at a wavelength of 475 nm to determine the concentration of the left Co-Hex ions. The calibration set is composed of different Co-Hex concentrations and blanks. The result gives the effective CEC at ambient pH.
For the pool filter quartz sand as a non-reactive soil example, the parameters were not measured. As the Bramstedt soil sample contains more organic carbon than the Fuerth soil, it is referred to as organic-rich in the following text. It also contains more clay minerals (Table 1), making the soil overall more reactive (Churchman, 2018).
All experiments were conducted in a controlled lab environment at T = 20 °C and pCO2 = 450 ppm, slightly higher than the average global mean atmospheric pCO2 of 418 ppm (Lan et al., 2023). The samples of each site were dug and mixed, then dried and sieved to 2 mm; thus, there will no longer be high pCO2 in the soil pore space.
2.3 Testing solutions
All the different soils were watered with sodium bicarbonate solutions (NaHCO3) with ≥99% purity; for more details, see the datasheet in the supplement. This compound was chosen for carbonate alkalinity creation because of its high solubility [96 g L−1 at 20 °C, (Haynes, 2015)]. One mole of increases the TA of the solution by one acid equivalent (eq) that can be buffered; thus, 1 mol NaHCO3 L−1 equals 1 eq L−1. The concentrations of the different solutions were chosen based on previous column EW experiments conducted using the same organic-rich soil (Li, 2023). They observed TA up to 10 meq L−1 in the percolating soil water of soil columns treated with silicate minerals. NaHCO3 should simulate the released weathering products to avoid the long weathering reaction times when applying silicate rock powder to soils. In this study, the kinetics of the weathering process are not analyzed. Instead, the solutions already contain the weathering products. The solutions were produced volumetrically by weighing in NaHCO3 powder, dissolving, and filling up to the target volume. The solutions used in the experiment have NaHCO3 concentrations of 0, 2.5, 5, 10, and 50 mmol L−1.
2.4 Setup EC𝖻 experiment
The ECb sensor (Dragino LSE01) used in this study is composed of a conductivity meter to get the bulk soil electrical conductivity ECb, a resistance temperature detector (RTD) to measure the soil temperature, and a frequency domain reflectometry (FDR) probe to measure the volumetric water content (θ) with the compensation from soil temperature and electrical conductivity. It is designed to measure θ of saline-alkali soil and loamy soil (mineral soils) and is made for outdoor agricultural use (Dragino, 2022). The sensor is not strictly research-grade because there is just a single internal calibration for θ that could not be adjusted. Still, it was used because the same sensors were used on the test sites in the Carbdown project (Carbdown, 2022) to test them for the assessment of carbon sequestration. The sensor was calibrated for a mineral soil type and not organic-rich soils. Hence, the exact θ values might be biased, and θ will not be interpreted in-depth in this study. The ECb and θ value pairs are not compared for different soils. Nevertheless, sensors should show differences in ECb at constant volumetric water content θ for different NaHCO3 treatments for the same soil.
The sensor converts the measured ECb values to the reference temperature at 25 °C, suppressing the measured values' temperature dependence. It uses the same reference temperature as the ECW measurement of the solutions and soil water, which increases with temperature by about 1–3 % per °C (Robinson and Stokes, 2002).
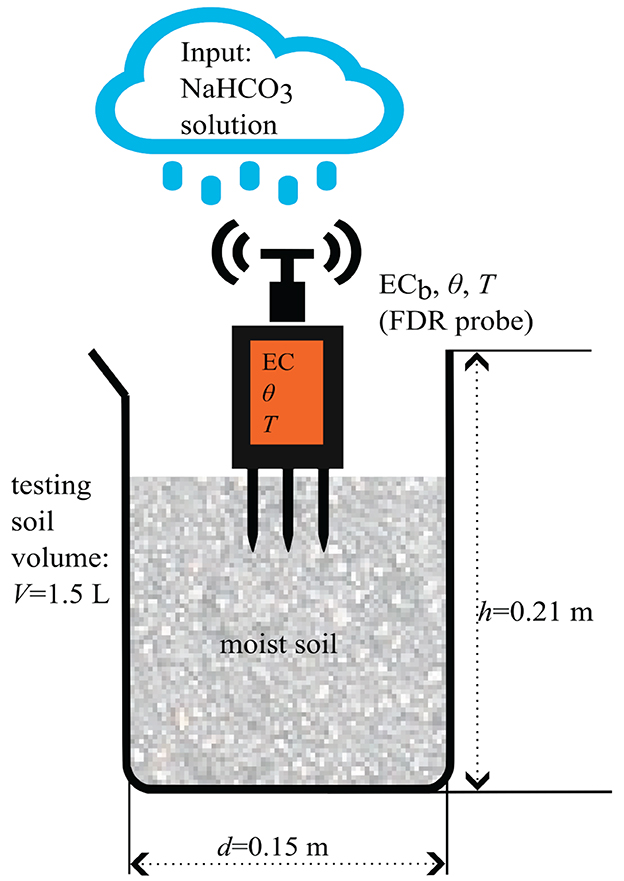
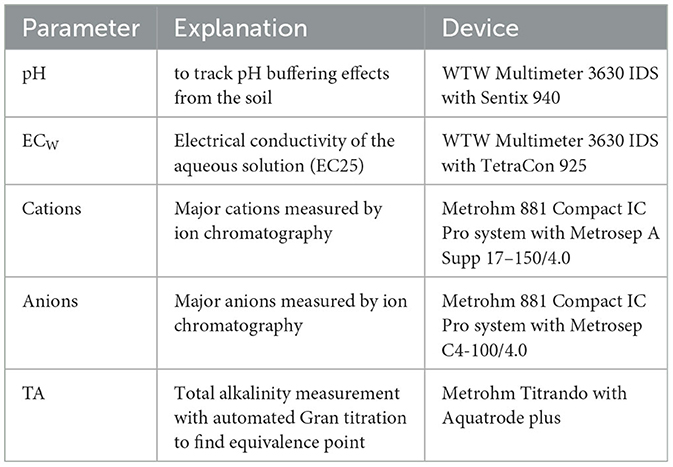
To determine how the ECb reacts to the released weathering products in the soil water (Na+ and ), air-dried soil samples were watered with different NaHCO3 concentrations and purified water as a non-alkaline reference (Figure 1). The ECb, θ and the soil temperature were measured with the Dragino LSE01 probe. In addition, the ECW and the pH of the input solution were measured with the WTW Multimeter 3630 IDS. For further details about the used probes, see Table 2.
For each concentration/experimental run, a container (see Figure 1) was filled with 1.5 L (around 1,700 g) of sieved air-dry soil to ensure a large enough volume for the sensor's electrical field penetration depth and physical size. This sensitive measurement volume of the sensor can be approximated by a cylinder with a height of 10 cm and a 7 cm diameter around the central probe (Dragino, 2022).
The containers were then filled with the NaHCO3 solution in 75 g steps until reaching the soil saturation point, starting from 500 g of added solution for the used soils. After each irrigation step, the soil was mixed manually with a spatula to homogenize the soil water mix. Ten measurements in different sensor positions were taken to minimize the effects of soil heterogeneity and sensor-soil coupling.
2.5 Setup soil reaction experiment
The brown earth from the Fuerth test site was chosen to investigate the reactions of the alkaline NaHCO3 solutions with the soil more closely. It is the soil with a much lower organic matter content; therefore, one would expect a weaker pH buffering reaction. The water of the saturated paste was extracted from this soil. The chemical analysis of the soil water extracts gives a better understanding of the observed ECb signal, as the ECb is mainly a function of the dissolved ions in the soil water (Hendrickx et al., 2002; Corwin and Lesch, 2005). Air-dried soil samples were saturated with the different NaHCO3 solutions. The method used closely follows the method presented by Corwin and Yemoto (2020) for measuring soil salinity.
For each reaction setup, 1,700 g of air-dried soil was mixed with 485 mL of NaHCO3 solution. This ratio was kept constant for all treatments. Therefore, the brown earth was watered with the produced NaHCO3 solution until it reached the saturation point. Following Corwin and Yemoto (2020), it is the point where the soil water mix: (i) surface sparkles, (ii) can flow, (iii) slides freely off a spatula, (iv) is malleable so that when running a spatula through the mix the channel will hold shape and (v) when shaking the container the channel collapses. The soil water mix is called the saturated paste at this saturation point.
Even though it is faster and more effective to extract the soil water at higher water content like 1:1, 1:2, and 1:5 (soil to water ratio) in this experiment, the low saturation level extraction will be used. It is the standard for EC studies as it provides the lowest but sufficient water volume to be analyzed for its chemical composition (Corwin and Yemoto, 2020). It is closer to the natural moisture processes in actual soil. In our case, it represents the actual conditions in the soil of the (θ, ECb) measurements of the ECb experiment setup.
To measure the range of responses the brown earth was irrigated with the same solutions as in the previous experiment of 0, 2.5, 5, 10, and 50 mmol L−1 of NaHCO3.
There are three duplicates to capture the variability and get more reliable results for each NaHCO3 treatment. In total, 15 saturated paste samples (5 NaHCO3 solutions times 3 duplicates) except a third one for the high concentration of 50 mmol L−1 due to the lack of further extraction equipment. After saturating the samples with the solutions, they were stored for 24 h in the fridge inside containers covered with snap-tight lids to avoid evaporation from the sample. In this period, the soil and the solution have time to react, and dissoluble compounds can dissolve in the soil water. After the time had passed, the saturated paste was placed outside the fridge until it reached room temperature again. Then, the soil water of the saturated paste, called saturation extract, was pumped out with vacuum pumps (see Figure 2). The extraction took 1 day, as the soil holds very little free water at the saturation point, and it takes longer to pump it out. After applying the vacuum for 1 day, the saturation extract was directly analyzed for the chemical composition; see Table 2 for further details.
All the soil water samples were filtered with 0.45 μm cellulose acetate (CA) dead-end filtration. All measurements except the ECW and pH were measured in the filtered samples. The ECW probe applies an internal linear temperature compensation to 25°C. All shown ECW values thus are normalized to 25°C.
3 Results
3.1 Bulk soil electrical conductivity (EC𝖻)
3.1.1 Pure quartz sand (non-reactive soil example)
In the quartz sand experiment, the different NaHCO3 treatments are distinguishable (Figure 3). The purified water treatment shows a very low ECb signal for the whole range of θ. This low ECb reflects a low concentration of soluble salts in the quartz sand. The data points have a weak spread and follow the trend lines well.
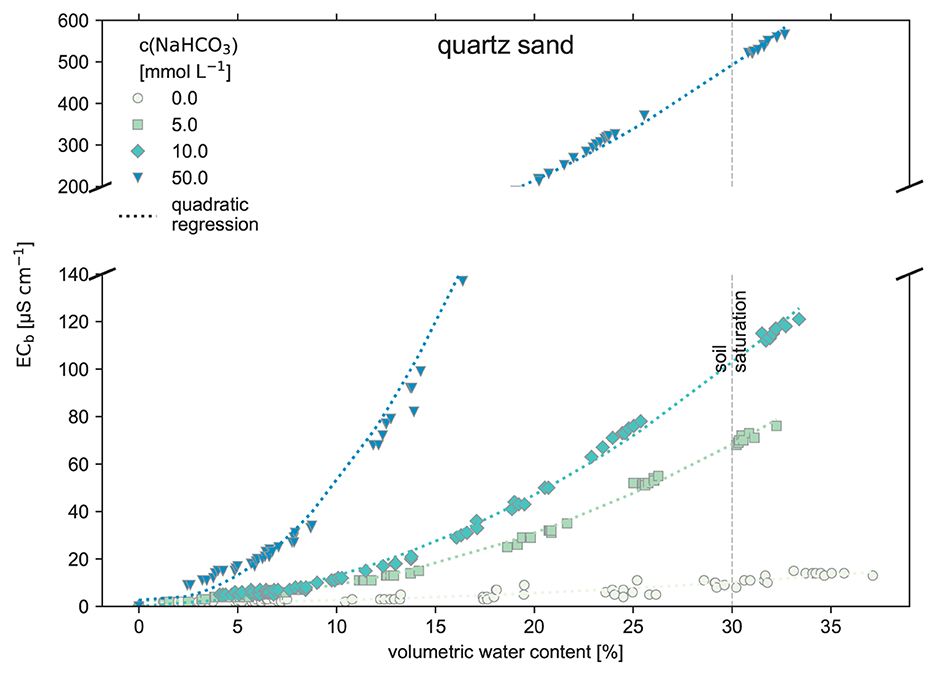
Figure 3. Electrical conductivity measured in the bulk soil (ECb) against the volumetric water content of the soil (θ) using pure quartz sand as the substrate. The quartz sand was watered stepwise with NaHCO3 solution to raise the water content until reaching the saturation point at 30%. The quartz sand mimics a non-reactive, sandy and low effective-CEC soil (raw data: SI).
3.1.2 Brown earth
In the brown earth soil (Figure 4), ECb values are not distinguishable for up to 15% volumetric water content. Only the high 50 mmol L−1 NaHCO3 concentration is visible and distinct from the other low-concentration treatments.
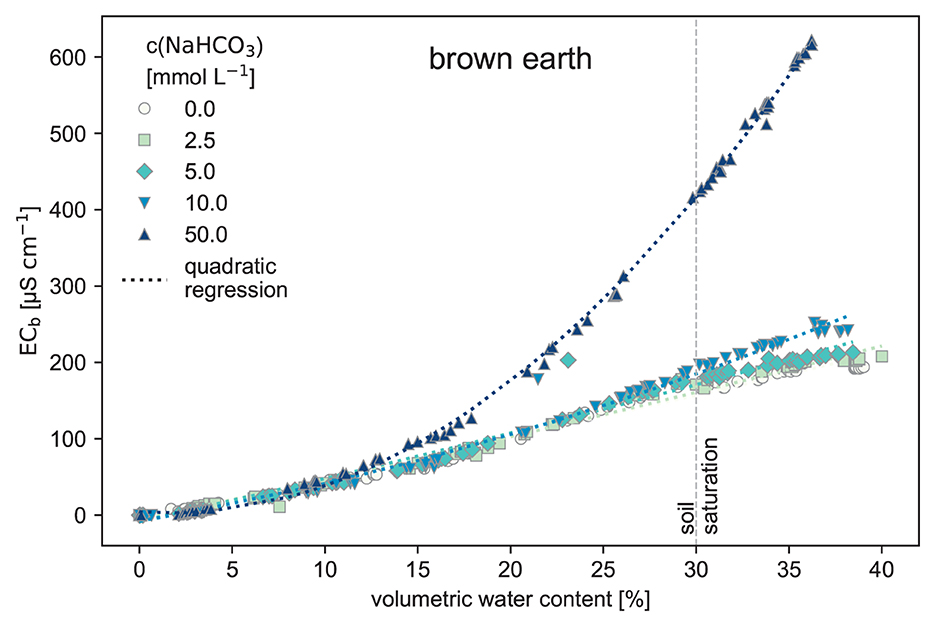
Figure 4. Electrical conductivity measured in the bulk soil (ECb) against the volumetric water content of the soil (θ) using brown earth as the substrate. The brown earth was watered stepwise with NaHCO3 solution to raise the volumetric water content until reaching the saturation point at 30% (raw data: SI).
3.1.3 Organic-rich soil
The organic-rich soil (Figure 5) mostly suppressed the whole signal. All different treatments have the same trend until 20 % volumetric water content. Above 20 % volumetric water content, the high 50 mmol L−1 NaHCO3 concentration can be distinguished from the others. Treatments until 10 mmol L−1 all show the same trend, including some noise.
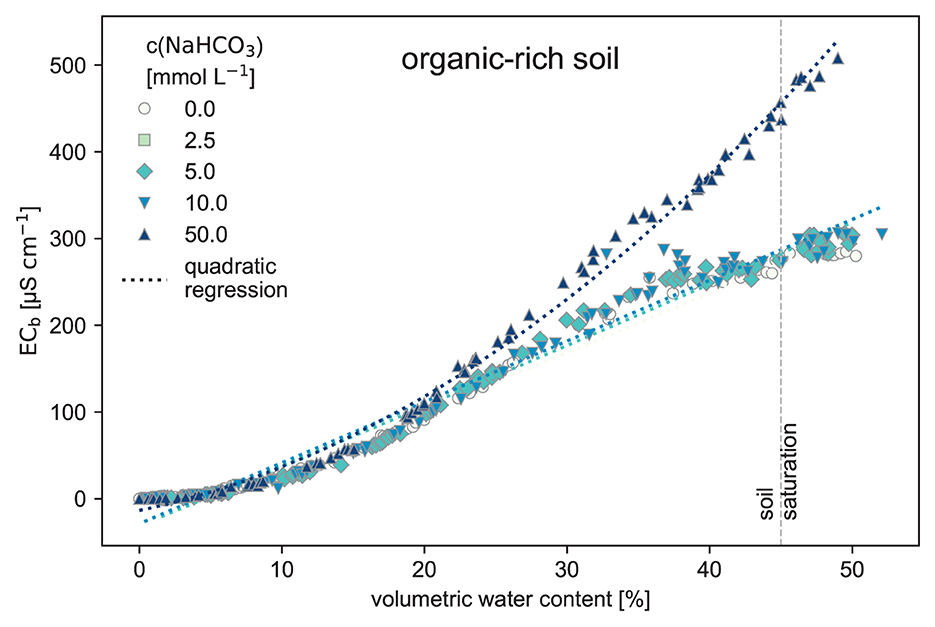
Figure 5. Electrical conductivity measured in the bulk soil (ECb) and the volumetric water content of the soil (θ) using the organic-rich soil as the substrate. The organic-rich soil was watered stepwise with NaHCO3 solution to raise the volumetric water content until reaching saturation point at 45 %. This soil is rich in soluble salts and has a high effective CEC (raw data: SI).
3.2 Brown earth reaction experiment
3.2.1 Electrical conductivity of the soil water (EC𝖶)
The saturation extract experiment results (see Figure 6) reflect the observed ECb response from the first experiment (see Figure 4). Despite the significantly different ECW of the initial NaHCO3 solutions, see orange bars in Figure 6, the saturation extracts for the range of 0 to 5 mmol L−1 NaHCO3, see blue bars, show a very similar ECW. In the next higher concentration of 10 mmol L−1, there is a slight difference in the ECW, but the standard deviation is huge and overlaps with the other error bars; thus, it is insignificant. Only in the high 50 mmol L−1 treatment a significant difference in the ECw of the soil extract compared to the others is visible. It is also interesting to note that compared to the input, the EC dropped significantly for this treatment, whereas for the other treatments, it increased.
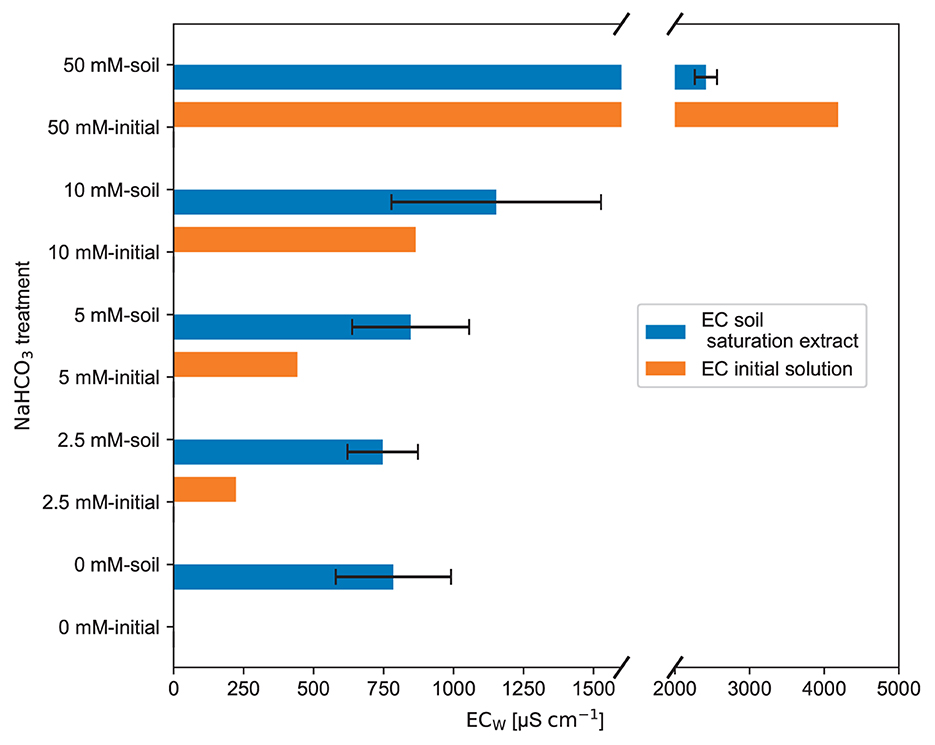
Figure 6. The mean value of the solution electrical conductivity (ECW), measured in the saturation extracts from the brown earth, is presented in this bar chart. This mean value and the black error bars, showing the ±1 standard deviation, were calculated from the three duplicate saturation extract samples for each NaHCO3 solution treatment (raw data: SI).
Electrical conductivity is a collective measure of all dissolved ions in the solution. One might expect that the electrical conductivity of the 0 mmol L−1 soil extract (pure water soil extract) just adds up to the initial conductivity. However, as observable in the further plots, the NaHCO3 solution reacts with the soil solids and partly disappears from the soil water. Thus, the reduction in the Na+ and concentrations leads to a decrease in the ECW.
3.2.2 Cations
The major cations (see Figure 7) reveal an interesting pattern that follows the ECW and TA signals. In all treatments, a similar amount of calcium ions Ca2+, potassium ions K+, and magnesium ions Mg2+ is dissolved. The cations dissolved contributed to the ECW. However, the initially added Na+ concentration was reduced in all cases. As Na+ is the most dominant cation in the NaHCO3 solutions, it will force a reaction of the soil solids with the Na+ cations and lead to cation exchange reactions.
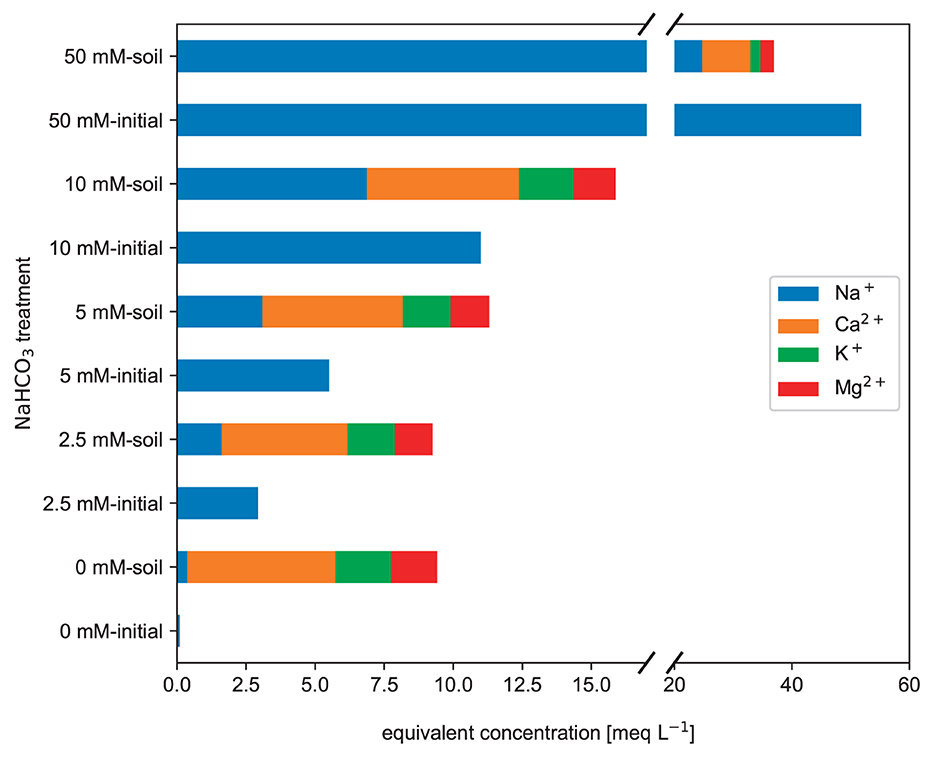
Figure 7. Mean major cations charge equivalent concentrations measured in brown earth saturation extracts. Each parameter was calculated using three duplicate samples for each NaHCO3 solution treatment (raw data: SI).
Especially in the 50 mmol L−1 NaHCO3 treatment, the Na+ concentration was even halved.
3.2.3 Anions
While there are interesting trends in the ECW, TA, and cations, the concentrations of measured anions without the TA do not reveal such a trend (see Figure 8). The dissolution of these anions is unaffected by the different introduced alkaline NaHCO3 solutions. All soil treatments from 0 to 50 mmol L−1 show a similar behavior by releasing a comparable number of anions to the soil water.
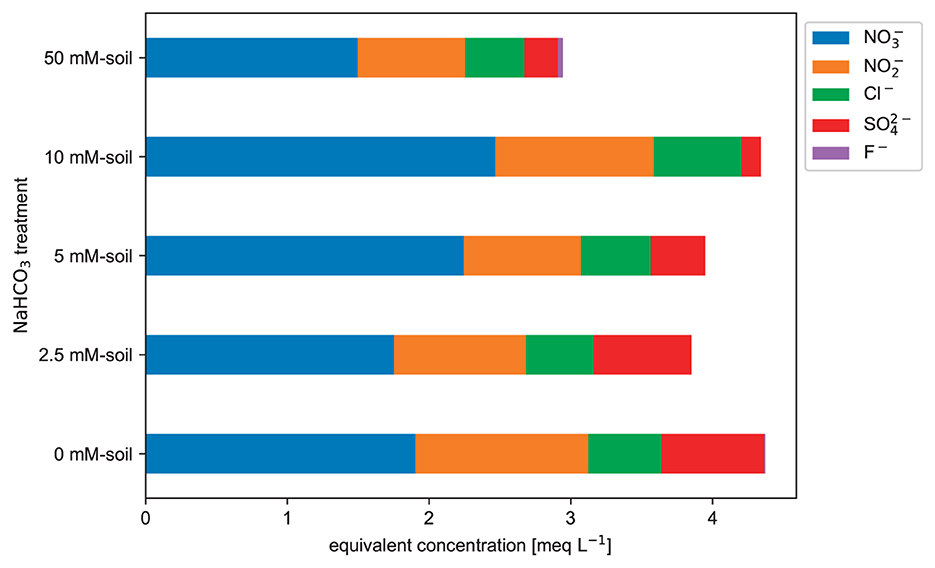
Figure 8. Anion charge equivalent concentrations (without TA) measured in the saturation extract. Values are based on three duplicate samples for each NaHCO3 solution treatment. The liquid extract from the brown earth shows dominance of nitrogen species when excluding TA (raw data: SI).
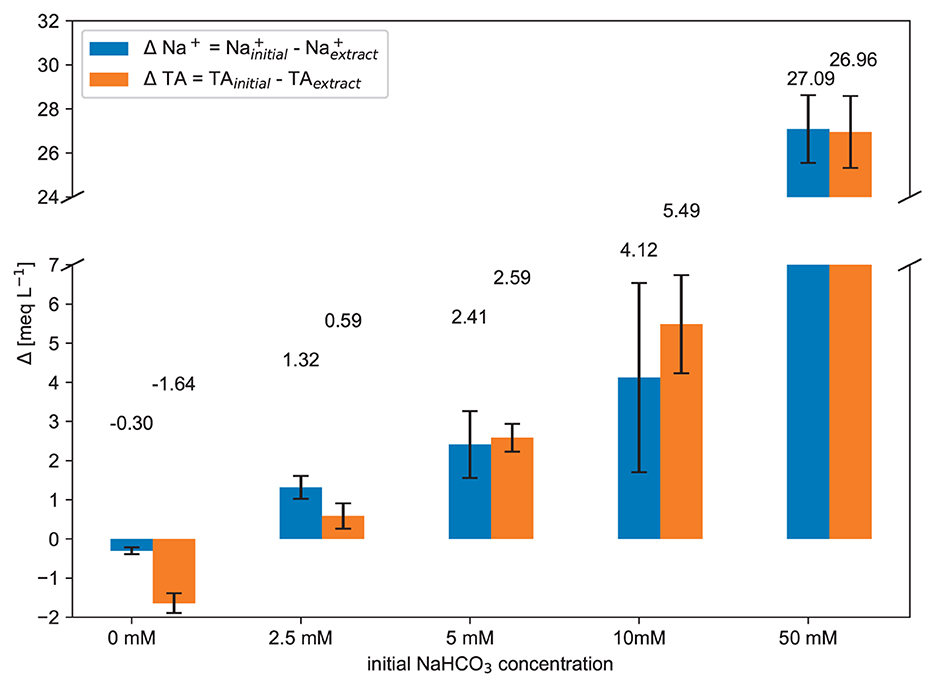
Except for the purified water treatment, the TA in the initial solutions was always reduced after the reaction with the soil. For the 5, 10 and 50 meq L−1 treatments, even less than half of the initial TA was left after the NaHCO3 solution passed through the brown earth.
4 Discussion
Using ECb and θ to predict soil water TA might work for non-reactive or low-reactive substrates, like the used quartz sand, with low effective CEC. A distinguishable ECb response for different NaHCO3 treatments was visible in the pool filter quartz sand in this experiment. However, the brown earth with organic matter and clay minerals buffered the introduced TA proportional to the TA concentration that was added to the soil. Due to this buffering effect, no clear ECb signal is detectable for both analyzed soils (Section 4.1).
The following discussion (Section 4.2.3) describes two potential pathways that could have neutralized the added TA input and led to the observed result. Either the growth in effective CEC has buffered the TA (Section 4.2.3.2) or the precipitation of carbonates (Section 4.2.3.3) inside the soil. When the soil effective CEC grows and the soil releases H+ from acid sources other than carbonic acid, it also shrinks the CO2 removal potential. Understanding this initial buffering effect is crucial for parties searching for a cheap and suitable MRV tool to track the sequestered CO2 (transformed into TA) for EW experiments.
4.1 Bulk soil electrical conductivity response
All three different substrates have in common that the ECb increases with θ (Figures 3–5). Most ECb(θ) plots have a curvilinear shape with the slope changing with θ. Considering the purified water treatments [NaHCO3] = 0 mmol L−1 together with the [NaHCO3] = 50 mmol L−1. The slope is increasing with higher solution concentrations since this also increases the electrical conductivity of the soil water (ECW). All the characteristics mentioned above can be described with the ECb equation from Rhoades et al. (1976):
With a and b as empirical fitting constants for the soil, surface electrical conductivity (ECS), and the soil water electrical conductivity (ECW).
When considering plausible TA levels of up to 10 meq L−1, based on leachate water from soil EW experiments by Li (2023) for the same organic-rich soil (see Figure 5), a reliable separation of ECb, in terms of the different NaHCO3 treatments, is not possible. The initial concentration of the NaHCO3 inputs cannot be derived anymore because the resulting ECb(θ) curves are almost equal for low-concentrated NaHCO3 solution additions. Additionally, the considered high-water contents θ are rare in natural soils and are probably just present after heavy rainfall. Outdoors, the soil moisture is mostly at field capacity (FC) (McCauley et al., 2005). That implies typically smaller θ, so a regression analysis's determination of the different NaHCO3 treatments is even more limited. However, this experiment also showed distinguishable ECb(θ) curves when using pure pool filter quartz sand as substrate (see Figure 3), as the sand conserves the water's chemical properties.
The brown earth and the organic-rich soil buffered a considerable part of the introduced TA (see Figure 9) as the soil reacted with the NaHCO3 solution. The ECb represents how the soil reduced the introduced TA, thereby lowering the ECb signal. Apart from the initially different ECW of the NaHCO3 solutions, the ECb(θ) curves look very similar. However, when the NaHCO3 addition and thus the concentration in the soil water is big enough, it can be detectable with ECb and θ.
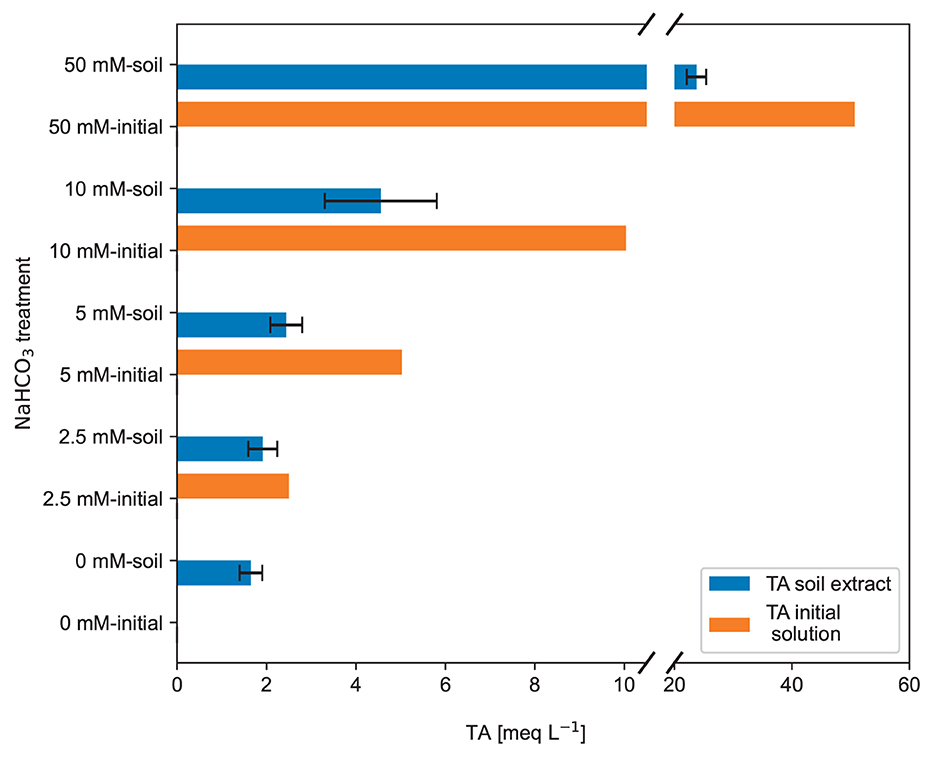
Figure 9. Total alkalinity of the initial produced NaHCO3 sol(orange bars) and the total alkalinity measured in the brown earth saturation extract (after the NaHCO3 solution passed the soil). The TA values are calculated from three duplicate samples for each NaHCO3 solution treatment. The error bars indicate ±1 standard deviation (raw data: SI).
4.2 Soil + NaHCO3 solution reaction experiment
4.2.1 EC𝖶 of the soil extracts
An interesting pattern is shown for the high concentration of 50 mmol L−1 NaHCO3 (see Figure 6). EC of the soil water dropped significantly after interacting with the soil. This drop is reflected in the composition of the soil water, in which the Na+ and TA decreased significantly (Figures 7, 9). For the other NaHCO3 treatments, the ECW increased, most likely due to the dissolution of any available soluble salts, which wasn't a big enough share in the 50 mmol L−1 NaHCO3 treatment to be visible.
4.2.2 Anions in the saturation extract
While there are trends in ECW, TA, and cations, the concentrations of anions without TA do not depend on the different treatments (Figure 8). The concentrations of anions without TA measured in the extracted soil water were in the range of extracted TA, except for the 50 mmol L−1 NaHCO3 treatment (compare Figures 8, 9). The concentrations of anions without TA were unaffected by the different NaHCO3 solution treatments (Figure 8). All NaHCO3 soil treatments from 0 to 50 mmol L−1 show a similar pattern, indicating that the analyzed anions (mainly , and Cl−) do not react or interact much with the introduced NaHCO3 solution.
During the rewetting of the soil with the NaHCO3 solutions, there was an accumulation of CO2 bubbles on the surface of the wet soil, especially for the 50 mmol L−1 NaHCO3 treatment. It has been qualitatively measured with air CO2 meters; thus, no quantitative assessment is presented here. This strong CO2 outgassing during the mixing indicates that part of the introduced was neutralized by H+ rather than adsorbed and exchanged with another anion in the soil. The TA measurement also reflects this drop/neutralization (see Figure 9).
For most soils, the cation exchange capacity (CEC) is bigger than the anion exchange capacity (AEC) (Havlin, 2005). Thus, the measured anions in the soil water are most likely a result of the dissolution of the soil's soluble salts. The different NaHCO3 treatments do not impact the availability of those soluble salts.
In contrast, the soil water's pH value and TA affect the release of cations bound by organic functional groups and clay minerals. The AEC tends to be relevant mainly in soils like spodosols, ultisols, oxisols (Sposito, 2008) and very acidic, heavy-weathered ferralsols present in the tropics as well as volcanic soils (e.g., andosols) (Amelung et al., 2018). Whereas in mildly to moderately weathered soils, as the used brown earth is, the negative surface charge dominates the soil system. This negative surface charge results from the permanent negative surface charge of the 2:1 layer silicates and the organic functional group's pH-dependent negative surface charge (Amelung et al., 2018). This is why the AEC will be neglected in the discussion of the used soils. The further discussion focuses on the concentration changes of cations and TA.
4.2.3 Major cations and TA in the saturation extract
The Na+ and the TA have dropped to a comparable extent (Figure 10). In parallel, strong CO2 outgassing was observed while mixing the dry soil with the NaHCO3 solution. Three possible processes in the soil that can lead to the mentioned results are described in the following text.
4.2.3.1 Biotic CO2 respiration
The soil solution extraction experiment involves time-dependent chemical reactions. Some reactions, like cation exchange and neutralization of acid and base in extreme ranges, occur quickly, while others involving life are slower. However, the observed CO2 outgassing response origin upon rewetting soil might be both abiotic and biotic. It is known that rewetting of dry soil can produce a fast CO2 pulse generated by biotic respiration (Barnard et al., 2020), also known as the Birch effect (Birch, 1958). However, the observed decrease in the introduced TA (mainly carbonate alkalinity) must also have caused CO2 outgassing. Thus, the cation exchange reaction must have also contributed to the observed CO2 pulse. The observed CO2 outgassing is unlikely of a pure biotic nature.
4.2.3.2 Growth of pH-dependent effective CEC releasing H+
The negative surface charge sites, produced by pH-dependent clay minerals and deprotonation of weakly acidic chemical functional groups on soil solids, bind exchangeable cations (Helling et al., 1964; Curtin et al., 1996; Bloom and Skyllberg, 2011). Soil organic matter contributes much to soil pH-dependent CEC (Baldock and Broos, 2011; Bloom and Skyllberg, 2011). The carboxyl and phenolic structural groups can donate protons when the pH in the soil water is raised and act as a buffer (Garcia-Gil et al., 2004; Thomas and Hargrove, 2015). Furthermore, the increase in the soil's pH can lead to a substantial loss in organic carbon (OC) by leaching (Te Pas et al., 2023), but OC was not measured in this study.
The higher the initial solution TA (NaHCO3 concentration), the more organic acid structures and clay minerals will deprotonate and neutralize the TA in the soil water (see Figure 9). This is in line with the theory that the effective CEC increases with the pH (De Villiers and Jackson, 1967; Curtin et al., 1996). Consequently, the soil particles release H+, and one negative charge site is produced where one cation can be adsorbed (Helling et al., 1964; Sims, 2018).
In this study, the loss of TA in soil water is directly proportional to the quantity of introduced TA. As the soil water pH is elevated, more organic functional groups and pH-dependent clays actively buffered the rising pH levels. For organics, the ionization of carboxyl groups is generally complete at pH 8, and the ionization of phenolic groups is complete at pH 11 (Bloom and Skyllberg, 2011). The clay minerals, especially vermiculite and smectite, will also contribute to pH buffering (Bourg and Sposito, 2011). Curtin et al. (1996) provide a regression equation to describe the pH buffering capacity of some Canadian soils (titratable acidity until pH=8) just by two variables. It shows the relative impact of organic carbon and clay content.
Where Y is the titratable acidity to pH 8 [cmol kg−1], OC is the organic carbon content, and clay the clay fraction of the material (both in [kg kg−1]), and ΔpH the pH difference from initial acidic soil to pH=8 (ΔpH = 8 - pHinitial).
The pH buffer strength of the OC is one order of magnitude higher than that of the clay. Even though the organic carbon content in the brown earth was just 1.4 % (Table 1), its contribution to buffer strength might be bigger than the one of the cumulative 9.25 % (Table 1) clay content if the contributions from each fraction are comparable to Eq. 4.
The soil particles must absorb one positive charge for every released H+ ion to maintain charge neutrality in the soil system. Thus, the decrease in TA directly corresponds to changes in the concentration of Na+ ions (see Figure 10). Since Na+ ions are present in the highest concentrations within the NaHCO3 solutions, they have the highest tendency to be bound by the negative charge sites. As the H+ ions were released into the soil water, they neutralized the carbonate alkalinity (), which in turn caused visible CO2 outgassing during the mixing experiments. This underlying process can be exemplified by a reaction involving an organic carboxylic acid structure (X − COOH).
The strength of the acid is defined by the X − COO− anion. The product X − COONa will either stay solid in the soil or might form a complex X − . The 0.45 μm filters might also capture this complex and suppress the contribution to the TA in the final measurement.
However, for real terrestrial EW applications involving silicate minerals, there might be no abiotic CO2 outgassing in this initial phase as the H+ released by soil particles might directly attack the silicate minerals without the carbonic acid weathering step in between producing the carbonate alkalinity first.
The high TA of the 50 mmol L−1 NaHCO3 solution resulted in the deprotonation of more acid structures in the soil. It is yet to be determined which organic functional groups or clays were involved in the chemical reaction Eq. 5 and where all reaction products remain afterwards. The observed decrease in TA, coupled with the drop in Na+ concentration, represents this CEC pH dependence well. The effective CEC grows with the soil pH (De Villiers and Jackson, 1967).
4.2.3.3 Formation of carbonate minerals
The soil humic substance and clay minerals can hold exchangeable Ca2+ cations. These cations are part of the effective CEC of the soil. When the Ca2+ was exchanged with the abundant Na+ cations, the high TA, and the Ca2+ ion concentration in the soil water might have caused rapid precipitation of carbonate minerals. It is called a heterovalent exchange reaction because Na+ and Ca2+ have different valence. Assuming that half of the added Na+ was exchanged with Ca2+, the soil water likely became supersaturated with respect to calcite for all NaHCO3 treatments. In this study, the carbonate content of the soil sample was not measured after the treatment with alkaline solutions. It might have increased, and part of the TA loss was due to the precipitation reaction of carbonate minerals, as the soil exchanged part of the Na+ ions with Ca2+ and Mg2+ ions. This process also leads to CO2 outgassing and removal of TA in the soil water. The process is exemplified in the following reaction equation:
X = clay mineral or organic molecule with negative divalent surface charge.
4.3 Source of errors in the experiments
The Dragino LSE01 sensors are not calibrated precisely enough to accurately measure soil volumetric water content (θ) for all soil types. A specific calibration needs to be done for each soil type to achieve a more precise θ reading. It's important to note that the mineral soil type calibration used may not be suitable for organic-rich soil samples.
Different soils and materials have varying abilities to absorb water. Coarse sand, for example, consists mainly of macropores, while other soils contain finely textured micropores. Additionally, saturation levels and dissolution reactions may change over time, so one needs to consider the time dynamic component for similar experiments. The soil needs sufficient time to absorb the added solution.
The biggest driver of fluctuations in the chemical composition of the soil solution samples is the low water content of the soil. The extracted soil solution sample volume can vary significantly. Therefore, it is recommended to use a different method for ongoing experiments. One approach involves increasing the water content significantly (1:1, 1:2, or 1:5 soil: water ratios) to homogenize everything. A centrifuge can then be used to extract the solution with better efficiency. The vacuum pumps in this experiment might have allowed for preferential pathways and led to different extraction sample volumes. Nevertheless, the low water content was chosen in this experiment to keep it close to the electrical conductivity observed outdoors in the field.
5 Conclusion
The combination of ECb and volumetric water content θ as a proxy for soil water TA to track CO2 sequestration by EW was successfully shown for low CEC quartz sand. However, in organic-rich and clay-rich soils, abundant CEC places and weakly acidic functional groups cause the exchange of ions between water and solids after adding ions simulating EW.
Using ECb and θ as a predictor for any changes in soil water chemical properties requires the initial amount of soil water ions to be known to compensate for its contribution to the ECb. Particularly, the dynamic pH buffering effects and pH-dependent cation exchange processes of the soil need to be quantitatively known to interpret the ECb-θ measurement. An input of an alkaline solution will shift the soil to a higher pH, thereby potentially increasing the CEC, precipitating carbonates and altering the soil system (Figure 10).
As the here used brown earth buffered half of the added TA input, it was not possible with the equipment used to observe significant ECb changes for added solutions with TA concentrations below 10 meq L−1. A significant change in ECb was detectable only for a higher TA concentration input of 50 meq L−1 at high volumetric water content. The alkaline input solution raises the pH of the soil water, leading to the deprotonation of soil acid structures that buffer the pH change and react with to produce CO2 and H2O. This study has shown a significant pH buffering effect, even in soil with a low total organic carbon (TOC) content of 1.4 %. One would expect an even much greater neutralization of alkalinity for soils with higher organic matter content. As long as H+ is deprotonized from the solid phase into the liquid phase, added TA will be neutralized. This behavior should be the case specifically in acidic soils. When the effective CEC increases, and the soil releases H+ from acid sources other than carbonic acid, the full CO2 removal potential of such soils cannot be archived. An initial amount of added TA is consumed to raise the soil pH, also known as the lime requirement (Mclean, 2015). However, once effective CEC is raised and remains at this higher level, CO2 sequestration by weathering silicate minerals and creating carbonate alkalinity might be more effective. Long-term application studies are crucial for future MRV and CO2 sequestration potential calculation. Given the possible combination of soils, climate, and rock powder quality and application rates and frequency, large combinations of tests will be required if the true potential of EW as a CO2 sink should be adequately evaluated.
Data availability statement
The original contributions presented in the study are included in the article/Supplementary material, further inquiries can be directed to the corresponding author.
Author contributions
LR: Conceptualization, Data curation, Formal analysis, Investigation, Methodology, Software, Validation, Visualization, Writing — original draft. TA: Data curation, Investigation, Supervision, Validation, Visualization, Writing — review & editing. JH: Conceptualization, Funding acquisition, Investigation, Methodology, Project administration, Resources, Supervision, Writing — review & editing.
Funding
The author(s) declare financial support was received for the research, authorship, and/or publication of this article. LR, TA, and JH acknowledge funding from the European Union Horizon 2020 framework program for research and innovation (Grant agreement ID: 964545), from the Carbon Drawdown Initiative, and by the Deutsche Forschungsgemeinschaft (DFG, German Research Foundation) under Germany's Excellence Strategy—EXC 2037 CLICCS—Climate, Climatic Change, and Society—Project Number: 390683824, contribution to the Center for Earth System Research and Sustainability (CEN) of Universität Hamburg.
Acknowledgments
We acknowledge the help of Tom Jäppinen (UHH) and Peggy Bartsch (UHH) for valuable contributions from the wet lab and Joscha Becker (UHH) for providing equipment from the soil science laboratory. We thank Mathilde Hagens (WUR), who helped to interpret and discuss the results. We thank Dirk Paessler, Ralf Steffens, and the Carbon Drawdown Initiative (Project Carbdown) for supplying the soil samples and the EC sensors to make this work possible.
Conflict of interest
The authors declare that the research was conducted in the absence of any commercial or financial relationships that could be construed as a potential conflict of interest.
Publisher's note
All claims expressed in this article are solely those of the authors and do not necessarily represent those of their affiliated organizations, or those of the publisher, the editors and the reviewers. Any product that may be evaluated in this article, or claim that may be made by its manufacturer, is not guaranteed or endorsed by the publisher.
Supplementary material
The Supplementary Material for this article can be found online at: https://www.frontiersin.org/articles/10.3389/fclim.2023.1283107/full#supplementary-material
References
Amann, T., and Hartmann, J. (2022). Carbon accounting for enhanced weathering. Front. Clim. 4, 849948. doi: 10.3389/fclim.2022.849948
Amelung, W., Blume, H.-P., Fleige, H., Horn, R., Kandeler, E., Kögel-Knabner, I., et al. (2018). Chemische Eigenschaften und Prozesse, in: Scheffer/Schachtschabel Lehrbuch Der Bodenkunde. Berlin: Springer-Verlag, 173–177.
Babiker, M., Berndes, G., Blok, K., Cohen, B., Cowie, A., Geden, O., et al. (2022). “Cross-sectoral perspectives,” in IPCC, 2022: Climate Change 2022: Mitigation of Climate Change. Contribution of Working Group III to the Sixth Assessment Report of the Intergovernmental Panel on Climate Change (Cambridge: Cambridge University Press), 1245–1354.
Baldock, J. A., and Broos, K. (2011). “Soil organic matter,” in Handbook of Soil Sciences: Properties and Processes (Boca Raton, FL: CRC Press).
Barnard, R. L., Blazewicz, S. J., and Firestone, M. K. (2020). Rewetting of soil: revisiting the origin of soil CO2 emissions. Soil Biol. Biochem. 147, 107819. doi: 10.1016/j.soilbio.2020.107819
Baumhardt, R. L., Jones, O. R., and Schwartz, R. C. (2008). Long-term effects of profile-modifying deep plowing on soil properties and crop yield. Soil Sci. Soc. Am. J. 72, 677–682. doi: 10.2136/sssaj2007.0122
Beerling, D. J., Kantzas, E. P., Lomas, M. R., Wade, P., Eufrasio, R. M., Renforth, P., et al. (2020). Potential for large-scale CO2 removal via enhanced rock weathering with croplands. Nature 583, 242–248. doi: 10.1038/s41586-020-2448-9
Berner, R. A. (2003). The long-term carbon cycle, fossil fuels and atmospheric composition. Nature 426, 323–326. doi: 10.1038/nature02131
Birch, H. F. (1958). The effect of soil drying on humus decomposition and nitrogen availability. Plant Soil 10, 9–31. doi: 10.1007/BF01343734
Bloom, P. R., and Skyllberg, U. (2011). “Soil pH and pH buffering,” in Handbook of Soil Sciences: Properties and Processes, eds. P. M. Huang, Y. Li, and M. E. Sumner (Boca Raton, FL: CRC Press).
Bourg, I. C., and Sposito, G. (2011). “Ion exchange phenomena,” in Handbook of Soil Sciences: Properties and Processes, eds. P. M. Huang, Y. Li, and M. E. Sumner (Boca Raton, FL: CRC Press).
Brander, M., Ascui, F., Scott, V., and Tett, S. (2021). Carbon accounting for negative emissions technologies. Clim. Policy 21, 699–717. doi: 10.1080/14693062.2021.1878009
Brook, G. A., Folkoff, M. E., and Box, E. O. (1983). A world model of soil carbon dioxide. Earth Surf. Process. Landf. 8, 79–88. doi: 10.1002/esp.3290080108
Carbdown (2022). Carbon Drawdown Initiative (Home). Available online at: https://www.carbon-drawdown.de/home-en (accessed September 10, 2023).
Churchman, G. J. (2018). Game changer in soil science. Functional role of clay minerals in soil. J. Plant Nutr. Soil Sci. 181, 99–103. doi: 10.1002/jpln.201700605
Ciesielski, H., Sterckeman, T., Santerne, M., and Willery, J. P. (1997). Determination of cation exchange capacity and exchangeable cations in soils by means of cobalt hexamine trichloride. Effects of experimental conditions. Agronomie 17, 1–7. doi: 10.1051/agro:19970101
Corwin, D. L., and Lesch, S. M. (2005). Apparent soil electrical conductivity measurements in agriculture. Comput. Electron. Agric. 46, 11–43. doi: 10.1016/j.compag.2004.10.005
Corwin, D. L., and Yemoto, K. (2020). Salinity: electrical conductivity and total dissolved solids. Soil Sci. Soc. Am. J. 84, 1442–1461. doi: 10.1002/saj2.20154
Curtin, D., Campbell, C., and Messer, D. (1996). Prediction of Titratable Acidity and Soil Sensitivity to pH Change. Hoboken: Wiley Online Library.
De Villiers, J. M., and Jackson, M. L. (1967). Cation exchange capacity variations with pH in Soil clays. Soil Sci. Soc. Am. J. 31, 473–476. doi: 10.2136/sssaj1967.03615995003100040017x
Dietzen, C., and Rosing, M. T. (2023). Quantification of CO2 uptake by enhanced weathering of silicate minerals applied to acidic soils. Int. J. Greenh. Gas Control 125, 103872. doi: 10.1016/j.ijggc.2023.103872
DIN 19682-2 (2014). Bodenbeschaffenheit_- Felduntersuchungen_- Teil_2: Bestimmung der Bodenart. Berlin: Beuth Verlag GmbH. doi: 10.31030/2147102
Fuss, S., Lamb, W. F., Callaghan, M. W., Hilaire, J., Creutzig, F., Amann, T., et al. (2018). Negative emissions—Part 2: Costs, potentials and side effects. Environ. Res. Lett. 13, 063002. doi: 10.1088/1748-9326/aabf9f
Garcia-Gil, J. C., Ceppi, S. B., Velasco, M. I., Polo, A., and Senesi, N. (2004). Long-term effects of amendment with municipal solid waste compost on the elemental and acidic functional group composition and pH-buffer capacity of soil humic acids. Geoderma 121, 135–142. doi: 10.1016/j.geoderma.2003.11.004
Goll, D. S., Ciais, P., Amann, T., Buermann, W., Chang, J., Eker, S., et al. (2021). Potential CO2 removal from enhanced weathering by ecosystem responses to powdered rock. Nat. Geosci. 14, 545–549. doi: 10.1038/s41561-021-00798-x
Haque, F., Santos, R. M., and Chiang, Y. W. (2020). CO2 sequestration by wollastonite-amended agricultural soils – an Ontario field study. Int. J. Greenh. Gas Control 97, 103017. doi: 10.1016/j.ijggc.2020.103017
Hartmann, J., West, A. J., Renforth, P., Köhler, P., De La Rocha, C. L., Wolf-Gladrow, D. A., et al. (2013). Enhanced chemical weathering as a geoengineering strategy to reduce atmospheric carbon dioxide, supply nutrients, and mitigate ocean acidification. Rev. Geophys. 51, 113–149. doi: 10.1002/rog.20004
Havlin, J. L. (2005). “Fertility,” in Encyclopedia of Soils in the Environment, eds. Hillel, D. Oxford: Elsevier, 10–19.
Haynes, W. M. (2015). CRC Handbook of Chemistry and Physics, 96th Edition. Boca Raton: CRC Press, 194.
Helling, C. S., Chesters, G., and Corey, R. B. (1964). Contribution of organic matter and clay to soil cation-exchange capacity as affected by the ph of the saturating solution. Soil Sci. Soc. Am. J. 28, 517–520. doi: 10.2136/sssaj1964.03615995002800040020x
Hendrickx, J. M. H., Wraith, W. J., Corwin, D. L., and Gary, K. R. (2002). 6.1 solute content and concentration, in: methods of soil analysis: part 4 physical methods. Soil Sci. Soc. Am. J. 2002, 1253–1321. doi: 10.2136/sssabookser5.4.c54
IPCC (2023). Climate change 2023: Synthesis Report. Contribution of Working Groups I, II and III to the Sixth Assessment Report of the Intergovernmental Panel on Climate Change. Geneva: IPCC, 35–115.
IUSS Working Group WRB (2022). “World reference base for soil resources,” in International Soil Classification System for Naming Soils and Creating Legends for Soil Maps, 4th ed. Vienna: International Union of Soil Sciences (IUSS).
Kazak, E. S., and Kazak, A. V. (2020). Experimental features of cation exchange capacity determination in organic-rich mudstones. J. Nat. Gas Sci. Eng. 83, 103456. doi: 10.1016/j.jngse.2020.103456
Lan, X., Tans, P., Thoning, K., and NOAA Global Monitoring Laboratory (2023). Trends in Globally-Averaged CO2 Determined from NOAA Global Monitoring Laboratory Measurements. NOAA Global Monitoring Laboratory. doi: 10.15138/9N0H-ZH07
Larkin, C. S., Andrews, M. G., Pearce, C. R., Yeong, K. L., Beerling, D. J., Bellamy, J., et al. (2022). Quantification of CO2 removal in a large-scale enhanced weathering field trial on an oil palm plantation in Sabah, Malaysia. Front. Clim. 4, 959229. doi: 10.3389/fclim.2022.959229
Li, X. (2023). The BasaltWeathering Efficiency in High Organic Content Soil. [Manuscript in preparation].
McCauley, A., Jones, C., and Jacobsen, J. (2005). Basic soil properties. Soil Water Manag. Module 1, 1–12. Available online at: https://landresources.montana.edu/swm/
McCleskey, R., Nordstrom, D., Ryan, J., and Ball, J. (2012). A new method of calculating electrical conductivity with applications to natural waters. Geochim. Cosmochim. Acta 77, 369–382. doi: 10.1016/j.gca.2011.10.031
Mclean, E. O. (2015). “Soil pH and Lime Requirement,” in Agronomy Monographs. American Society of Agronomy, eds. A. L. Page. Madison, WI: Soil Science Society of America, 199–224.
Merkel, B. J., and Planer-Friedrich, B. (2008). Groundwater Geochemistry - A Practical Guide to Modeling of Natural and Contaminated Aquatic Systems, 2nd ed. Berlin Heidelberg: Springer Science and Business Media.
NASEM (2019). Negative Emissions Technologies and Reliable Sequestration: A Research Agenda. Washington, D.C.: National Academies Press.
Orsini, L., and Remy, J. (1976). Utilisation du chlorure de cobaltihexamine pour la détermination simultanée de la capacité d'échange et des bases échangeables des sols. Sci Sol 4, 269–275.
Pehamberger, A., and Gerzabek, M. (2009). Die Braunerde als häufigster Bodentyp Österreichs. Bodenkult. 53:2. Available online at: https://boku.ac.at/en/bib/themen/die-bodenkultur/inhalte/band-60-2009
Renforth, P. (2012). The potential of enhanced weathering in the UK. Int. J. Greenh. Gas Control 10, 229–243. doi: 10.1016/j.ijggc.2012.06.011
Rhoades, J., Raats, P. A. C., and Prather, R. (1976). Effects of liquid-phase electrical conductivity, water content, and surface conductivity on bulk soil electrical conductivity1. Soil Sci. Soc. Am. J. 40, 651–655. doi: 10.2136/sssaj1976.03615995004000050017x
Rhoades, J. D., Manteghi, N. A., Shouse, P. J., and Alves, W. J. (1989). Soil electrical conductivity and soil salinity: new formulations and calibrations. Soil Sci. Soc. Am. J. 53, 433–439. doi: 10.2136/sssaj1989.03615995005300020020x
Robinson, R. A., and Stokes, R. H. (2002). Electrolyte Solutions: Second Revised Edition. Chelmsford, MA: Courier Corporation.
Romero-Mujalli, G., Hartmann, J., Börker, J., Gaillardet, J., and Calmels, D. (2019). Ecosystem controlled soil-rock pCO2 and carbonate weathering – constraints by temperature and soil water content. Chem. Geol. 527, 118634. doi: 10.1016/j.chemgeo.2018.01.030
Schuiling, R. D., and Krijgsman, P. (2006). Enhanced weathering: an effective and cheap tool to sequester Co2. Clim. Change 74, 349–354. doi: 10.1007/s10584-005-3485-y
Sims, J. T. (2018). “Lime Requirement,” in SSSA Book Series. Soil Science Society of America, American Society of Agronomy, eds. D. L. Sparks, A. L. Page, P. A. Helmke, R. H. Loeppert, P. N. Soltanpour, M. A. Tabatabai, C. T. Johnston, and M. E. Sumner (American Society of Agronomy: Madison, WI), 491–515.
Te Pas, E. E. E. M., Hagens, M., and Comans, R. N. J. (2023). Assessment of the enhanced weathering potential of different silicate minerals to improve soil quality and sequester CO2. Front. Clim. 4, 954064. doi: 10.3389/fclim.2022.954064
Thomas, G. W., and Hargrove, W. L. (2015). “The Chemistry of Soil Acidity,” in Agronomy Monographs. American Society of Agronomy, Crop Science Society of America, eds. Adams, F. (Madison, WI: Soil Science Society of America), 3–56.
Walker, J. C., Hays, P., and Kasting, J. F. (1981). A negative feedback mechanism for the long-term stabilization of Earth's surface temperature. J. Geophys. Res. Oceans 86, 9776–9782. doi: 10.1029/JC086iC10p09776
Keywords: soil electrical conductivity, alkalinity, cation exchange capacity, soil organic matter, pH buffering capacity, enhanced weathering, carbon accounting, monitoring reporting and verification (MRV)
Citation: Rieder L, Amann T and Hartmann J (2024) Soil electrical conductivity as a proxy for enhanced weathering in soils. Front. Clim. 5:1283107. doi: 10.3389/fclim.2023.1283107
Received: 25 August 2023; Accepted: 26 December 2023;
Published: 11 January 2024.
Edited by:
Kwon Rausis, BluMetric Environmental Inc., CanadaReviewed by:
Davide Ciceri, Agroplantae, United StatesJames Campbell, Heriot-Watt University, United Kingdom
Copyright © 2024 Rieder, Amann and Hartmann. This is an open-access article distributed under the terms of the Creative Commons Attribution License (CC BY). The use, distribution or reproduction in other forums is permitted, provided the original author(s) and the copyright owner(s) are credited and that the original publication in this journal is cited, in accordance with accepted academic practice. No use, distribution or reproduction is permitted which does not comply with these terms.
*Correspondence: Lukas Rieder, bHVrYXMucmllZGVyLmNsaW1hdGVAZ21haWwuY29t
 Lukas Rieder
 Thorben Amann
 Jens Hartmann
