 Orla O'Neill
 Guus J. M. Velders
 Bishawjit Mallick
 Kelsea Best
- 1Institute for Marine and Atmospheric Research Utrecht, Utrecht University, Utrecht, Netherlands
- 2Faculty of Geoscience, Utrecht University, Utrecht, Netherlands
- 3Department of Civil, Environmental & Geodetic Engineering, Ohio State University, Columbus, OH, United States
Introduction: There is fear that climate change will lead to the displacement of millions of people in the next 100 years. This has led to increased academic interest in estimating the trends of climate-related migration. Bangladesh is particularly vulnerable to climate change and is very likely to experience mass climate migration before the end of the century. Efforts have been made to forecast this climate migration using agent based modeling. Less attention has been paid to how the physical climate is represented in these models.
Methods: We address this gap, by developing an agent based model which takes dynamic climate input from climate models, i.e. data on temperature, precipitation and wind speed. It translates climate scenario data from the Shared Socioeconomic Pathways (SSPs) into a likelihood that a region in Bangladesh will experience extreme weather (heatwaves, floods, and cyclones) and finds the possible migration outcomes. It can run on an upazila level, the smallest administrative division in Bangladesh.
Results: The model shows that there will be an accumulative number of over 22 million internal climate migrants in Bangladesh by 2050, with most of the migrants originating from the center of the country and migrating to other upazilas in the center and the southeast.
Discussion: The inclusion of different types of extreme weather events is used to try to project the spatial movement of migrants. The projected number of migrants found is much greater than other studies in this area, but the locations that they move between remains the same.
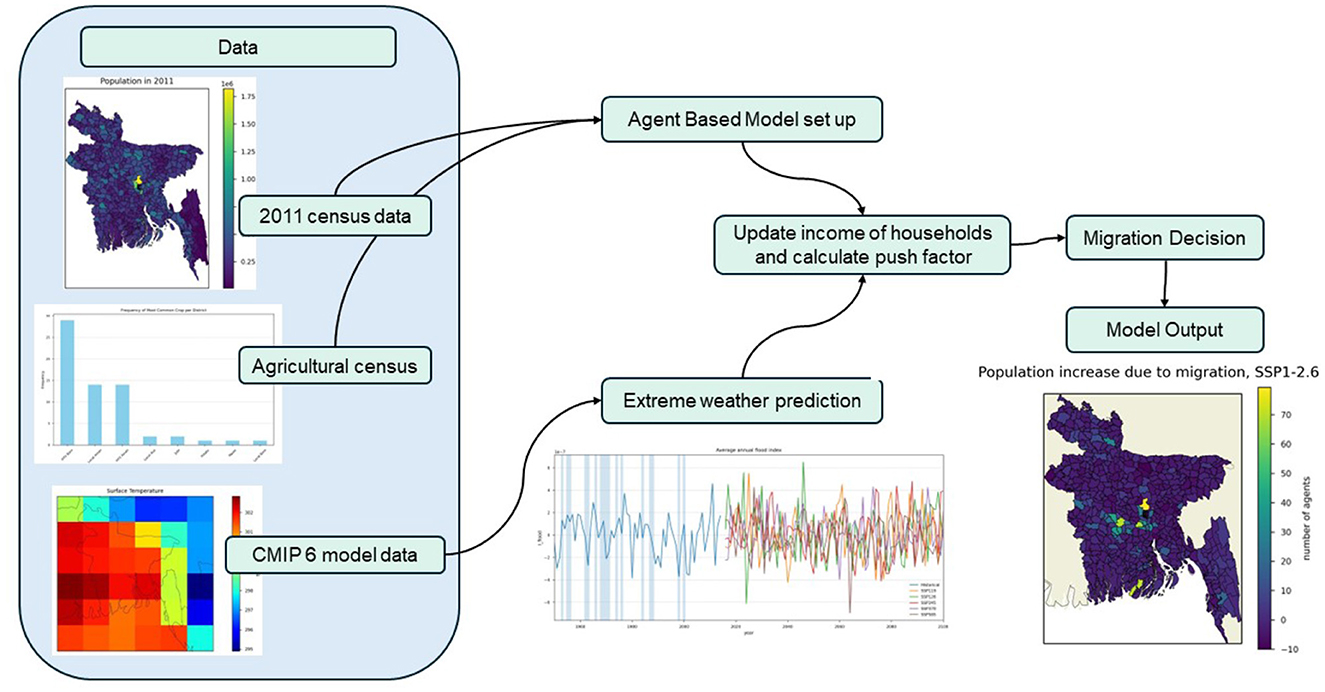
Graphical Abstract.
Highlights
• An agent based model is developed using projections of dynamic climate data and statistical population data.
• People's internal migration involves moving from high-risk zones to regions with better employment prospects and lower environmental risks.
• The model shows that there will be over 22 million internal climate migrants in Bangladesh by 2050.
1 Introduction
Climate change is projected to cause many changes around the world. There is fear that these changes will bring mass migration as changes in the local environment render vast areas around the world uninhabitable. As climate change develops, there is a greater chance that the factors leading to migration will be exacerbated (Perch-Nielsen et al., 2008). There are questions about how founded these fears are, as climate migration research is still developing and it is uncertain what effect climate change might actually have on migration patterns (Boas et al., 2019, Gray and Mueller (2012)).
Bangladesh is a country particularly vulnerable to climate change, making it susceptible to climate migration. The country often experiences tropical cyclones, floods, storm surges and many other extreme weather events (Dastagir, 2015). The frequency and intensity of these disasters are expected to worsen with climate change (Seneviratne et al., 2021). Bangladesh is also one of the most densely populated countries in the world, which increases its vulnerability to climate change (Khan et al., 2021). If climate change is going to change migration patterns, then this change will very likely occur in Bangladesh.
Modeling climate migration in Bangladesh is an important area of study. In order for a community to adequately adapt to the changes that migration brings, projections of migration patterns must be made. Climate migration in Bangladesh has been modeled by Hassani-Mahmooei and Parris (2012), Bell et al. (2021), and Best et al. (2021). All of these studies have produced different results. Hassani-Mahmooei and Parris (2012) found that migration was away from the coast and toward the center of the country while Bell et al. (2021) found that migration would be toward the coast. More research is therefore needed to clarify the expected future of migration patterns in Bangladesh.
Migration modeling is often projected by calculating the push and pull factors of a situation. These are the undesirable aspects of life at the place of origin (push), and the desirable living conditions of another location (pull). If the push and pull factors are large enough, a person will likely migrate to improve their standard of living (Lee, 1966). Climate change will likely affect both push and pull factors, as living conditions everywhere are impacted.
One area that previous climate migration models of Bangladesh could be improved on is the input of climate as a push factor. The climate input of these models is either static, meaning that the effects of climate change do not change with time (e.g., Best et al., 2021), or randomized, meaning that climate shocks occur randomly in time (e.g., Hassani-Mahmooei and Parris, 2012; Best et al., 2025). ABMs that consider a non-static or non-random climate exist for other countries (e.g., Trinh and Munro, 2023; Tierolf et al., 2023; Kniveton et al., 2011), but this has yet to be included in ABMs modeling climate migration in Bangladesh.
ABMs with a dynamic climate component are able to consider the indirect effects that meteorological variability can have on migration, like in Kniveton et al. (2011), where the relationship between precipitation and factors such as employment opportunities. However, these ABMs often only include one kind of climate effect, for example, Tierolf et al. (2023) considered only the impact of coastal flooding on migration. Climate change will affect the frequency of many different kinds of extreme events which can have an impact on climate migration.
To accurately look at how the climate will affect migration patterns in Bangladesh, the dynamics of the climate should be included in these migration models. This can be done by looking at how we predict extreme weather events that cause migration in a changing climate.
Agriculture is an important sector in Bangladesh. In 2010, 47.33% of the labor force was employed in agriculture, forestry and fishery. In 2015, agriculture and forestry contributed to 12.27% of GDP (Rahman, 2017). Agricultural activities are very vulnerable to climate change and variations in the climate can lead to a boost or a decline in agricultural yield and income. In Bangladesh, current climate trends are believed to be responsible for a loss of around 2.75% of crop yield per harvest (Hasan and Kumar, 2021).
Most farms in Bangladesh are small and are run at a household level (Rahman, 2017). For these household farms to survive climate change-exacerbated extreme weather, climate adaptation strategies need to be pursued. There are many forms that adaptation strategies can take, for example, insurance policies (Hill et al., 2019). Migration has been shown to be an effective adaptation strategy in Bangladesh as it allows for diversification of income (Martin et al., 2014), or can improve the adoption of on-farm adaptations (Solomon et al., 2024). A decrease in agricultural income of 1 percentage point due to climate change related causes leads to about a 3 percentage point increase in the likelihood that a household will pursue climate change adaptation strategies. This includes an increase of 1.43 percentage points in the likelihood that a household will consider migration options (Delaporte and Maurel, 2018).
The purpose of this study was to see if it is possible to use data from the sixth Coupled Model Intercomparison Project (CMIP6) to predict future extreme weather events, project the effects that it could have on agriculture, and then use these predictions as an inputted push factor in an agent based model to predict migration patterns in Bangladesh. The effects of multiple types of extreme weather, namely flooding, heatwaves and cyclones, on migration patterns were investigated, and methods of predicting them from CMIP6 data were developed. A model like this would help Bangladesh plan for migrants and give support to communities that are expected to receive a large amount of migrants.
Section 2 covers the data used and discusses the model setup. Section 3 then will present the results of the model and will discuss them. Finally, Section 4 will conclude and summarize this research.
2 Methods
2.1 Data
Bangladesh is divided into 495 administrative regions called upazilas. They have populations between 10,626 and 1,820,374 people and areas between 127.87 and 2,829 km2. A table with more details on the mean and range of data on upazilas is summarized in Table 1. The migration model in this study runs at an upazila level. The map used for the borders of the upazilas and for the rivers and water bodies in Bangladesh is from OCHA Regional Office for Asia and the Pacific and was downloaded from the Humanitarian Data Exchange website (OCHA, 2020; OCHA, 2018).
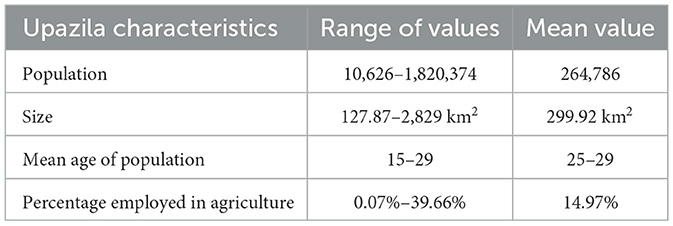
Table 1. A summary of upazila characteristics based on data from the 2011 census (Statistics and informatics division, Bangladesh Bureau of Statistics, Government of the People's Republic of Bangladesh, 2011). Mean age is in ranges as the BBS census only includes these.
To model the projected climate for Bangladesh, data from one sixth Coupled Model Intercomparison Project (CMIP6) model was used. The model used was the Meteorological Research Institute Earth System Model Version 2.0 (MRI-ESM2.0). This model was used because it showed a good ability to reproduce observed data of the surface temperature, surface wind speed and perception for future scenarios (Eyring et al., 2021). The frequency of the data was monthly and the resolution of the grid was 100 km. Data for surface temperature, precipitation and wind speed are used. Five different Shared Socio-economic Pathways (SSPs), SSP1-1.9, SSP1-2.6, SSP2-4.5, SSP3-7.0, and SSP5-8.5, and the historical scenarios were used (Yukimoto et al., 2019).
The data was downscaled using the interpolation method provided by Hoyer and Hamman (2017) to a 50 km resolution grid. Then the data was assigned to each upazila by finding the central coordinate of each upazila in the map used and finding the corresponding data point in the downscaled CMIP6 data.
Data on the population of Bangladesh from the 2011 census was downloaded from the Bangladesh Bureau of Statistics (BBS) website (Statistics and informatics division, Bangladesh Bureau of Statistics, Government of the People's Republic of Bangladesh, 2011). This includes information on population and household per upazila, employment sector and age ranges.
Agricultural and crop data for each administrative division was taken from the BBS Agricultural Census 2016 (Statistics and informatics division, Bangladesh Bureau of Statistics, Government of the People's Republic of Bangladesh, 2017). The most common crop type for each division was then assigned to each of the upazilas in that region as the crop type to be considered.
2.2 Creating indices for extreme weather event prediction
In order to treat climate change as a push factor in this migration model, the likelihood of extreme weather events is found from the CMIP6 data. The extreme weather events considered in this study are floods, heatwaves, and cyclones. These were chosen as they are relatively common extreme weather events in Bangladesh and are expected to increase in frequency and intensity with climate change (Dastagir, 2015; Choi et al., 2021; Khan et al., 2020). These extreme events harm the agricultural industry (Hasan and Kumar, 2021; Heinicke et al., 2022) and have been identified as the factors most likely to induce environmental migration in Bangladesh (Perch-Nielsen et al., 2008).
This section details how the likelihood of each event is found for each event type.
2.2.1 Flood prediction
An index for flood prediction was developed by Deo et al. (2019) for two cities in Bangladesh: Dhaka and Bogra. It bases the index on the precipitation in the area over the past year according to the equation:
with the effective precipitation, or the sum of daily rainfall over the past year with a time-dependent reduction fraction, and Pm being the total rainfall m days before the day you are calculating the index for. is the mean annual maximum PE for a given historical period. In this case the historic period is the years 1850 to 2015. A positive value of IF indicates a risk of flooding. They found that the intensity and timing of historic floods were captured well by the index, but that there were still some inaccuracies (Deo et al., 2019). The original index was calculated using daily values of precipitation. Since the model developed here uses monthly data, the index and its components were modified to accommodate that. The modified equation for effective precipitation is:
PEnew = 24(P1 + 0.39P2 + 0.28P3 + 0.22P4 + 0.17P5 + 0.14P6 + 0.11P7 + 0.09P8 + 0.07P9 + 0.05P10 + 0.03P11 + 0.02P12)PN is the average precipitation with N = 1 being the current month and N>1 being the value for (N−1) months ago.
Deo et al. (2019) developed this index based on two locations that are found on rivers: Bogra and Dhaka. Since the distance to rivers and water bodies is a factor that determines flood risk (Roy et al., 2021), the index was edited so that this could be taken into account. A river map was used to find the distance of each upazila from major rivers in degrees, with the smallest value being 0 and the largest being 0.9051. This was then turned into a distance index, called d, by subtracting from 1, so that 1 means there is a river in the upazila and 0.0949 being the furthest away from a river. The flood index was then multiplied by d to give the final value.
The final equation used for the flood risk in this study is:
was found over the historical CMIP6 model data. To keep with historical frequency and to only take into account more damaging floods, it was taken that there was a risk of flood for numbers above 0.2.
2.2.2 Heatwave prediction
Nissan et al. (2017) created a definition for a heatwave in Bangladesh: a heatwave is a period with “elevated minimum and maximum daily temperatures over the 95th percentile for 3 consecutive days.” They found that there is an increase in the death rate of about 20% during these periods. This definition is similar to other definitions given for other countries (Tong et al., 2015; Kent et al., 2014).
As the model developed runs with monthly resolution, the definition had to be changed to accommodate. It was taken that a month would be considered a heatwave month if the monthly average temperature was above the 95th percentile of the modeled average temperature between 1850 and 2015. This was found to be 306.8K.
2.2.3 Cyclone prediction
In the 2021 assessment report by the Intergovernmental Panel on Climate Change (IPCC), it was stated that tropical cyclone trends are still very uncertain and that different models lead to very different results (Seneviratne et al., 2021). There was no good metric for predicting future cyclones in the literature. Therefore, a simple index for the prediction of the risk of cyclone formation was developed using a threshold created from a combination of observational data and historical model data.
The index was created by looking at the sea surface temperature and the wind speeds at the times of known cyclones, which were taken from Table 1 in Mallick and Vogt (2011). Since this record of cyclones goes from 1960 to 2009, these are the years taken for the historical baseline. The mean sea surface temperature was calculated between latitudes 10 and 15 degrees North and longitudes 80 and 93.5 degrees East from the model data for surface temperature. The threshold for the sea surface temperature was found by adding the average mean ocean temperature of this region to the standard deviation. The wind speed threshold was found by adding the average mean wind speed and 1.5 multiplied by the standard deviation of the mean wind speed. The standard deviation for the wind speed was 1.5 respectively as this gave a similar frequency of cyclone formation in the historical model data and the observational data.
2.2.4 Extreme weather indices validation
To validate the ability of the discussed methods to predict extreme weather events, the frequency of historic events was compared to the predicted number of events from the model hindcast. Since the model used had a large grid size before downscaling, it was decided to perform the validation on a national level, as the finer details of a regional event would not be captured. This is also why the frequency of events was considered rather than the replication of individual historical events. If reanalysis data with a grid size similar to that of the size of an upazila was used rather than a hindcast from an earth system model, validating the results on a more regional scale may be more worthwhile, which can be done in future work on this model. The results of this validation are shown in Section 3.1.
2.3 Translating extreme weather predictions into migration push factors
Crop yield is the main effect considered for push factors in this study. It was chosen as it is a relatively simple way of predicting the change in household income, which is a major driver of migration (Best et al., 2022). Hasan and Kumar (2021) analyzed the decrease in agricultural yield in Bangladesh due to extreme weather and found that in years with floods and cyclones, crop production fell by an average of 10.83%. Heinicke et al. (2022) looked at the global crop yield loss with heatwaves and found that an average decrease of 4.96% across different crop types was due to heatwaves. These can work as baseline values for the damage caused by different weather events.
When the indices for the different extreme weather event risks are calculated, they are also normalized to be between 0 and 1, with 1 being the maximum risk from the climate model. This is so that the loss in crop yield can be scaled to the intensity of the extreme weather event.
For each time step of one month in the model, the model checks each upazila for an extreme weather event. In the case that there is one, the normalized index for that event is multiplied by 10.83% (for cyclones and floods) or 4.96% (for heatwaves). This factor is then multiplied by the agricultural factor of the upazila. This agricultural factor represents the average yield of the upazila. At initialization, it is 100 and it resets to 100 at the end of the harvest season of the primary crop of the upazila. The harvest seasons and primary crops were based on data from the Bangladesh Bureau of Statistics' agricultural survey in 2016 (Statistics and informatics division, Bangladesh Bureau of Statistics, Government of the People's Republic of Bangladesh, 2017).
2.4 Building the agent based model
2.4.1 Model construction
The code for the ABM model for this study is built on the code from Best et al. (2021), which was used in the analysis of the interactions of the environment and population migration. Their model aimed to simulate the migration patterns of towns in Bangladesh when met with environmental stress. It has different classes of individuals, households and the community. Each agent was assigned different instances of these classes and each agent represented 10,000 people. The role of these different classes within the model is shown in the flow chart (Figure 1).
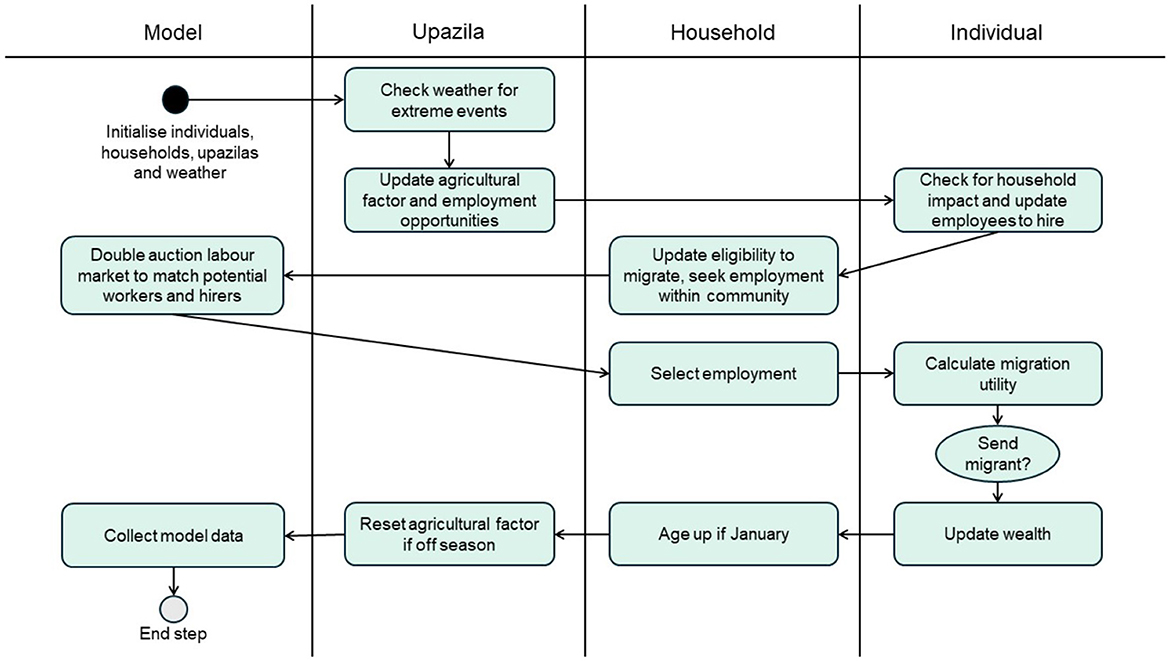
Figure 1. Flow chart showing the model functions for a time step. Based on the model flow chart from Best et al. (2021).
The model uses extreme weather and crop yield prediction to determine whether households feel the effect of the extreme weather and, as a result, suffer from a loss of income. When an extreme weather event occurs, agricultural productivity and the number of available non-agricultural employment opportunities decrease depending on the type of extreme weather event, its intensity and the community impact factor. This then affects the push factors of these households, influencing individuals to consider migrating. The community impact factor controls the percentage of an upazila that is affected when an extreme weather event occurs. A sensitivity analysis is performed on this factor.
The migration decision was made using a hybrid of the Theory of Planned Behavior, Protection Motivation Theory, and mobility potential. The Theory of Planned Behavior (Ajzen, 1991) was used to calculate the perceived benefits of migration. Protection Motivation Theory (Boer and Seydel, 1996) was used to calculate the perceived risk of the household to extreme weather conditions. Mobility potential looks at the capacity of the household to take on adaptation strategies and the potential “rootedness” of the potential migrant in the community (Adams, 2016). More information on the decision calculation can be found in the Model Overview, Design concepts, and Details (ODD).
Once it is decided that an agent will migrate, the pull calculation of each of the other upazilas is calculated as described in Section 2.4.2. The agent is then moved to the upazila with the largest pull factor. Then a new household was created in the destination. The migrating agent's information was then copied to this new household and its individual class instance was removed from its original household but details of the agent remain so that there is a way to send remittances back to the household. While sending remittances is not included in the model at this time, it could be a feature added with further development. This model also does not include the death of agents, meaning that agents are continuously aging. Including more consideration for age would lead to a more integrative, complex model by adding different socio-economic characteristics of the agent based on age.
2.4.2 Pull factor calculation
To calculate the pull factor of an upazila, the model multiplies the number of agricultural employment opportunities available by the average pay. The number of agricultural employment opportunities is found by running through each household with land in the given upazila and finding if they can employ any agents and how much the household can pay them. The average pay is then the average of how much these households can pay. The product is calculated for each upazila and the one with the largest product is selected as the migration destination.
2.4.3 Model assumptions and limitations
In this model, only male agents between the ages of 15 and 35 can migrate as this is the most common demographic among migrants. This is about 18% of agents at model initialization. There is still a significant number of women in this same age range that migrate, but they mostly migrate for marriage rather than employment, which is a dynamic this model does not consider (Alam and Mamun, 2022). This limitation has also been used in previous models, like Best et al. (2021), so keeping it consistent makes it easier to compare the two models.
This model has a fixed number of agents who age but cannot die or reproduce. This contradicts the fact that the population will increase in Bangladesh over the next 50 years.
In the model developed in this study, a migrating agent can travel to any upazila in the country for a set cost. This is not realistic and differs from other ABMs modeling Bangladesh (e.g., Hassani-Mahmooei and Parris, 2012) that only allow migration to adjacent districts.
3 Results and discussions
3.1 Results from the extreme weather indices
3.1.1 Flood prediction
Figure 2 shows the annual average flood index, averaged over the country, for the historical time period and the future climate scenarios. While the individual flood events have not been captured by the flood index, the frequency is similar (17 observed events vs. 19 predicted events). This is different from the results of Deo et al. (2019), the study on which this flood index is based. They found that their flood index captured the individual historical flood events of Dhaka and Bogra. The discrepancy may be because a model was used here for the precipitation values, rather than observational data, which was used by Deo et al. (2019).
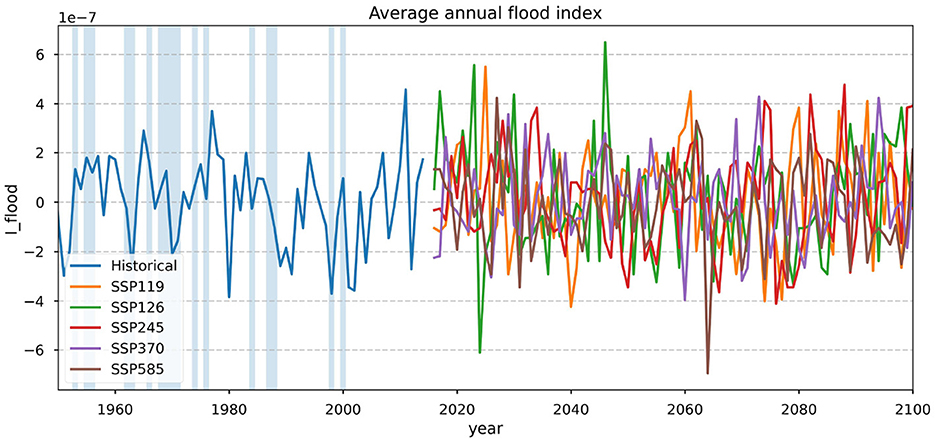
Figure 2. Average annual flood index for the historical simulation and different climate scenarios. The blue bars show years of intense flooding according to A.M. et al. (2003).
3.1.2 Heatwave prediction
The number of heatwave months per 5 year period across the country is shown in Figure 3. Across all SSP scenarios, there is an increase in the number of heatwave months per year. Particularly for SSP5-8.5, which reaches a maximum of 6 heatwave months in a year by 2100. This makes sense, as with an increase in average temperature, there are sure to be more periods of prolonged average temperature. While they do not put a number to the increase, Choi et al. (2021) also predict an increase in the frequency of heatwaves in Bangladesh.
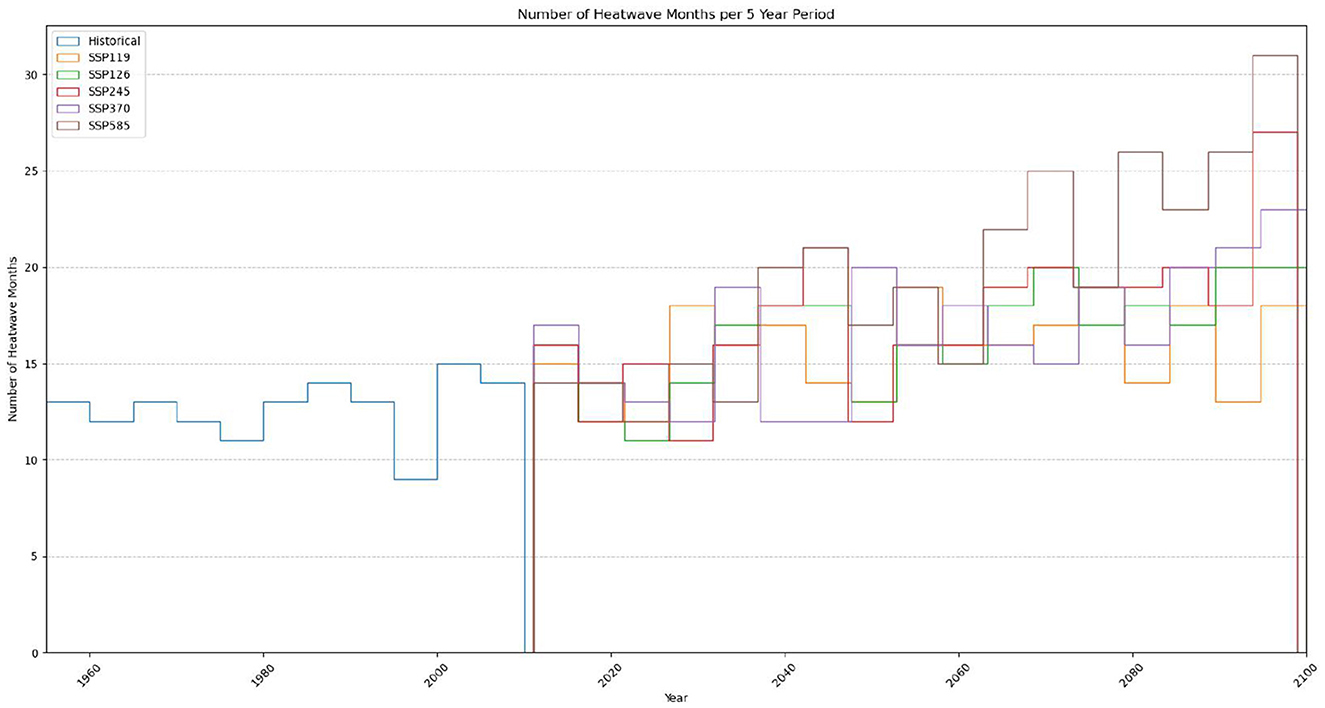
Figure 3. Number of heatwave months per 5 year period in different climate scenarios.
3.1.3 Cyclone prediction
The number of predicted cyclones per 5 year period across the country is shown in Figure 4. In a period of 28 observed cyclones, there was a prediction of a risk of 30 cyclones. There is some overlap of timing, but most occur at different times. Overall, it seems that the frequency of cyclones is predicted to increase in all SSP scenarios. As discussed in Section 2.2.3, there is great uncertainty in the modeled trend of future cyclone frequency (Seneviratne et al., 2021) and so, it is hard to verify this result.
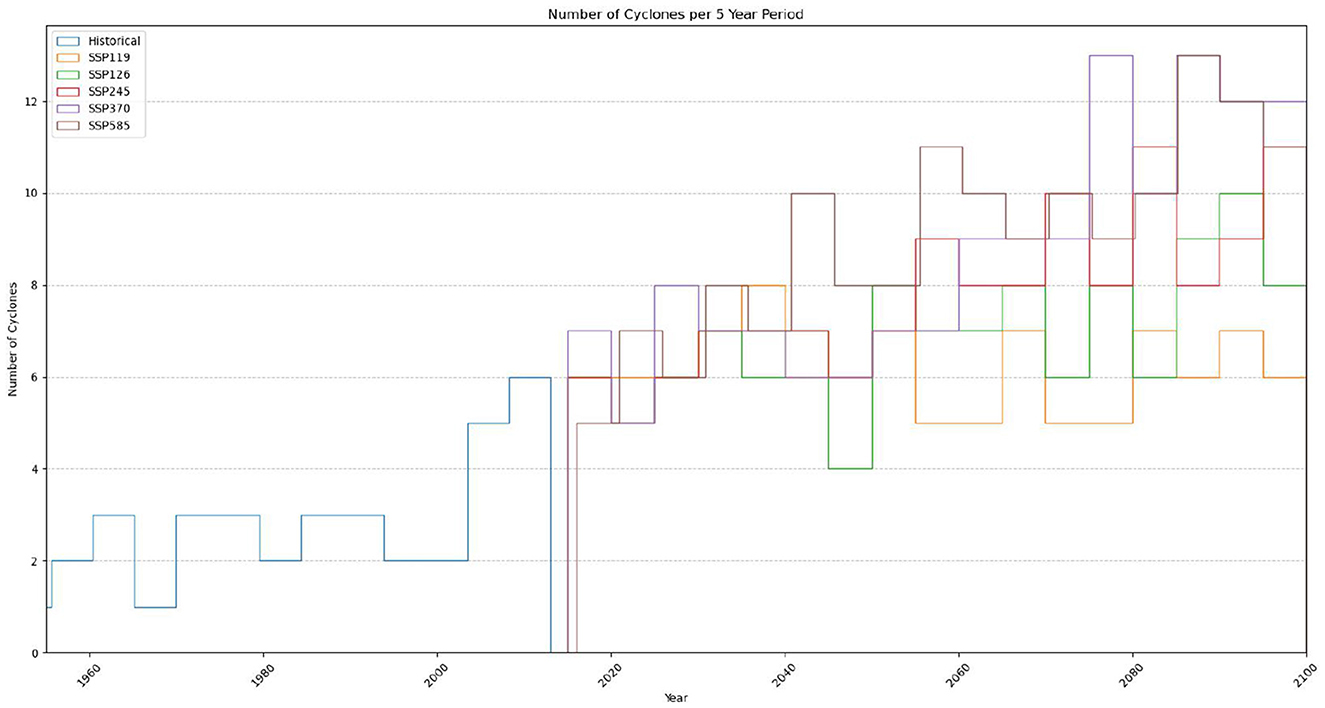
Figure 4. The predicted number of cyclones per 5 year period for different climate scenarios.
3.2 Results from the agent based model
The agent based model ran for 480 months, or 40 years, from 2011 to 2050. It was run 10 times for each scenario and an average of these runs was found. This was due to some randomness that was introduced by the decision making process. Fourteen thousand four hundred and five agents were included in the model runs. Figure 5 shows the accumulative number of migrant agents over time for the five SSP scenarios. For the different SSP scenarios, it was found that there was a similar number of migrant agents for the five scenarios. After the first 10 years, the five scenarios diverged slightly. This divergence does not get larger than 100 agents. The number of agents starts to plateau after about 2035. This could be the result of an already changing climate, that people who have the desire to migrate due to worsening conditions have migrated once worsening conditions are noticed in all scenarios. It could also be a sign that there were no longer any more agents that were able to migrate. Over the course of the model run, approximately 35% of the agents were males who at some point were between the ages of 15 and 35. This means that about 43%–45% of the agents who could migrate took that opportunity. Since the model runs over 40 years, many of these agents would have aged out of the ability to migrate toward the end of the model run. This is a large amount of the available agents.

Figure 5. Top: Accumulative number of migrating agents for the whole country over time for different SSP scenarios. Fourteen thousand four hundred and five agents were included in the model runs.
The issue of the decreasing the number of agents available to migrate toward the end of the model run could be improved upon by allowing agents to migrate more than once, allowing women to migrate by adding social dynamics such as marriage or by adding in a birth rate so that new agents can be added. This could be something that can be added to the model, for example, Hassani-Mahmooei and Parris (2012) include population increase in their model by introducing new agents based on the current birth rate. This may address the problem with the model running out of agents who are available to migrate. However, the final suggestion may only help on a longer time scale. This may also affect the fact that there is a similar number of migrating agents between the different SSP scenarios. As time continues, the effects of climate change increase, meaning that the biggest difference between the SSP scenarios is felt toward the end of the model runs. An increase in the number of agents available to migrate would likely contribute to more difference between the number of migrating agents for each SSP scenario.
The number of migrants by 2050 was found to be between 2200 and 2300 agents, which is about 15%–16% of agents. This translates to over 22 million migrants in Bangladesh by 2050. This is about double the maximum number of migrants found by Hassani-Mahmooei and Parris (2012). This could indicate that the threshold for migration in this model is too low. However, the 2011 census found that 12% of households have a migrant in the family (Statistics and informatics division, Bangladesh Bureau of Statistics, Government of the People's Republic of Bangladesh, 2011). 15%–16% is not too large an increase from this figure. However, due to the number of limitations of this model and the uncertainty introduced by climate change and human behavior, the projection of 22 million internal migrants is to be questioned.
The effect that climate change has on migration can be tested by changing the community impact factor. The community impact factor controls the percentage of an upazila that is affected when an extreme weather event occurs. The community impact factor was set to 0.4 in all other model runs, as this was the value that was used by Best et al. (2021). Setting the community impact factor to 0 essentially removes climate change from the model. When changing the community impact factor, the vulnerability of a community to climate change increases the number of migrants, which is shown in Figure 6. In this case, migration is still observed, but the numbers are much smaller than for values >0. This shows that climate change has a significant impact on the migration of people in Bangladesh. There is a peak in the number of migrations for a community impact factor between 0.4 and 0.6. This number is not 1.0, which one might intuitively expect, as the ability of an agent to migrate also depends on their wealth. With increased community impact, there is less wealth generated in the community and so it is harder for agents to migrate.
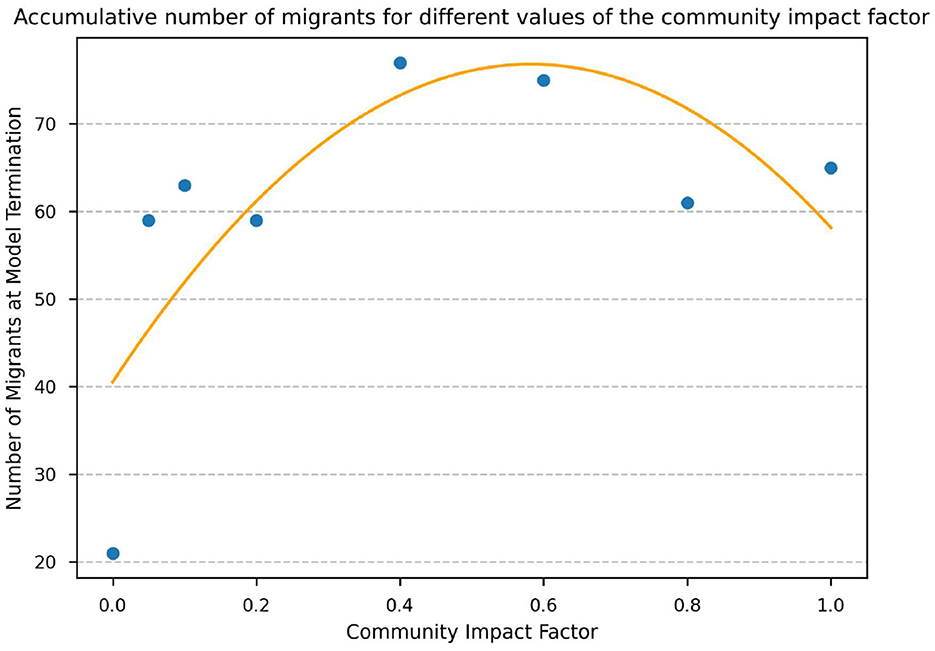
Figure 6. The number of migrating agents for different values of community impact factor at the termination of a model run of 60 ticks, or 5 years, for a sample of 10 upazilas, or 230 agents. The orange curve represents the quadratic line of best fit. A larger community impact factor means a higher proportion of households affected by extreme weather events in an affected upazila. The community impact factor was set to 0.4 in all other model runs, as discussed in Section 2.4.
Figure 7 shows the places where migrating agents have left in different SSP scenarios, for the whole country and then for the Dhaka district. Most migration appears to be from the center of the country and Dhaka, where a large proportion of the population lives. There does not appear to be too much difference in the places where migrants are leaving between the different climate scenarios. Figure 8 shows the percentage of agents who were men who were between the ages of 15 and 35 at some point over the model run that migrated. Like Figure 7, there is no strong difference between the different climate scenarios. Most areas see the migration of about 40%–60% of potential migrants. Under different SSP scenarios, there are areas that experience large amounts of outward migration, up to 90% in some cases. These could be areas where there are more climate stresses in the given scenario. There are not many migrants from the coastal regions, where there is more vulnerability to cyclones and coastal flooding (Bernard et al., 2022). This could be because the population along the coast is comparably less dense (see Figure 1, Sarwar et al., 2005), and so fewer people per upazila are migrating. Coastal flooding was not included in this study. Perhaps its inclusion would have led to more migration from the south as there is evidence of population displacement due to storm surges and long-standing inundation (Bernard et al., 2022).
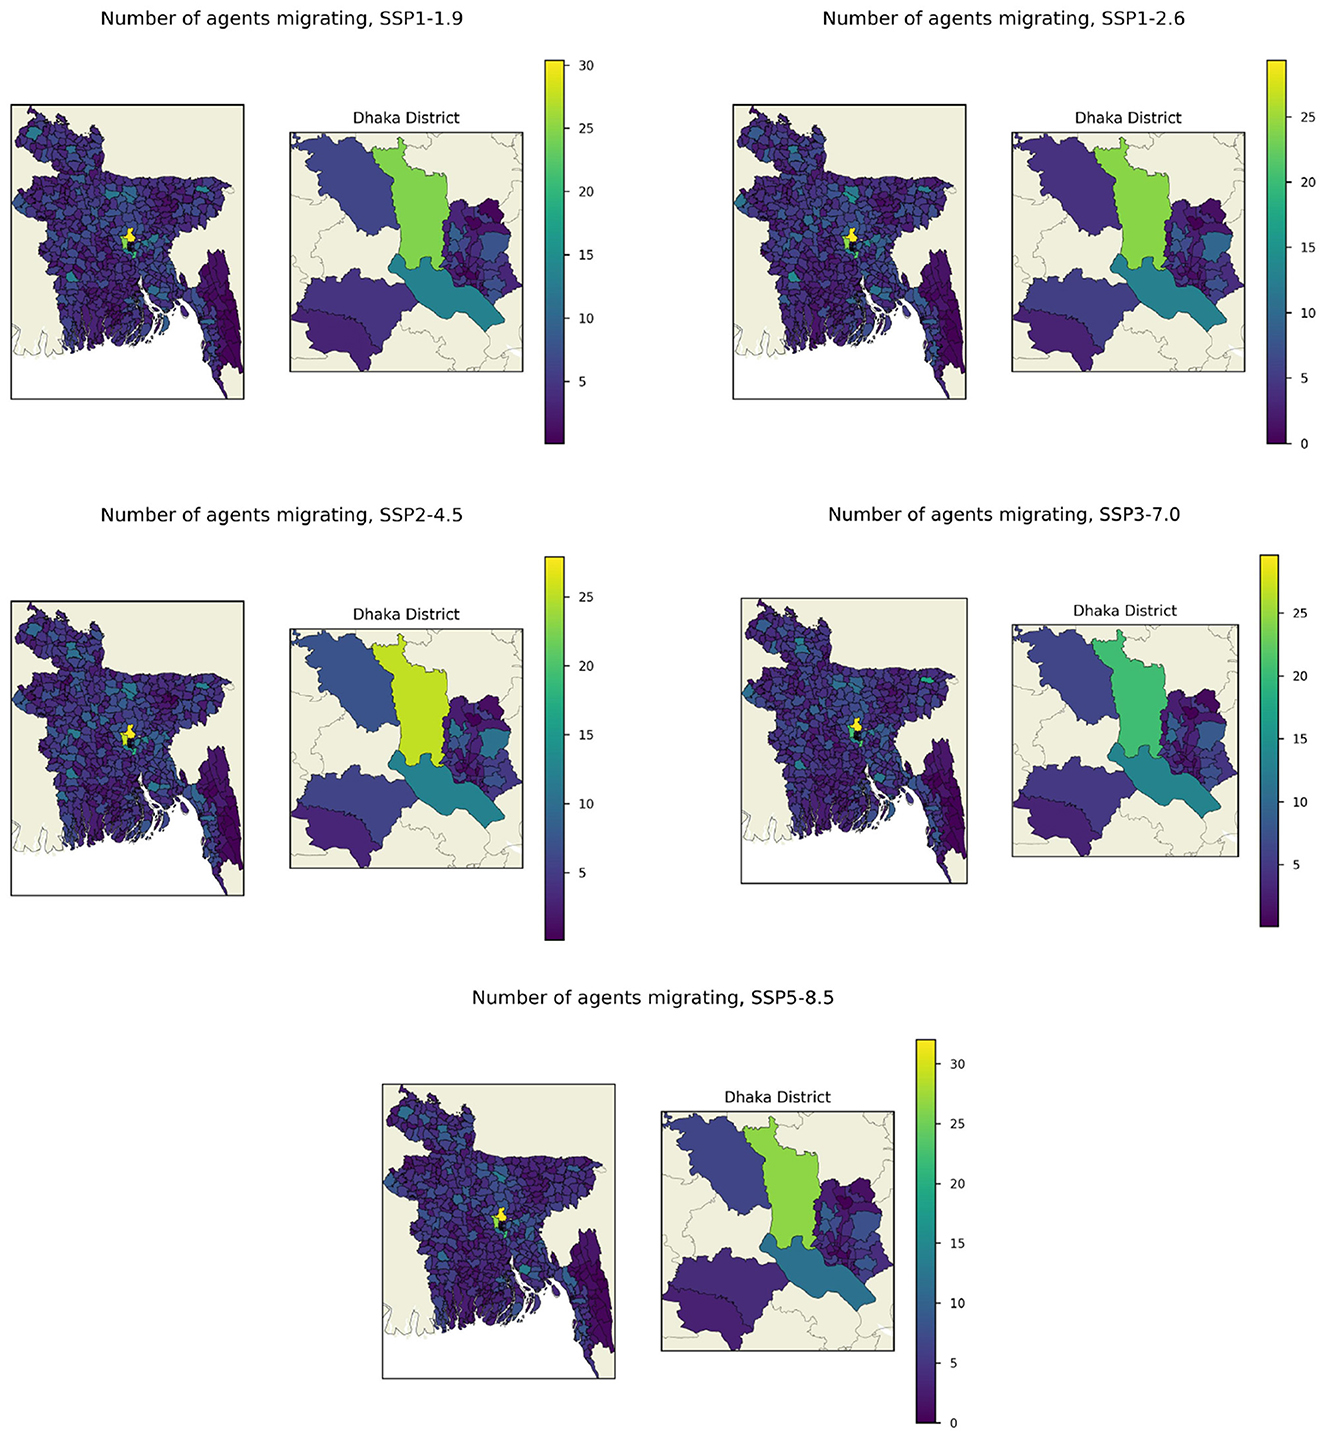
Figure 7. Map of the accumulative number of migrating agents leaving each upazila for different SSP scenarios. On the left is the country of Bangladesh and on the right is the district of the city of Dhaka, upazilas with ID codes 3026XX.
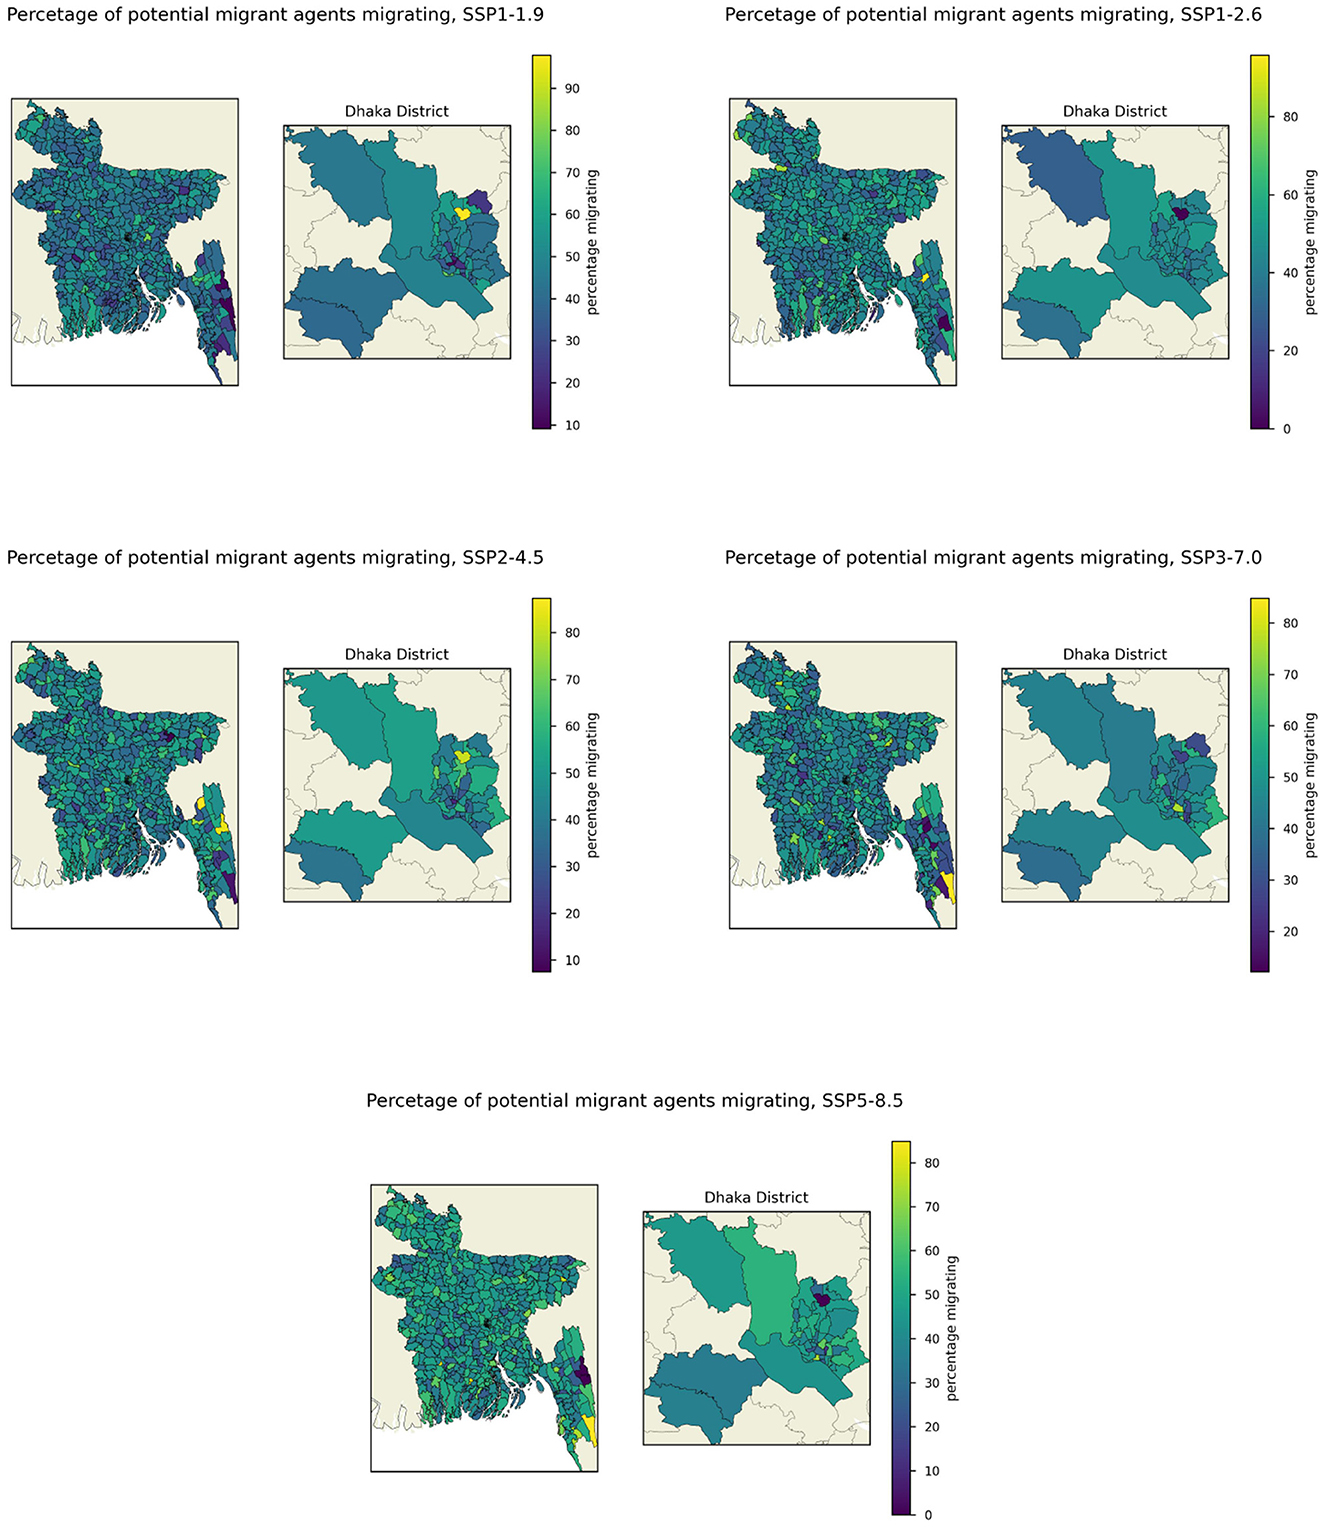
Figure 8. Map of the percentage of agents who could migrate that did from each upazila for different SSP scenarios. On the left is the country of Bangladesh and on the right is the district of the city of Dhaka, upazilas with ID codes 3026XX.
Figure 9 shows the number of migrants moving to each upazila for different SSP scenarios, for the country and the Dhaka district. The central regions are the most popular destinations. Likely because there is more job availability in these more populated areas (Statistics and informatics division, Bangladesh Bureau of Statistics, Government of the People's Republic of Bangladesh, 2011). Dhaka city itself is not so popular as a destination. This is likely because the pull factor was calculated using agriculture employment opportunities only and the city would have fewer of these positions. Much like the origin of migrants, the choice of destination does not appear to change too much with different SSP scenarios.
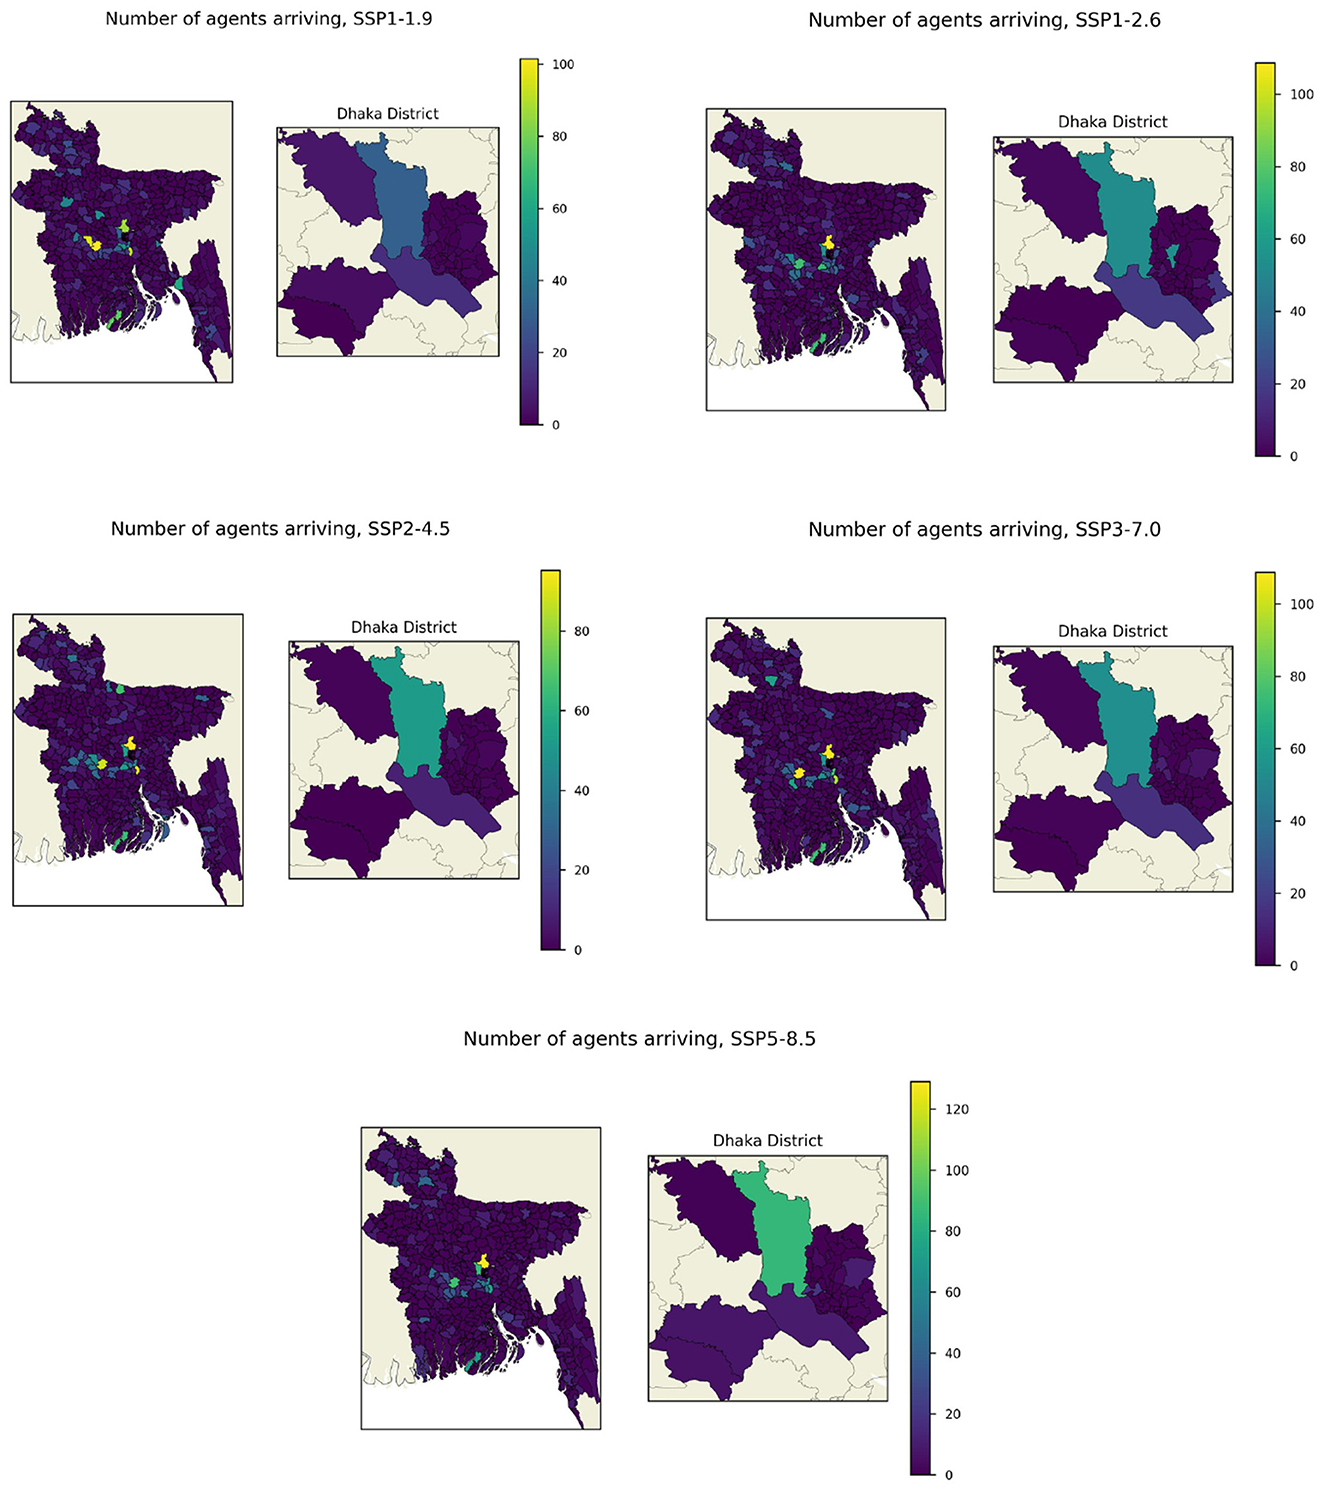
Figure 9. Map of the number of accumulative migrating agents arriving to each upazila for different SSP scenarios. On the left is the country of Bangladesh and on the right is the district of the city of Dhaka, upazilas with ID codes 3026XX.
The total change in population due to migration for the different SSP scenarios is shown in Figure 10. Most of the change is limited to the southeast and center of the country. The infrastructure in the center, in many areas, is already strained (Rahaman et al., 2023). It is unlikely that these communities will be able to handle more inward migration over the next 40 years without adequate planning.

Figure 10. Percentage change in upazila population per SSP scenario due to climate migration. On the left is the country of Bangladesh and on the right is the district of the city of Dhaka, upazilas with ID codes 3026XX.
The majority of upazilas do not experience a net out-migration, and if they do, the population decrease due to this is less than 0.5%, where the inward and outward migration balance each other. Annual population growth in Bangladesh was about 1% in 2023 (United Nations, Department of Economic and Social Affairs, Population Division, 2024). Assuming that this population increase is uniform across the country, the population in these upazila should be stable, with the population age distribution skewing younger as people of working age migrate.
Hassani-Mahmooei and Parris (2012) also saw that the largest change in population would be seen in the southeast and center of the country. They also predicted that there would be a smaller increase in the population in the north. While this model found that there would also be an increase, it was not as large as the predicted increase from Hassani-Mahmooei and Parris (2012). Bell et al. (2021) predicted that migration would increase the population in the central south and southeast, which can be seen in some upazilas. However, they also predicted that there would be a large decrease in the population of Dhaka and the surrounding areas, which is not observed in this model. There is some decrease in some of the upazilas in the center of the country, but not on the scale of Bell et al. (2021).
One of the limitations of this model is the fact that agents are free to choose any upazila as their destination, which is unrealistic as discussed in Section 2.4.3. If the cost of migration was dynamic and depended on distance, this would most likely affect the destination decision. It would probably lead to more migrants moving to upazilas adjacent to their upazila of origin. This might mean that the increase in population due to migration in Dhaka and the surrounding areas may not be observed, as many of these migrants are traveling from multiple upazilas away. However, the economic opportunities offered by these destinations may be enough to overcome the extra cost of migrating.
Climate change will not only affect the agricultural sector. Workers' health is in danger across many fields of employment (Schulte et al., 2016). This and other factors will negatively affect the productivity of the economy (Wade and Jennings, 2016). This means a loss of income and migration for people of all sectors. The model developed in this study divides employment into two categories: agriculture and other. While there is a mechanic for decreasing the number of non-agricultural employment opportunities, it is not as detailed as the one for agricultural employment opportunities. There is also no decrease in income for these other employments. If the economics of this model were to be improved upon, it could be done as a development of the effects that extreme weather has on non-agricultural sectors, such as on construction or power supply.
This model does not consider the reduction in mobility that can be caused by extreme weather. While weather extremes can lead to the movement of people, they can also have an inhibiting factor on migration (Call et al., 2017). For example, floods may damage roads or dehydration during droughts may leave people too weak to travel. This is potentially captured by the loss of income during these periods, but it could be interesting to see the effects of a sort of "block" in the model that would reduce mobility after extreme weather.
Seasonal migration is common in Bangladesh for agricultural work (Khandker et al., 2012). The model developed in this study does not allow for seasonal or return migration. This is one of the weaknesses of this model. The inclusion of seasonal migration would likely increase the comparability of this model to the real world. The model presented by Entwisle et al. (2020) showed that out-migration and return migration are affected differently by the same type of extreme weather events.
An ABM for migration in Thailand presented by Entwisle et al. (2016) includes not only the births and deaths of agents, but also return migration, marriage and the establishment of new households. The inclusion of such social processes adds real-life complexity to a social network within a model. These social networks play a role in the migration decision (Haug, 2008) and so could potentially increase the accuracy of a model like the one presented in this study.
As mentioned before, areas that are projected to experience large amounts of immigration are unlikely to be able to accommodate arriving migrants without improvements to local infrastructure. Also, areas that are projected to have around 90% of their working male population migrating, as seen in Figure 8, may struggle with unfilled employment opportunities and an aging population. A model, like this one, can be used by governments and community leaders to help decide where funding would be best allocated to prepare for incoming migrants. Of course, there is a danger of over-reliance on models. Both climate change and human behavior add uncertainty to the results. What is presented in this study is just one possible outcome. If different assumptions were used, the results could look very different. There are many ways in which this model can be improved, such as by the inclusion of more dynamic social processes like in the ABM developed by Entwisle et al. (2016), or the potential inhibiting factor that some extreme weather events can have on migration, for example, floods blocking roads and other infrastructure (Call et al., 2017). Since there are many sources of uncertainty in the grand total of migrants in this model, the results should not be taken as a prediction of future migration numbers. However, this study introduces a new method of finding areas that are more prone to extreme weather events and projecting the migration patterns to and from these places. The model can still be used to indicate areas that may need additional support when receiving migrants in the coming decades.
4 Conclusions
For governments and communities to prepare for the potential increase in migration that is brought about by climate change, models need to be developed that can indicate where this migration will be occurring. This study looked at the influence that the inclusion of climatological data can have on an agent based model that is used to model migration in Bangladesh. The inclusion of a dynamical climate component has not been used before in climate migration modeling for Bangladesh. This study also considers the effects of multiple types of extreme weather events. The model includes the simple climate variables of surface temperature, precipitation and wind speed and translates them into indices predicting the frequency and intensity of floods, heatwaves and cyclones. The prediction metrics for floods and heatwaves were built on previous studies, while a simple prediction metric for cyclones was created based on ocean surface temperature and wind speed thresholds. The effect that these extreme weather events have on agriculture was investigated and a way to translate intensity into loss of crop yield was found. This could then be included in the agent based model that had been developed by Best et al. (2021). This model was also adjusted so that it could be used as a sort of box model for the country of Bangladesh. It can now be used to model migration decisions and patterns on an upazila resolution.
The model found that there could potentially be over 22 million internal migrants in Bangladesh before 2050. The number of migrants found in this study is much higher than other studies done on climate migration in Bangladesh. This could be due to the social parameters for migration decision-making being set too low so that it is easy to decide to migrate. In terms of the origin and destination of migrants, the results were similar to those of Hassani-Mahmooei and Parris (2012) who found that climate change would lead people in Bangladesh to migrate to the center of the country.
There are many known limitations of this model, for example, the inability to capture the birth and death of agents or a more refined process for evaluating the effect of climate change on non-agricultural employment opportunities. As discussed in Section 2.4.3, there are existing models that address these limitations. The inclusion of these dynamics will lead to a richer model.
While there are still many ways in which this model can be improved upon and developed, it is promising to see the similarities in results to previous work in this area. The incorporation of a dynamic climate model into a migration ABM has allowed for the forecasting of migration on an upazila level, the smallest administrative region of Bangladesh, based on climate projections. This model also looks at the effects of multiple extreme weather events, meaning that a more holistic picture of climate migration in Bangladesh can be made. This means that we can project where and when climate migration could occur, allowing for the government and communities to better prepare to take in migrants or to tackle the challenges of decreasing population.
Data availability statement
The original contributions presented in the study are included in the article/Supplementary material, further inquiries can be directed to the corresponding author.
Author contributions
OO'N: Conceptualization, Data curation, Formal analysis, Methodology, Validation, Visualization, Writing – original draft, Writing – review & editing. GV: Conceptualization, Formal analysis, Methodology, Project administration, Supervision, Writing – review & editing. BM: Conceptualization, Data curation, Formal analysis, Funding acquisition, Methodology, Project administration, Supervision, Writing – review & editing. KB: Formal analysis, Methodology, Validation, Writing – review & editing.
Funding
The author(s) declare that no financial support was received for the research and/or publication of this article.
Conflict of interest
The authors declare that the research was conducted in the absence of any commercial or financial relationships that could be construed as a potential conflict of interest.
Generative AI statement
The author(s) declare that no Gen AI was used in the creation of this manuscript.
Publisher's note
All claims expressed in this article are solely those of the authors and do not necessarily represent those of their affiliated organizations, or those of the publisher, the editors and the reviewers. Any product that may be evaluated in this article, or claim that may be made by its manufacturer, is not guaranteed or endorsed by the publisher.
Supplementary material
The Supplementary Material for this article can be found online at: https://www.frontiersin.org/articles/10.3389/fclim.2025.1567481/full#supplementary-material
References
Adams, H. (2016). Why populations persist: mobility, place attachment and climate change. Popul. Environ. 1, 429–448. doi: 10.1007/s11111-015-0246-3
Ajzen, I. (1991). The theory of planned behavior. Organ. Behav. Hum. Decis. Process. 50, 179–211. doi: 10.1016/0749-5978(91)90020-T
Alam, M. Z., and Mamun, A. A. (2022). Dynamics of internal migration in Bangladesh: Trends, patterns, determinants, and causes. PLoS ONE 17:e0263878. doi: 10.1371/journal.pone.0263878
AM, D., Nishigaki, M., and Komatsu, M. (2003). Floods in Bangladesh: a comparative hydrological investigation on two catastrophic events. Okayama University Faculty of Environmental Science and Engineering Research Report, 53–62.
Bell, A. R., Wrathall, D., Mueller, V., Chen, J., Oppenheimer, M., Hauer, M., et al. (2021). Migration towards Bangladesh coastlines projected to increase with sea-level rise through 2100. Environ. Res. Lett. 16:024045. doi: 10.1088/1748-9326/abdc5b
Bernard, A., Long, N., Becker, M., Khan, J., and Fanchette, S. (2022). Bangladesh's vulnerability to cyclonic coastal flooding. Nat. Hazards Earth Syst. Sci. 22, 729–751. doi: 10.5194/nhess-22-729-2022
Best, K., Gilligan, J., Baroud, H., Carrico, A., Donato, K., and Mallick, B. (2022). Applying machine learning to social datasets: a study of migration in southwestern Bangladesh using random forests. Reg. Environ. Change 22:52. doi: 10.1007/s10113-022-01915-1
Best, K., Gilligan, J., and Mallick, B. (2025). Economic inequality is a crucial determinant of observed patterns of environmental migration. Commun. Earth Environ. 6, 1–8. doi: 10.1038/s43247-025-02177-5
Best, K., Gilligan, J., and Qu, A. (2021). “Modeling multi-level patterns of environmental migration in Bangladesh: an agent-based approach,” in 2021 Winter Simulation Conference (WSC), 1–12. doi: 10.1109/WSC52266.2021.9715380
Boas, I., Farbotko, C., Adams, H., Sterly, H., Bush, S., Van der Geest, K., et al. (2019). Climate migration myths. Nat. Clim. Chang. 9, 901–903. doi: 10.1038/s41558-019-0633-3
Boer, H., and Seydel, E. R. (1996). “Protection motivation theory,” in: Predicting Health Behaviour: Research and Practice with Social Cognition Models, eds. M. Conner, P. Norman (Open University Press), 1–120.
Call, M. A., Gray, C., Yunus, M., and Emch, M. (2017). Disruption, not displacement: environmental variability and temporary migration in Bangladesh. Global Environ. Change 1, 157–165. doi: 10.1016/j.gloenvcha.2017.08.008
Choi, Y.-W., Campbell, D. J., Aldridge, J. C., and Eltahir, E. A. (2021). Near-term regional climate change over Bangladesh. Clim. Dyn. 1, 3055–3073. doi: 10.1007/s00382-021-05856-z
Dastagir, M. R. (2015). Modeling recent climate change induced extreme events in Bangladesh: a review. Weather Clim. Extr. 1, 49–60. doi: 10.1016/j.wace.2014.10.003
Delaporte, I., and Maurel, M. (2018). Adaptation to climate change in Bangladesh. Clim. Policy 18, 49–62. doi: 10.1080/14693062.2016.1222261
Deo, R. C., Adamowski, J. F., Begum, K., Salcedo-Sanz, S., Kim, D.-W., Dayal, K. S., et al. (2019). Quantifying flood events in Bangladesh with a daily-step flood monitoring index based on the concept of daily effective precipitation. Theor. Appl. Climatol. 1, 1201–1215. doi: 10.1007/s00704-018-2657-4
Entwisle, B., Verdery, A., and Williams, N. (2020). Climate change and migration: new insights from a dynamic model of out-migration and return migration. Am. J. Sociol. 125, 1469–1512. doi: 10.1086/709463
Entwisle, B., Williams, N. E., Verdery, A. M., Rindfuss, R. R., Walsh, S. J., Malanson, G. P., et al. (2016). Climate shocks and migration: an agent-based modeling approach. Popul. Environ. 1, 47–71. doi: 10.1007/s11111-016-0254-y
Eyring, V., Gillett, N. P., Achuta Rao, K. M., Barimalala, R., Barreiro Parrillo, M., Bellouin, N., et al. (2021). “2021: human influence on the climate system,” in Climate Change 2021: The Physical Science Basis. Contribution of Working Group I to the Sixth Assessment Report of the Intergovernmental Panel on Climate Change, eds. V. Masson-Delmotte, P. Zhai, A. Pirani, S.L. Connors, C. Péan, S. Berger, et al. (Cambridge, United Kingdom and New York, NY, USA: Cambridge University Press), 423–552.
Gray, C. L., and Mueller, V. (2012). Natural disasters and population mobility in Bangladesh. Proc. Nat. Acad. Sci. 109, 6000–6005. doi: 10.1073/pnas.1115944109
Hasan, M. K., and Kumar, L. (2021). Yield trends and variabilities explained by climatic change in coastal and non-coastal areas of Bangladesh. Sci. Total Environ. 1:148814. doi: 10.1016/j.scitotenv.2021.148814
Hassani-Mahmooei, B., and Parris, B. W. (2012). Climate change and internal migration patterns in Bangladesh: an agent-based model. Environ. Dev. Econ. 17, 763–780. doi: 10.1017/S1355770X12000290
Haug, S. (2008). Migration networks and migration decision-making. J. Ethn. Migr. Stud. 34, 585–605. doi: 10.1080/13691830801961605
Heinicke, S., Frieler, K., Jägermeyr, J., and Mengel, M. (2022). Global gridded crop models underestimate yield responses to droughts and heatwaves. Environ. Res. Lett. 17:044026. doi: 10.1088/1748-9326/ac592e
Hill, R. V., Kumar, N., Magnan, N., Makhija, S., de Nicola, F., Spielman, D. J., et al. (2019). Ex ante and ex post effects of hybrid index insurance in Bangladesh. J. Dev. Econ. 1, 1–17. doi: 10.1016/j.jdeveco.2018.09.003
Hoyer, S., and Hamman, J. (2017). Xarray: N-D labeled arrays and datasets in Python. J. Open Res. Softw. 5:10. doi: 10.5334/jors.148
Kent, S. T., McClure, L. A., Zaitchik, B. F., Smith, T. T., and Gohlke, J. M. (2014). Heat waves and health outcomes in Alabama (USA): the importance of heat wave definition. Environ. Health Perspect. 122, 151–158. doi: 10.1289/ehp.1307262
Khan, M. J. U., Islam, A. S., Bala, S. K., and Islam, G. T. (2020). Changes in climate extremes over Bangladesh at 1.5 c, 2 c, and 4 c of global warming with high-resolution regional climate modeling. Theor. Appl. Climatol. 1, 1451–1466. doi: 10.1007/s00704-020-03164-w
Khan, M. R., Huq, S., Risha, A. N., and Alam, S. S. (2021). High-density population and displacement in Bangladesh. Science 372, 1290–1293. doi: 10.1126/science.abi6364
Khandker, S. R., Khalily, M. B., and Samad, H. A. (2012). Seasonal migration to mitigate income seasonality: evidence from Bangladesh. J. Dev. Stud. 48, 1063–1083. doi: 10.1080/00220388.2011.561325
Kniveton, D., Smith, C., and Wood, S. (2011). Agent-based model simulations of future changes in migration flows for Burkina Faso. Global Environ. Change 21, S34–S40. doi: 10.1016/j.gloenvcha.2011.09.006
Mallick, B., and Vogt, J. (2011). Social supremacy and its role in local level disaster mitigation planning in Bangladesh. Disaster Prevent. Manag. 20, 543–556. doi: 10.1108/09653561111178970
Martin, M., Billah, M., Siddiqui, T., Abrar, C., Black, R., and Kniveton, D. (2014). Climate-related migration in rural Bangladesh: a behavioural model. Popul. Environ. 1, 85–110. doi: 10.1007/s11111-014-0207-2
Nissan, H., Burkart, K., Coughlan de Perez, E., Van Aalst, M., and Mason, S. (2017). Defining and predicting heat waves in Bangladesh. J. Appl. Meteorol. Climatol. 56, 2653–2670. doi: 10.1175/JAMC-D-17-0035.1
OCHA (2018). Humanitarian Data Exchange. Bangladesh - Rivers. Available online at: https://data.humdata.org/dataset/bangladesh-water-courses (accessed February 2024).
OCHA (2020). Humanitarian Data Exchange. Bangladesh: Subnational Administrative Boundaries. Available online at: https://data.humdata.org/dataset/cod-ab-bgd (accessed February 2024).
Perch-Nielsen, S. L., Bättig, M. B., and Imboden, D. (2008). Exploring the link between climate change and migration. Clim. Change 1, 375–393. doi: 10.1007/s10584-008-9416-y
Rahaman, M. A., Kalam, A., and Al-Mamun, M. (2023). Unplanned urbanization and health risks of Dhaka city in Bangladesh: uncovering the associations between urban environment and public health. Front. Public Health 1:1269362. doi: 10.3389/fpubh.2023.1269362
Rahman, M. T. (2017). Role of agriculture in Bangladesh economy: uncovering the problems and challenges. Int. J. Bus. Manag. Invent. 6, 36–46. Available online at: https://ssrn.com/abstract=3697022
Roy, S., Bose, A., and Chowdhury, I. R. (2021). Flood risk assessment using geospatial data and multi-criteria decision approach: a study from historically active flood-prone region of Himalayan foothill, India. Arabian J. Geosci. 14:999. doi: 10.1007/s12517-021-07324-8
Sarwar, M. G. M. (2005). Impacts of sea level rise on the coastal zone of Bangladesh. Available online at: https://www.lumes.lu.se/sites/lumes.lu.se/files/golam_sarwar.pdf (accessed April 22, 2025).
Schulte, P., Bhattacharya, A., Butler, C., Chun, H., Jacklitsch, B., Jacobs, T., et al. (2016). Advancing the framework for considering the effects of climate change on worker safety and health. J. Occup. Environ. Hyg. 13, 847–865. doi: 10.1080/15459624.2016.1179388
Seneviratne, S. I., Zhang, X., Adnan, M., Badi, W., Dereczynski, C., Di Luca, A., et al. (2021). “2021: weather and climate extreme events in a changing climate,”? in Climate Change 2021: The Physical Science Basis. Contribution of Working Group I to the Sixth Assessment Report of the Intergovernmental Panel on Climate Change, eds. V. Masson-Delmotte, P. Zhai, A. Pirani, S.L. Connors, C. Péan, S. Berger, et al. (Cambridge, United Kingdom and New York, NY, USA: Cambridge University Press), 1513–1766.
Solomon, D., Ishtiaque, A., Agarwal, A., Gray, J. M., Lemos, M. C., Moben, I., et al. (2024). The role of rural circular migration in shaping weather risk management for smallholder farmers in India, Nepal, and Bangladesh. Global Environ. Change 1:102937. doi: 10.1016/j.gloenvcha.2024.102937
Statistics and informatics division Bangladesh Bureau of Statistics, Government of the People's Republic of Bangladesh. (2011). Population and Housing Census 2011. Retrieved from: https://bbs.gov.bd/site/page/47856ad0-7e1c-4aab-bd78-892733bc06eb/Population-and-Housing-Census (accessed February 2024).
Statistics and informatics division Bangladesh Bureau of Statistics, Government of the People's Republic of Bangladesh. (2017). Yearbook of Agricultural Statistics 2016. Government of the People's Republic of Bangladesh, Retrieved from: https://bbs.gov.bd/site/page/3e838eb6-30a2-4709-be85-40484b0c16c6/Yearbook-of-Agricultural-Statistics (accessed April 2024).
Tierolf, L., Haer, T., Botzen, W. W., de Bruijn, J. A., Ton, M. J., Reimann, L., et al. (2023). A coupled agent-based model for France for simulating adaptation and migration decisions under future coastal flood risk. Sci. Rep. 13:4176. doi: 10.1038/s41598-023-31351-y
Tong, S., FitzGerald, G., Wang, X.-Y., Aitken, P., Tippett, V., Chen, D., et al. (2015). Exploration of the health risk-based definition for heatwave: a multi-city study. Environ. Res. 1, 696–702. doi: 10.1016/j.envres.2015.09.009
Trinh, T. T., and Munro, A. (2023). Integrating a choice experiment into an agent-based model to simulate climate-change induced migration: the case of the Mekong river delta, Vietnam. J. Choice Model. 1:100428. doi: 10.1016/j.jocm.2023.100428
United Nations Department of Economic and Social Affairs, Population Division. (2024). World Population Prospects 2024, Online Edition. Retrieved from: https://population.un.org/wpp/ (accessed May 2024).
Wade, K., and Jennings, M. (2016). The impact of climate change on the global economy. Schroders Talking Point.
Keywords: agent based modeling, migration, climate change, migration decision, migration modeling
Citation: O'Neill O, Velders GJM, Mallick B and Best K (2025) Projecting climate migration in Bangladesh using agent based modeling and climate data. Front. Clim. 7:1567481. doi: 10.3389/fclim.2025.1567481
Received: 27 January 2025; Accepted: 08 April 2025;
Published: 09 May 2025.
Edited by:
Lisa Thalheimer, Institute for Environment and Human Security (UNU), GermanyReviewed by:
Medani Bhandari, Akamai University, United StatesNicolas Choquette-Levy, The Pennsylvania State University (PSU), United States
Copyright © 2025 O'Neill, Velders, Mallick and Best. This is an open-access article distributed under the terms of the Creative Commons Attribution License (CC BY). The use, distribution or reproduction in other forums is permitted, provided the original author(s) and the copyright owner(s) are credited and that the original publication in this journal is cited, in accordance with accepted academic practice. No use, distribution or reproduction is permitted which does not comply with these terms.
*Correspondence: Bishawjit Mallick, Yi5tYWxsaWNrQHV1Lm5s