 Giuseppe Giugliano1,2
 Alessandro Pugliese1*
 Carmela De Vivo1
 Giuliana Barbato1
 Marta Ellena1Antonio Tirri3Francesco Lo Conti3
 Laura Mortini4Ethel Gallo4
 Alessandro Bonfiglio1
 Paola Mercogliano1
 Guido Rianna1
- 1CMCC Foundation – Euro-Mediterranean Center on Climate Change, Lecce, Italy
- 2Department of Science and Technology, University of Naples “Parthenope”, Centro Direzionale di Napoli – Isola C4, Naples, Italy
- 3LEITHA UNIPOL Group, Milan, Italy
- 4IFAB International Foundation Big Data and Artificial Intelligence for Human Development, Bologna, Italy
In recent years, Europe has experienced a notable increase in the frequency and severity of extreme weather events, including heatwaves, floods, droughts, storms, and wildfires. These events have had profound impacts on human life, infrastructure, ecosystems, and economies, highlighting the urgent need to develop effective climate services to prevent, manage and timely respond to associated impacts. The aim of this paper is to describe and validate the European Extreme Climate Index (E3CI), designed as a climate service that allows monitoring the occurrence and severity of extreme weather dynamics across Europe. Starting from data provided by ERA5, the fifth generation of atmospheric reanalyzes produced by the European Center for Medium-Range Weather Forecasts (ECMWF), which covers the entire globe from 1940, E3CI provides insights regarding variations and trends in seven specific dynamics associated with extreme weather events: Extreme Maximum Temperatures, Extreme Minimum Temperatures, Extreme Precipitations, Extreme Winds, Hail, Droughts, and Fires. For each of these, the E3CI collects information at monthly scale in terms of anomalies compared to a reference climatological time span (1981–2010), therefore enabling back-analyses on specific territories, highlighting areas subject to significant weather-induced criticalities. E3CI has proven effective in identifying the spatial distribution and intensity of the extreme precipitation and extreme wind events in the areas affected by powerful storms Dudley, Eunice, and Franklin, as well as the significant heat waves in the summer of 2022 and the extreme precipitation in Emilia Romagna in May 2023. Such index offers numerous application opportunities for businesses, institutions, and communities, in the vein of profound innovation in climate risk management and extreme weather events policies. Its flexible and dynamic nature allows for the production of customizable analysis based on the specific user needs including the ability to refine geographic areas to a radius of approximately 30 km. The data are made available for visualization and download through a dedicated portal, which is updated monthly. Additionally, a Newsletter for subscribers provides information about major events across Europe and their assessment by the corresponding components of E3CI.
1 Introduction
In recent decades, global climate change has emerged as one of the most complex and serious challenges facing human society [World Meteorological Organization (WMO), 2023; Calvin et al., 2023; Pan et al., 2022]. The primary consequences of global warming include rising average temperatures in many regions worldwide and an increase in the frequency and intensity of extreme weather events, such as heat waves, floods, droughts, storms and hurricanes. Climate change is also linked to more frequent severe wildfires, a loss of biodiversity, and numerous other disruptive events with significant socio-economic impacts [World Meteorological Organization (WMO), 2023; Zhou et al., 2023]. More specifically, Europe has experienced numerous weather-related disasters over the past two decades (Calvin et al., 2023; Kron et al., 2019). For example, in February 2022, storms Dudley, Eunice and Franklin hit part of northern Europe and the UK with significant damage (Mühr et al., 2022). According to EM-DAT (Emergency Events Database)1 inventory,2 23 deaths (including 16 deaths in the Irish Republic) were reported after the Eunice Storm, which affected various countries, while the number of injured individuals was 31 (28 in Northern France). Millions of properties and businesses were left without power at the storm’s peaks. The storm Dudley disrupted the air and the ferry traffic. More than 400 flights were canceled or delayed, and hundreds of trees and power cables were blown over. On the other hand, from May to August 2022, severe heat stress events caused by warm temperatures affected a large part of Europe (Copernicus, 2022). In August, European temperatures were significantly above average in the eastern part of the continent, while the southwest also experienced above-average temperatures. The most extreme temperatures were recorded from Portugal to Spain, across France, and into Italy. In Portugal and Spain, temperatures rising from low to high 40s °C were recorded starting on July 7, with a maximum temperature of 47 °C observed in Pinhão, Santa Bárbara, Portugal, and 45.7 °C recorded in Almonte, Huelva, Spain. These events have had deep impacts on human life, infrastructure, ecosystems and economies, highlighting the urgent need for effective climate services to identify and characterize the associated risks. In response to these growing challenges, the European Extreme Events Climate Index (E3CI) has been developed as a comprehensive climate service designed to assess weather-induced hazards. E3CI is an ensemble of indices aimed at providing information about the areas affected by different types of weather-induced hazards and the severity of such events. It was funded by International Foundation Big Data and Artificial Intelligence for Human Development (IFAB) and developed by the Euro-Mediterranean Center on Climate Change (CMCC) and Leithà Unipol Group. It is based on the corresponding index developed for the United States and Canada—Actuaries Climate Index-and for Australia—Australian Actuaries Climate Index (Gallant and Karoly, 2010).3 In those experiences, the target users are well identified (experts in actuarial sciences) and they support timely evaluations about the significance of specific events or trends in extreme weather events. Along the lines of such experiences, E3CI is aimed at equipping Europe with a similar tool identifying seven dynamics associated with hazards largely affecting the European continent: (i) extreme maximum temperatures, (ii) extreme minimum temperatures, (iii) extreme precipitation, (iv) extreme winds, (v) hail leading conditions, (vi) droughts, and (vii) forest fires leading conditions. For each of these hazards, on the basis of sector literature, an indicator is identified, calculated on the basis of atmospheric variables, and it is assumed acting as a “proxy” of the hazard. Such index is computed exploiting ERA5 reanalysis data, released by ECMWF and available in the Climate Data Store of the Copernicus Climate Change Service (C3S). The reference value is computed over the 1981–2010 time span, while the index, on a monthly basis, displays a standardized anomaly relative to the reference values. Then, values above 1 identify anomalies larger than those potentially associated with climatic interannual variability (summarized by the standard deviation). Therefore, E3CI is an innovative tool designed to assist actuaries, insurance companies, governments, and the general public in better understanding the potential effects of climate trends and extreme weather events. Many organizations supported by actuaries are concerned with climate risk and its potential impact on their business, including general insurers, banks and investment managers. The index is intended to provide a useful measure of how the weather extremes are changing in order to support assessment of the change in risk and provide crucial support for estimating and modeling climate-related insurance and financial risks. In this way, E3CI represents a significant advance in climate services, contributing to a more resilient and adaptive Europe in the face of climate change. The paper aims to provide information on the scientific and technical background, offer an initial validation of the various components, assess the user experience, and outline future improvements.
The paper is organized as follows: Section 2 describes the study area, the methodology and the data used to calculate the index. Section 3 presents the results obtained from applying the index to specific case studies. Finally, in Section 4 a discussion of the results is presented, while Section 5 contains the conclusions and inputs of development for future works.
A detailed characterization of the seven different components is included in Appendix A.
2 Materials and methods
2.1 Description of the area studio
The European continent exhibits a remarkable variety of physical and climatic characteristics, a result of its complex geological history and geographical position (Embleton, 1984; Cloetingh et al., 2007). The continent stretches from the Iberian Peninsula in the west to the Ural Mountains in the east, and from the Mediterranean Sea in the south to the Arctic Ocean in the north, covering approximately 10 million km2 (Goudie, 2017). The European climate is predominantly temperate, with significant regional variations due to latitude, altitude, and maritime influence (Peel et al., 2007). Several climatic subtypes can be identified:
1. Mediterranean in the south, characterized by hot, dry summers and mild, wet winters.
2. Oceanic in the west, with moderate temperatures and precipitation distributed throughout the year.
3. Continental in the east, with cold winters and hot summers.
4. Subarctic in the north, with long, severe winters and short, cool summers.
This climatic diversity is strongly influenced by the Gulf Stream, which moderates temperatures in the western coastal regions, allowing, for example, the cultivation of certain plant species at unusually high latitudes (Seager et al., 2002). Precipitation varies considerably, with maximum levels in mountainous areas and along the Atlantic coasts, and minimum levels in the continental interior and Mediterranean regions. Recent studies suggest that precipitation patterns in Europe are undergoing significant changes due to global warming (Jacob et al., 2013). In recent decades, climate change has begun to modify Europe’s physical and climatic landscape, with observable impacts on plant phenology, species distribution, and hydrological regimes [EEA (European Environment Agency), 2017]. In the service a bounding box in Figure 1 covering 72° N, 25 ° N, −25° W, 40° E has been chosen considering it representative of the entire continent.
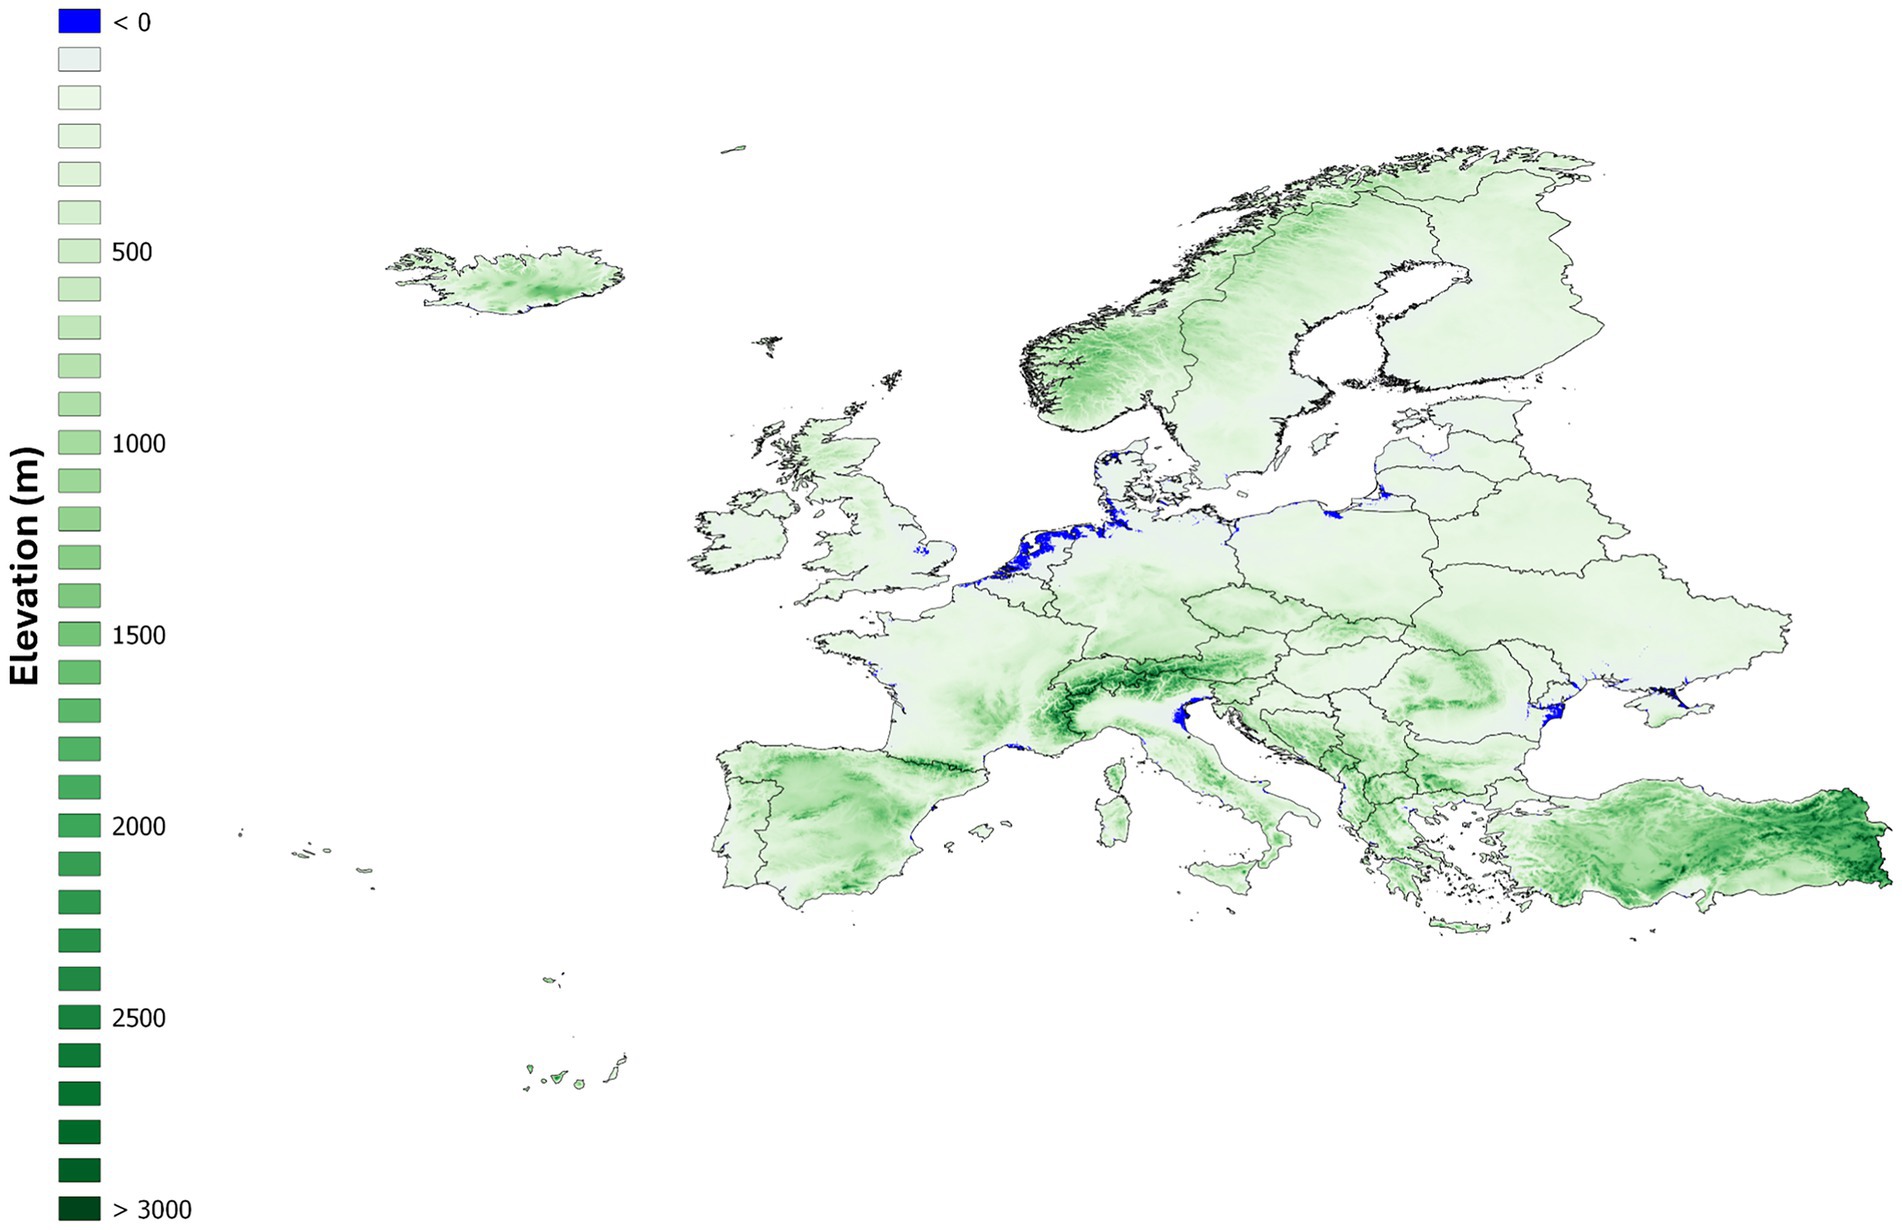
Figure 1. Geographical domain of the European territory under examination.
2.2 Datasets
In this study, the atmospheric reanalysis ERA5, developed by European Medium-Range Weather Forecast (ECMWF), is employed. ERA5 provides high-resolution meteorological and climate data, which are used to compute the indicators included in the European Extreme Events Climate Index (E3CI).
2.2.1 ERA5
The assessment of the components exploits ERA5 (Hersbach et al., 2020), the fifth-generation atmospheric reanalysis produced by ECMWF. ERA5 covers the entire globe on regular latitude-longitude grids at 0.25° × 0.25° (about 31 km) resolution from January 1940 to present. ERA5 is updated daily with a latency of about 5 days permitting a constant update of the components forming E3CI. Within the context of ERA5 both single level and pressure levels variables have been used and represented in Table 1.

Table 1. Era5 variables used for indicator computation.
2.3 Methods
In this section, we provide a detailed description of the methodology employed to calculate E3CI, with particular emphasis on the specific climate variables involved. The calculation method for E3CI is based on a standardized approach to quantify the intensity and frequency of extreme weather events. The procedure is articulated in several phases: initially, a reference period (1981–2010) is defined to establish a climatological baseline. For each indicator, an extreme event threshold is determined, typically based on specific percentiles (5th or 95th) of the data distribution in the reference period. Subsequently, for each month and year of interest, the exceedance of daily values above the predetermined threshold is quantified, aggregating these exceedances on a monthly basis.
To normalize the results, the monthly mean (μ) and standard deviation (σ) of the aggregated exceedances are calculated for the reference period. This approach allows the expression of anomalies in units of standard deviation, facilitating comparison across different climate variables and geographical regions. The values are computed at the grid point scale and can subsequently be aggregated across different administrative unit levels (Country, Global administrative unit layers Level 1–2). As additional information, the composite E3CI is finally calculated as the arithmetic mean of the standardized indicators, providing a synthetic measure of extreme climate variability on a monthly scale.
An overview on the computational methods is included in Appendix A.
2.4 Index distribution: E3CI data station
The development and dissemination of E3CI has been consistently aligned with a comprehensive communication and marketing strategy. During the development of the Index, communication efforts focused on generating leads through events and webinars. A significant achievement was establishing connections with IFAB’s network of partners to increase awareness of E3CI’s potential, understand its fields of use, and identify the target audience. In the initial phase of the index distribution, the Dataclime platform (as visible in Figure 2)—developed by the CMCC to transform climate data into useful and “tailored” information for users with different skills and needs—serves as a free data provider platform for national-level data.

Figure 2. Dataclime platform E3CI’s home page https://e3ci.dataclime.com/.
To expand the index’s reach and impact, different dedicated digital channels were created. Firstly, the E3CI website (Figure 3a) serves as the main showcase for the index. Secondly, the E3CI Data Station (Figure 3b) complements the Index’s services by offering a user-friendly dashboard where users can view and download an overview of weather-induced hazards across Europe. Basic data is available for free download, while more detailed information can be requested and accessed for a fee. All authors of the paper have been actively involved throughout the development, dissemination and maintenance of the platform, contributing their expertise and ensuring the strategic alignment of the initiative.

Figure 3. (a) E3CI index web page (https://climateindex.eu/en/); (b) E3CI data station homepage (https://datastation.climateindex.eu/en/about).
One of the most effective channels for disseminating information is the monthly newsletter, which provides users with a free overview of the previous month’s climate trends. Specifically, the newsletter aims to inform subscribers about monthly updates to the components and offer the latest information on the reliability of indicators related to major hazards potentially induced by extreme weather dynamics. Additionally, the newsletter has facilitated a survey to better understand the target audience and its needs, revealing significant interest from businesses and researchers. E3CI has already garnered significant interest and practical applications across various sectors. As of the latest data, the index has attracted 206 total users, with 136 subscribed to the newsletter, 49 exclusively downloading data, and 21 both receiving the newsletter and downloading data. This distribution highlights the diverse ways in which users engage with the E3CI platform.
3 Results and discussion
E3CI can be used for the back-analysis of events across different temporal and spatial scales. Below, it is shown how it can provide information on large-scale events (those that have affected significant portions of the European domain and, in many cases, received media attention) as well as more localized events. In such cases, it is obviously necessary to consider the availability of a database that can provide a catalog of events of interest. For this purpose, the choice is to use the EM-DAT catalog, as it is the only one capable of directly or indirectly covering all the dynamics of interest in E3CI, thus ensuring homogeneity in the coverage and selection of events. Nonetheless, this should not be considered as a validation of the index in a broad sense for several reasons:
• EM-DAT is an impact catalog, whereas the indicator provides monthly-scale information on proxies of hazards;
• EM-DAT may account for very localized events, both spatially and temporally, which might not be captured by E3CI, built using ERA5 data with a monthly granularity;
• At the same time, the EM-DAT/E3CI comparison could be useful for high-impact events to determine whether an atmospheric pattern can be identified in their triggering and severity.
Furthermore, while the E3CI captures the aggregated monthly behavior of extreme events, it does not resolve sub-monthly dynamics. For example, a single-day event with extreme intensity may not lead to a high monthly index value unless it substantially influences the cumulative anomaly. Our methodology adopts the temporal granularity of the US index. Although this does not allow for a distinction between short-lived and prolonged events, the approach is inherently scalable to coarser temporal resolutions. When applied to multiday aggregations, however, the index cannot differentiate whether an anomaly stems from a brief, high-impact event or a more persistent phenomenon. This limitation should be taken into account when interpreting the index in the context of specific daily-scale disasters.
3.1 Exploiting E3CI to support the back-analysis of events
The Emergency Events Database (EM-DAT, Sapir and Misson, 1992)4 was established in 1988 by the Center for Research on the Epidemiology of Disasters (CRED) and the World Health Organization (WHO). It contains data on over 26,000 disasters worldwide from 1900 to the present, aggregating information from UN agencies, NGOs, reinsurance companies, research institutes, and media outlets. EM-DAT provides multi-hazard coverage and spatial resolution comparable to the administrative units used in our index. Although EM-DAT records impacts rather than hazards, we used it as a case study to demonstrate the index’s ability to capture significant events on various scales. Between 2011 and 2021 the database returns 2015 events highlighting France (9.5% of total events), Italy (8.3%), and Poland (8.1%) as the most affected countries (Figure 4a).
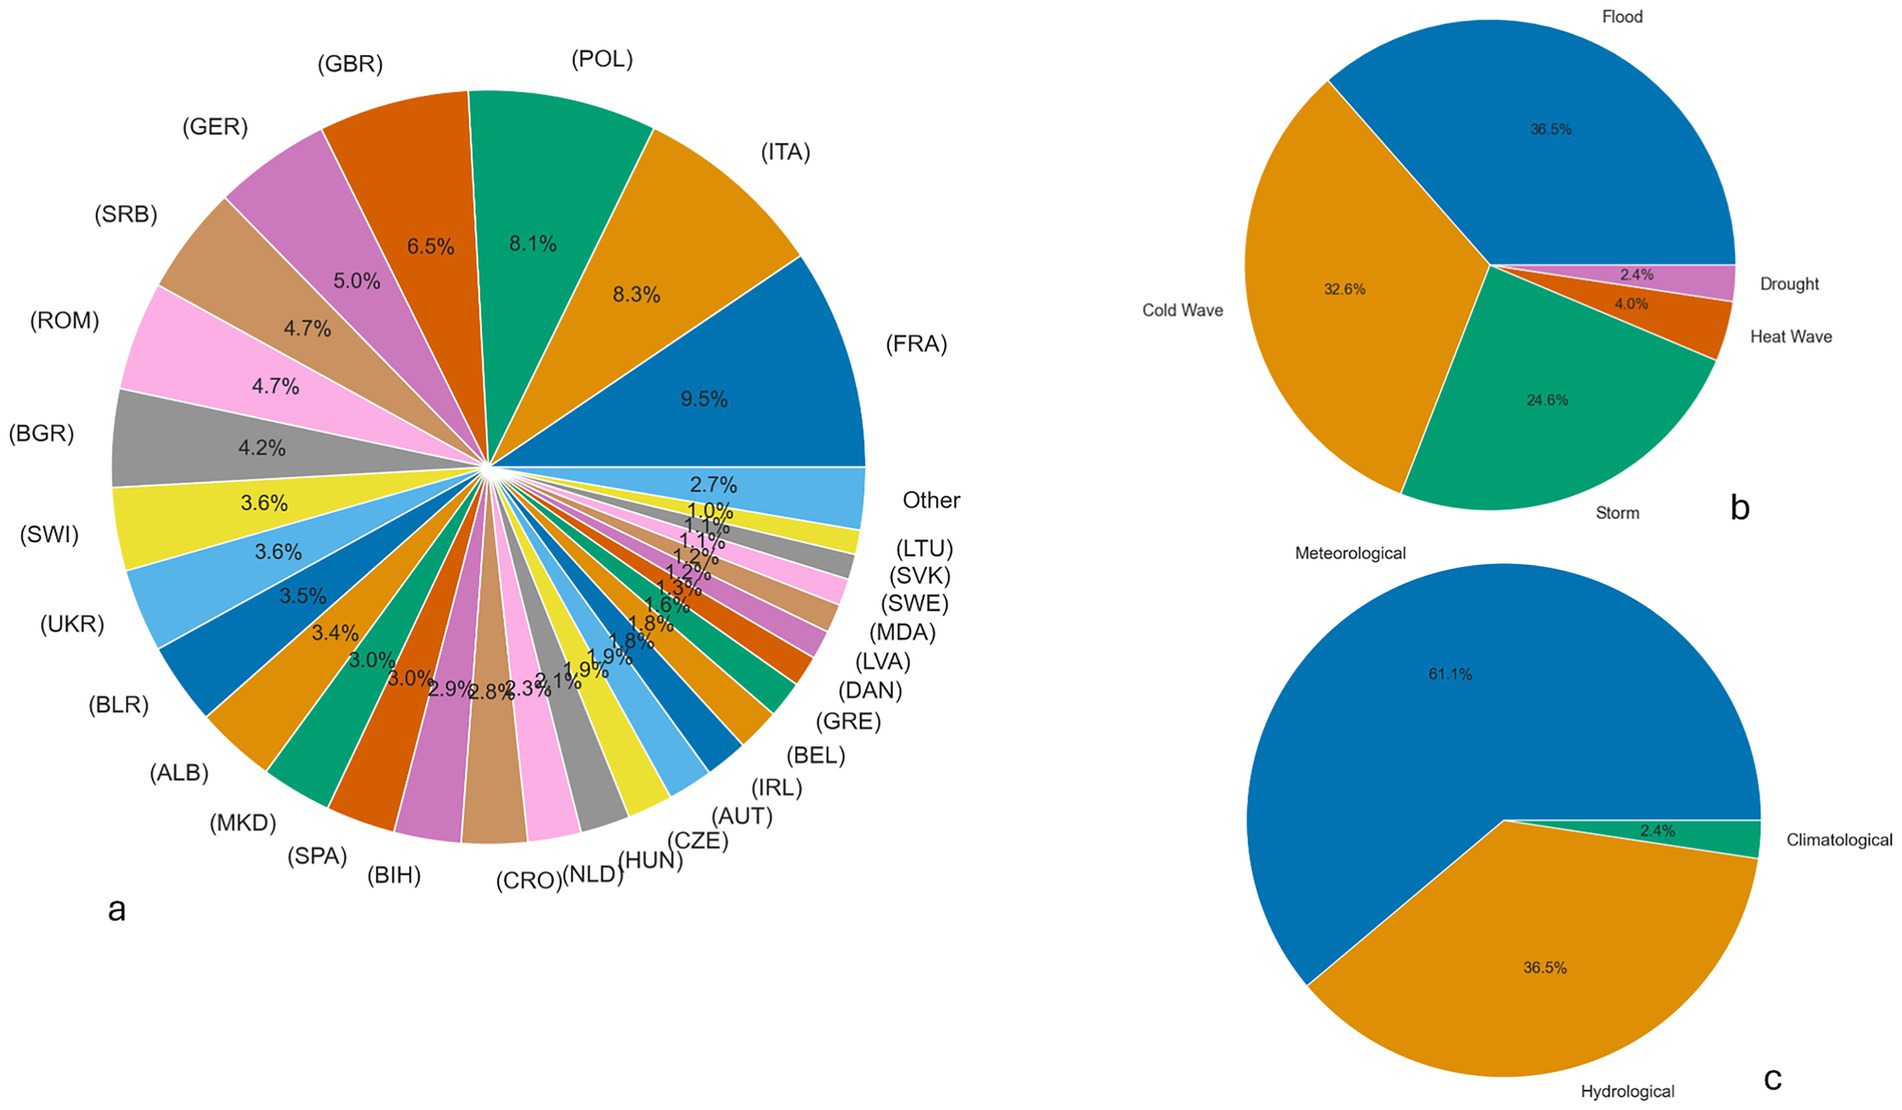
Figure 4. (a) Percentage of affected countries; (b) type of impact of the territory; (c) percentage of nature of the events.
The majority of recorded events (Figure 4c) are meteorological in nature, accounting for about 61.1%, the remaining events are divided into hydrological and climatological, 36.5 and 2.4%, respectively. The climatological category primarily includes drought, while hydrological events are primarily driven by floods. Meteorological events are divided into Cold Wave (32.6%), Storm (24.6%), and Heat Wave (4%) as shown in Figure 4b.
The analysis of indicators presented in Figure 5 demonstrates how the system can distinguish and quantify different types of extreme events. Specifically, the ability to capture the wide spectrum of storm intensities, visible through the extension of the box plot and whiskers, highlights the method’s sensitivity in detecting events of varying magnitude.
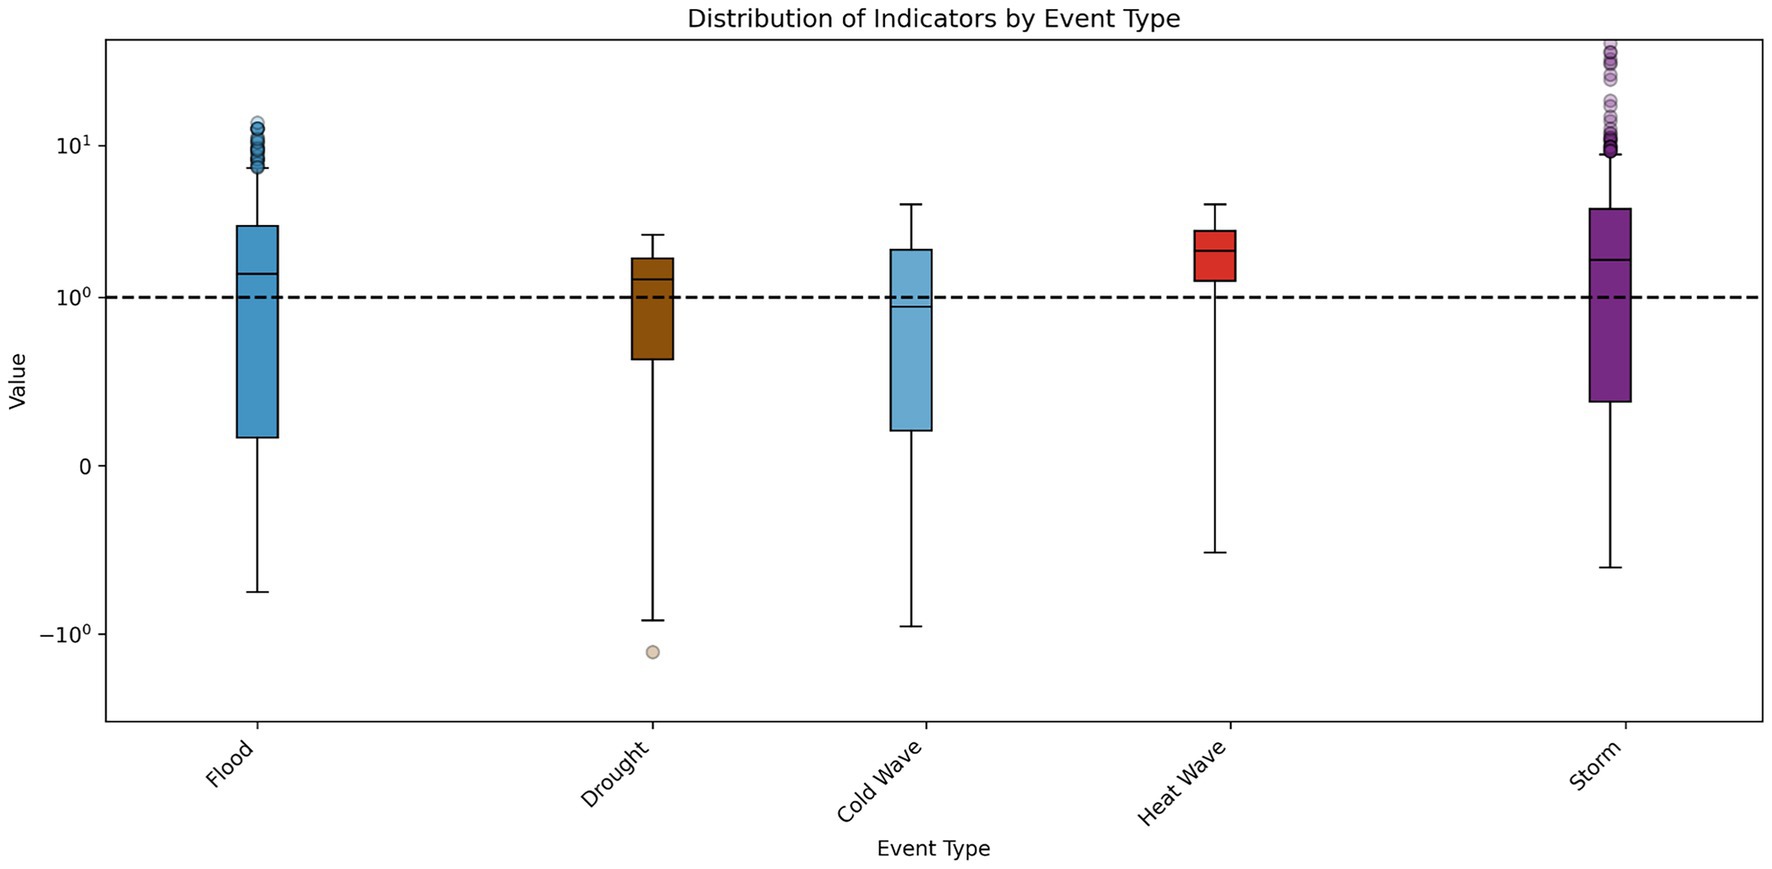
Figure 5. Box plot of the values of indicators during the extreme events.
For the different dynamics accounted for by EM-DAT and E3CI, Figure 6 illustrates the ratio between the number of times for which the specific E3CI provides values exceeding 1 and the number of records reported in EM-DAT. It should not be viewed as a validation given the specific differences between the datasets but it could support an analysis about the events for which E3CI can provide information supporting the back-analysis of the events. It is clear how large scale events are well represented (droughts and extreme maximum temperatures). Furthermore, it is clear how when the impacts are clearly associated with cumulative effects (precipitation deficit, heatwaves), the E3CI indicators can provide useful information supporting the investigation. On the other hand, for spatial and temporal localized dynamics, the weaknesses affecting the input dataset (ERA5 with an horizontal resolution at about 30 km) or the strong assumption according to which the indicator can work as a proxy for the hazard can fail. Nonetheless, in many cases, the disasters occurring and documented in EM-DAT could be due also to the lack of coping capabilities (then, also under not exceptional weather induced triggering, disasters can occur).
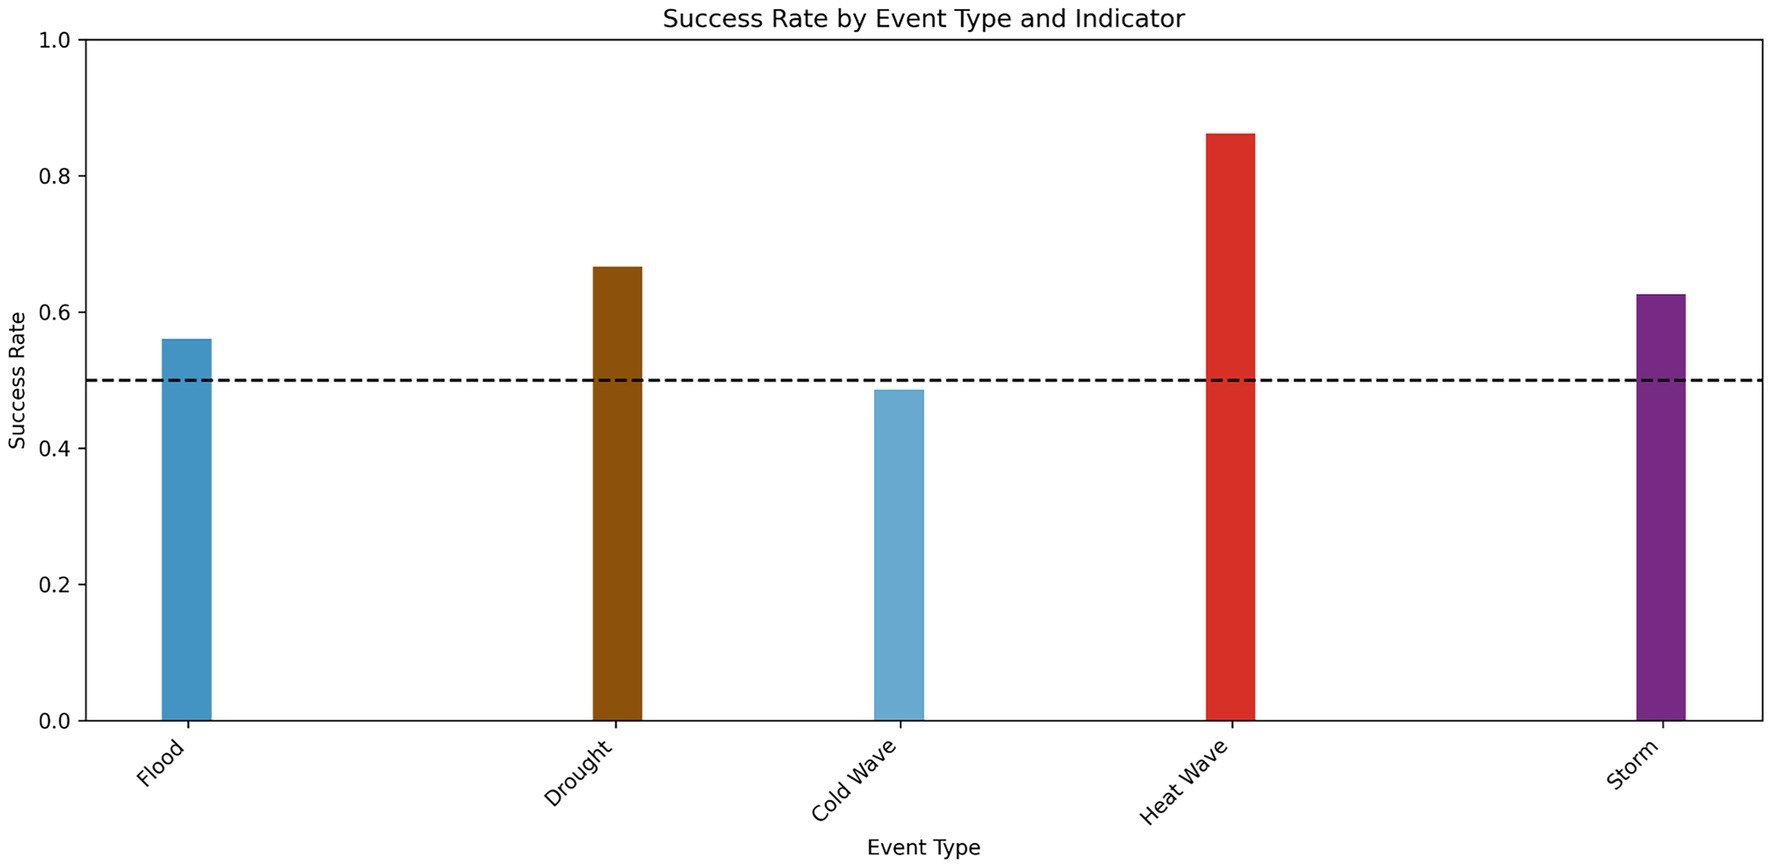
Figure 6. Success percentage for event type.
Figure 7 explores the system’s analytical capabilities in characterizing the complexity of weather events through joint analysis of extreme wind and precipitation. The scatter plot reveals important insights into the intervariable dependency structure: most extreme events are characterized by dominance of a single variable rather than simultaneous extremes in both wind and precipitation. The data shows a clear inverse relationship pattern, with high precipitation extremes occurring predominantly at low wind speeds, while extreme wind events are associated with minimal precipitation extremes. This suggests that meteorological systems typically channel their energy into either wind or precipitation extremes, rarely producing simultaneous maxima in both variables.
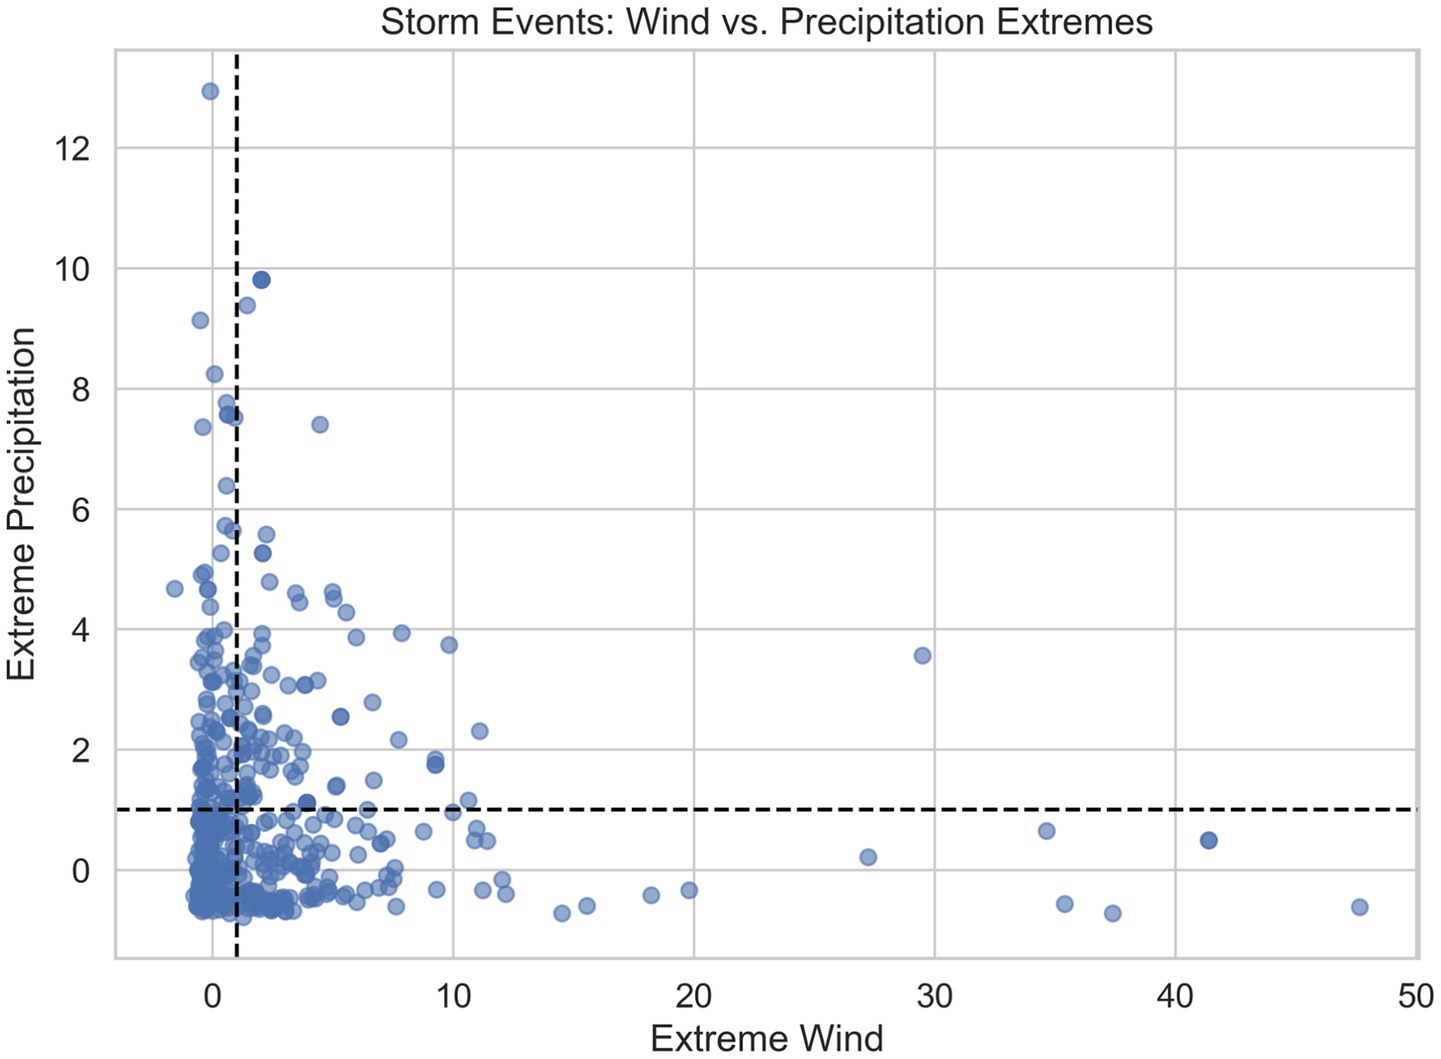
Figure 7. Spread of extreme wind and extreme precipitation during storm events.
The clustering of events near the axes (horizontal dashed line at precipitation ~1 and vertical dashed line at wind ~0) indicates that compound extreme events—where both wind and precipitation reach high values simultaneously—are relatively rare in the dataset. This intervariable structure has important implications for risk assessment: while extreme wind events show an upper limit around 50 units and extreme precipitation displays a broader distribution up to 13 units, the low probability of concurrent extremes suggests that emergency response systems may need to prepare for single-hazard dominance rather than multi-hazard scenarios.
The system’s effectiveness is demonstrated through real cases: it accurately quantified the extreme precipitation event in the Balkans in January 2021 (E3CI indicator equal to 14, with minimal wind component), which required evacuation of 70 people, and Storm St. Jude in 2013 (wind index 47, with low precipitation extremes), which had significant impacts in Northwestern Europe. These examples illustrate how the system can provide objective metrics for events of significant social impact, while the intervariable analysis suggests potential applications in compound event risk assessment and emergency response planning.
3.2 Analysis on relevant events
The E3CI also provides valuable insights through the visual inspection of the spatial extent of specific events, highlighting their relevance and identifying areas where the main impacts are likely concentrated. A few examples are presented below, with additional details available in a dedicated section of the E3CI website.
3.2.1 Dudley, Eunice and Franklin storms
In February 2022, a sequence of powerful storms known as Dudley, Eunice, and Franklin hit several regions in Europe causing countless damages in the UK, Ireland, Belgium, Netherlands, Germany, Poland, Czech Republic, Denmark, France, and Lithuania. The E3CI indices were analyzed to assess whether the spatial distribution of the hazards aligned with the observed impacts, focusing on extreme precipitation and extreme wind conditions. Figure 8 shows the areas more impacted, in relation to precipitation (8a), as expected, just some of those are highlighted with blue colors. While for wind (8b) all the regions recognized as impacted, are characterized by extreme wind indicator values higher than 1.
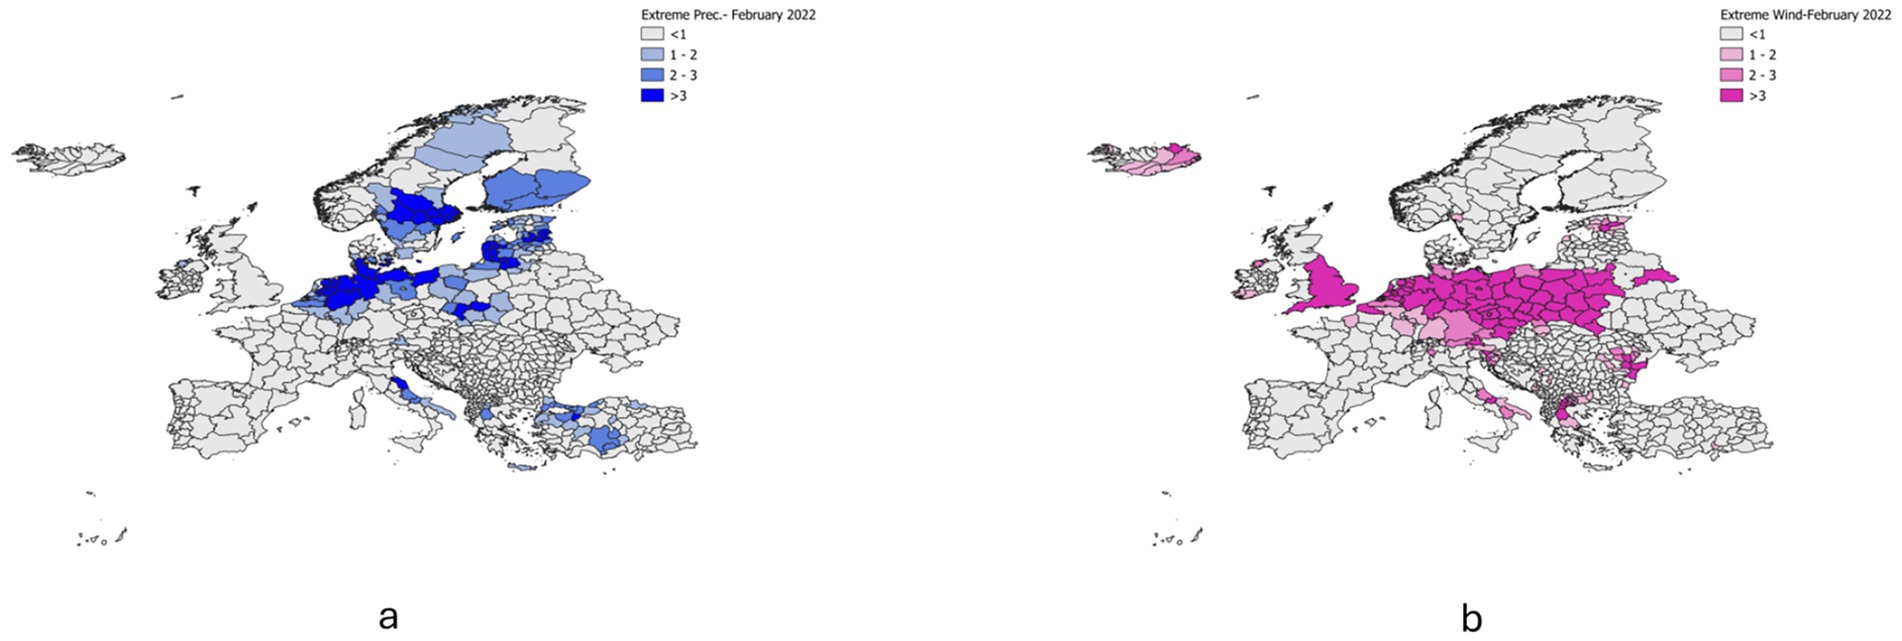
Figure 8. E3CI’s extreme precipitation (a) and extreme wind (b) computed for February 2022.
3.2.2 2022 hot waves
The summer of 2022 was one of the hottest season since registration started, characterized by an intense series of heat waves, which led to extreme values in terms of temperature with the highest temperature from June to August by substantial margins of 0.8 °C in 2018 for August and 0.4 °C in 2024 for the entire summer (Copernicus, 2022).
In different areas they were also associated with precipitation shortage exacerbating the cascading impacts. European temperatures were most above average in the east of the continent in August, but still well above average in the south-west, with the most extreme temperatures occurring from Portugal to Spain across France and within Italy. Considering the extreme maximum temperature indicator mentioned in Section 2, Figure 9 refers to the time span between May 2022 and August 2022 and it shows the areas most affected by heat, with dark-orange colors for the most impacted regions, and light-orange colors for those still impacted, but with lower significance.
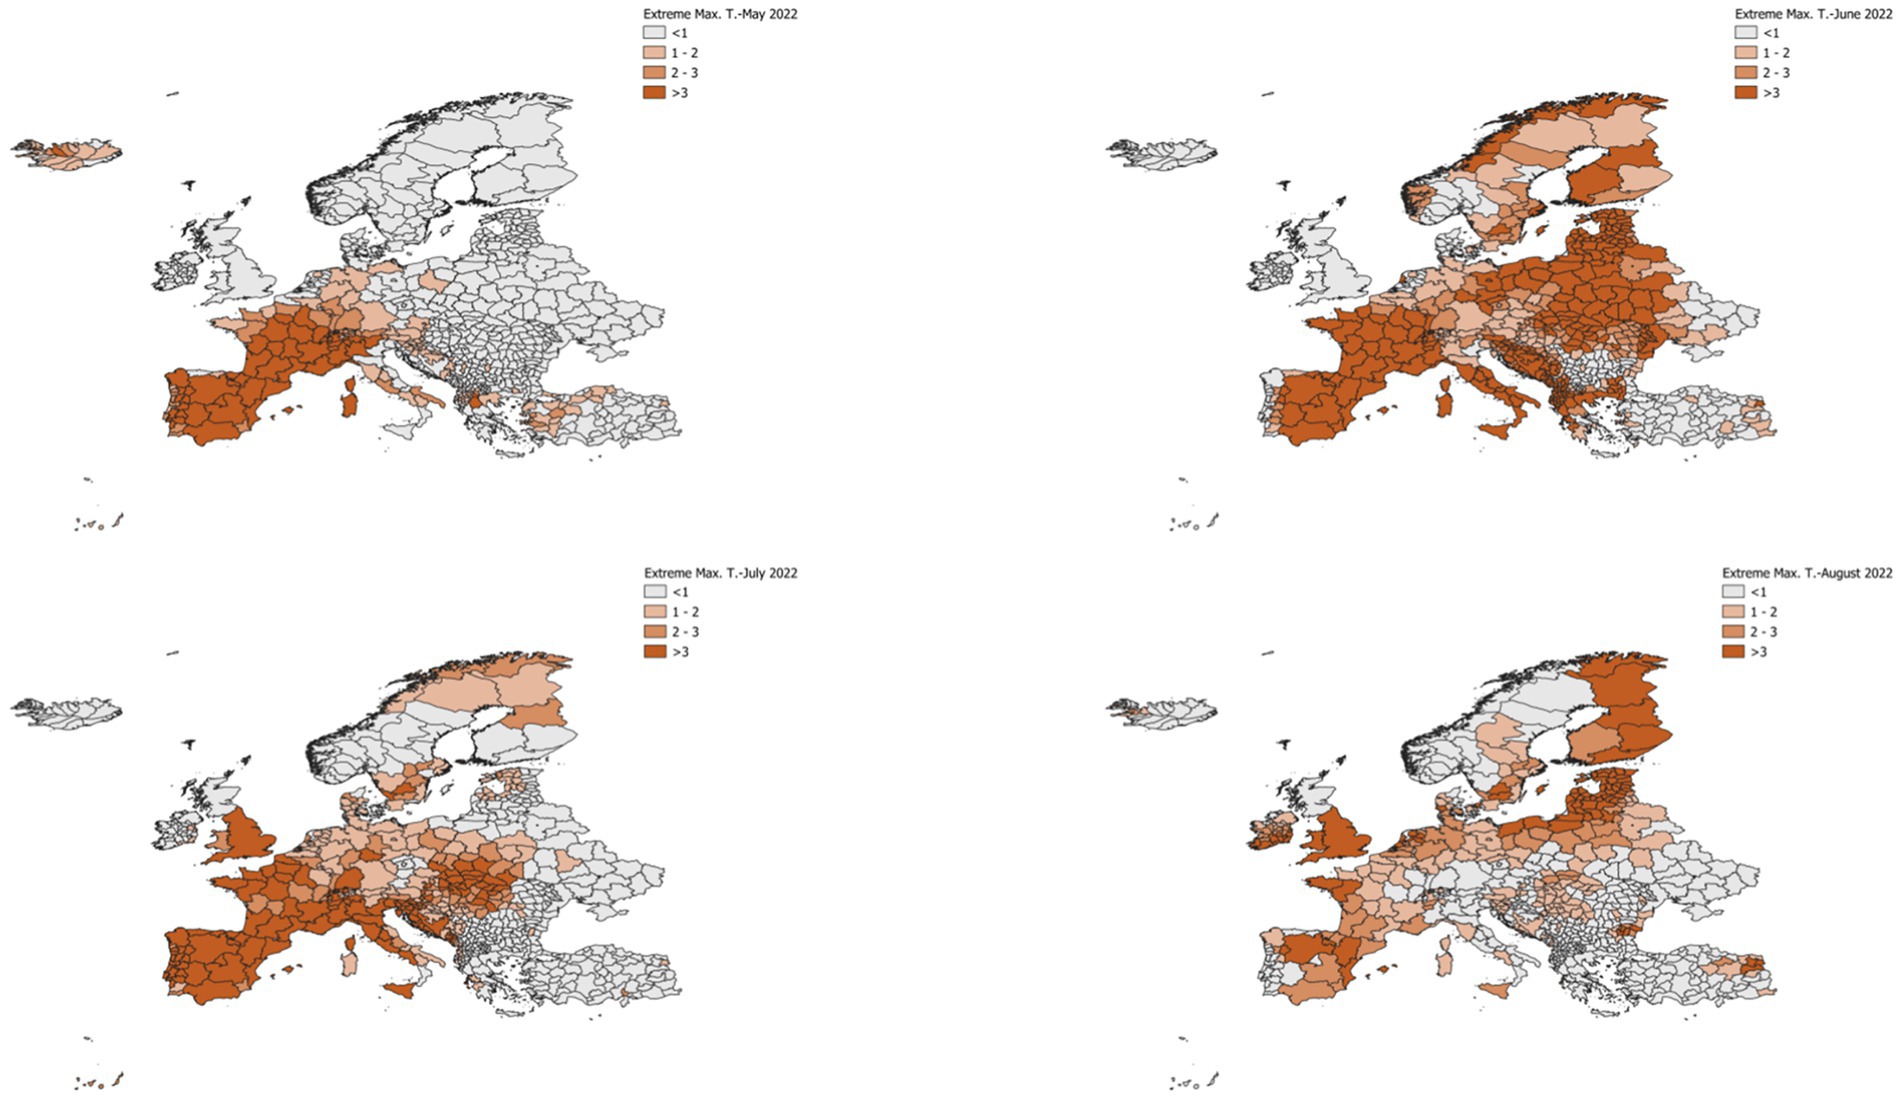
Figure 9. E3CI’s extreme maximum temperature from May (upper left) to August (lower right).
In relation to extreme maximum temperature conditions, all the impacted regions are characterized by indicator values higher than 1, which imply an adequate representation of the phenomenon by the index.
3.2.3 Precipitation induced disaster in Emilia-Romagna region
During the first 3 weeks of May, the Emilia-Romagna region in Central Italy experienced four separate instances of heavy rainfall. These events resulted in extensive damage and loss of life. In particular:
May 1st–4th: At regional level, the cumulative values over 48 h were the largest ones since 1997 and record-breaking for the spring season (they represent maximum point scale values for 27 stations over 45 in the central-eastern part of the region); for 24-h durations, several stations in Bologna, Ravenna, and Forlì-Cesena Provinces observed precipitation levels associated with a return period exceeding 100 years. In this regard, on May 1st, the maximum values did not exceed 70 mm while the following day, the analysis of rain gauges and radar data returned values largely exceeding 150 mm (a peak of 204,6 mm was observed for the station “Le Taverne (Fontanelice, Bologna Province)”). Due to such heavy rainfall events, river floodings were observed in several basins (Samoggia, Idice, Quaderna, Sillaro, Santerno, Senio, Lamone e Montone, not larger than 400–500 [Km]^2) inducing damages to crops, production plants and settlements while several landslide events occurred along the Apennines mountain chains.
• May 9–10th: Starting from the afternoon of May 9th, extreme precipitation affected a large part of the Emilia Romagna Region. During the first day, the cumulative values did not exceed 50 mm while the following day the obtained values were slightly larger than 100 mm in the Ferrara Province. Hourly values close to 20 mm were observed, instead in Bologna province. Such events induced limited damages (e.g., flooding of the basements).
• May 12–14th: On the first day, a large part of the Region was affected by intense short convective rainfall events and hailing that occurred, in a less intense way, also during the following days. Daily values results are not exceptional while values over 15 min were larger than 8 mm in multiple locations.
• May 16–18th: The precipitation was localized on the hilly and foothill territories of Central-Eastern Emilia Romagna; the maximum cumulative values over 48 h were observed especially in the territories of Imola, Forlì and Faenza (260.8 mm, 254.8 mm and 254.6 mm).
The cumulative precipitation recorded in the period between May the 1st and May 17th represent the record-breaking value for over 65% of the rain gauges in the Central-Eastern part of the Emilia-Romagna Region with average values of about 300–400 mm and peaks up to 600 mm at Trebbio and 563 at “Le Taverne (Fontanelice, Bologna Province).”
Figure 10 returns information about the value of the extreme precipitation indicator aggregated at province level. It is clear that the events prominently affected the eastern part of the region. The highest anomalies in units of standard deviation is observed over Bologna Province (16.3) while it represents the largest on the entire ranking also for the Ferrara Province (10.1). Furthermore, it results in the highest value computed over May for all the provinces except Parma and Piacenza, where values close or below to 0. The index appears to have effectively captured the spatial distribution and intensity of the extreme precipitation, highlighting the areas most severely impacted by the May 2023 floods.
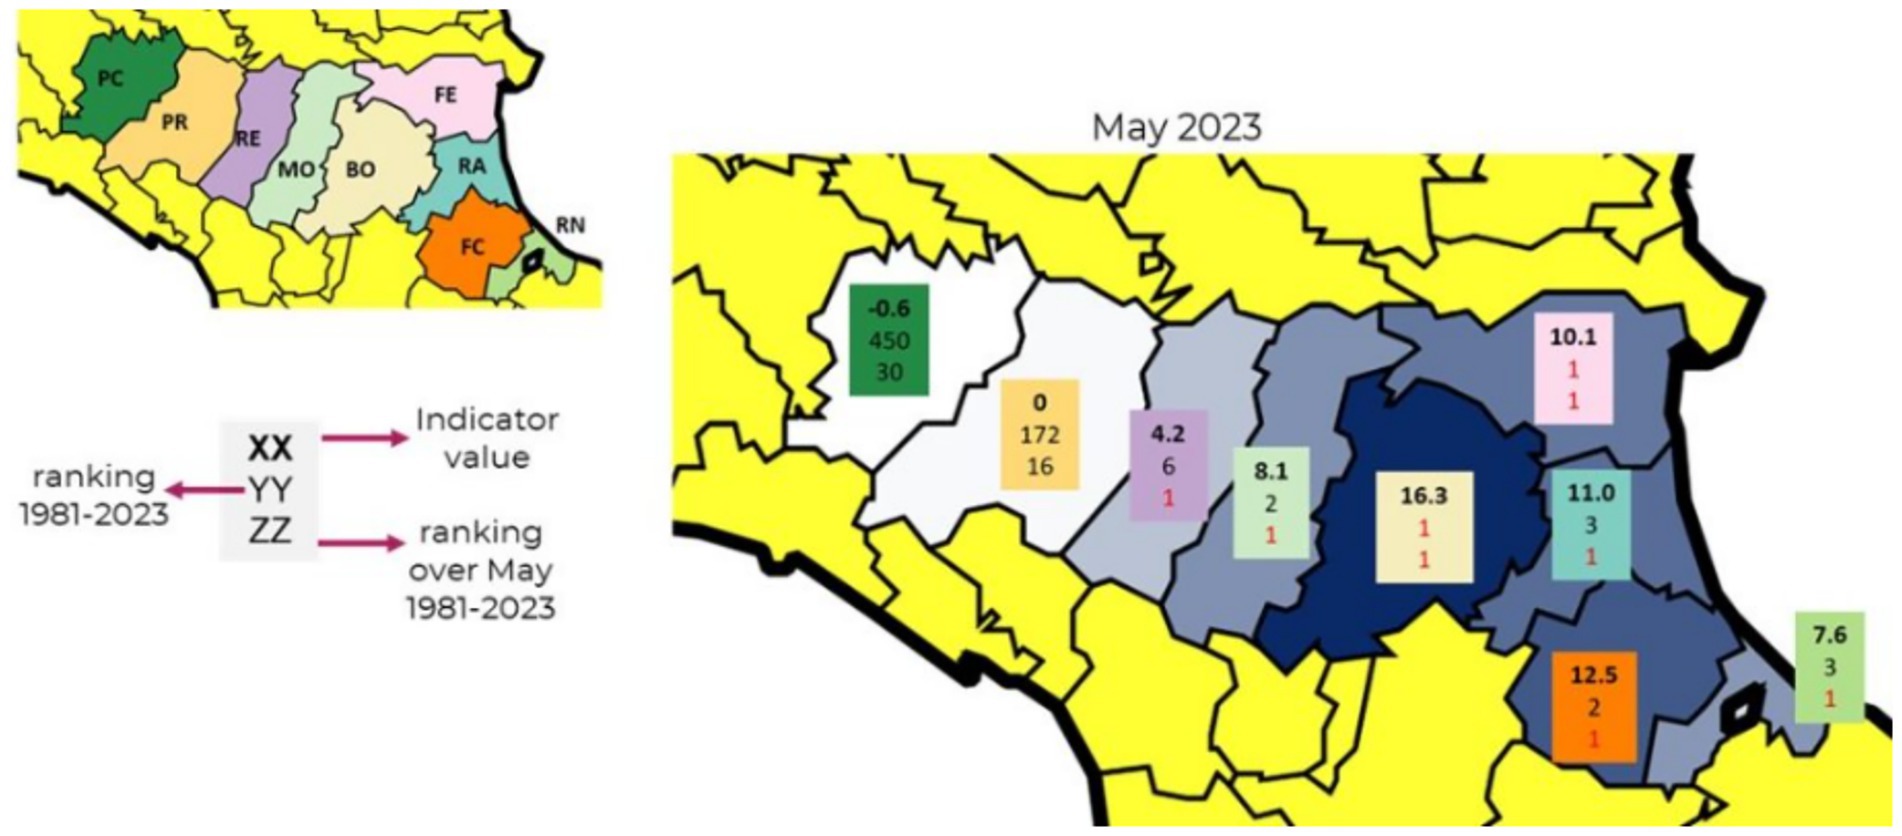
Figure 10. E3CI’s extreme precipitation for Emilia Romagna Region, aggregated at province scale.
4 Conclusion
In this study, the European Extreme Events Climate Index (E3CI) was proposed as a comprehensive tool for assessing weather-induced hazards across Europe. By integrating seven key components—extreme maximum and minimum temperatures, drought, extreme precipitation, extreme winds, hail5 leading conditions, and forest fire leading conditions—E3CI provides an accurate understanding of climate-related risks. The index uses ERA5 atmospheric reanalysis data, ensuring high spatial and temporal resolution. This approach allows us to accurately represent climate anomalies with respect to the reference period (1981–2010) and to precisely identify the most vulnerable regions. E3CI has proven effective in identifying the extreme events on a monthly scale, as demonstrated by comparisons with the EM-DAT database for the period 2011–2021. For example, it successfully captured spatial distribution and intensity of the extreme precipitation and extreme wind events in the areas affected by powerful storms Dudley, Eunice, and Franklin, as well as the significant heat waves in the summer of 2022 and the extreme precipitation in Emilia Romagna in May 2023.
This highlights the index’s capability to accurately quantify and mapping extreme weather events, a critical aspect for effective risk assessment and management. E3CI has already garnered significant interest and practical applications across various sectors. Central banks have utilized E3CI data for internal reports and economic impact assessment (Nickel et al., 2025). In academia, researchers have incorporated E3CI data into studies evaluating the impacts of the Paris Agreement (Schwerdtle et al., 2023). The Public Finance Council in Portugal is employing E3CI data in draft reports, demonstrating its relevance to public finance planning. In the private sector, Unipol Leithà is leveraging E3CI as a key tool in the development of “Life ADA (Adaptation in Agriculture),” a project dedicated to resilience to climate change in the agri-food sector.
This wide-ranging adoption across financial institutions, academia, public bodies, and private enterprises underscores the versatility and importance of E3CI in addressing climate-related risks and supporting informed decision-making. However, the index is primarily designed for retrospective analysis, which, while effective for understanding past events, restricts its capacity to offer forward-looking insights or predictive information for future periods. To enhance the effectiveness and applicability of the E3CI, future research should aim to develop methodologies that allow its use in forward-looking or scenario-based assessments, thereby improving its utility for climate adaptation planning and early warning systems. As clearly stated in the manuscript, the E3CI is currently conceived and implemented as a retrospective diagnostic tool, primarily intended to monitor and characterize past and ongoing climate extremes. Nevertheless, we fully acknowledge that extending its application to predictive contexts would significantly increase its value for operational climate services. In principle, the E3CI framework is adaptable to forward-looking modes, provided that appropriate climate projections or forecasts are available.
This includes, for instance, the use of data from global climate model ensembles such as CMIP5 and CMIP6, as well as high-resolution regional projections (e.g., EURO-CORDEX), which can support long-term risk assessments under various climate change scenarios. Furthermore, the E3CI could be computed based on sub-seasonal to seasonal (S2S) and decadal forecasts, thereby expanding its potential to support medium-to long-range early warning applications. The monthly temporal resolution of the index aligns well with the typical lead times of seasonal forecasting systems, making such extensions operationally feasible.
However, the primary methodological challenge in transitioning the E3CI to a predictive framework lies in the requirement for a consistent 30-year reference baseline, necessary for the computation of standardized anomalies. This baseline ensures temporal comparability and is critical for accurately quantifying the magnitude and rarity of extreme conditions. Consequently, any forward-looking application of the E3CI would necessitate the construction of synthetic reference climatologies, derived from model hindcasts or historical simulations specific to the forecast system in use. Although this adds a layer of complexity, similar approaches have been successfully implemented in other climate anomaly indicators, suggesting that the adaptation of E3CI to predictive settings is both methodologically sound and practically achievable.
Data availability statement
The datasets presented in this study can be found in online repositories. The names of the repository/repositories and accession number(s) can be found at: https://e3ci.dataclime.com/ and https://datastation.climateindex.eu/en/max-temperature/2025/03.
Author contributions
GG: Software, Writing – review & editing, Writing – original draft, Data curation, Formal analysis. AP: Validation, Writing – review & editing, Writing – original draft. CV: Writing – review & editing, Writing – original draft. GB: Writing – review & editing. ME: Writing – review & editing. AT: Writing – review & editing. FL: Writing – review & editing. LM: Writing – review & editing. EG: Writing – review & editing. AB: Software, Writing – review & editing. PM: Writing – review & editing. GR: Writing – review & editing, Conceptualization, Supervision.
Funding
The author(s) declare that financial support was received for the research and/or publication of this article. This work was supported by IFAB International Foundation Big Data and Artificial Intelligence for Human Development, Call for Projects 2021–2022 and subsequent editions.
Acknowledgments
The authors want to acknowledge Francesco Repola for his valuable contribution during the initial phase of the project, all the developers for the development and maintenance of the Dataclime platform, and Cinzia Bongino and her team for the realization of the Data Station.
Conflict of interest
The authors declare that the research was conducted in the absence of any commercial or financial relationships that could be construed as a potential conflict of interest.
Generative AI statement
The author(s) declare that no Gen AI was used in the creation of this manuscript.
Any alternative text (alt text) provided alongside figures in this article has been generated by Frontiers with the support of artificial intelligence and reasonable efforts have been made to ensure accuracy, including review by the authors wherever possible. If you identify any issues, please contact us.
Publisher’s note
All claims expressed in this article are solely those of the authors and do not necessarily represent those of their affiliated organizations, or those of the publisher, the editors and the reviewers. Any product that may be evaluated in this article, or claim that may be made by its manufacturer, is not guaranteed or endorsed by the publisher.
Supplementary material
The Supplementary material for this article can be found online at: https://www.frontiersin.org/articles/10.3389/fclim.2025.1628534/full#supplementary-material
Footnotes
1. ^https://datastation.climateindex.eu/
2. ^https://www.emdat.be/publications/
References
Calvin, K., Dasgupta, D., Krinner, G., and Mukherji, A., (2023). “IPCC, 2023: Climate Change 2023: Synthesis Report.” Contribution of Working Groups I, II and III to the Sixth Assessment Report of the Intergovernmental Panel on Climate Change [Core Writing Team, H. Lee and J. Romero (eds.)]. IPCC, Geneva, Switzerland.
Cloetingh, S., Ziegler, P., Bogaard, P., and Andriessen, P. (2007). Topo-Europe: the geoscience of coupled deep earth-surface processes. Glob. Planet. Chang. 58, 1–118. doi: 10.1016/j.gloplacha.2007.02.008
Copernicus. (2022). Summer 2022 Europe’s hottest on record. Available online at: https://climate.copernicus.eu/copernicus-summer-2022-europes-hottest-record (Accessed August, 2025).
Czernecki, B., Taszarek, M., Marosz, M., Półrolniczak, M., Kolendowicz, L., Wyszogrodzki, A., et al. (2019). Application of machine learning to large hail prediction - the importance of radar reflectivity, lightning occurrence and convective parameters derived from ERA5. Atmos. Res. 227, 249–262. doi: 10.1016/j.atmosres.2019.05.010
EEA (European Environment Agency). (2017). Climate change, impacts and vulnerability in Europe 2016: An indicator-based report (EEA Report No. 1/2017). Publications Office of the European Union.
Gallant, A. J. E., and Karoly, D. J. (2010). A combined climate extremes index for the Australian region. J. Clim. 23, 6153–6165. doi: 10.1175/2010jcli3791.1
Goudie, A. S. (2017). The human impact on the natural environment: Past, present and future. Chichester, West Sussex, UK: John Wiley & Sons, Ltd.
Hersbach, H., Bell, B., Berrisford, P., and Hirahara, S. (2020). The ERA5 global reanalysis. Q. J. R. Meteorol. Soc. 146, 1999–2049. doi: 10.1002/qj.3803
Jacob, D., Petersen, J., Eggert, B., and Alias, A. (2013). Euro-CORDEX: new high-resolution climate change projections for European impact research. Reg. Environ. Chang. 14, 563–578. doi: 10.1007/s10113-013-0499-2
Kron, W., Eichner, J., and Kundzewicz, Z. W. (2019). Reduction of flood risk in Europe–reflections from a reinsurance perspective. J. Hydrol. 576, 197–209. doi: 10.1016/j.jhydrol.2019.06.050
McKee, T.B., Doesken, N.J., and Kleist, J. (1993). “The relationship of drought frequency andduration to time scale.” In: Proceedings of the eighth conference on applied climatology, Anaheim, California, 17–22 January 1993. Boston, American Meteorological Society, 179–184.Edwards, D.C. and T.B. McKee. 1997. Characteristics of 20th century drought in the United States at multiple time scales. Climatology report number 97–92. Colorado State University, Fort Collins.
Mühr, B., Eisenstein, L., Pinto, J. G., Knippertz, P., and Mohr, S. (2022). Winter storm series: Ylenia, Zeynep, Antonia (int: Dudley, Eunice, Franklin) February 2022 (NW and Central Europe). CEDIM Forensic Disaster Analysis Group (FDA), Report No. 1.
Nickel, C., Kilponen, J., Moral-Benito, E., and Koester, G. B. (2025). A strategic view on the economic and inflation environment in the euro area. SSRN Electron. J. doi: 10.2139/ssrn.5332350
Pan, Q., Porth, L., and Li, H. (2022). Assessing the effectiveness of the actuaries climate index for estimating the impact of extreme weather on crop yield and insurance applications. Sustainability 14:6916. doi: 10.3390/su14116916
Peel, M. C., Finlayson, B. L., and McMahon, T. A. (2007). Updated world map of the Köppen-Geiger climate classification. Hydrol. Earth Syst. Sci. 11, 1633–1644. doi: 10.5194/hess-11-1633-200
Rousi, E., Kornhuber, K., Beobide-Arsuaga, G., Luo, F., and Coumou, D. (2022). Accelerated western European heatwave trends linked to more-persistent double jets over Eurasia. Nat. Commun. 13:3851. doi: 10.1038/s41467-022-31432-y
Sapir, D. G., and Misson, C. (1992). The development of a database on disasters. Disasters 16, 74–80.
Schwerdtle, P. N., Cavan, E., Pilz, L., Oggioni, S. D., Crosta, A., Kaleyeva, V., et al. (2023). Interlinkages between climate change impacts, public attitudes, and climate action—exploring trends before and after the Paris Agreement in the EU. Sustainability 15:7542. doi: 10.3390/su15097542
Seager, R., Battisti, D. S., Yin, J., Gordon, N., Naik, N., Clement, A. C., et al. (2002). Is the Gulf stream responsible for Europe’s mild winters? Q. J. R. Meteorol. Soc. 128, 2563–2586. doi: 10.1256/qj.01.128
Van Wagner, C. E. (1987). Development and structure of the Canadian Forest Fire Weather Index System. Headquarters, Ottawa: Canadian Forestry Service. Forestry Technical Report. 35:35.
World Meteorological Organization (WMO). (2023). State of the Global Climate 2023. WMO-No. 1347. Available online at: https://library.wmo.int/viewer/68835/download?file=1347_Global-statement-2023_en.pdf&type=pdf&navigator=1 (Accessed August, 2025).
Keywords: extreme weather events, climate index, climate service, decision making, insurance, data visualization
Citation: Giugliano G, Pugliese A, De Vivo C, Barbato G, Ellena M, Tirri A, Lo Conti F, Mortini L, Gallo E, Bonfiglio A, Mercogliano P and Rianna G (2025) European extreme events climate index (E3CI): a climate service for weather induced hazard. Front. Clim. 7:1628534. doi: 10.3389/fclim.2025.1628534
Edited by:
Matthew Collins, University of Exeter, United KingdomReviewed by:
Yoann Robin, UMR8212 Laboratoire des Sciences du Climat et de l'Environnement (LSCE), FranceMasoud Rostami, Potsdam Institute for Climate Impact Research (PIK), Germany
Copyright © 2025 Giugliano, Pugliese, De Vivo, Barbato, Ellena, Tirri, Lo Conti, Mortini, Gallo, Bonfiglio, Mercogliano and Rianna. This is an open-access article distributed under the terms of the Creative Commons Attribution License (CC BY). The use, distribution or reproduction in other forums is permitted, provided the original author(s) and the copyright owner(s) are credited and that the original publication in this journal is cited, in accordance with accepted academic practice. No use, distribution or reproduction is permitted which does not comply with these terms.
*Correspondence: Alessandro Pugliese, YWxlc3NhbmRyby5wdWdsaWVzZUBjbWNjLml0