 Johannes Meyer zu Drewer1,2,3*
 Maria-Elena Vorrath4
 Thorben Amann4
 Jens Hartmann4
 Jose Maria De la Rosa5
 Jens Möllmer6
 Sara Maria Pérez-Dalí5
 William Meredith7Clement Uguna7
 Colin Snape7
 Claudia Kammann8
 Hans-Peter Schmidt9
 Nikolas Hagemann1,2*
- 1Ithaka Institute, Goldbach, Germany
- 2Agroscope, Zürich, Switzerland
- 3Institute for Sustainable Energy Systems, Offenburg University, Offenburg, Germany
- 4Institute for Geology, University of Hamburg, Hamburg, Germany
- 5Instituto de Recursos Naturales y Agrobiología de Sevilla, IRNAS-CSIC, Seville, Spain
- 6Institute for Non-Classical Chemistry eV (INC), Leipzig, Germany
- 7University of Nottingham, Faculty of Engineering, Nottingham, United Kingdom
- 8Department of Applied Ecology, Geisenheim University, Geisenheim, Germany
- 9Ithaka Institute, Arbaz, Switzerland
Carbon dioxide removal (CDR) at gigaton-scale is essential to meet the Paris climate goals. Relevant CDR rates can only be achieved through the co-deployment of multiple CDR approaches. However, synergisms between different CDR methods and joint co-benefits beyond CDR have seldom been investigated. The combination of pyrogenic carbon (PyC) and enhanced weathering of minerals (Mi) for carbon capture and storage (CCS), in short PyMiCCS, presents a potentially synergetic and multifunctional approach that may be achieved by either co-application of biochar and rock powder to soils or the co-pyrolysis of biomass and rock powder before soil use. Here, we mixed biomass (wood; straw) with 10 to 50 wt% silicate rock powder (namely basanite or diabase) for co-pyrolysis to produce twelve different rock-enhanced (RE-)biochars. Products were subject to physico-chemical characterization, including an assessment of carbon yield and proxies for biochar persistence. Rock-enhanced biochars showed higher nutrient content, liming- and C-sink potential but lower solid-state electrical conductivity and porosity compared to pure biochars. Co-pyrolysis resulted in a coating of rock particles with secondary char but did not affect the net carbon yield. The thermal stability of wood-based RE-biochars (+10 wt% rock) was higher than that of pure woody biochars. However, the underlying mechanism and implications for biochar persistence in the environment need further investigation. Despite the addition of rock powder, the short-term release of ions from the ash fraction remains dominated by cations and anions of biogenic (biochar) origin. Therefore, it is still unclear whether the pyrogenic coating influences rock weathering. Co-pyrolysis with rock dust opens further options for designing biochar properties and to produce novel composite materials catering for multifunctional CDR.
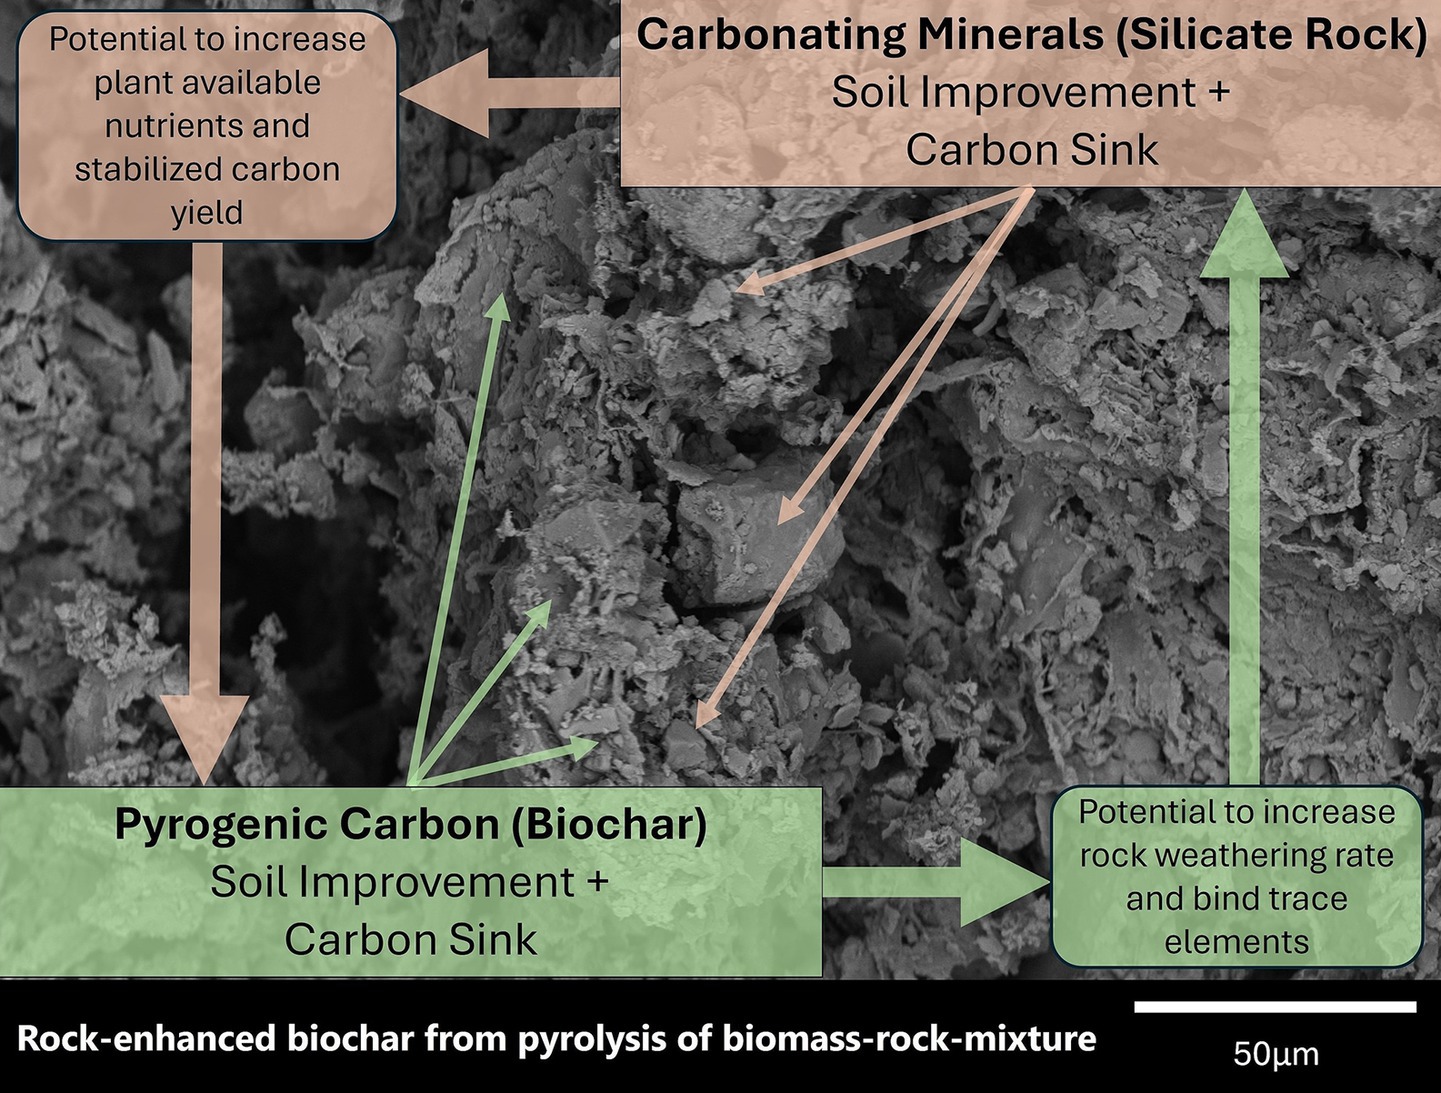
Graphical Abstract.
Highlights
• Rock-enhanced biochar facilitates synergistic CDR
• Low/No catalytic activity from alkali- and alkaline earth metals in silicate rocks during pyrolysis at 650°C
• Rock enhancement can impact the density and thermal properties of feedstock
• Coating of rock particles with secondary char during co-pyrolysis
• Increased bulk density of rock-enhanced biochar can ease application in industrial agriculture
1 Introduction
Carbon dioxide removal (CDR) on a gigaton scale, in addition to rapid decarbonization, is essential to keep global warming well below +2.0°C, as set out in the Paris Agreement. Historical emissions and slow decarbonization trends make pathways based solely on emission reductions futile (IPCC, 2018, 2023). Pyrogenic carbon capture and storage (PyCCS, Schmidt et al., 2019) is a CDR technology that includes the production and non-oxidative use of biochar. The use of rock powder as a soil amendment generates CDR by enhanced rock weathering (ERW, Hartmann et al., 2013). Synergies could be unlocked by combining PyCCS and ERW when co-applying biochar with rock powder to agricultural soils (Amann and Hartmann, 2019; Azeem et al., 2022; Janssens et al., 2022; Hagens et al., 2023; Honvault et al., 2024) or by co-pyrolysis of biomass with rock powder (Buss et al., 2024) to produce rock-enhanced (RE) biochar. Pyrogenic Carbon and Carbonating Minerals for Carbon Capture and Storage (PyMiCCS) refers to both co-application and co-pyrolysis.
Silicate rock powder is a beneficial soil amendment for liming and providing primary minerals as well as essential macro-and micronutrients (Chung et al., 2020; Lewis et al., 2021; Swoboda et al., 2022; Schaller et al., 2023), along with CDR as the silicate rock (powder) weathers (Hartmann et al., 2013). Silicate rock weathering is a natural process sequestering 0.5 GtCO2 year−1 (Renforth and Henderson, 2017). In the first step, CO2 dissolves into water, forming carbonic acid. The weak acid dissociates and hydrolyses the primary silicate mineral. Reaction products are secondary minerals and/or dissolved silicate, free cations, and alkalinity (mostly in the form of bicarbonate HCO3−) in solution. Alkalinity presents a stable form of dissolved inorganic carbon, which ultimately can be transported to the ocean. An exemplary summary equation for the weathering of the mineral forsterite is shown in Equation 1. Forsterite is a mineral of the olivine group, commonly found in silicate rocks, such as basanite.
The natural weathering process can be enhanced by crushing rock material to increase its reactive surface area and exposing it to conditions that promote weathering (moisture, high CO2 partial pressure), such as in the rhizosphere (Hartmann et al., 2013). Appropriately scaled, enhanced rock weathering can facilitate the removal of additional 2 GtCO2 year−1 (Beerling et al., 2020).
Biochar is produced by the thermal conversion of biomass (>400°C) in the partial presence, or total absence, of molecular oxygen (pyrolysis). During pyrolysis, biomass is converted into permanent pyrogases (mostly CH4, CO and H2), condensable liquids (‘bio-oil’) and a solid product. The latter is considered biochar when the molar ratio of hydrogen to organic carbon (H:Corg) is <0.7 (Global Biochar C-Sink, 2024). Biochar use in soil can result in a wide range of agronomic benefits, including increased water-holding capacity and nutrient availability and retention (Joseph et al., 2021; Schmidt et al., 2021; Wei et al., 2023).
During co-pyrolysis, the presence of mineral particles may impact the thermal conversion of biomass and, thus, the carbon speciation in the RE-biochar. So far, co-pyrolysis with salts and wood ash has been investigated to design sorbate-specific sorbents (Dieguez-Alonso et al., 2019), to increase carbon yield and biochar stability (Zhao et al., 2014; Buss et al., 2019; Mašek et al., 2019), to shape biochar properties like nutrient availability (Buss et al., 2020), and/or to add nutrients (Grafmüller et al., 2022). Alkali and alkaline earth metals (AAEM), but also iron, phosphorus, and further elements such as silicon have been tested for various purposes. Their effects include:
(a) catalytic reduction of temperature required for biomass decomposition (Di Blasi et al., 2009; Patwardhan et al., 2010; Giudicianni et al., 2021; Grafmüller et al., 2022), which has been demonstrated, e.g., for AAEMs.
(b) catalyzed formation of C-C linkages, including those in aromatic moieties of primary and secondary char, due to catalyzed dehydration and decarboxylation of biomass and its decomposition products (Nishimura et al., 2009; Buss et al., 2022)
(c) formation of heteroatom-containing carbon compounds (organometallic complexes), including hetero-cyclic aromatic compounds (Wu et al., 2002; Shao et al., 2018; Giudicianni et al., 2021; Nan et al., 2022)
(d) enhanced retention time of volatile carbon species in the solid and consecutive formation of secondary char (Anca-Couce et al., 2014; Nan et al., 2020, 2022).
(e) formation of AAEM-carbonates during pyrolysis (Guo et al., 2020; Tan et al., 2020; Nan et al., 2022).
The extent to which any of the effects mentioned above occur in a specific application depends on the composition of the biomass (inherent ash content, speciation of carbon compounds), the pyrolysis conditions (temperature, residence time, etc.) as well as the selection and dosage of the additives (Nan et al., 2020, 2021) and the mode of mixing (Guo et al., 2012; Meng et al., 2021). Silicate rock powder was suggested as a mineral additive (Buss et al., 2022, 2024), and consists, depending on the source rock, of various minerals like plagioclase, pyroxene, or olivine, which contain AAEMs (Buss et al., 2022; Nan et al., 2022). However, it remains unclear whether these AAEM-containing minerals influence carbon speciation and yields, or if their incorporation into the rock matrix inhibits such effect.
Various advantages have been suggested for the co-application of rock-powder and biochar as well as the application of RE-biochar: Biochar may improve soil hydrology and raise CO2 levels in soil pores due to stimulated biological activity, which can increase rock weathering rates (Samuels et al., 2020; Verbruggen et al., 2021; Corbett et al., 2024). Biochar may further immobilize trace elements released from the rock. Conversely, minerals can stabilize the added pyrogenic- and the native organic carbon in the soil (Amann and Hartmann, 2019; Buss et al., 2023; Sokol et al., 2024). Biochar (Kammann et al., 2015; Borchard et al., 2019) and silicate rock powder (Vienne et al., 2022) added to soil both show the potential to reduce N2O emissions and nitrate leaching and could therefore act synergistically. At large, the use of regional rock powder sources for soil remineralization or rock-enhancement of biochar could ease management of mine-tailings and boost fertilizer self-sufficiency (Swoboda et al., 2022) while counteracting soil nutrient depletion (Jones et al., 2013) and thus contribute to the restoration of weathered, silicon-depleted (tropical) soils (Haynes, 2014; Janssens et al., 2022). Therefore, RE-biochar presents an avenue to bolstering soil fertility and productivity (Haque et al., 2019; te Pas et al., 2023; Beerling et al., 2024).
Here, RE-biochars were produced by co-pyrolysis of wood or straw with basanite or diabase rock powder at 650°C to investigate the hypothesis that rock-enhancement can (i) increase the carbon yield, (ii) affect the carbon speciation and, thus, (iii) biochar stability. These parameters may be affected by catalytic effects occurring during co-pyrolysis or due to changes in physical properties of the feedstock such as density, heat capacity or thermal conductivity. To this end, RE-biochars were physico-chemically characterized, including proxies of biochar stability such as solid-state electrical conductivity (SEC), thermogravimetric analysis (TGA), and hydropyrolysis (HyPy). Further, parameters of agronomic relevance such as nutrient content and liming potential were evaluated.
2 Materials and methods
2.1 Biomass preparation and pyrolysis
Pollard willow (Salix viminalis L.) branches were cut on a farm in Bielefeld, Germany. This biomass was shredded, air-dried and a share of the shred biomass consecutively milled on a hammer mill (3 mm sieve, HM420B, Evertec, Dieburg, Germany). Wheat straw (Triticum aestivum L.) was purchased in Zurich, Switzerland. Basanite and diabase rock powder, each as a fine (0–250 μm) and as a coarse (0–2000 μm) powder, were obtained from Rheinische Provinzial-Basalt- u. Lavawerke, Sinzig, Germany, and Hartsteinwerke Schicker, Bad Berneck, Germany, respectively. Mean particle sizes were 42 μm (basanite fine), 1,322 μm (basanite coarse), 36 μm (diabase fine) and 834 μm (diabase coarse).
Milled biomass and fine rock powders (mixing ratios provided in Table 1) were first homogenized and then pelleted to 6 mm with no additional binder (WK230 pellet press, Evertec, Dieburg, Germany). After drying (min. 12 h at 60°C), fines < 6 mm were removed via sieving. Coarse rock powders were mixed with shredded wood chips sieved to 2–6 mm with no further treatment (i.e., non-pelletized). Treatments also included pure biomass controls. Finally, for selected treatments for which more material was required to supply follow-up experiments, a second batch of feedstock was prepared by Nature Power Pellets (Wolferstadt, Germany), using the same rock powders and mixing ratios but different batches of locally sourced biomass, with comparable ash content and elemental composition (Supplementary Table S10). The particle density of feedstock pellets (n = 30 per selected treatment) was calculated from their volume and dry weight (Joka Yildiz et al., 2025; averaged mass of pure wood pellet = 0.7 g). For rock-enhanced feedstock pellets, the measured particle density was compared to the calculated, expected particle density, based on the measured density of the corresponding pure wood pellet, gravimetric rock content, and rock powder density (approximated as 2.65 kg l−1) according to Equation 2.
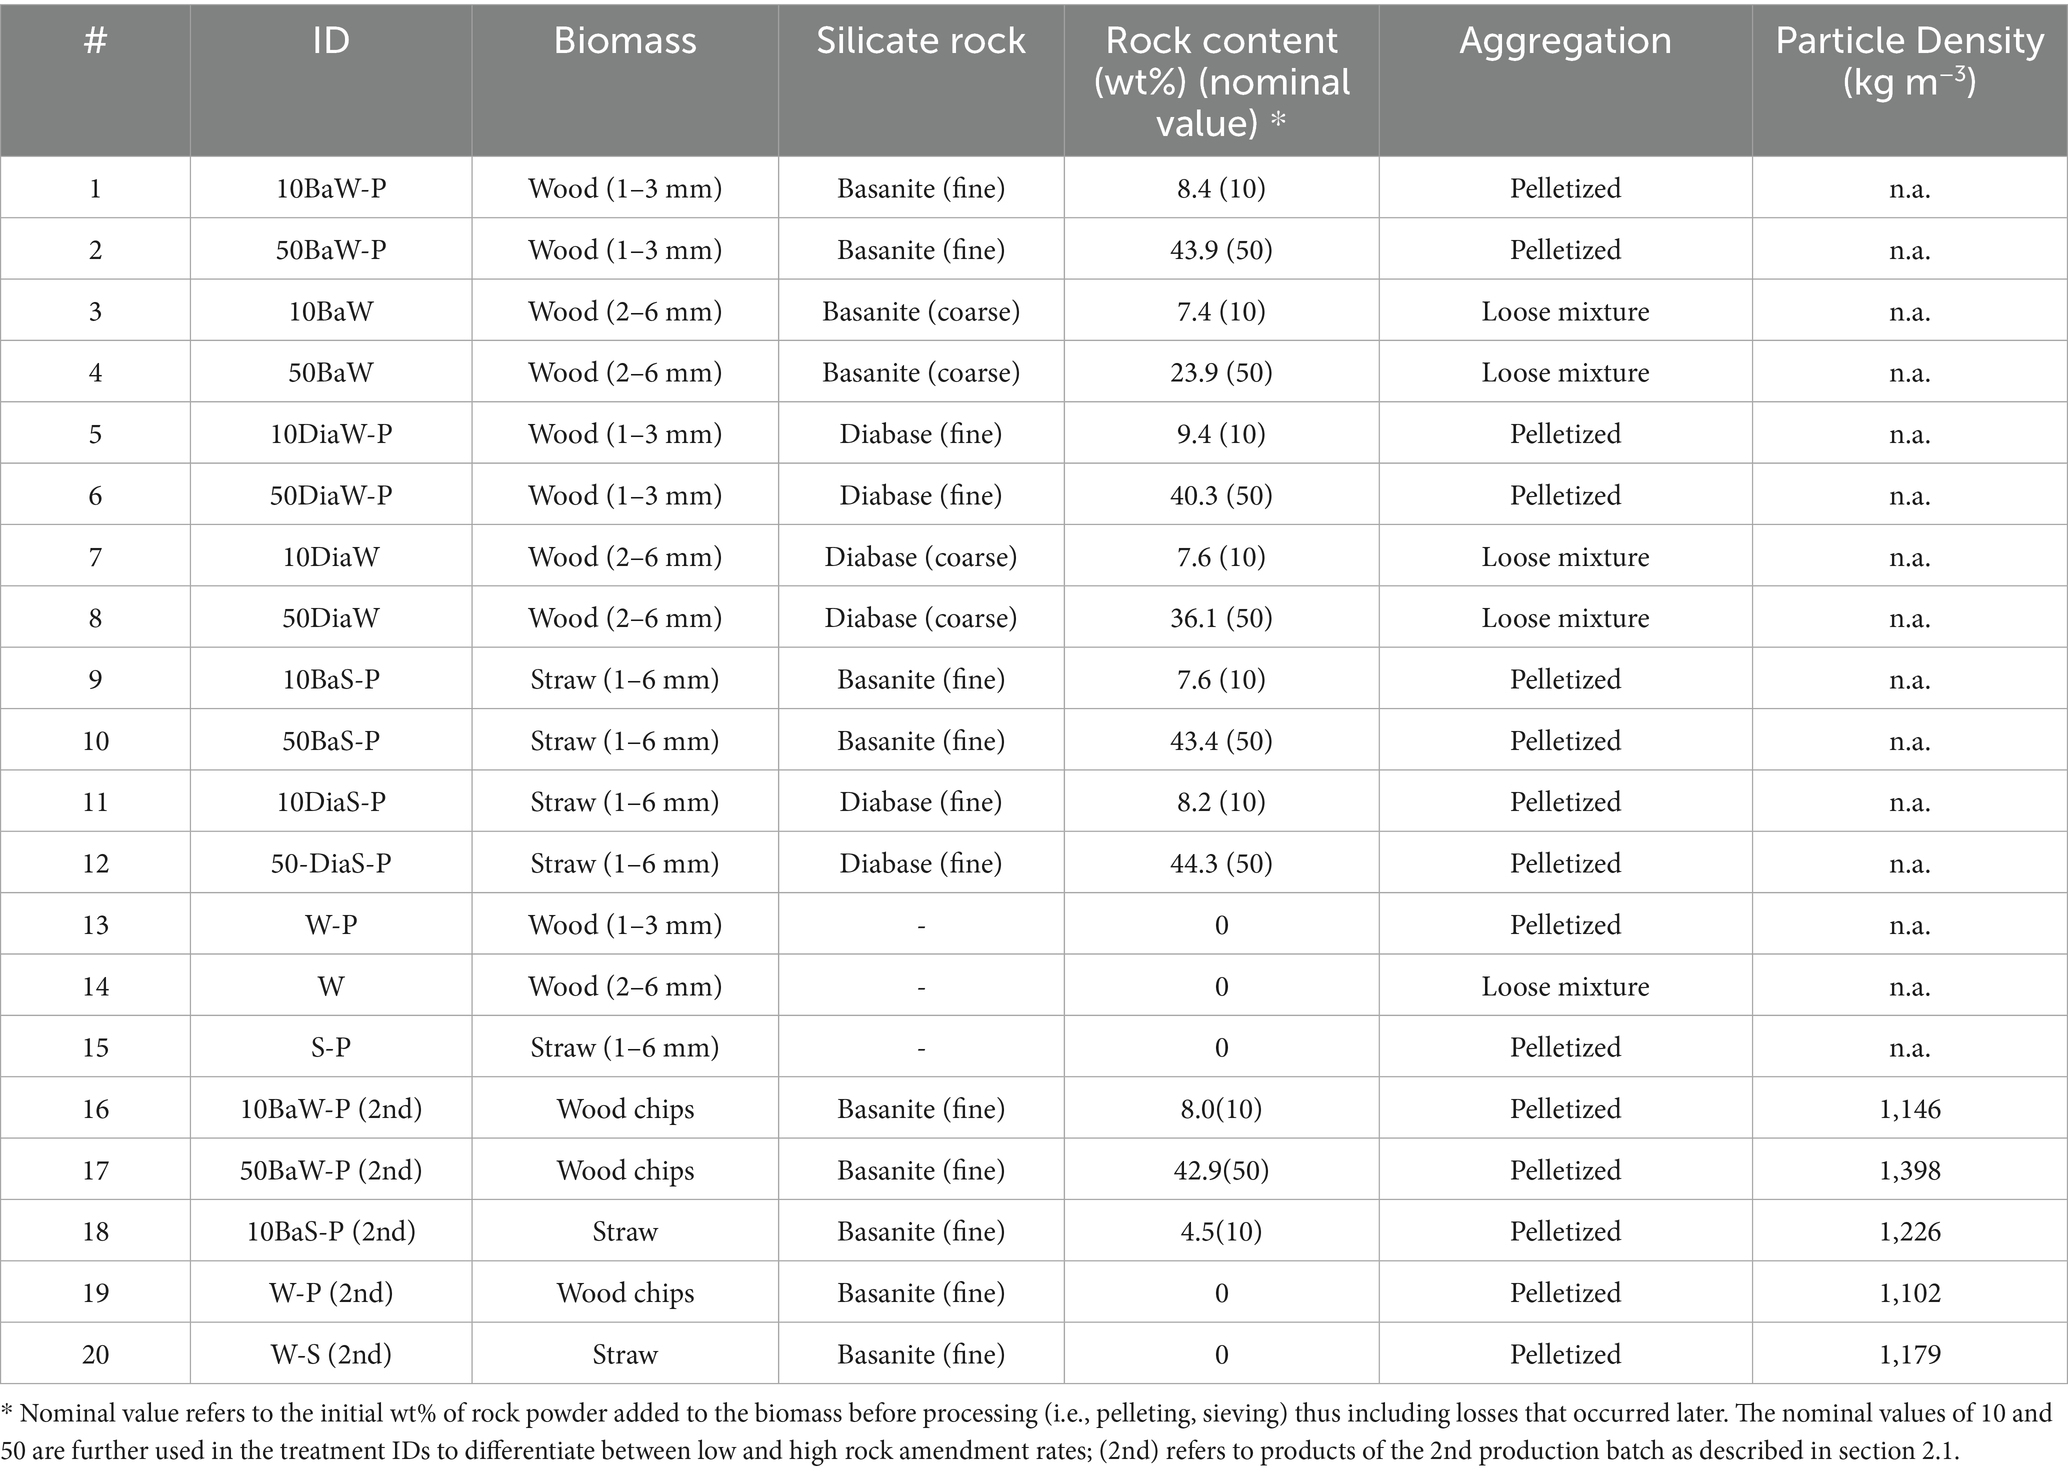
Table 1. Pyrolysis feedstock compositions from wood (W) and straw (S), loosely mixed or pelletized (P), with actual basanite (Ba) or diabase (Dia) rock powder content based on biomass analysis and nominal addition rate (10% or 50%) in brackets.
With ρexpected being the expected particle density, ρbio and ρrock representing the particle density of pure biomass and rock poweder, cbio and crock the concentrations of biogenic matter and rock powder in the observed pellet mass mpellet.
Pyrolysis was performed at 650°C with a residence time of 15 min on a PYREKA research pyrolysis unit (Pyreg GmbH, Dörth, Germany) under N2 flow at 2 L min−1 (Hagemann et al., 2020). The feedstock container was flushed with argon. The PYREKA was operating in one continuous process per treatment produced. The biochar collection container was emptied in 30 min intervals (n = 2–4). The produced (RE-)biochars were weighed and the coefficient of variation (%CV of g biochar produced min−1) was calculated, to obtain a proxy for the variability of the continuous process. The biochar produced during the start-up (the first 60 min after the start of the biomass feed) and the shutdown (after the feedstock container is empty) was weighed but discarded. The reactor outlet was heated to 400°C, preventing the condensation of tar/oil on the biochar. Before further analysis, all (RE-)biochars were milled < 3 mm in an impact mill.
2.2 Rock analysis
Grain size distribution of rock powder was measured by laser granulometry, using a Sympatec Helos KFMagic (Sympatec GmbH, Clausthal-Zellerfeld, Germany). Elemental composition was determined by wavelength dispersive X-ray fluorescence (XRF) analysis using Malvern Pananalytical Magix Pro (Malvern Pananalytical, Kassel, Germany), the mineralogical composition by bulk X-ray diffraction (XRD, D8 Advance, Bruker, Billerica United States of America). The specific surface area was measured as described in section 2.4.2. Water extractable AAEMs were quantified by ICP-OES according to DIN EN ISO 17294-2 from the eluate after 1 h extraction of fine powder with ultrapure water at 150 rpm on an orbital-shaker. The extraction was conducted in triplicate and eluates measured by Eurofins Umwelt-Ost GmbH (Bobritzsch-Hilbersdorf, Germany).
2.3 Biomass analysis
Biomass analysis was performed by Eurofins Umwelt-Ost GmbH (Bobritzsch-Hilbersdorf, Germany). Elemental analysis of biomass was performed according to DIN EN ISO 16948. The ash content was quantified according to DIN EN ISO 18122. Main elements were quantified from a borate digestion of the biomass ash following DIN 51729–11:1998–11. Trace elements were quantified according to DIN EN ISO 16967/16968 (Supplementary Table S10).
2.4 Biochar analysis
2.4.1 Elemental composition
Biochars were analyzed according to the analytical guidelines of the European Biochar Certificate (EBC, 2024) by Eurofins Umwelt-Ost GmbH (Bobritzsch-Hilbersdorf, Germany). The organic carbon (Corg) content of the dry and ash free (daf) biochar content (Corg_daf) was calculated according to Equation 3.
Elemental analysis according to EBC standards was also performed on samples after density fractionation. A triplicate of 3 g RE-biochar (milled to <20 μm in a ball mill) was suspended in a sodium-polytungstate solution adjusted to a density of 2.5 g cm−3. The two fractions (<2.5 g cm−3 = biochar-dominated; >2.5 g cm−3 = rock dominated) were separated and washed with de-ionized water in a vacuum filtration system.
For biochars and RE-biochars of the 1st production batch, total concentrations of main and trace elements were calculated according to Equation 4:
Where cE,i is the total concentration of element i in the RE-biochar, cE,i(biomass ash) the concentration of element i in the biomass ash (Supplementary Table S10), cash(biochar) the content of biomass-derived ash in the given RE-biochar (section 2.6.1 and Table 2), cE,i(rock) the concentration of element i in the rock powder (Supplementary Table S7), with crock being the rock content in the given RE-biochar (section 2.6.1 and Table 2). The cE,i for main elements is calculated as wt% (oxide form), for trace elements in ppm. A comparison between calculated and measured CE,i is presented in Supplementary Table S6. The liming potential, given as calcium oxide equivalents (CaOe), was calculated based on threefold determination of basic compounds following VDLUFA II.1, 6.3.2: 1995.
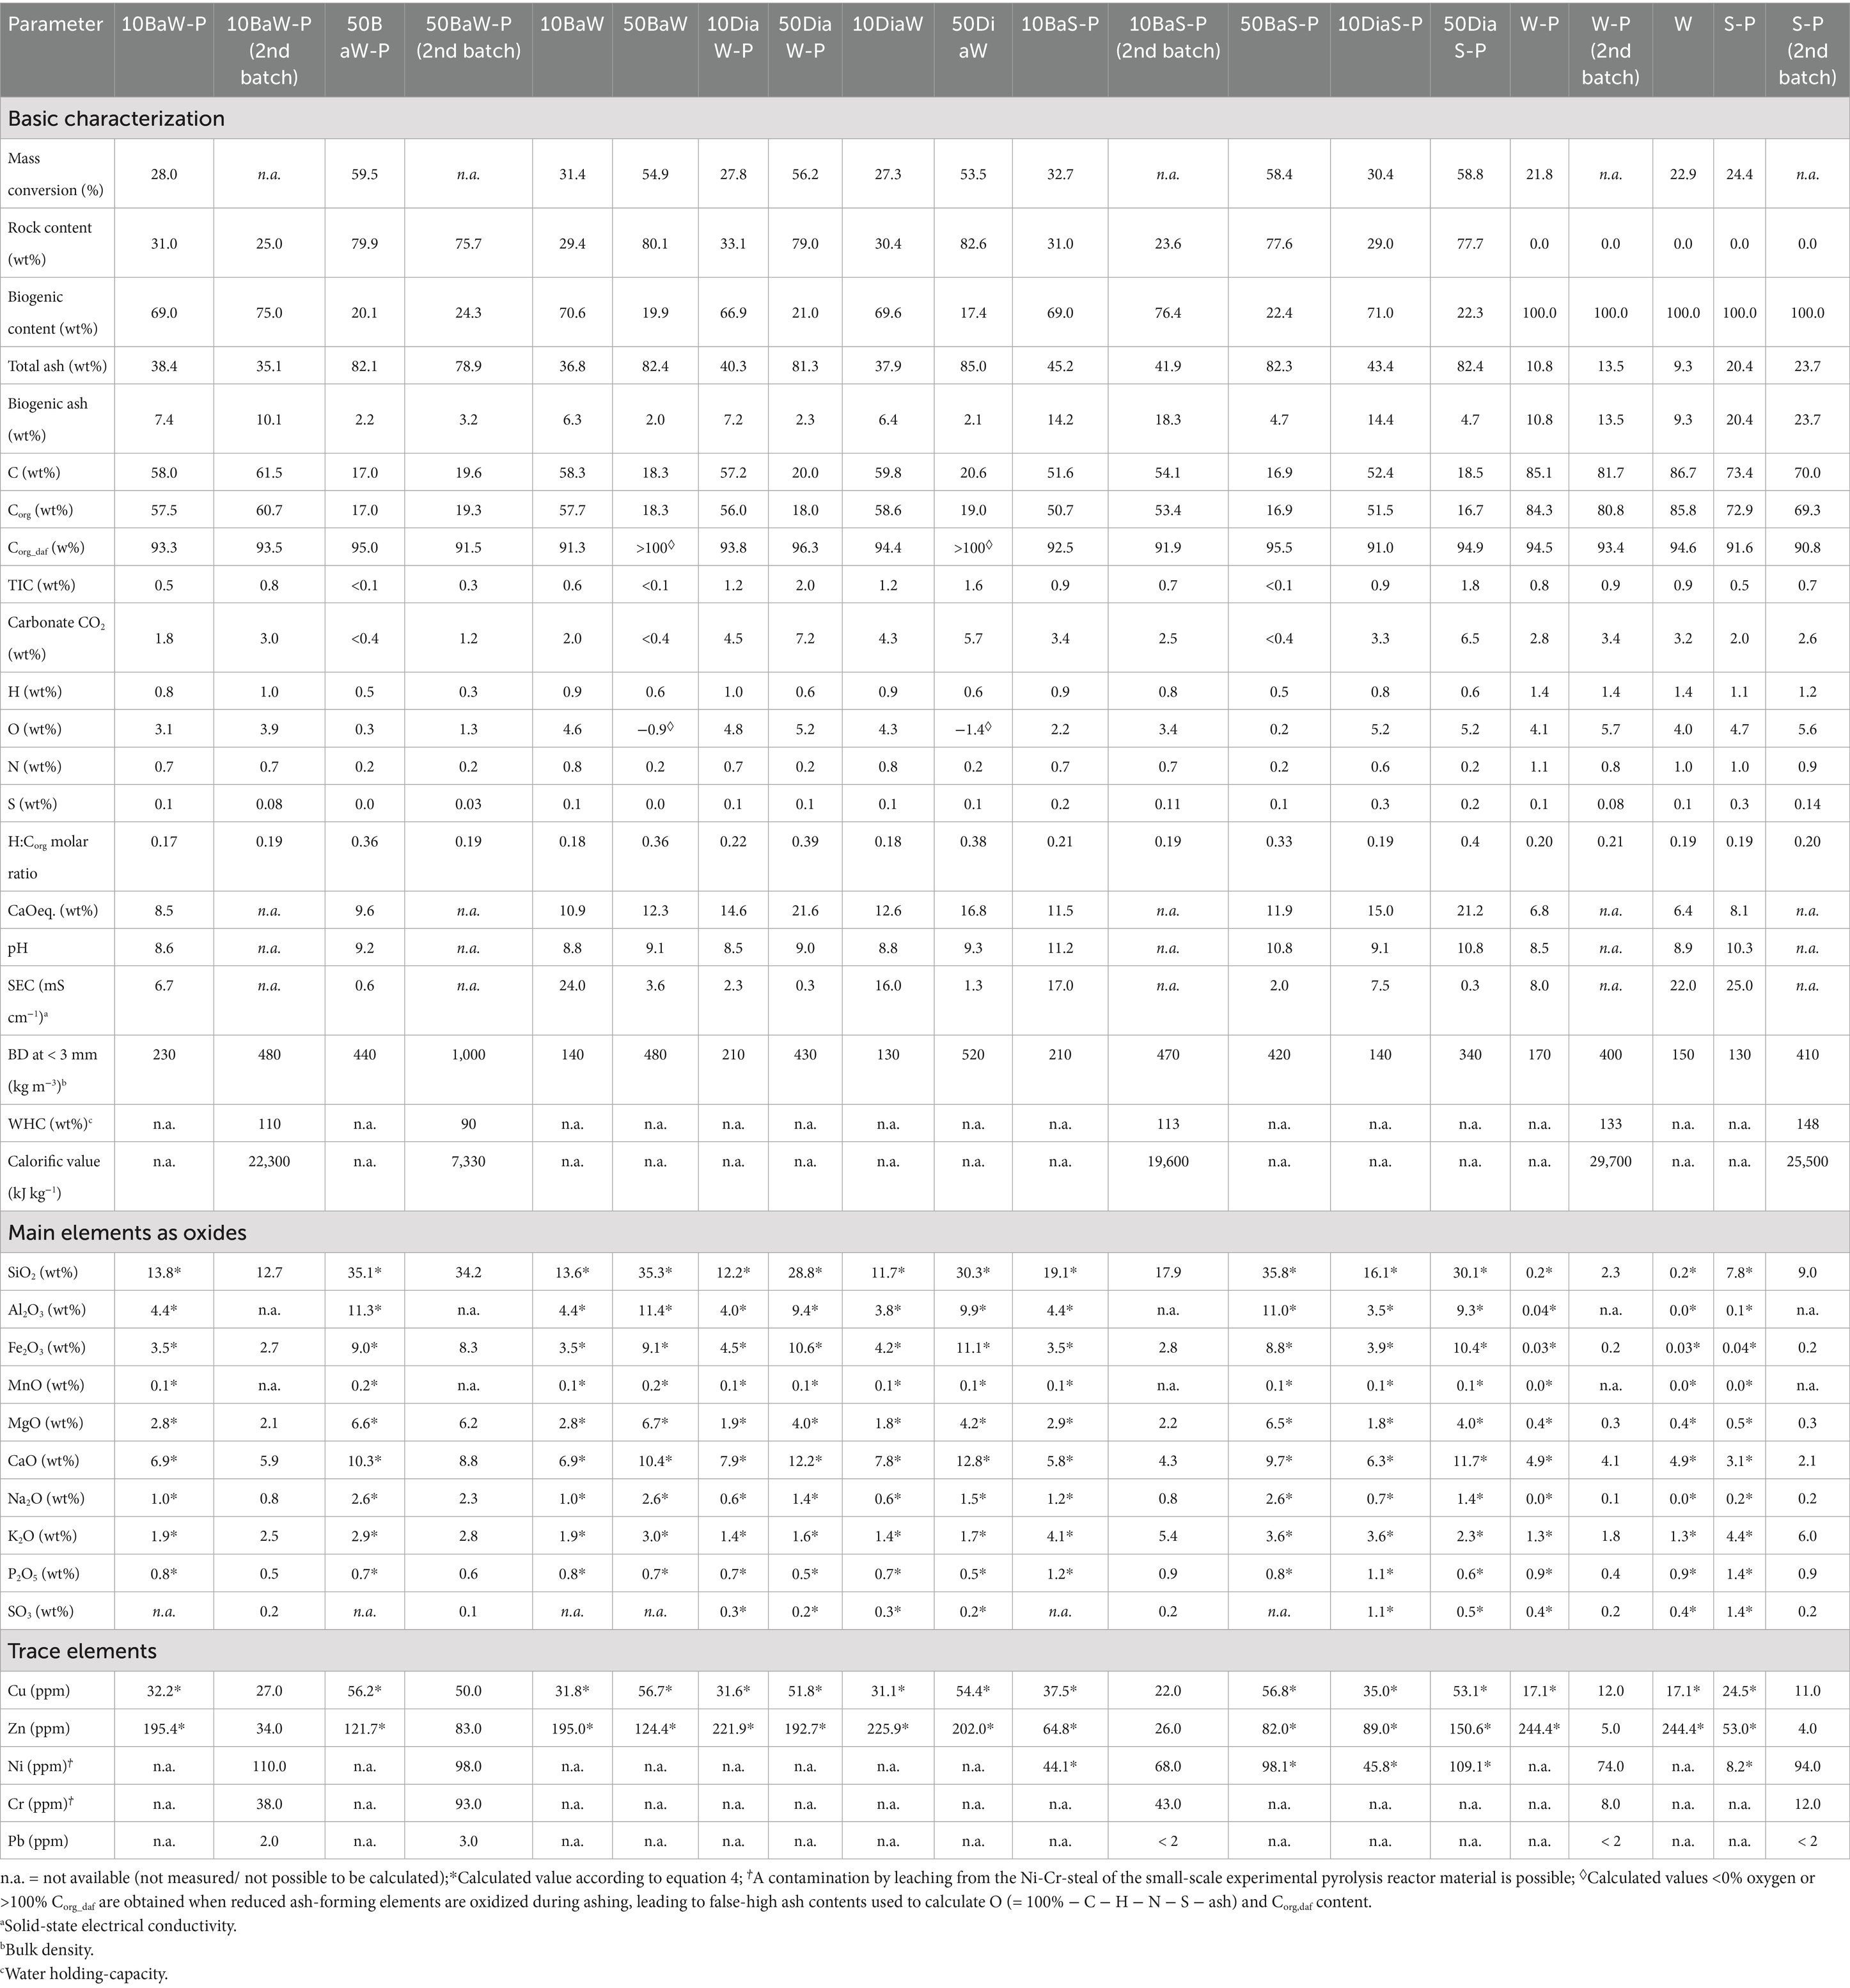
Table 2. Basic physico-chemical properties of biochar and rock-enhanced biochar.
2.4.2 Further biochar characterization
The bulk density was calculated from the weight to volume ratio of a 100–120 cm3 subsample, milled < 3 mm (standard procedure in comparative biochar analysis) and dried 24 h at 105°C. For the calculation of the water holding capacity dried subsamples were weighed into 25 mL glass filters in triplicate, subsequently submerged in water for 12 h until consecutive draining for 12 h on a sand bed. Based on recorded weight differences, the gravimetric water content and water-holding capacity were calculated. The calorific value was measured according to DIN 51900-3: 2005-1.
Specific surface area (SSA) and porosity were quantified by Brunauer Emmett Teller (BET) method, based on nitrogen isotherms at 77 K aquired on an AUTOSORB-IQ volumetric sorption device from 3P-Instruments GmbH & Co KG (formerly Quantachrome GmbH & Co KG, Odelzhausen, Germany). Between 0.1 g and 0.2 g of sample was weighed into the sample cell, then degassed at 150°C for 12 h, with a final vacuum <10−2 Pa applied before measurement. The surface area was determined in accordance with DIN ISO 9277: 2014. The mesopore size distributions (PSD) were determined, based on DFT calculation (QSDFT-Kernel, carbon slit/cylindrical pores, adsorption branch) by using ASiQwin Software package (Anton Paar, Ostfildern-Scharnhausen, Germany; formerly Quantachrome Inc., Boynton Beach, US). The corresponding plots obtained are shown in Supplementary Figure S8.
Fourier transformation infrared spectroscopy (FTIR) was performed as attenuated total reflectance (ATR) measurement using an Invenio X FT-IR Spectrometer (Bruker Corporation, Billerica, United States of America). The calculated infra-red absorbance was obtained from 60 consecutive scans, each covering the wavenumber spectra of 400–4,000 cm−1. The absorbance spectrum was smoothed, and the baseline corrected using the software Spectragryph v.1.2.26.1, which also assisted with peak labeling. Peak identification was based on de la Rosa et al. (2014), Hagemann et al. (2018), and Johnston (2017).
Hydropyrolysis (HyPy) was performed as described in Meredith et al. (2017). In brief, milled samples were mixed with 10 wt% ammoniummolybdate-tetrahydrate as a catalyst. The samples were heated in a reactor under 150 bar hydrogen pressure from ambient temperature to 250°C at 300°C min−1, then from 250°C to 550°C at 8°C min−1 and held there for 2 min. The sample residues following HyPy were weighed and analyzed for Corg, which is referred to as BCHyPy and presented as wt% of the initial Corg content.
For scanning electron microscopy (SEM) and energy-dispersive X-ray spectroscopy (EDX), samples were fixed with carbon pads (Plano GmbH, Wetzlar, Germany) to an aluminum sample holder and were sputter-coated with a 3–5 nm gold layer using a Cressington 108auto (TESCAN GmbH, Dortmund, Germany), then subjected to SEM analysis using a JSM-6610 LV (JEOL Ltd., Tokyo, Japan). A working distance of 11 mm and 15 kV acceleration voltage were used. Images were created as backscattered electron images (BES). A 20 mm2 Oxford X-mas detector (Oxford Instruments, Abingdon, United Kingdom) was used for EDX.
Thermogravimetric analysis and differential scanning calorimetry (TG-DSC) were performed on a STD 650 TG-DSC system (Waters, New Castle, United States of America). The dry samples (5 mg) were heated at a rate of 10°C min−1 to 1,000°C under N2 atmosphere. The total weight loss recorded was corrected for the ash content of the sample, which includes the rock content, to represent the weight loss of dry and ash-free (daf) biochar. For diabase-containing RE-biochars, the total weight loss during TGA was further corrected for weight loss recorded for pure diabase due to the conversion of carbonate to CO2 (Supplementary Figure S1; Supplementary Table S5). The daf biochar mass fraction resisting thermal degradation until 1,000°C was defined as BC1000C in mass%.
2.5 Leaching experiment
A leaching experiment was conducted following Amann et al. (2022) and Vorrath et al. (2025). In brief, (RE-)biochar was mixed with washed quartz sand (supernatant electrical conductivity after washing < 5 μS cm−1) and filled in plastic columns (25 cm long, 5.6 cm diameter, closed with 5-μm plankton mesh fixated at the bottom). Two columns were set up per treatment, the mixing ratios are provided in Supplementary Table S11. Before the experiment, 70 mL deionized water was added to saturate the columns. During the 6-week experiment (ambient air conditions, approximately 21°C, in the dark), the columns were watered with 70 mL deionized water three times a week (total: 1330 mL; equivalent to 540 L per m2). The leachate water was collected weekly in polyethylene bottles positioned below the column. The pH and EC of the leachate was measured weekly using a WTW 3630 IDS (Xylem Inc., San Diego, United States of America). Major ions were quantified after filtration to 0.45 μm in a syringe filter (PES; Satorius Stedim Biotech, Göttingen, Germany) by ion chromatography using a Metrohm 881 Compact IC Pro system (Metrohm, Filderstadt, Germany). Based on the concentration of major ions (μM) and leachate volume, the total efflux of released ions was calculated and normalized for 1 kg of RE-biochar.
2.6 Data evaluation
2.6.1 Rock content of biomass and biochar
The fraction of silicate rock (crock) in composite feedstock materials or RE-biochar was calculated according to Equation 5.
Where cash (%) is the ash content of the material, cCorg (%) the content of organic carbon, and r the ratio of cash (%) to cCorg (%) of the corresponding pure biomass or pure biochar. The fraction of biomass in the composite feedstock material or biogenic components in RE-biochar (cbio) is calculated according to Equation 6.
2.6.2 Calculation of mass and carbon yield
The mass yield (yma) is calculated according to Equation 7.
Where mfeedstock is the mass of the feedstock (dry matter) and mbiochar is the mass (dry matter) of the resulting biochar.
The carbon yield (yc) is calculated according to Equation 8.
Here, cCorg(biomass) is the organic carbon content of the pristine biomass and cCorg(biochar) the organic carbon content of the biochar.
2.6.3 Carbon sink potential
The stoichiometric carbon sink (C-sink) potential of RE-biochar is calculated as the sum of the stoichiometric C-sink potential of its pyrogenic carbon content (PyC-Sink) according to Equation 9 and the stoichiometric C-sink potential of the inorganic carbon, generated from rock weathering (IC-Sink) according to Equation 10 (cf. Renforth, 2019) both given in tCO2e t−1.
Where mRE_biochar is the mass of the RE-biochar, MCO2 the molar mass of CO2 and MC the molar mass of carbon.
Here, the respective MCaO/MgO/K2O/Na2O/SO3/P2O4 refer to the molar mass of oxides, and CaO/MgO/ K2O/Na2O/SO3/P2O4 (%) to the mass fraction of the given metals as oxides in the rock.
The factor of 2 accounts for the stoichiometry of the oxides and valence of the cations released. The factor of 0.85 represents the ratio between the charge of the released cations and the sequestered CO2, which accounts for CO2 losses, due to equilibration of the oceanic carbonate system once bicarbonate enters this final reservoir. The latter is based on current ocean temperature, salinity and pCO2 (Renforth, 2019). For RE-biochars, the formula mrock = mRE_biochar * crock is used.
2.6.4 Statistical considerations
Production of RE-biochars was carried out in one continuous batch with the yield recorded in regular intervals and the coefficient of variation being calculated (section 2.1). Generally, analytics were performed on representative samples without repeated measures, thus n = 1 with no further statistical evaluation. Where repeated measures were performed (density fractionation; section 2.4.1), statistical evaluation of paired data was performed with GraphPad Prism version 10.4.1.
3 Results
3.1 Feedstock characterization
Blends of biomass and rock powder were prepared according to Table 1. For wood this included both pelletized as well as loose mixtures, whereas straw had always to be pelletized due to its low bulk density. The pelleting technology and process was found to have a profound effect on particle density (613–1,150 kg m−3; Figures 1A,B). Rock-enhancement of the feedstock also increased the particle density, however not beyond the calculated, expected values of 1,156 kg m−3 (10BaW-P) and 1,471 kg m−3 (50BaW-P) (Figures 1C–E).
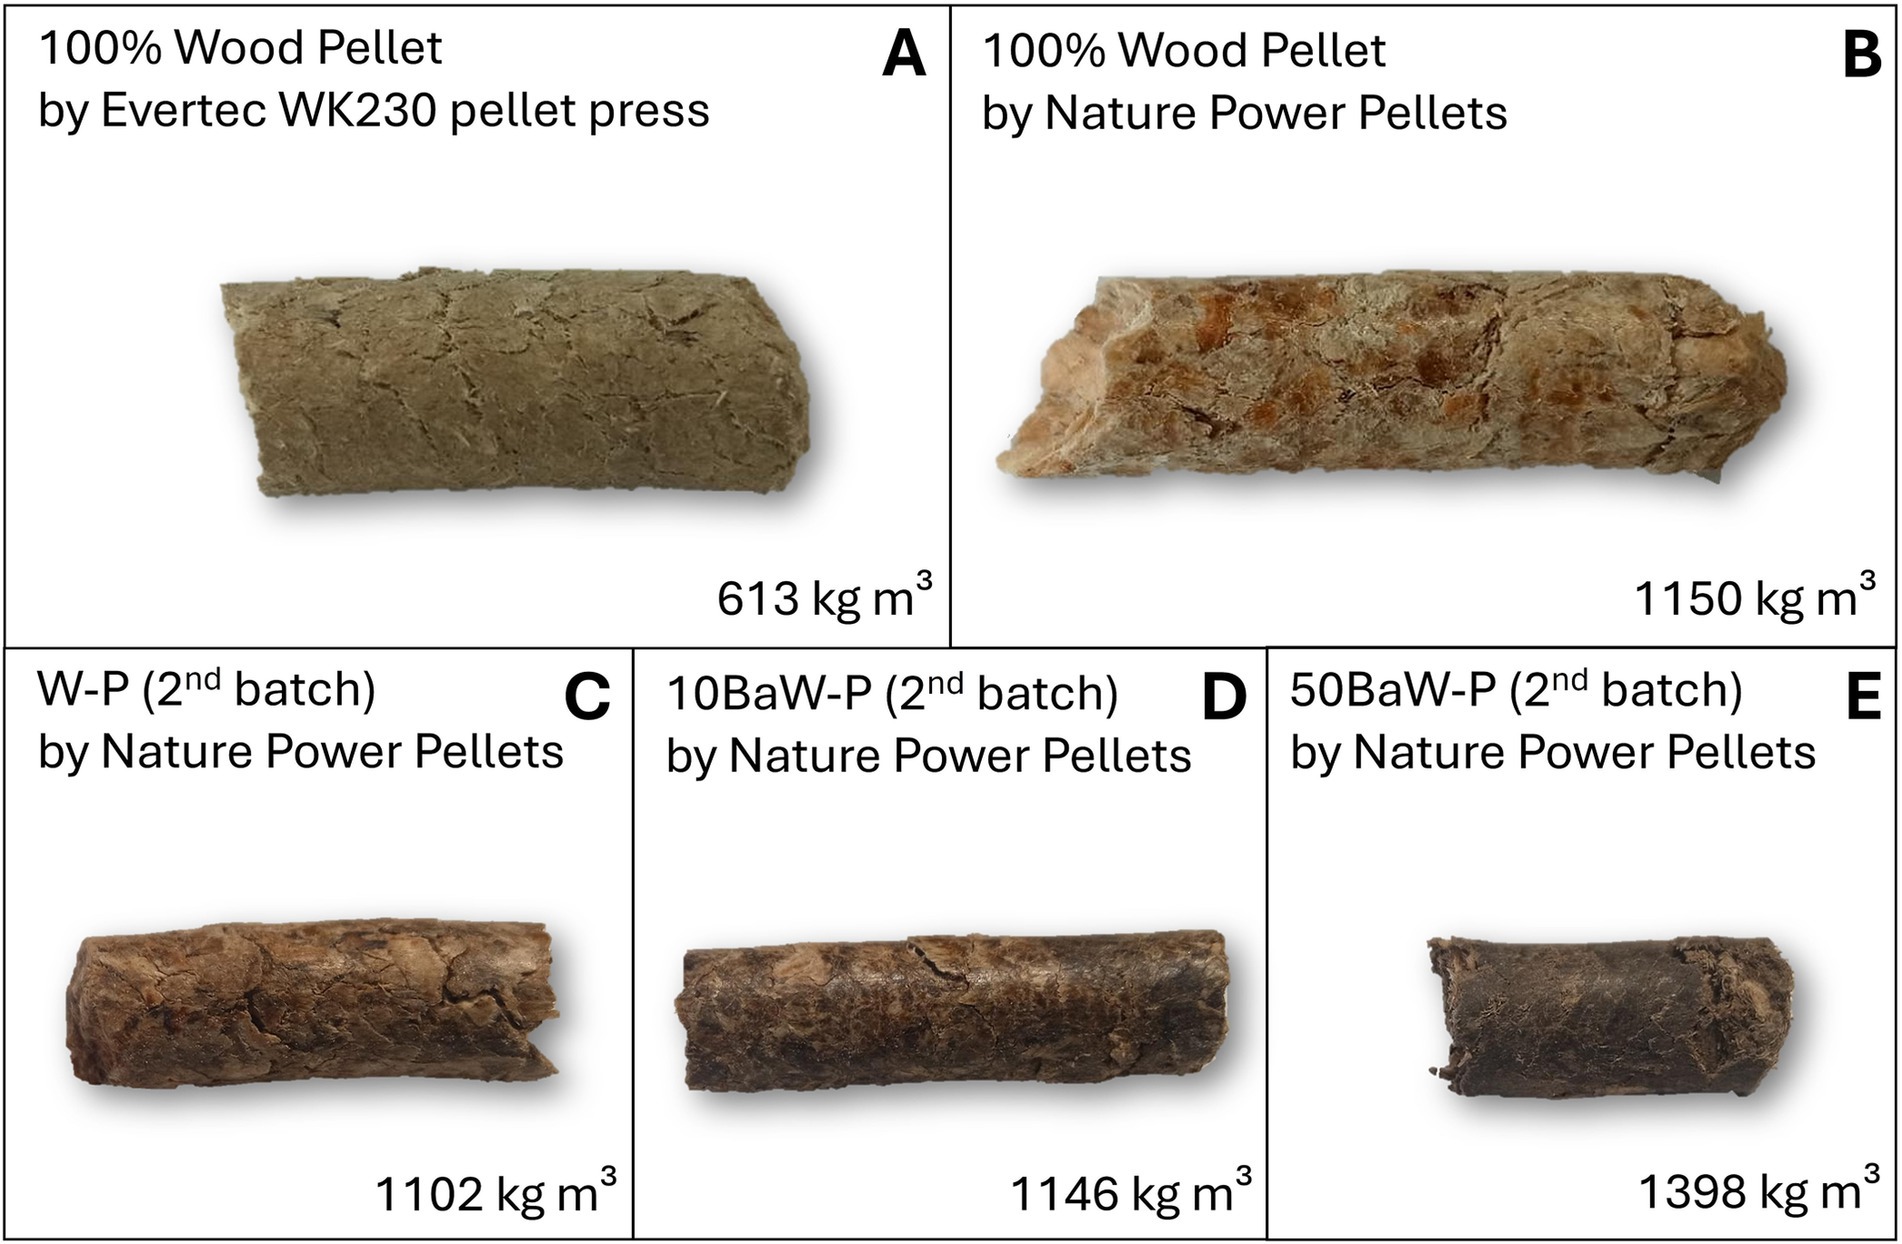
Figure 1. Feedstock pellets of exemplary treatments produced by pelleting biomass with or without rock powder. (A) Wood (Allspan, German Horse GmbH, Karlsruhe, Germany) pelletized on an WK230 pellet press (Evertec, Dieburg, Germany). (B) Same type of wood, pelletized by Nature Power Pellets (Wolferstad, Germany). (C) Pellet made entirely from wood (W-P 2nd batch), (D) Pellet from wood with 10% basanite (10BaW-P 2nd batch), and (E) Pellet from wood with 50% basanite (50BaW-P 2nd batch). Particle density in kg m−3. Further pictures in Supplementary Figures S18–S20.
The measured rock powder content (Table 1) is generally lower than the initially intended, nominal, content (i.e., 10 or 50%), because some rock powder was lost during the pelleting and pellet sieving procedures prior to pyrolysis. In the following, we indicate the samples as 10 or 50% nominal addition despite the measured variation. The woody biomass had an ash content of 1.9% and Corg content of 49.2%, while the straw biomass had an ash content of 5.6% and Corg content of 46.9%. The rock materials were classified as basanite (Ba) and diabase (Dia), both mafic rocks of volcanic origin. Basanite is rich in pyroxene, plagioclase and olivine, while diabase is dominated by calcite (CaCO3) and pyroxene. The mineralogical composition, based on X-ray diffraction analysis, is summarized in Supplementary Table S7. Basanite had a ∑AAEM-oxides content of 26.5 wt% and a stoichiometric IC-sink potential of 0.367 tCO2e t−1. Diabase had a ∑AAEM-oxides content of 22.7 wt% and an IC-sink potential of 0.309 tCO2e t−1 (Supplementary Table S7). The water-extractable fraction of AAEMs from fine basanite and diabase ranged from 0.32% (basanite) to 0.40% (diabase) (Supplementary Table S8).
3.2 Basic physico-chemical characterization of (RE-)biochars
Biochars without rock dust blend showed a Corg content of 72.9–85.8% and a H:Corg molar ratio of 0.19–0.20 (Table 2), which is in the expected range based on the selected feedstock and pyrolysis conditions (Ippolito et al., 2020). Rock-enhanced biochars showed lower Corg contents in the range of 16.7–19.3% for 50% nominal addition of rock powder and 50.7–58.6% for 10% nominal addition of rock powder. The carbon yield (cy) and Corg_daf content remained unaltered. Ash contents were in the range of 9.3–20.4, 36.8–37.9%, and 81.3–85.0% for 0, 10 and 50% nominal addition of rock powder, respectively. The addition of rock powder increased the bulk density, reduced the solid-state electrical conductivity (SEC) and also the water-holding capacity (Table 2).
3.3 Yield and properties of pyrogenic carbon in (RE-)biochars
3.3.1 Carbon yield and H:Corg molar ratio
Carbon yield refers to the proportion of Corg in the feedstock that is converted to biochar-Corg. Pyrolysis of wood pellets (low ash, high lignin feedstock) resulted in a carbon yield of 37.3 ± 1.1%. The addition of rock powder tended to slightly reduce the carbon yield, with a mean carbon yield of 35.4 ± 2.4% for all W-P-based RE-biochars (Figure 2A). For S-P-based (high ash, low lignin feedstock) biochar, the carbon yield was 37.9 ± 1.3%, which was not affected by rock addition (37.4 ± 1.7% for all S-P-based RE-biochars, Figure 2B).
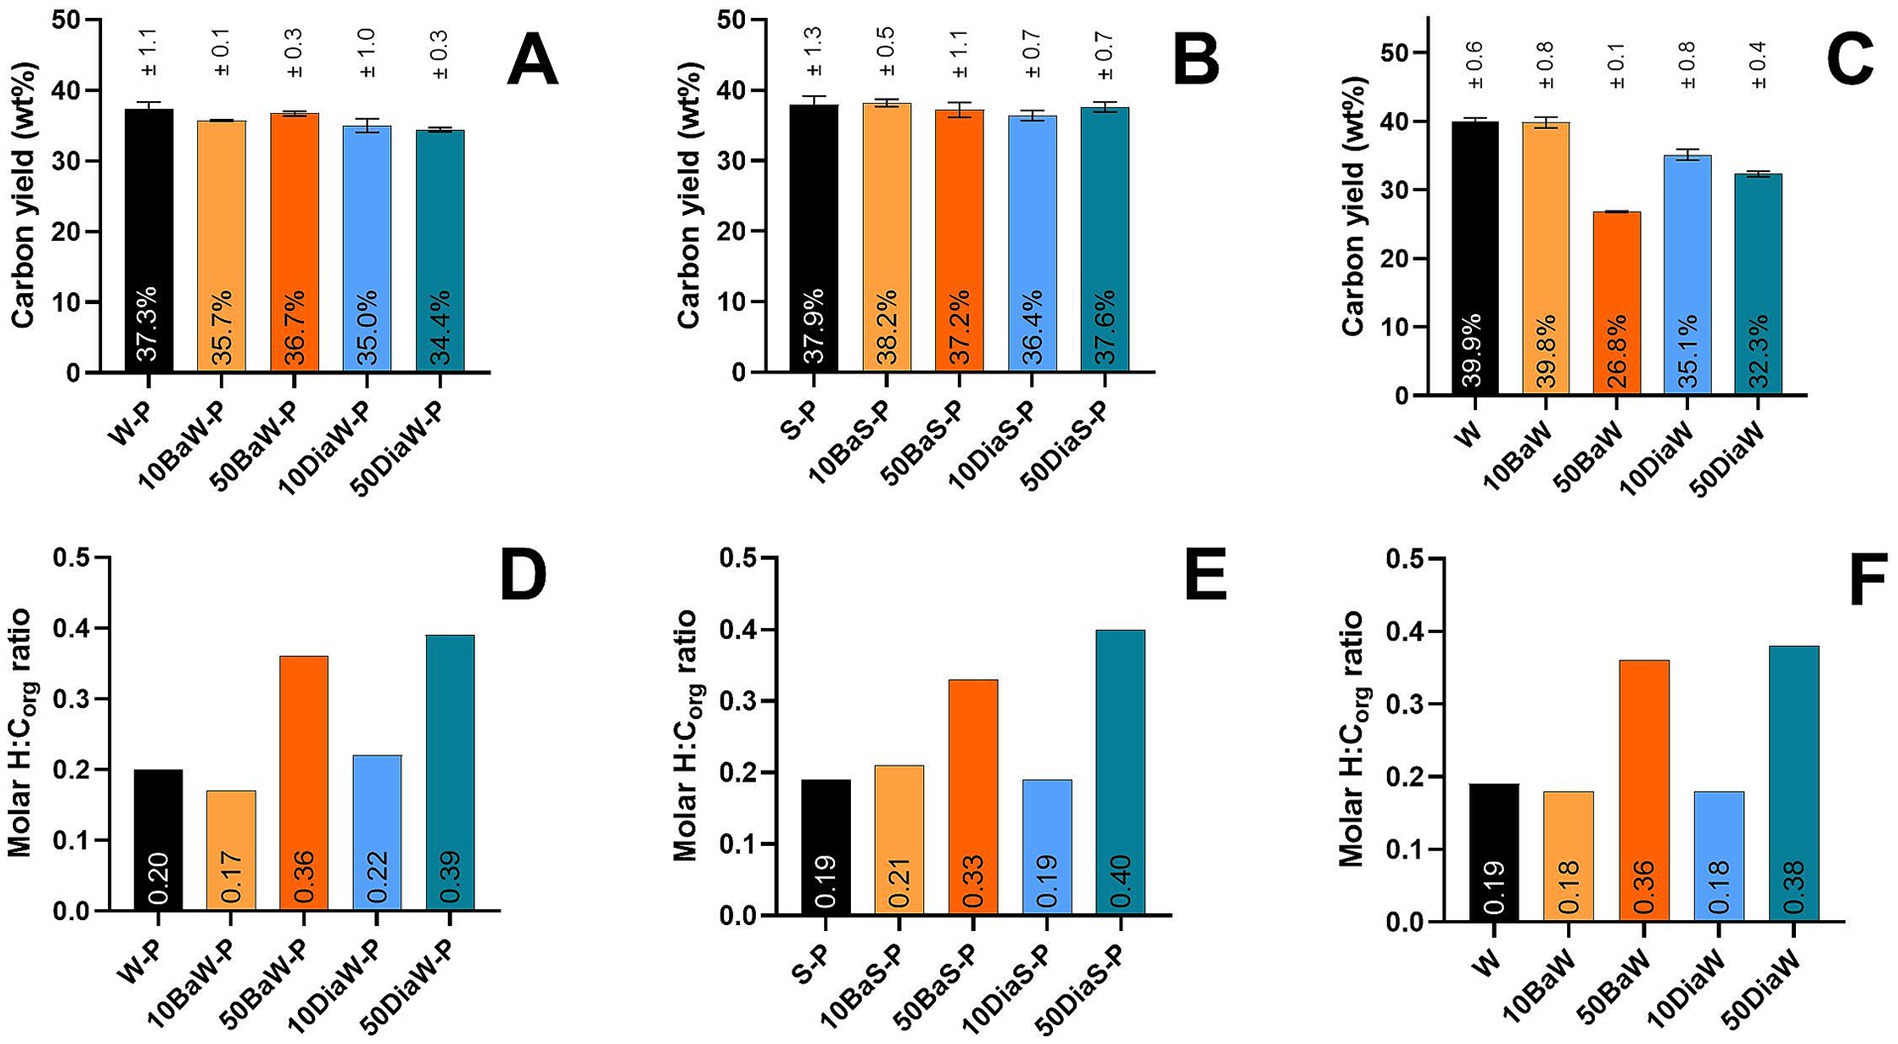
Figure 2. Carbon yield, given as the wt% of organic carbon in feedstock material converted to solid pyrogenic carbon during pyrolysis (A–C) and molar H:Corg (D–F). Error bars in A–C present the standard deviation of repeated sampling (n = 2–4) during continuous production (c.f. section 2.1). (A + D) (rock enhanced = RE-)biochars from wood pellets (W-P) containing 10–50% basanite (10BaW-P, 50BaW-P) or 10–50% diabase (10DiaW-P, 50DiaW-P). (B + E) (RE-)biochars from straw pellets (S-P) containing 10–50% basanite (10BaS-P, 50BaS-P) or 10–50% diabase (10DiaS-P, 50DiaS-P). (C + F) (RE-)biochars from loose mixtures of wood chips (W) and rock powder, containing 10–50% basanite (10BaW, 50BaW) or 10–50% diabase (10DiaW, 50DiaW).
The highest carbon yield of 39.9 ± 0.6% was achieved for W-based biochar (non-pelleted) (Figure 2C), which was not affected by low rock powder additions of 10% but was reduced to 27–32% by higher rock powder additions (50BaW, 50DiaW). An inspection of the burning chamber after project completion revealed fine material residues—potentially both from biomass and rock powder, indicating mineral and carbon losses. Since the research pyrolysis unit lacked a gas filter, some fine particles were likely drawn into the pyrolysis gas combustion chamber. Consequently, the observed differences in mass balance may result from these losses. Therefore, caution should be exercised when drawing conclusions regarding the carbon yield and ash content of non-pelleted RE-biochars.
All (RE-)biochars showed H:Corg ratios ≤ 0.4. Pure biochars had a H:Corg of 0.2 (Figures 1D–F), which remained largely unchanged by 10% nominal rock powder addition, but increased to 0.33–0.40 for 50% nominal rock powder addition. Density fractionations of RE-biochar showed that the low-density fraction had a lower H:Corg ratio than the fraction with a density >2.5 g cm−3 (Figure 3).
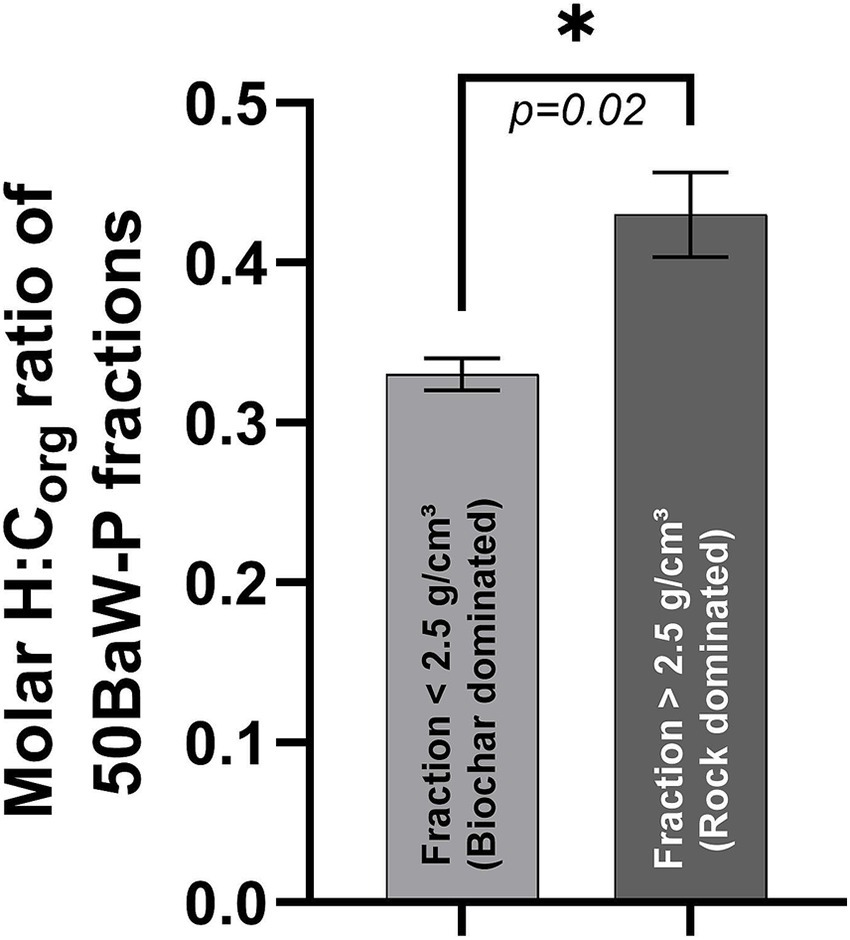
Figure 3. Molar H:Corg ratio of fractions of rock-enhanced biochar produced from pellets containing 50% basanite (50BaW-P) after density fractionation (r = 2.5 g cm−3), showing significant difference following a paired t-test for parametric data based on n = 3 repeated measures and ὰ = 0.05.
3.3.2 Thermogravimetric analysis
The fraction of dry and ash free (daf) biochar resisting thermal degradation until 1,000°C under N2 atmosphere, here referred to as BC1000C, was determined using TGA. W-P showed a BC1000C content of 68.9% (Figure 4A), which was increased by addition of rock powder at low dosages to 74.1% (+8%) and 75.1% (+9%) for 10BaW-P and 10DiaW-P, respectively, but decreased at high dosages to 47.9% (50BaW-P) and 32.2% (50DiaW-P), respectively. Most daf biochar was volatilized between 750°C and 1,000°C. The fraction of daf biochar lost in this temperature range increased from 9.7% in W-P to 29.2 and 27.8% in 50BaW-P and 50DiaW-P, respectively.
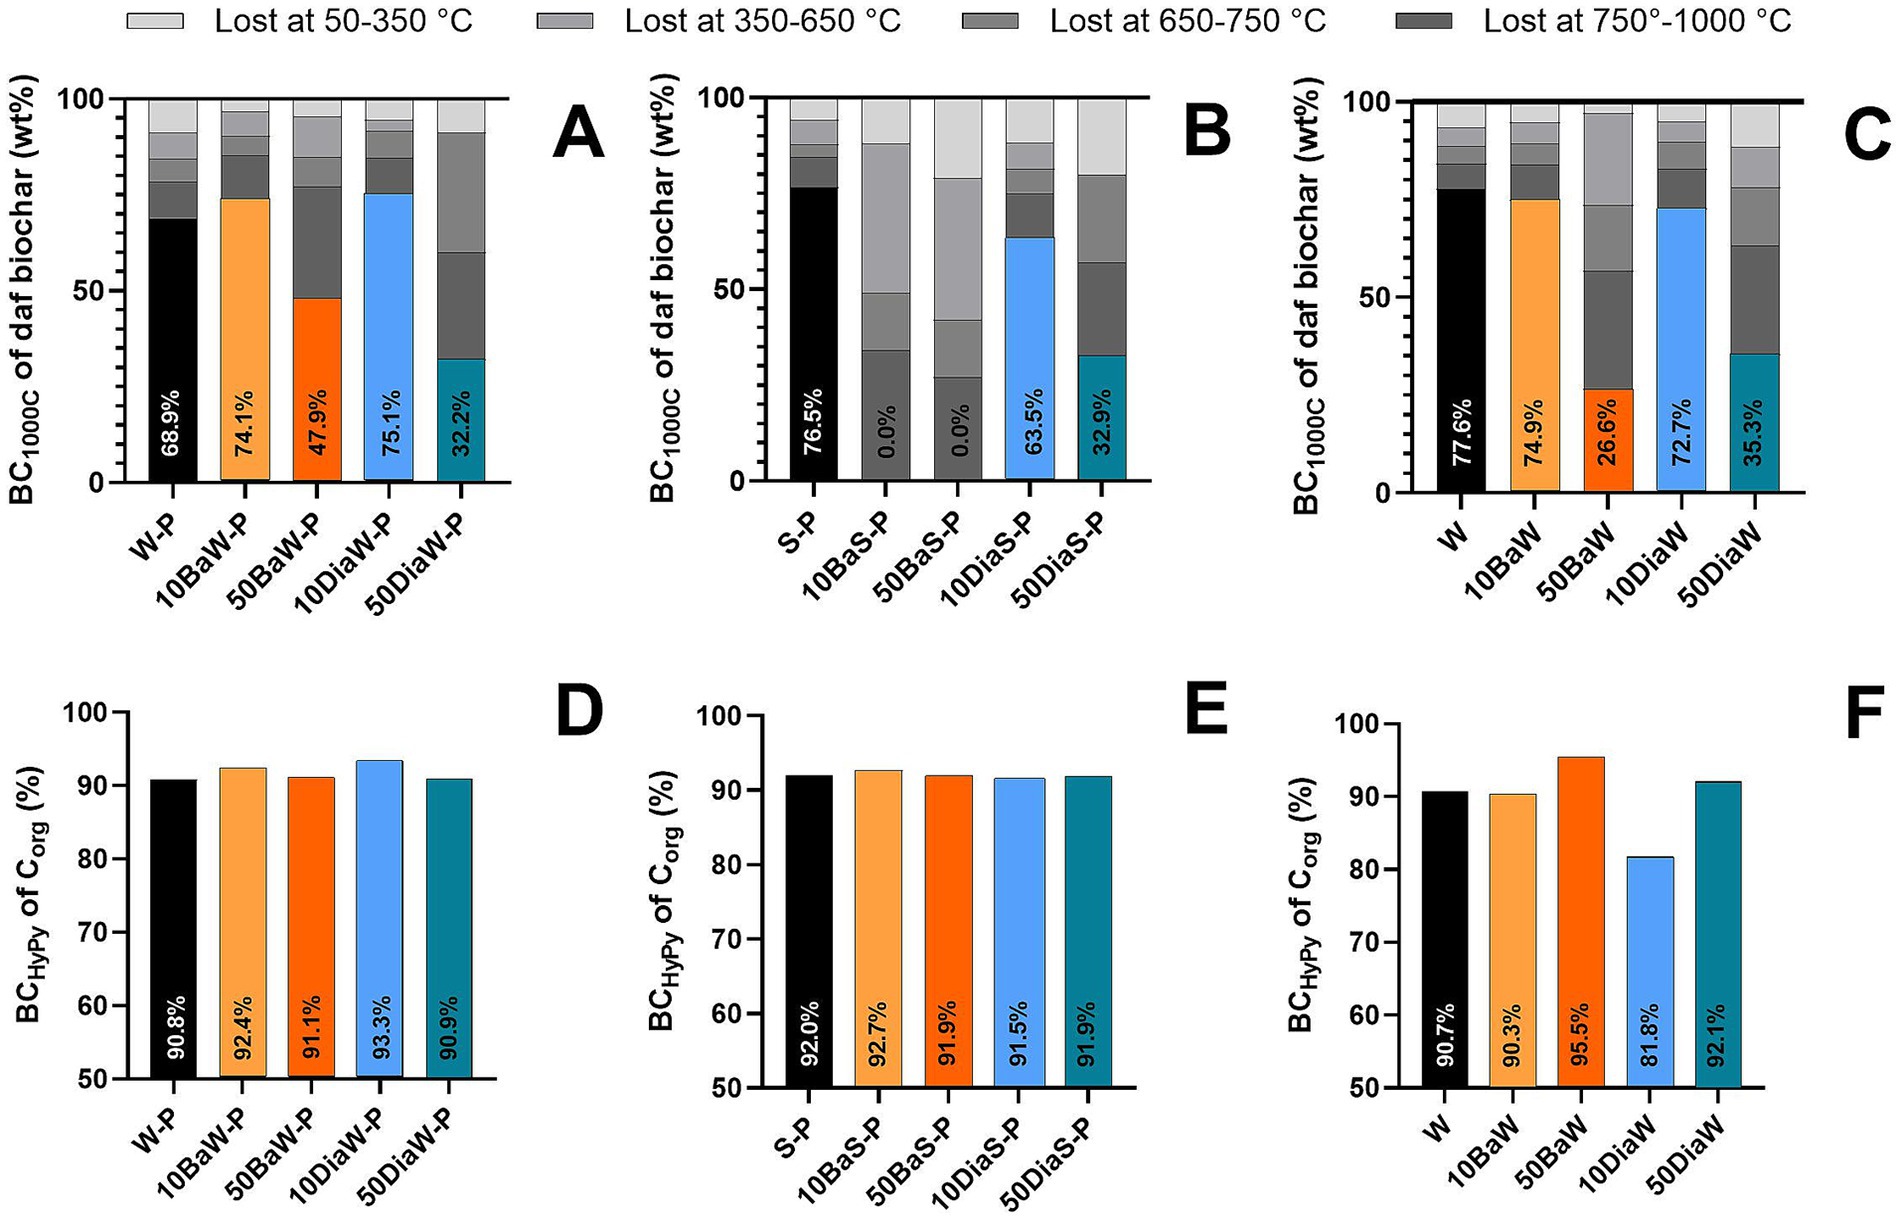
Figure 4. Relative mass loss (wt%) of dry and ash free (daf) biochar mass in specific temperature ranges of thermogravimetric analysis (in gray scale) and BC1000C fraction retained (in color) (A–C). Residual carbon after hydropyrolysis (BCHyPy) in % of initial Corg of the biochar (D–F). (A + D) (rock-enhanced = RE-)biochars from wood pellets (W-P) containing 10–50% basanite (10BaW-P, 50BaW-P) or 10–50% diabase (10DiaW-P, 50DiaW-P). (B + E) (RE-)biochars from straw pellets (S-P) containing 10–50% basanite (10BaS-P, 50BaS-P) or 10–50% diabase (10DiaS-P, 50DiaS-P). (C + F) (RE-)biochars from loose mixtures of wood chips (W) and rock powder, containing 10–50% basanite (10BaW, 50BaW) or 10–50% diabase (10DiaW, 50DiaW).
The highest rate of weight loss, referred to as d(T) (Supplementary Figure S7), occurred (closely aligned with the d(T) of W-P) at 673°C in 10BaW-P and 50BaW-P, shortly after the initial pyrolysis temperature (650°C) was exceeded. The d(T) peaks of 10DiaW-P and 50DiaW-P were shifted upwards to 714°C and 723°C, respectively. This temperature range coincided with weight loss from carbonates in pure diabase (Supplementary Figures S1, S9).
Straw biochar had a BC1000C content of 76.5% (S-P, Figure 4B), which decreased to 63.5% (10DiaS-P) and 32.9% (50DiaS-P), respectively, when diabase was added. Remarkably, thermal stability was severely reduced in straw RE-biochars with basanite, resulting in a BC1000C content of zero. For S-P, d(T) peaked already at 550°C (10BaS-P) and 593°C (50BaS-P), well below the initial pyrolysis temperature (Supplementary Figure S7). Like W-P-based RE-biochar, the BC1000C content of W-based RE-biochars (Figure 4C) decreased at 50% nominal rock powder addition yet remained unaffected at 10% rock powder addition.
3.3.3 Hydropyrolysis
The BCHyPy fraction corresponds to the fraction of Corg that consists of clusters >7 fused aromatic rings (Howell et al., 2022), a measure for the long-term stability of biochar. It accounted for 90.3–95.5% of initial Corg for all samples (Figures 4D–F), except for 10DiaW, which showed a considerably lower BCHyPy content (81.8%). Increases in BCHyPy by up to 2.5% in W-P RE-biochar with 10% nominal rock powder addition are within the typical error of ±2% in HyPy analysis, which is limited by the accuracy of the elemental analyzer (Meredith et al., 2012).
3.3.4 Solid state electrical conductivity
The SEC of RE-biochar behaved inverse to the rock powder content. Pure biochars showed a SEC in a range of 8 mS cm−1 (W-P) and 25 mS cm−1 (S-P), which decreased to 2.3–24.0 mS cm−1 at low rock amendment rates, and to 0.3–3.6 mS cm−1 at high rock amendment rates, i.e., by up to 99%. The correlation between SEC and H:Corg ratio is pronounced (Exponential one-pool; R2 = 0.76; Supplementary Figure S5). Still, the SEC of RE-biochars was higher than the SEC of mass equivalent post-pyrolysis mixtures of biochar and rock powder (Supplementary Table S15).
3.3.5 Fourier transformation infrared spectroscopy
An absorption spectrum typical of high-temperature biochar was measured for W-P (Figure 5). Distinct peaks in the band of 1,020–1,160 cm−1 relating to vibrations of C-O bonds of polysaccharides and carbohydrates (Johnston, 2017) were absent, however, strong absorption signals obtained in the band of 1,580–1,610 cm−1 indicate the presence of C-C bonds in aromatic moieties. Compared to W-P, the peak intensity for O=C=O (CO2) at 2349 cm−1 decreased slightly in 10BaW-P and 10DiaW-P, with a stronger signal reduction in 50BaW-P and 50DiaW-P. This relates to a reduced infra-red absorption by gaseous CO2 within the sample. There was a strong positive correlation between peak intensity at 2349 cm−1 and cumulative pore space quantified by gas-adsorption, particularly for W-P based RE-biochar (R2 = 0.71, Supplementary Figure S15B). The RE-biochars 50BaW-P and 50DiaW-P showed lower peak intensity at 1580 cm−1 compared to W-P, which relates to stretching vibrations of C-C bonds, an indication of aromatic carbon moieties (de la Rosa et al., 2014; Johnston, 2017). Note that a decreased peak intensity may also be caused by dilution effects, as 50BaW-P contains only 17.0% Corg, compared to 84.3% Corg in pure W-P. The correlation between peak intensity at 1580 cm−1 and Corg content was strong (W-P based RE-biochar: R2 = 0.88, Supplementary Figure S14B). It is worth noting that for wood-based RE-biochars, employing nominal additions of 10% rock powder, the peak intensity at 1580 cm−1 did not decrease, despite a 25% decrease in Corg content (Supplementary Figure S14B).
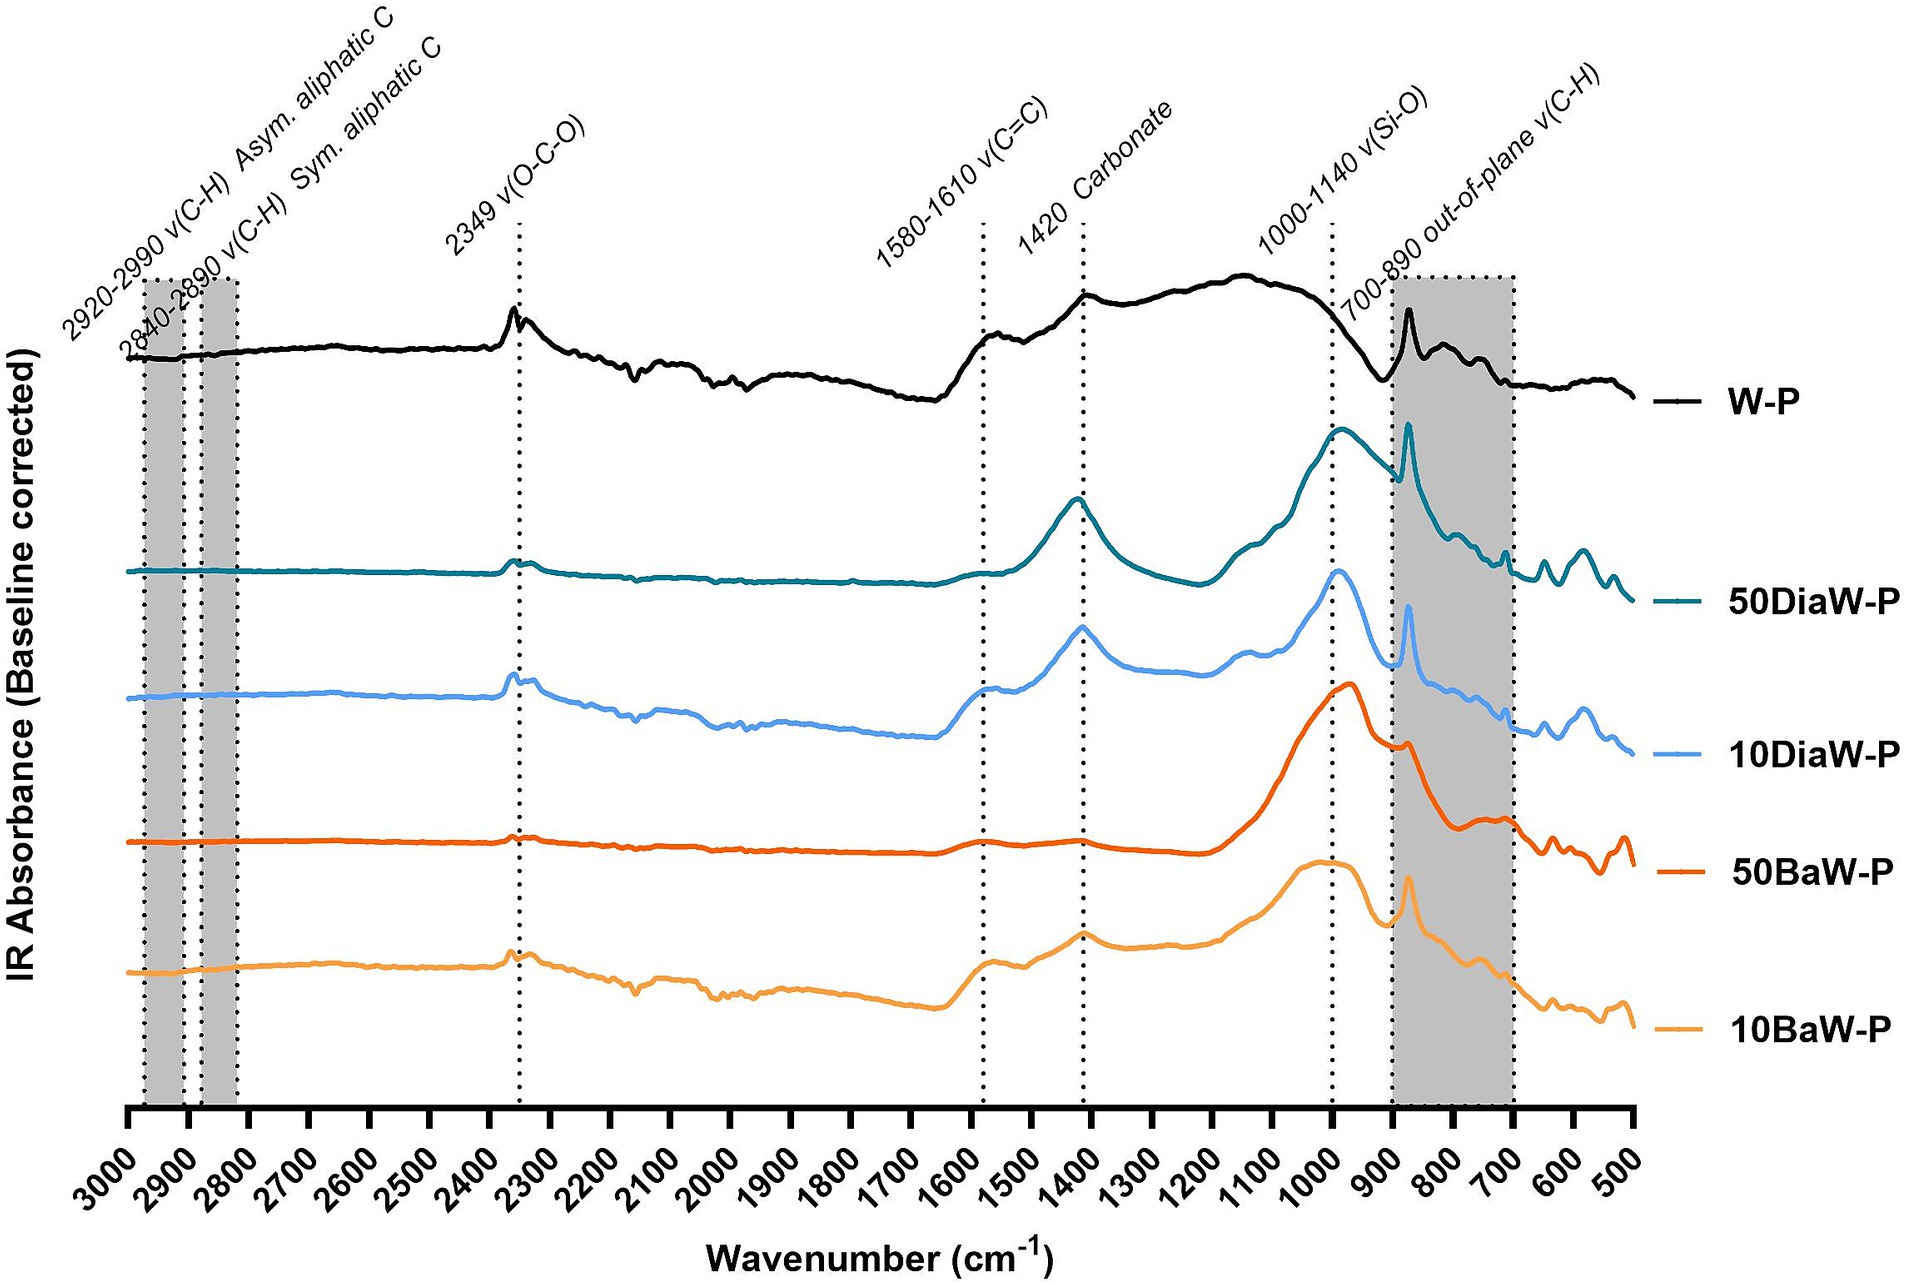
Figure 5. Fourier transformed infrared absorption spectra for wood pellet (W-P) based (rock-enhanced = RE-)biochars, containing 10–50% basanite (10BaW-P, 50BaW-P) or 10–50% diabase (10DiaW-P, 50DiaW-P). Spectra were obtained directly from the (RE-)biochars, milled to < 3 mm particle size, by attenuated total reflectance measurement. All spectra are baseline corrected. Grey boxes highlight wavenumber ranges in which substance specific peaks can occur. Further FTIR measurements, describing S-P and W-based RE-biochars, resemble the same pattern (Supplementary Figure S3). Sym. = Symmetric; Asym. = Asymmetric.
Between 700–890 cm−1, the bending vibration of out-of-plane C-H bonds located at the edge of aromatic structures, are observed. Here, different peaks could be distinguished, e.g., for aromatic rings with only one out-of-plane C-H bond (high wavenumber; low H:Corg of aromatic ring) and up to three or four out-of-plane C-H bonds (low wavenumber; high H:Corg of aromatic ring) (Supplementary Figure S4; Russo et al., 2014; Johnston, 2017; Chikamatsu et al., 2018). Peaks from aromatic rings with single out of plane C-H bonds overlapped with a peak at 880 cm−1 that was also recorded for pure basanite and diabase. However, the signal is also present in every biochar, including W-P. Peaks from aromatic rings with three to four out of plane C-H bonds became visible only in 10DiaW-P and 50DiaW-P.
Generally, absorption by minerals were located at bands between 950–1,500 cm−1 (Johnston, 2017), thus interference with the interpretation of the abovementioned aromatic and aliphatic carbon-based absorption bands was unlikely. The amended silicate rock material can be detected by peaks at 990 cm−1 (Hagemann et al., 2018; Smidt et al., 2002), indicating vibrations of Si-O along with strong signals at 1420 cm−1 for diabase amended RE-biochars, indicating the presence of carbonates including CaCO3. Absorption bands for phosphate (1000–1,050 cm−1) are situated in the same region but masked by Si-O vibrations.
3.4 Rock-enhanced biochar: nutrients, trace elements and liming potential
3.4.1 Content of main and trace elements
The calculated content of essential (e.g., Mg, Ca) and beneficial (Si) macro- and micronutrients in RE-biochars increased proportionally with increasing rock powder content (Table 2). Taking the example of 50BaW-P, the SiO2 content increased from 0.2% in W-P to 35.1%, the MgO content from 0.4 to 6.6% and the CaO content from 4.9 to 10.3% when compared to W-P. These differences were smaller for straw biochars, which originated from biomass rich in calcium and potassium. Phosphorus content in RE-biochars was lower than in pure biochar, since the amended basanite and diabase showed low concentrations of P2O5. The calculated concentration of trace metals (Cu, Zn, Ni, Cr) was proportionally increased in RE-biochar, where trace metal concentrations in the rock powder were higher than those in the pure biochar. Scanning electron microscopy coupled to EDX showed the spatial heterogeneity of RE-biochar elemental composition at the micron scale (Figures 6A–F).
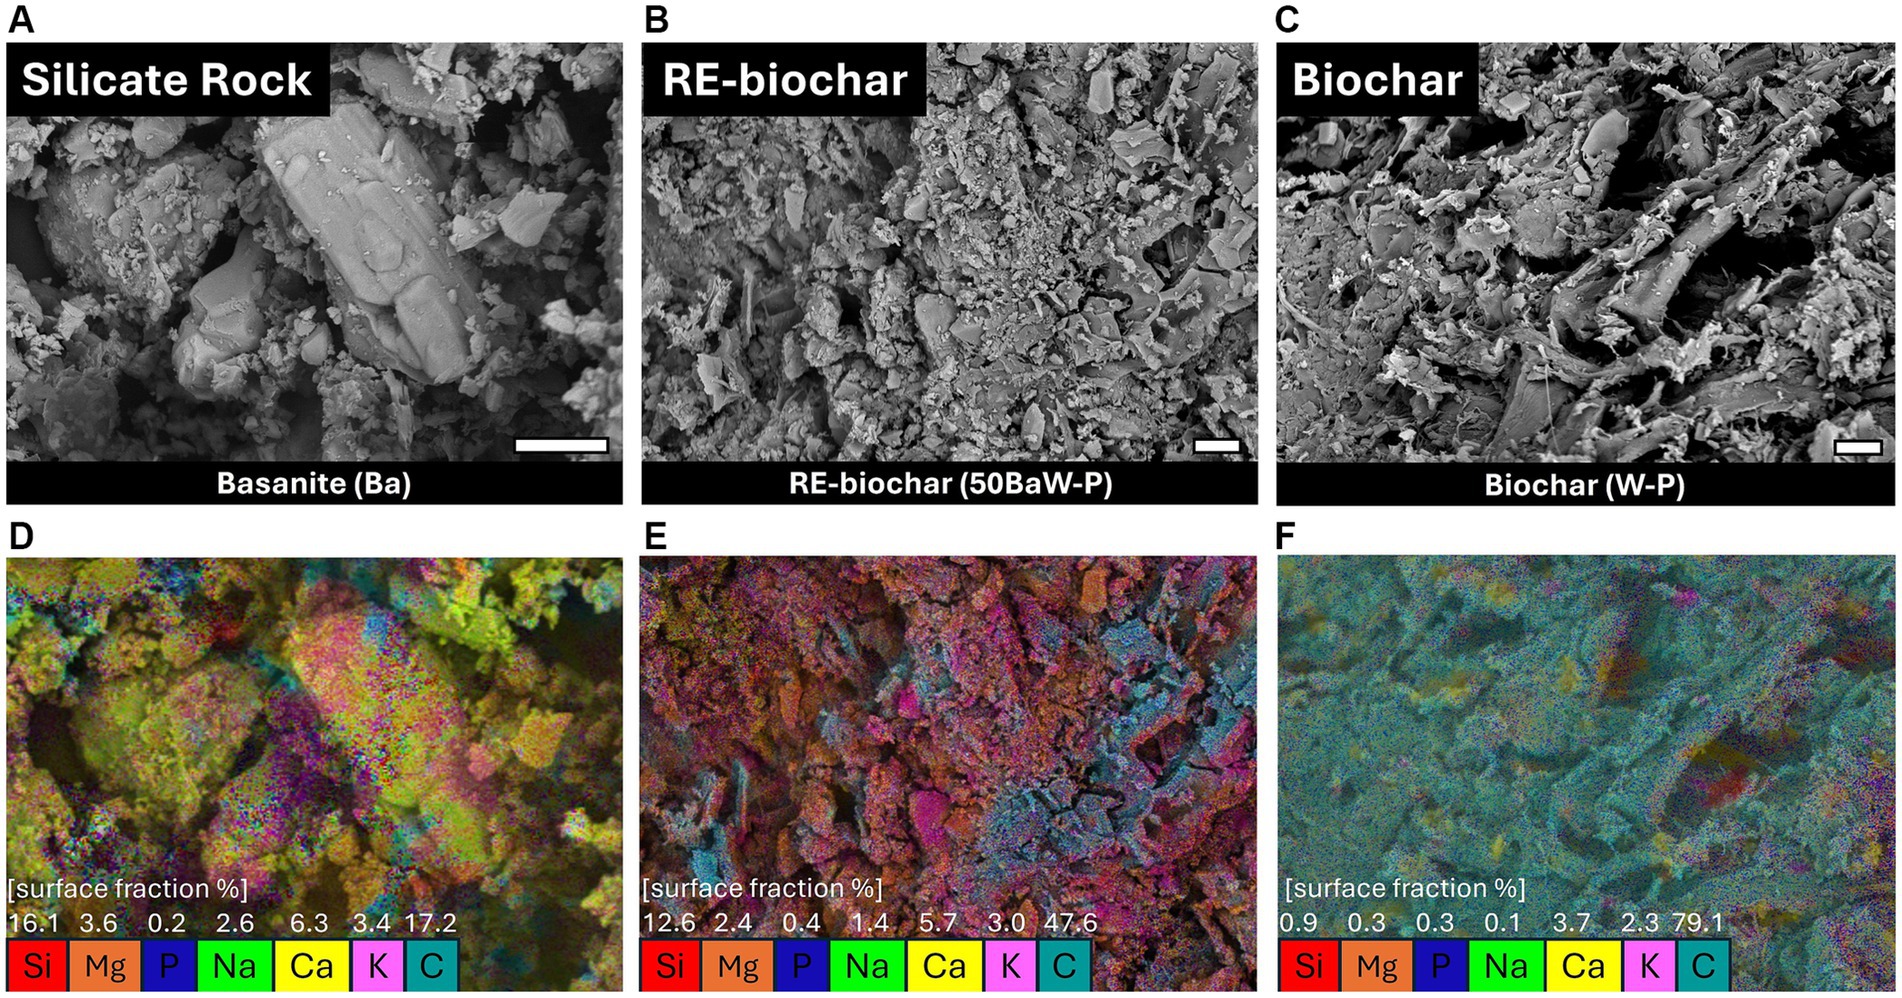
Figure 6. Scanning electron micrograph of (A) basanite (Ba, 0–250 μm), (B) a rock-enhanced biochar produced from wood pelleted with 50 wt% of basanite (50BaW-P) and (C) biochar from wood pellets (W-P). (D–F) show the corresponding energy-dispersive X-ray spectroscopy (EDX) mappings, indicating the distribution of selected elements at the material surface. The color code illustrates the spatial distribution of the respective elements. White numbers indicate the surface share of the respective elements, excluding oxygen. The white scale-bar presents 10 μm.
The calculation of main- and trace metal contents in RE-biochar according to Equation 4 led to results generally well comparable to direct measurements following the EBC standard methodology (Supplementary Table S6; EBC, 2024) and showed absolute differences in the range of ±2 wt% over all elements observed. However, where concentrations of a given element were small, the difference between calculated and measured nutrient concentrations often translated into a larger relative error.
3.4.2 pH and liming potential
While the addition of 10% rock powder to biomass had negligible effects on the biochar pH (material pH measured in CaCl2 suspension), RE-biochars produced from wood or straw with 50% rock powder addition showed a higher pH than pure biochars (Table 2). Straw biochar had a higher pH than any wood (RE-)biochar. Likewise, the liming potential, given as wt% of CaO-equivalents (sum of basic compounds) was higher for straw than for wood (RE-)biochars and increased with rock powder addition, which was most pronounced in diabase-based RE-biochars, increasing from 6.8 wt% in W-P to 21.6 wt% in 50DiaW-P and from 6.4 wt% in S-P to 21.2 wt% in 50DiaS-P.
3.4.3 Leaching experiment
All biochars released ions during the leaching experiment, which affected the EC and pH of the leachate water (Figures 7A–C; Supplementary Table S12). Within the time horizon of the leaching experiment, the cumulative ion release (normalized to 1 kg amendment) decreased with an increasing rock content in the RE-biochar. This was mainly mirrored in a lower K release, which was 97% lower in 50BaW-P when compared to W-P (Figure 7). However, the release of Na, Mg, and Ca tended to increase for RE-biochar compared to their pure biochar counterpart. Sodium release was enhanced strongest in basanite-based RE-biochar, being almost 5 times higher in 50BaW-P compared to W-P. Magnesium and Ca release were enhanced strongest in diabase-based RE-biochar, increasing by 165 and 68%, respectively, for 50DiaW-P (Figure 7A). Potassium release was highest in S-P and straw-based RE-biochars (Figure 7B). It is worth noting that K release from non-pelletized wood biochar was reduced by 30% compared to pelleted blends, where the biomass had experienced more damage on a cellular level during pelleting (Figure 7C). The leachate EC (Figures 7D–F) and pH (Figures 7G–I) generally peaked within the first week of the experiment. Pure biochar, followed by RE-biochars employing 10% nominal rock powder addition, induced the highest spikes in leachate EC, reaching close to 104 mS cm−1 for S-P (conductivity of the MilliQ water supplied to the columns <5 μS cm−1). Similarly, the leachate pH peaked in the first week of the experiment. The strongest pH elevations were observed for S-P-based biochars. After six weeks, the leachate from W and W-P-based RE-biochar amended columns reached a pH of 8.1 ± 0.1 and the leachate from S-P-based RE-biochar amended columns a pH of 8.4 ± 0.2, while the pH in leachate from the non-amended sand matrix remained at 6.8.
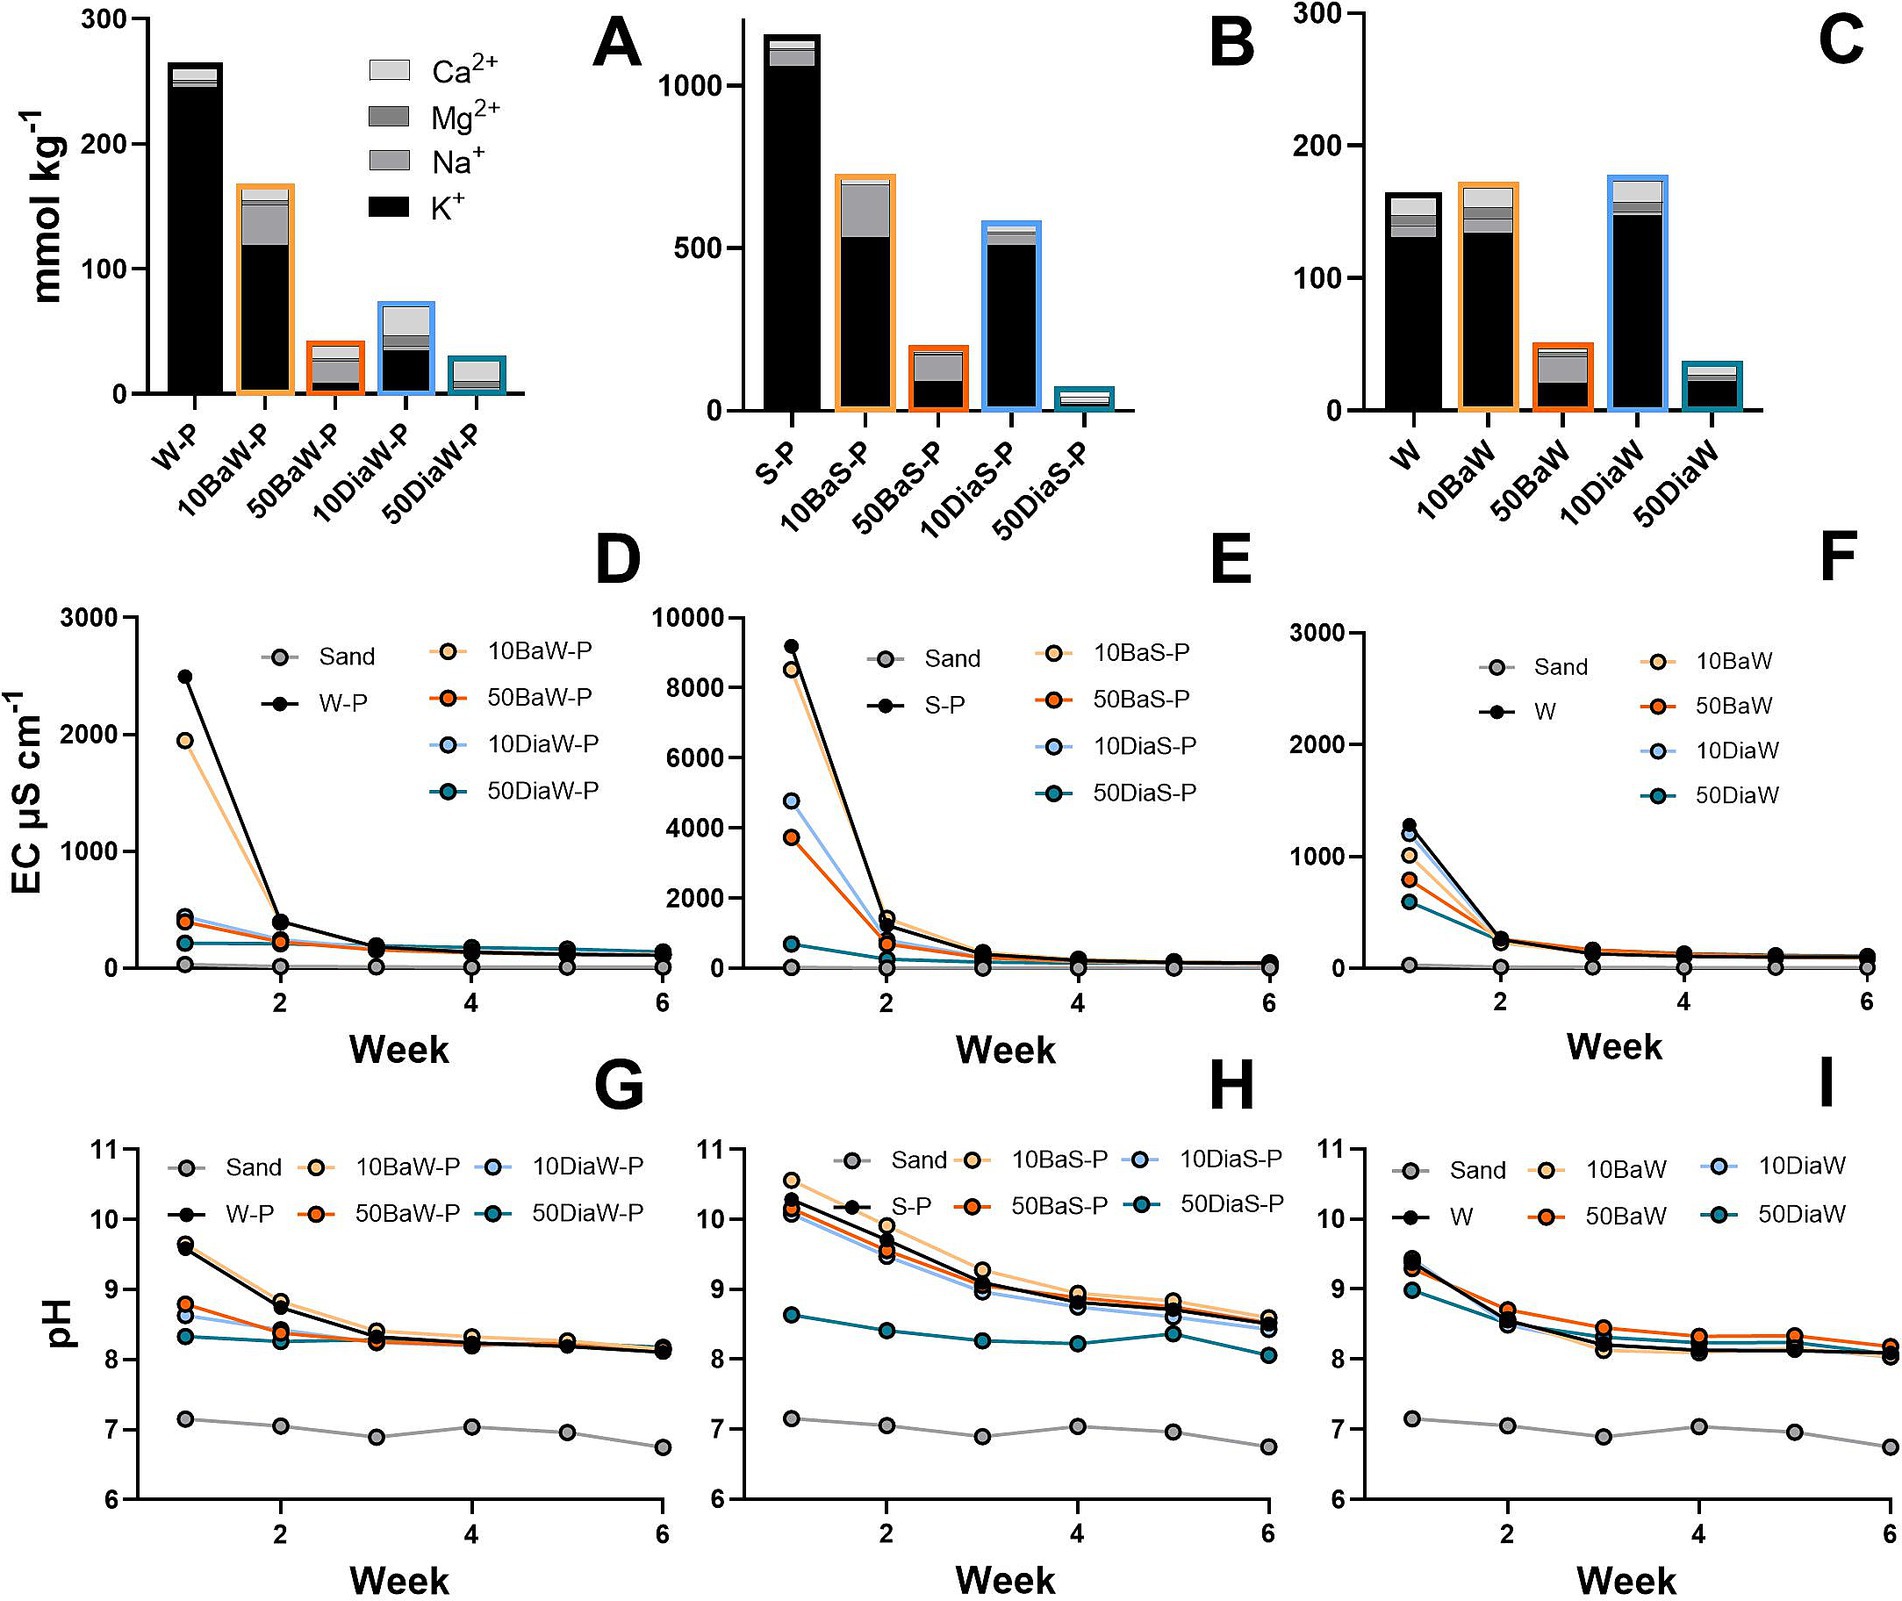
Figure 7. (A–C) Cumulative release of major cations (K, Na, Mg, Ca) over a six-week leaching experiment (540 L MilliQ water per m2). Results are presented in mmol kg−1 (rock-enhanced = RE-)biochar applied to a non-buffered sand matrix, i.e., the results are normalized to 1 kg amendment, not to the “pure biochar” weight. (D–F) Leachate electrical conductivity (EC) in mS cm−1. (G–I) Leachate pH. Changes in pH and EC are displayed for each weekly measurement interval and compared to the unamended sand matrix (grey line) (A,D,G) (RE-)biochar from wood pellets (W-P) containing 10–50% basanite (10BaW-P, 50BaW-P) or 10–50% diabase (10DiaW-P, 50DiaW-P). (B,E,H) (RE-)biochar from straw pellets (S-P) containing 10–50% basanite (10BaS-P, 50BaS-P) or 10–50% diabase (10DiaS-P, 50DiaS-P). (C,F,I) (RE-)biochar from loose mixtures of wood chips (W) and rock powder, containing 10–50% basanite (10BaW, 50BaW) or 10–50% diabase (10DiaW, 50DiaW). All data shown is the arithmetic mean of columns set up in duplicate (n = 2).
3.5 Specific surface area and pore volume
The specific surface area (SSA) of pure biochar was in the range of 185 m2 g−1 (W) to 200 m2 g−1 (S-P). For W-P- and S-P-based RE-biochars, the measured SSA did not correspond to the expected SSA, calculated as the proportional sum of pure biochar and rock powder SSA. Co-pyrolysis caused a disproportional decrease in SSA (Figures 8A–C). The nominal addition of 10% basanite reduced the SSA by 74–76% below the expected SSA (23–86% for 50% basanite and diabase). In contrast, 10DiaW-P and 10DiaS-P showed 8 and 24% higher SSA, respectively, than expected. The specific surface area of RE-biochars from co-pyrolysis of loose mixtures of woody feedstock with the two rock powders matched the expected values. The cumulative pore volume, in relation to its rate of increase (differential volume in cm3 nm−1 g−1) is summarized in Supplementary Figure S8. The underlying N2 adsorption isotherms are available online on Zenodo (DOI: 10.5281/zenodo.15773110).
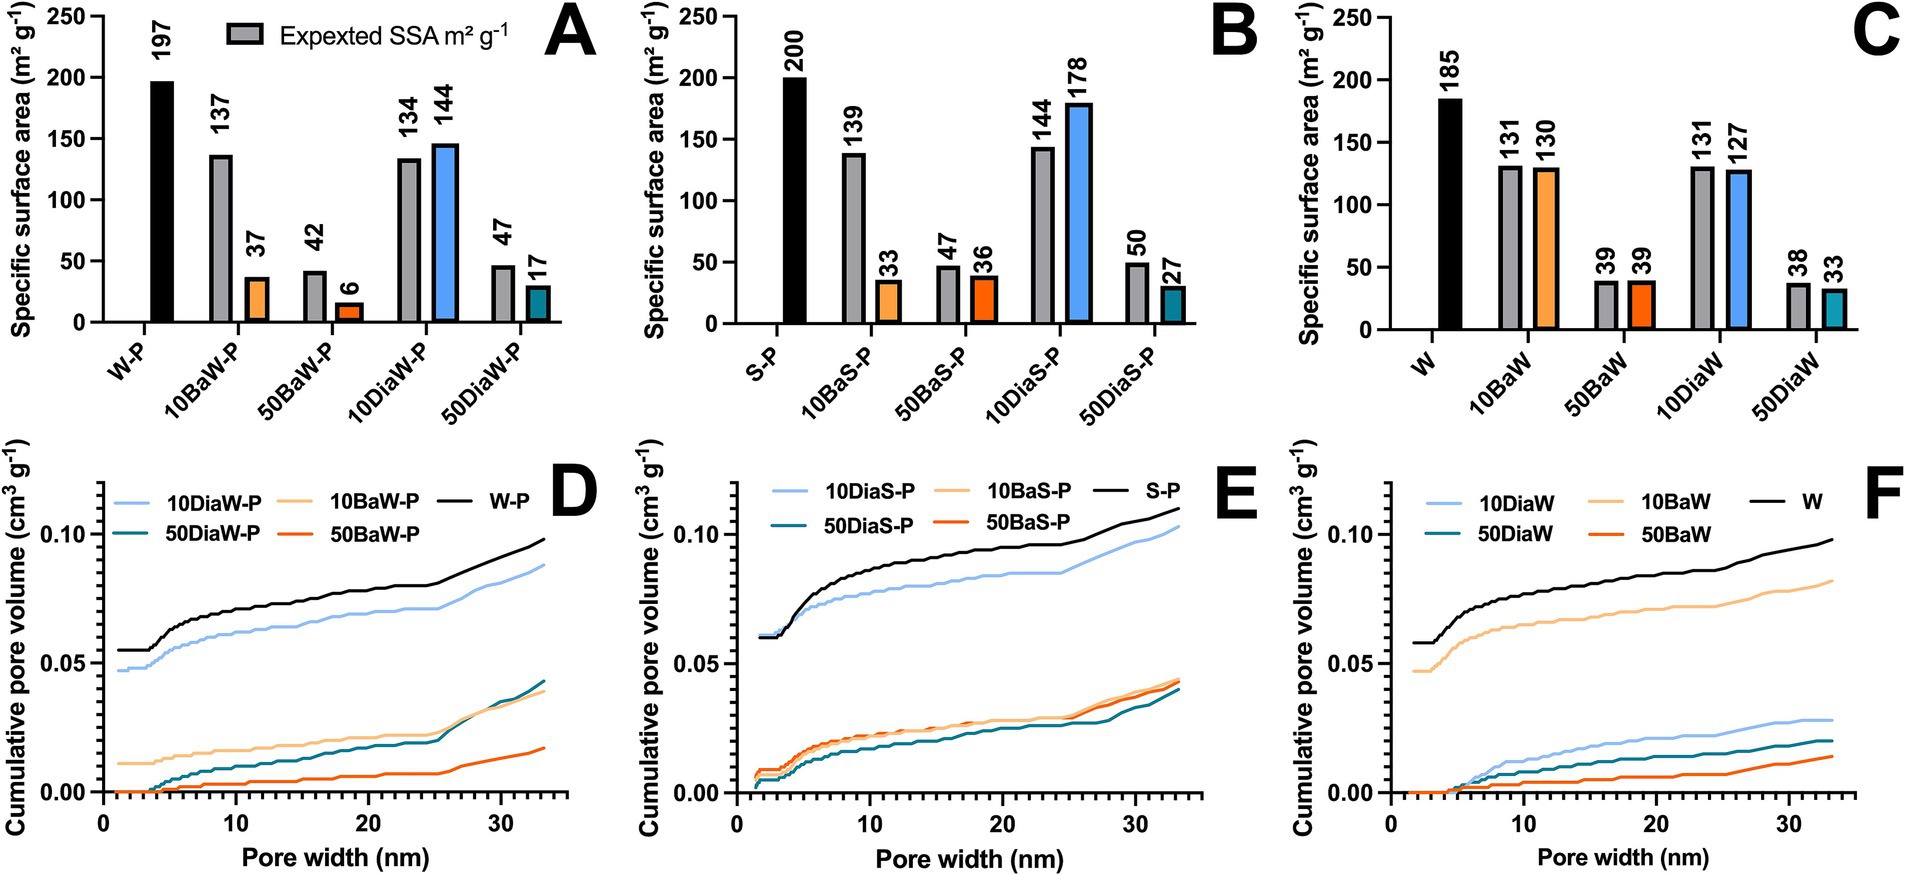
Figure 8. (A–C) BET specific surface area (SSA) of (rock-enhanced = RE-)biochar in m2 g−1. The grey bars represent the expected value, which is calculated based on the data of pure biochar and pure rock powder (Supplementary Table S7) and their mass fraction in RE-biochar, assuming no interaction during pyrolysis. (D–F) Cumulative pore volume distribution in cm3 g−1. Both parameters were derived from N2 physiosorption. (A + D) (RE-)biochars from wood pellets (W-P) containing 10–50% basanite (10BaW-P, 50BaW-P) or 10–50% diabase (10DiaW-P, 50DiaW-P). (B + E) (RE-)biochars from straw pellets (S-P) containing 10–50% basanite (10BaS-P, 50BaS-P) or 10–50% diabase (10DiaS-P, 50DiaS-P). (C + F) (RE-)biochars from loose mixtures of wood chips (W) and rock powder, containing 10–50% basanite (10BaW, 50BaW) or 10–50% diabase (10DiaW, 50DiaW).
Corresponding to the lower measured SSA, a lower total pore volume and altered pore volume distribution were measured for RE-biochars (Figures 8D,F). In RE-biochars with nominal addition of 50% rock powder, the total pore volume decreased by 56–86% compared to pure biochars, with near complete loss in micropores of ≤ 2 nm. Also, 10BaW-P, 10BaSp, and 10DiaW followed a similar trend. In contrast, the micropore volume was preserved in 10DiaW-P, 10DiaS-P, and 10BaW. 10DiaW presented an exception where SSA and pore volume did not correspond, and total pore volume was exceptionally low.
3.6 Carbon sink potential
One metric ton of wood biochar (W-P) has a stoichiometric C-sink potential of 3.09 t CO2e, one metric ton of straw biochar (S-P) has a stoichiometric C-sink potential of 2.67 t CO2e (Table 3). However, the C-Sink potential of one ton of basanite (Ba) or diabase (Dia) is only 0.43 and 0.36 t CO2e, respectively. In RE-biochars the total C-Sink potential consists of the pyrogenic C-Sink (PyC-Sink) of its biogenic fraction and the inorganic C-Sink (IC-Sink) that can be generated by weathering of its rock fraction (c.f. section 2.6.3). Thus, for RE-biochars, the total C-Sink potential per ton of material decreased by 26–70% relative to those of one ton of the corresponding pure biochar, as a function of its rock content. This was mirrored in a strong correlation between Corg and total C-Sink potential (R2 = 0.99, Supplementary Figure S21). Similarly, the total C-Sink potential of RE-biochar decreased relative to pure biochar, if calculated on a volume basis (t CO2e m−3; Supplementary Table S17).
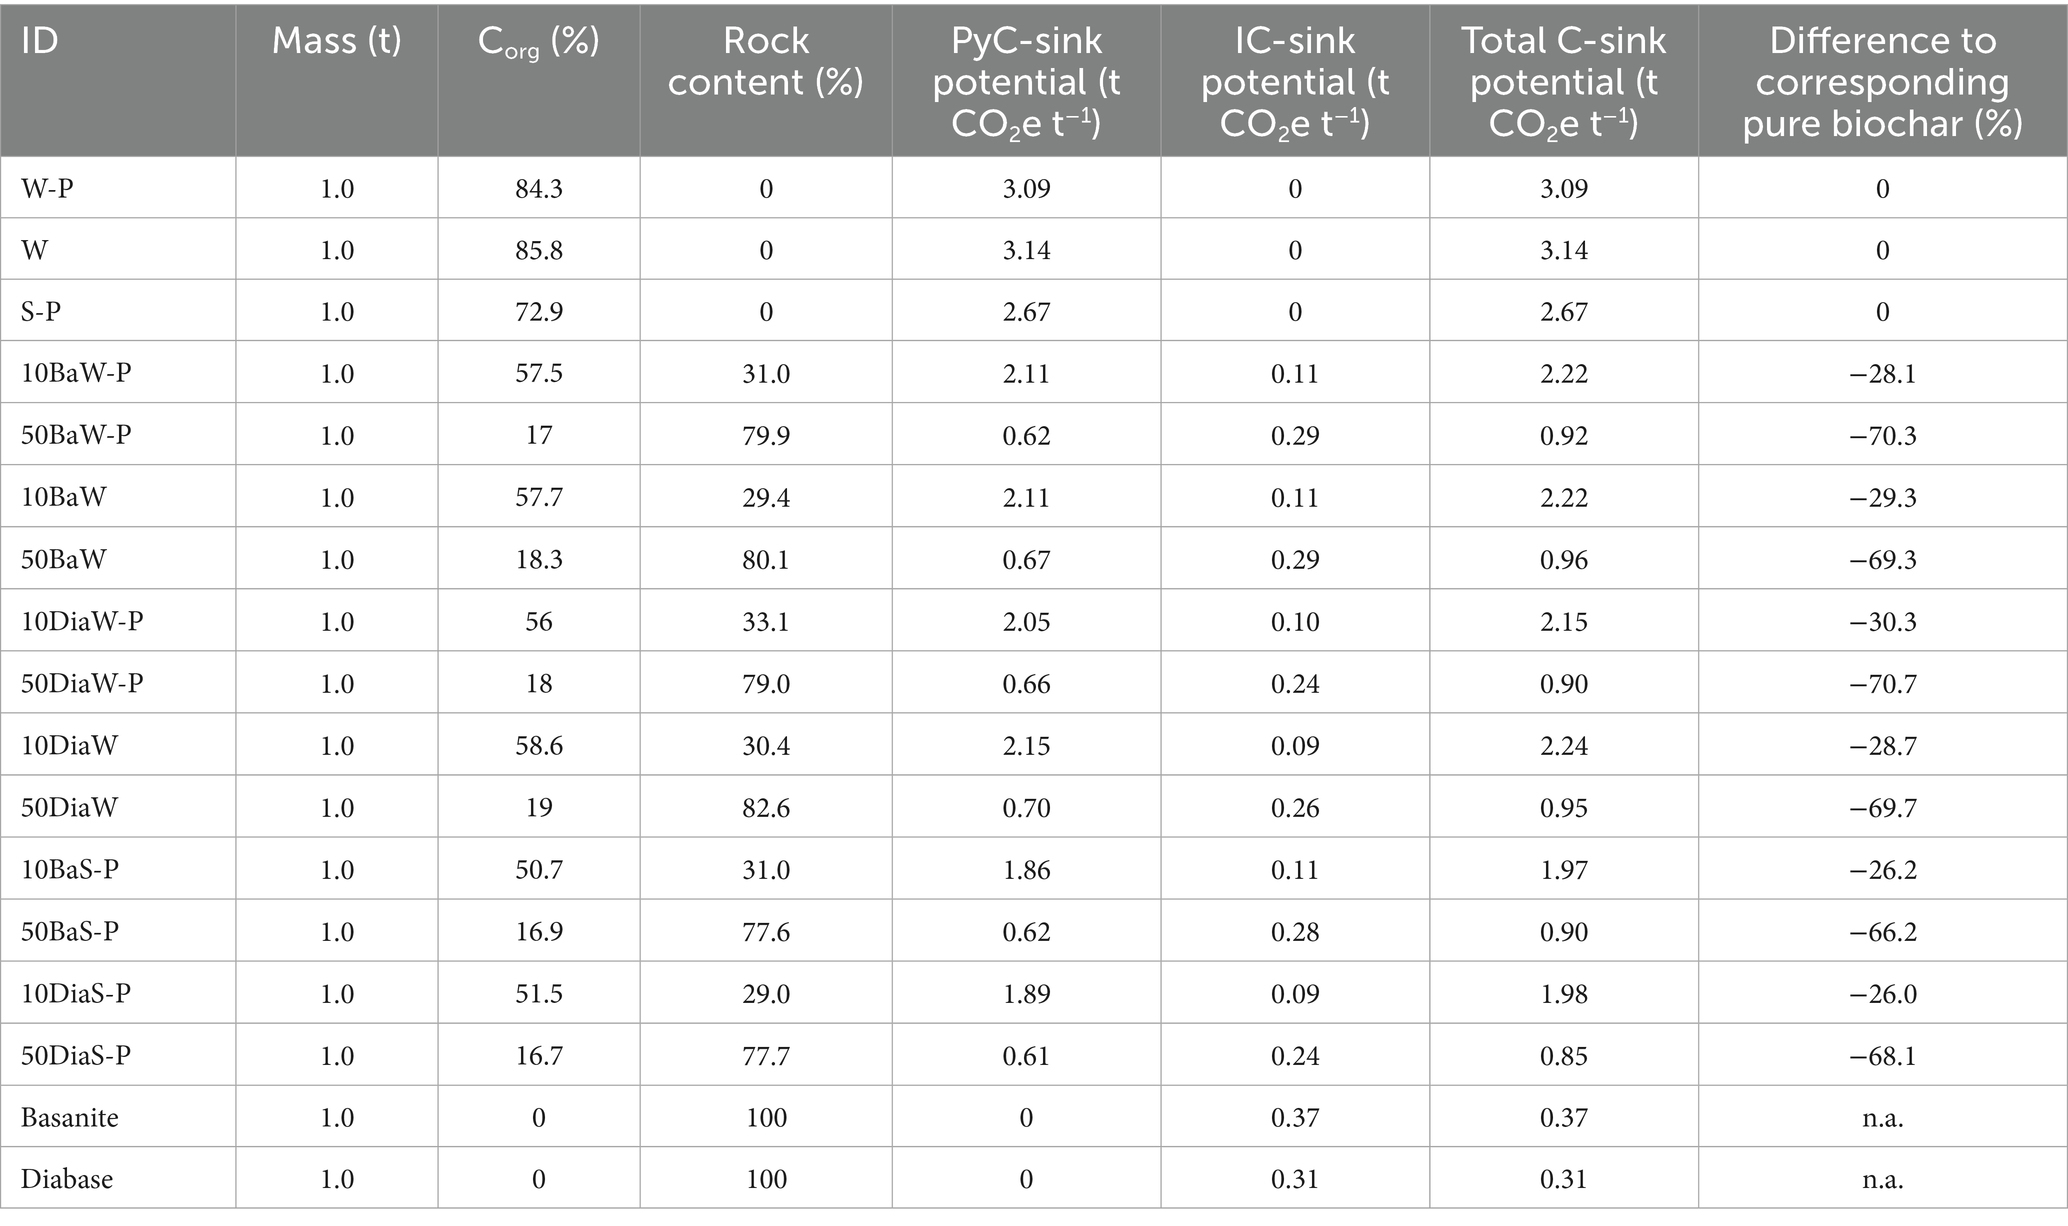
Table 3. Calculated stoichiometric carbon sink potential of biochars, rock-enhanced biochars and rock powders based on 1 t of final product.
One of the limiting factors in biochar production is biomass availability. Given the availability of one ton of biomass, rock-enhancement can increase the C-Sink potential of the final product (Table 4). Pyrolysis of one ton of wood pellets (W-P) yielded 0.22 t of biochar that presented a stoichiometric C-sink potential of 0.67 t CO2e. Pyrolysis of one ton of straw pellets into biochar (S-P) yielded 0.24 t of biochar, presenting a stoichiometric C-sink potential of 0.65 t CO2e. If the same biomass was used to produce RE-biochar, the C-sink potential increased substantially, by 45 and 27% for 50BaW-P and 50DiaW-P, respectively, due to the additional contribution of the IC-sink potential (additive effect).
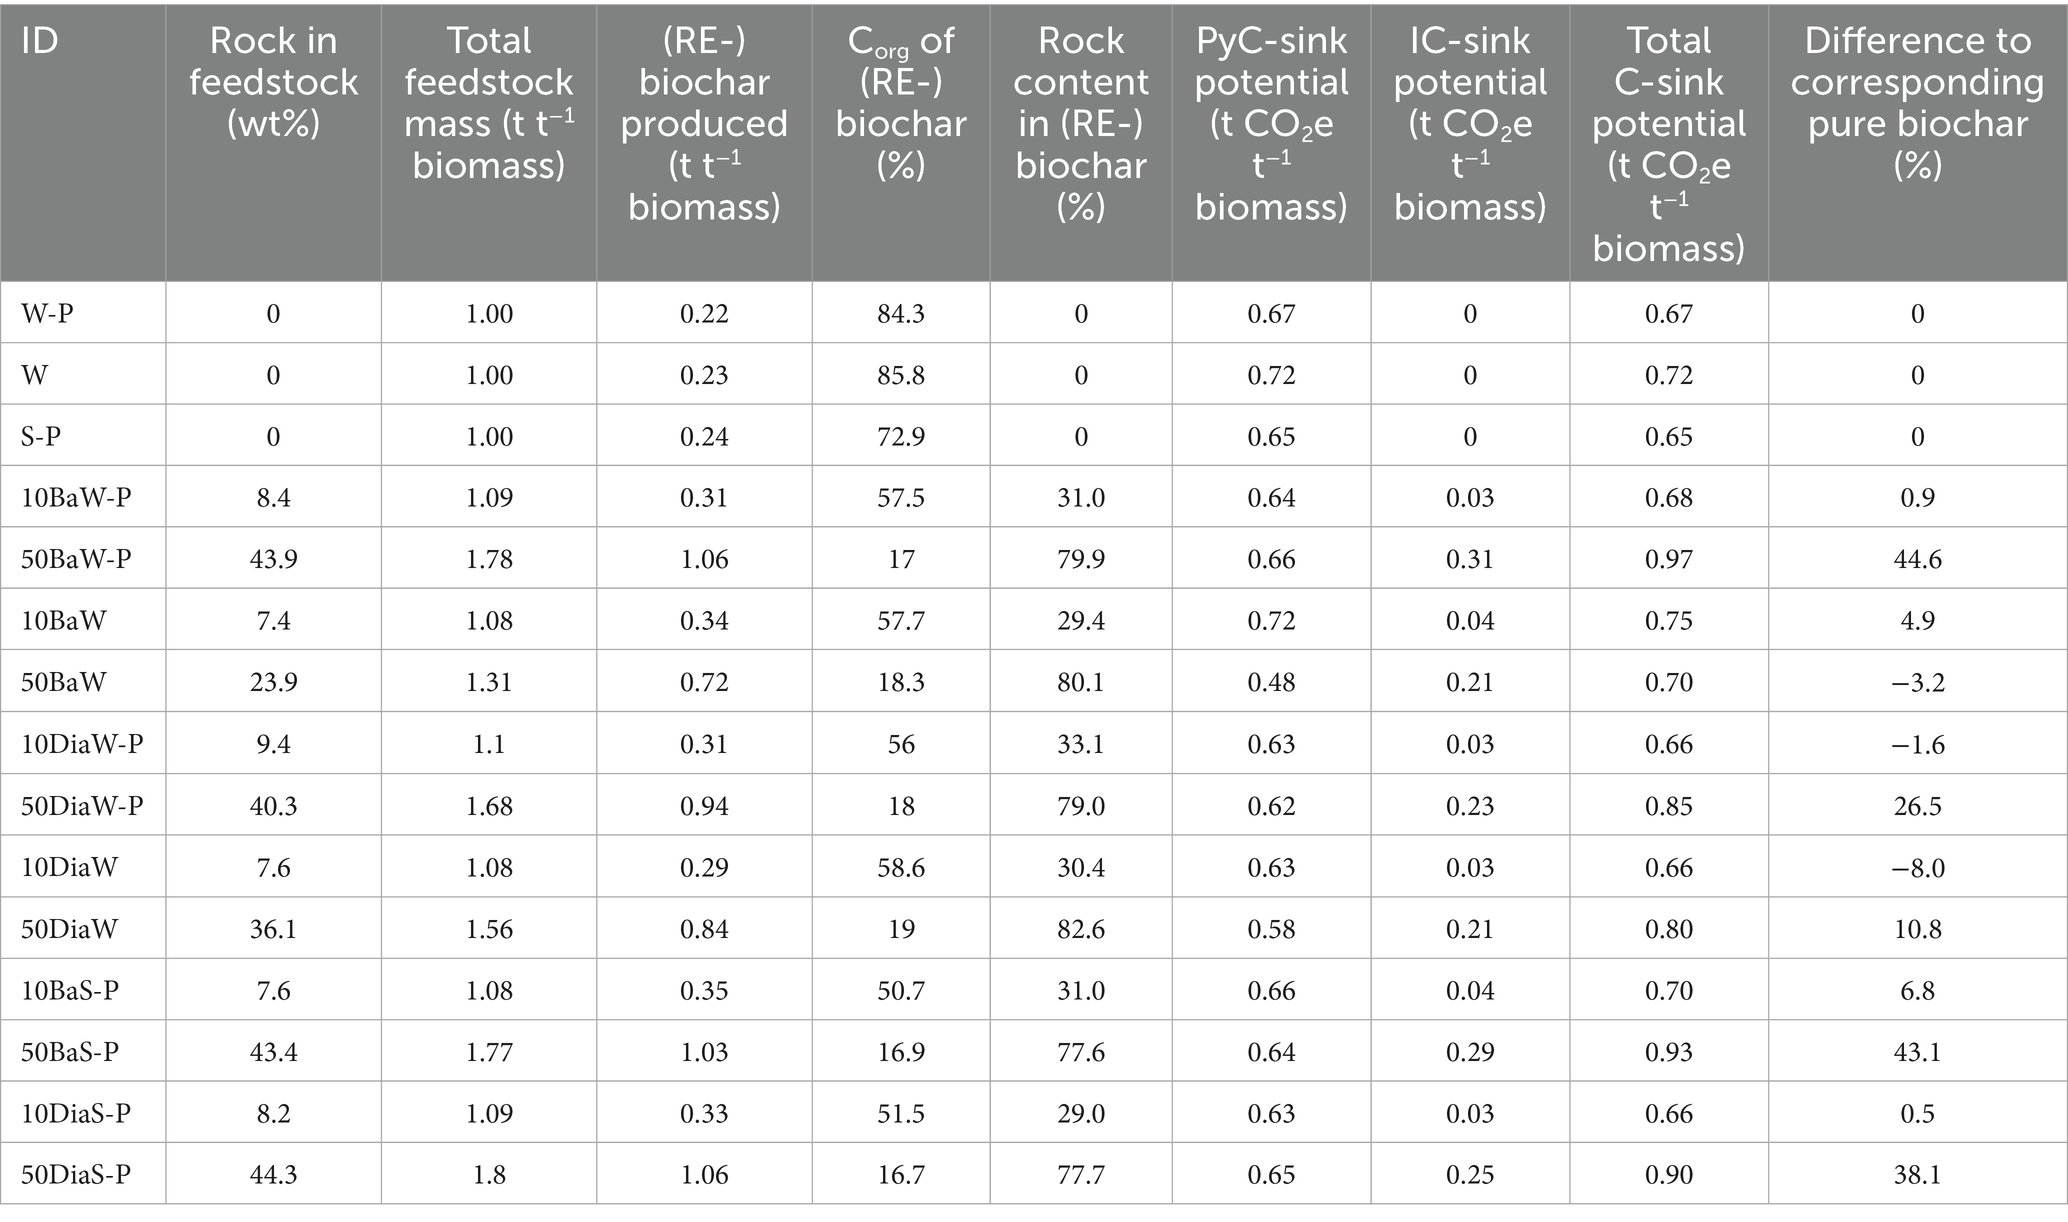
Table 4. Calculated stochiometric carbon sink potentials of biochar and rock-enhanced biochar based on 1 t available biomass (wood or straw) for pyrolysis.
4 Discussion
4.1 Effects of silicate rock powder on biochar carbon yield and speciation
The addition of 10% rock powder did not affect the carbon yield (yc), Corg_daf content or H:Corg ratio of the produced RE-biochar when compared to its pure biochar counterpart. For the addition of 50% rock powder, the yc and Corg_daf content remained likewise unaffected, albeit the H:Corg molar ratio of 50%-RE-biochars increased substantially (Figures 2D–F). Thus, at high application rates, the presence of rock powder during pyrolysis seemed to have affected the pyrolysis process and resulting pyrogenic carbon speciation. Still, the H:Corg molar ratio of these RE-biochars was low compared to other biochars produced in the temperature range of 600–699°C (Ippolito et al., 2020) and typical biochars used in incubation studies (Azzi et al., 2024). All RE-biochars showed a H:Corg molar ratio well below the threshold of 0.7 defining biochar (EBC, 2024). Generally, the H:Corg molar ratio decreases with increasing pyrolysis temperature and severity (Leng and Huang, 2018) due to the preferential volatilization of hydrogen rich compounds. Thus, a relatively higher H:Corg may point towards a less intense pyrolysis (Enders et al., 2012; Hu et al., 2019) due to lower temperature, larger particle size, and/or shorter residence time. However, FTIR analysis suggests that the decomposition of biomass during pyrolysis at 650°C was complete for all (RE-)biochars. Distinct peaks in the bands of 1,020–1,160 cm−1 relating to vibrations of C-O bonds of cellulose and hemicellulose are absent, irrespective of rock powder addition (de la Rosa et al., 2014; Johnston, 2017). However, process intermediates such as heterocyclic and aliphatic carbon species from the condensable fraction (Giudicianni et al., 2021) may have polymerized, forming secondary char with higher H:Corg molar ratio compared to bulk biochar (Anca-Couce et al., 2014). This was supported by the finding of a higher H:Corg molar ratio on the rock-associated fraction in density fractionation. The additional formation of secondary char due to additional surfaces from the rock powder would be expected to increase carbon yield. However, no increase in carbon yield was observed for any RE-biochar (Figures 2A–C). Potentially, antagonistic effects occur simultaneously during co-pyrolysis, affecting pyrolysis and speciation of PyC, however, not the net carbon yield.
Regarding biochar persistence, BCHyPy remained unchanged, as the observed differences are within expected variations (Meredith et al., 2017; Hagemann et al., submitted). Thermal stability increased 10BaW-P (+8% BC1000C) and 10DiaW-P (+9% BC1000C), respectively, pointing towards increased aromaticity or presence of organometallic bonds (Nan et al., 2022), improving the thermal stability of the biochar. For 10BaW-P, this observation corresponds well to a decrease in H:Corg ratio (0.20 to 0.17), which was not observed for 10DiaW-P (0.20 to 0.22). Note that diabase also contained about 1% of hydroxides (Monosubstituted alumina, and ferric oxides, i.e., AFm and spinel-type minerals; Supplementary Table S7), that may have affected the bulk H:Corg ratio. Notably, the FTIR peak intensity at 1580 cm−1 (aromatic C=C, Supplementary Figure S14) did not decrease for 10BaW-P and 10DiaW-P, despite a 25% reduction in Corg content compared to the pure biochar; this hints towards a higher proportion of carbon in aromatic moieties. For RE-biochars with nominal addition of 50% rock powder, both, BC1000C and SEC decreased, pointing towards a lower degree of aromatization (Hagemann et al., submitted), while BCHyPy remained on a high level of >90%. Potentially, high amendment rates of rock powder prevent aromatization reactions that lead to the formation of clusters and of >7 condensed aromatic rings and larger closed planes of condensed aromatic rings. In the following, possible effects of rock-enrichment on the thermal conversion of biomass and resulting speciation of pyrogenic carbon will be discussed.
4.1.1 Catalytic effects of alkali and alkali-earth metals (AAEMs)
The addition of 10 wt% rock powder adds 1.85 and 1.59 wt% AAEMs from basanite and diabase, respectively, while 50% rock powder adds 9.3 and 7.9%. Catalytic effects have been demonstrated with low AAEM additive levels, e.g., >0.73% ∑[Ca, Mg, K] added as wood ash (Grafmüller et al., 2022) or >1 wt% K from potassium acetate (Mašek et al., 2019). However, for catalytic effects to occur, the AAEMs must be reactive and come in contact with pyrolyzing organic compounds (Dalluge et al., 2017), e.g., as substances that melt or decompose during pyrolysis, like sodium acetate decomposing at >324°C (Dalluge et al., 2017; Mašek et al., 2019; GESTIS, 2025). In many silicate rocks, however, AAEMs are mainly covalently bound in crystalline aluminosilicates. When considering only the water-extractable AAEMs in the rock powder, even the addition of 50% basanite resulted in the addition of only 0.03% AAEMs, i.e., one order of magnitude below the effective dose used by Grafmüller et al. (2022) (Supplementary Table S8). Also, the melting point of such igneous silicate rocks, formed from molten rock, is higher than the pyrolysis temperature (650°C). In consequence, we expect most AAEMs to remain enclosed in rock particles during pyrolysis. Thus, AAEMs embedded in aluminosilicate structures show a low catalytic activity, resulting in limited impact of rock powder addition on carbon yield and speciation, even when pelleting provided a good biomass-to-rock contact area.
4.1.2 Modification of the thermal properties of rock-enhanced feedstock
Rock additives have pronouncedly different thermal properties compared to wood or straw. The heat capacity of rock is about threefold lower than that of biomass (literature data summarized in Supplementary Table S13), meaning that less energy is required to heat up the rock material to a given temperature. Further, the thermal conductivity of rock is one order of magnitude higher than that of biomass (Supplementary Table S14), facilitating heat transfer. Combined, these effects of rock enrichment can create heat bridges that increase the heating rate of organic matter adjacent to the rock material, thus likely increasing pyrolysis intensity. At the same time, energy from exothermic biomass decomposition would be distributed faster. Even after initial pyrolysis, the heat capacity of wood and straw based biochar (Huang et al., 2023) and the thermal conductivity of biochar (Patwa et al., 2022), remain below those of basanite and diabase. An increased pyrolysis severity will result in a decreased carbon yield due to enhanced decomposition, while (locally) increasing aromaticity. To the best of our knowledge, the impact of heat capacity and conductivity of biomass on pyrolysis products have not yet been systematically investigated. Kray et al. in preparation, show that the SEC of biochar produced on a PYREKA at 650°C further increased when the residence times were prolonged beyond 15 min. This highlights the potential of an increased heating rate and, thus, higher pyrolysis intensity at constant temperature due to rock-enrichment. Higher pyrolysis intensity would shape RE-biochar properties and carbon speciation when produced at residence times ≤ 15 min, as done in the present study.
4.1.3 Rock powder as surface for the formation of secondary char
Rock particles may provide additional surfaces for the formation of secondary char. It was shown for soot formation that hydrocarbon radicals condense onto an initial particle, triggering chain reactions forming solid substances form gaseous precursors (Johansson et al., 2018). Rock particles likely provide these initial sites and become coated with secondary char. This was confirmed by the density fractionation of RE-biochar (Figure 3), which showed that carbonaceous compounds are physically associated with rock particles and have a higher H:Corg ratio than the lighter, non-rock-associated biochar fraction. Given the distinct differences in the H:Corg ratio, rock particles appeared to be rather coated with secondary char than cross-contaminated with bulk biochar. Typically, (primary-)biochar is less hydrogenated and shows a lower H:Corg ratio than secondary biochar (i.e., soot) (Feng et al., 2021). Carbon was also detected on rock particle surfaces via EDX analysis (Supplementary Figure S3). An increase in SEC of co-pyrolyzed RE-biochar, compared to the SEC of equivalent post-pyrolysis mixtures of pure biochar and rock powder (Supplementary Table S15), further supports the hypothesis of rock particles being coated with (conductive) secondary char during pyrolysis. This could not be observed with particles that were only cross contaminated with carbon from the primary biochar. To the authors’ best knowledge, coating of rock particles with pyrogenic carbon is a novel observation, not yet investigated. Further research is needed to determine whether secondary char coating (probably non-polar and hydrophobic) reduces rock weathering rates due to surface inertization. The surface coating of basaltic glass and dolerite with precipitated calcite (polar compound), as observed during a batch weathering experiment by Stockmann et al. (2011, 2013), had proven to be sufficiently porous (or discrete crystalline) and did not affect the dissolution kinetics of the materials studied by Stockmann et al. (2011, 2013).
Potential adverse effects of the pyrogenic coating, regarding rock weathering rates, may also be counteracted by the thermal treatment of the rock powder during co-pyrolysis and WHC of adjacent biochar. Thermal treatment showed the potential to increase weathering rates as observed in other studies using serpentine minerals, which also comprised 6% of the here employed diabase (Supplementary Table S7; Gerdemann et al., 2007; Kelemen et al., 2011). Also, the close association of rock to the wet bulk biochar can increase the availability of water to weathering processes, especially as the RE-biochars still showed WHC in the same range as biochars obtained from pure biomass. However, the leaching experiments conducted here were too short and dominated by the dissolution of the biogenic ash to answer these questions. Leaching experiments of 6–12-month duration may provide for a disentanglement of biogenic and geogenic elemental fluxes. Follow-up experiments should systematically investigate how secondary char coating affects the dissolution kinetics of silicate rock and thus CDR from enhanced rock weathering.
4.1.4 Rock addition altered feedstock pellet properties and RE-biochar porosity
The formation of secondary char depends on the retention time of (intermediate) gaseous pyrolysis products in the particle. Increased retention time increases the chance of polymerization of these gases into secondary char (Anca-Couce et al., 2014). The addition of mineral additives can increase the retention time of the pyrolysis gases by enveloping or encapsulating biomass. However, for this purpose, the mineral is applied in very high doses (sometimes >50% of the total mass of the feedstock) and in dissolved form (Rosas et al., 2009) as suspended nanoparticles (Zhao et al., 2019), or a combination of dissolved and suspended matter (Rawal et al., 2016) and then dried, so that the formation of an (almost) gas-tight shell is plausible. Such an effect has not yet been demonstrated for rock powder and seems unlikely. Still, 10BaW-P showed a much lower SSA than expected (37 vs. 137 m2 g−1) and 60% less pore volume than W-P (0.04 vs. 0.1 cm3 g−1), whereas in non-pelletized RE-biochars (Figure 8C), the SSA was at the expected level; however, pelleting barely affected biochar SSA (197 vs. 185 m2 g−1 for W-P and P, respectively). This does not necessarily mean that rock dust always has a direct influence due to pore clogging. Rock dust may also indirectly affect the pelleting and the properties of the pellets as shown for additives used in industrial pelleting, such as dolomite (Tarasov et al., 2013).
Generally, pelleting technology was found to have a strong effect on particle density. The feedstock for the 1st and 2nd RE-biochar batch were pelletized on different presses (section 2.1). In the 2nd batch, feedstock and RE-biochar bulk densities increased by approximately 100% compared to first batch made with a different press (selected treatments Figures 1A,B; Table 2), resulting in similar H:Corg ratios between W-P, 10BaW-P and 50BaW-P, i.e., not repeating the increase of H:Corg in 50BaW-P from the 1st batch (Figure 2). Also, rock-enrichment led to an increased particle density (Figures 1C–E), however, not beyond expected particle densities. These observations point out that, at the given application rates, rock powder did not affect the pelleting process in a manner that increased the density of the pellets’ biogenic fraction (e.g., due to increased friction/ pressure/ matrices temperature) but only increased the total particle density due to rock powder incorporation between and around biogenic particles. It is unlikely that this phenomenon leads to a complete and airtight closure of pores, and has, thus, a limited effect on vapor retention times.
Repolymerization of secondary char may lead to the closing of micropores (< 2 nm; c.f. Figures 7D–F). According to their stoichiometry (Giudicianni et al., 2021), secondary char and condensates would both contribute to an elevated H:Corg ratio of the RE-biochar. A strong reduction in pore volume was observed for most RE-biochars and includes a complete closure of the micropore volume in 50Ba- and 50Dia- RE-biochars. This corresponds to an increase in H:Corg for 50Ba- and 50Dia- RE-biochars. The total pore volume of the RE-biochar from feedstock with 10% diabase (10DiaW-P, 10DiaS-P) was less affected, and the H:Corg ratios remained at a similar level as in pure biochar. This suggests that a nominal addition of 10% fine diabase may not modify vapor retention times as basanite does; it could be explained by diabase’s high calcite content (22% CaCO₃), which partially (29%) disintegrates during co-pyrolysis at 650°C, as shown by the TGA analysis of pure rock powder (Supplementary Figure S2). Partial obstruction of pores and consecutive formation of secondary char are not exhaustive explanations for elevated H:Corg ratios. For example, in the non-pelletized mixtures (10BaW, 50BaW, 10DiaW, 50DiaW), no decrease in SSA and pore volume beyond expected dilution effects was measured, albeit a pronounced increase in H:Corg and a decrease in thermal stability occurred for 50BaW and 50DiaW, which cannot be fully explained. Further research should also focus on the effects that altered thermal properties (section 4.1.2) may have on pyrolysis intensity and thus on H:Corg, HyPy, SEC, and BC1000C, also how changes in porosity affect nitrate capture and nitrous oxide emission reductions in soils (Borchard et al., 2019; Kammann et al., 2015).
4.1.5 C-sink potential: options to improve the effects of silicate rock powder on carbon yield
Co-pyrolysis did not lead to synergistic effects altering the measured yc and thus the exploited biogenic C-Sink potential. In the present study, only additive effects could be observed. The addition of rock powder (IC-Sink potential: 0.36–0.43 t CO2e t rock−1) to biochar (PyC-Sink potential: 2.67–3.09 t CO2e t biochar−1) led to a proportional decrease in the total C-sink potential when calculated per unit mass of RE-biochar produced (cf. Table 3). However, when the calculation is reframed from the perspective of available biomass (cf. Table 4), the additive contribution of the IC-sink potential increases the total C-sink potential.
Albeit, the limited influence of rock powder addition on yC, as observed in the present study, could be increased to a relevant level. Wet impregnation, prolonged incubation, or ultrasonic immersion (Guo et al., 2012) of biomass with rock powder could mobilize AAEM beyond the water dissolvable fraction quantified in the present study. The use of phyllosilicates, which show lower contents of AAEMs but larger surface areas (Liu et al., 2020; Lu et al., 2020; Buss et al., 2024), may support the formation of more secondary char by particle coating. Moreover, the densification of blended feedstocks could increase the retention time of volatiles in the solid matrix to promote the formation of secondary char (Anca-Couce et al., 2014). Thus, the impact of feedstock pelleting and densification on the carbon yield and biochar properties needs to be further investigated, both in the presence and absence of rock powder.
4.2 Conversion of carbonates
At higher temperatures, carbonates are converted to oxides (calcination). This was observed by Kwon et al. (2018) in co-pyrolysis of sewage sludge and calcium carbonate (CaCO3) at >625°C. Still, diabase-based RE-biochars contain geogenic carbonate (22.1 wt-%), as they show a higher content of total inorganic carbon (TIC) compared to all other (RE-)biochars and calcination is not expected to be completed for temperatures <1,000°C. Expected values for TIC content of RE-biochars based on the carbonate content of the rock after thermal treatment at 650°C and TIC content of biochar from pure biomass largely matched with measured values (Supplementary Table S16). We, therefore, assume the release of CO2 from calcination during co-pyrolysis of carbonate-rich rock and the formation of CaO and/or MgO. These oxides could also absorb atmospheric CO2 when biochar is applied to soil (Ca/MgO(s) + CO2 → Ca/MgCO3(s)), which could make this effect climate-neutral overall, however, this needs to be verified. Unless verified, the release of CO2 from calcination of carbonate-bearing rock during pyrolysis would need to be considered an emission of fossil carbon in a RE-biochar life-cycle assessment.
4.3 Rock-enhanced biochar: higher content of major and trace elements
Compared to pure biochar, RE-biochar exhibited a higher content of most of the essential (P, K, Mg, Ca) and beneficial (Si) plant nutrients, largely because the rock powders contained these elements in greater concentrations than the biomass (Supplementary Table S7; Buss et al., 2022), except for P, due to the latter’s low concentration in the rocks (Table 2). The magnitude of short-term K release (6-week leaching) is governed by the amendment’s biochar content, while Ca, Mg, and Na release clearly increased for RE-biochars. The release of geogenic macronutrients was also observed and suggested by other studies (Amann et al., 2020; Swoboda et al., 2022; Vorrath et al., 2025). However, most of the released elements during the 6-week leaching experiment likely originated from biochar ash, as elemental release from rock is much lower in general (Vorrath et al., 2025). To specifically quantify geogenic nutrient release, longer experiments and/or water/acid washing of RE-biochar prior to the leaching experiment would be needed to remove swiftly soluble, biogenic ash. The availability of rock-derived nutrients depends on weathering rates, making RE-biochar a slow-release fertilizer.
The addition of rock powder can also increase the content of potentially toxic trace elements (“heavy metals”) in RE-biochar. The RE-biochars produced here remained within applicable limit values of the EU fertilizer product ordinance, e.g., for Zinc (<800 mg kg−1) and Copper (<300 mg kg−1), however partly challenge limit values for Nickel (<100 mg kg−1) (EU 2019/1009), while pure biochars had considerably lower trace element contents. Biochars generally show low availability of trace elements compared to biomass feedstocks (Rathnayake et al., 2023). Geogenic trace metals are released along the weathering process of the rock fraction, as observed for Ni and Cr in mesocosm experiments by Amann et al. (2020). However, simultaneous biochar addition to soil may reduce the uptake of trace elements by plants (Peng et al., 2018). Rock enhancement opens an avenue to produce micronutrient fertilizers, yet attention must be paid to trace metal loads when selecting rocks.
4.4 Rock-enhanced biochar: increased pH and liming potential
Rock-enhanced biochars showed higher pH values than pure biochars. However, these values are still comparable to the pH of other biochars produced at similar temperatures, including those with high ash contents (> 20%) (Ippolito et al., 2020). Biochar raises soil pH through protonation, and the release of its alkaline ash fraction, but the latter effect is short-lived due to the high solubility and leaching of biochar ash (Kong et al., 2014; Smider and Singh, 2014; Xiao et al., 2020). This is mirrored in sharp decreases of initially high EC and high pH within the first two weeks of the (non-buffered) leaching experiment, observed for both biochar and RE-biochars with high biogenic content (Figure 7). Leached loads of cations will likely differ in real soils, which show biological activity that can accelerate weathering, but also show greater cation exchange capacities which can delay leaching (Paessler, 2022; te Pas et al., 2024). Rock powder and RE-biochar with high rock content bear the potential to stimulate slower but long-lasting pH elevation (Swoboda et al., 2022; Van Der Bauwhede et al., 2024).
The total liming potential of a material is given as CaO equivalents (CaOeq = sum of basic compounds, Table 2), and relates to the potential of neutralizing hydronium ions (H+ in solution). Industrial quicklime, commonly used in agriculture, serves as the reference (100% CaO). The liming potential of RE-biochar increases by >50% for 50% nominal rock powder addition compared to pure biochar (Table 2). Thus, 5–10 t RE-biochar may replace 1 t of quicklime, abating 1.0–1.2 t CO2 emissions from quicklime production (Wu et al., 2023). However, this effect could also be achieved by the direct application of rock powder with an equivalent liming potential; co-pyrolysis does not in itself add any value here. The realization of the complete (stochiometric) liming potential will not only depend on the liming potential of the biochar (Murtaza et al., 2024; Van Zwieten et al., 2010) and swiftly available carbonates, but also on the silicate rock weathering rate. Thus, silicate rock powder induced pH adjustments will be slower compared to those of quicklime soil application. The liming potentials of RE-biochars are not totally achieved before the rock is fully weathered or retarded/prevented if basic compounds are retained in secondary minerals.
5 Conclusion
Production of rock-enhanced biochar and its agronomic application was suggested as an avenue for the co-deployment of PyCCS and enhanced rock weathering as CDR methods with potential synergies regarding carbon yield and biochar persistence. This study provided context to the material production, product properties and CDR potential, including the release of CDR relevant cations using fast leaching experiments. The following main findings add information for the applicability evaluation of the proposed method. We demonstrated (a) the general feasibility of co-pyrolysis of biomass with silicate rock powder, (b) confirmed the pyrogenic coating of rock particles, and (c) highlighted the impact of pellet physical properties on biochar and RE-biochar characteristics, which needs further systematic investigation. The present study could not confirm effects from co-pyrolysis, increasing the fixed carbon yield. At large, no adverse effects of rock powder addition on biochar properties were identified, yet the changes in thermal stability, especially of straw biochars, could not be explained. Pyrogenic coating of the minerals is an interesting effect that could be used to increase carbon yield and create functional materials for uses beyond soils (sorbents, construction material, etc.).
Based on the physicochemical properties of RE-biochar, we could not identify an advantage of co-pyrolysis over the co-application of rock powder and biochar. Effects on weathering and plant growth still need to be investigated in appropriate experimental setups, such as long-term leaching experiments assessing alkalinity production and agronomic field trials. However, co-pyrolysis can have practical advantages, as it increases the bulk density of the biochar, which can make it easier to spread with a fertilizer spreader. Furthermore, co-pyrolysis after pelleting allows the use of very fine rock powder, which is, for example, a by-product of rock cutting and crushing that does not have to be deliberately ground, yet its particle size hampers direct soil application due to dust formation. Beyond their agricultural use, RE- biochars are interesting materials that offer a wide range of applications, be it the basic component of agricultural CDR-fertilizer blends, or industrial applications which should be investigated in more detail.
Data availability statement
The original contributions presented in the study are included in the article/Supplementary material, further inquiries can be directed to the corresponding authors.
Author contributions
JoM: Conceptualization, Data curation, Formal analysis, Investigation, Methodology, Visualization, Writing – original draft. M-EV: Investigation, Writing – review & editing. TA: Investigation, Methodology, Project administration, Writing – review & editing. JH: Conceptualization, Funding acquisition, Resources, Writing – review & editing. JR: Investigation, Resources, Writing – review & editing. JeM: Investigation, Resources, Writing – review & editing. SP-D: Investigation, Writing – review & editing. WM: Investigation, Writing – review & editing. CU: Investigation, Writing – review & editing. CS: Resources, Writing – review & editing. CK: Conceptualization, Funding acquisition, Writing – review & editing. H-PS: Conceptualization, Funding acquisition, Writing – review & editing. NH: Conceptualization, Funding acquisition, Methodology, Supervision, Writing – review & editing.
Funding
The author(s) declare that financial support was received for the research and/or publication of this article. This study was financed by the Federal Ministry of Research, Technology and Space (BMFTR) of the Federal Republic of Germany, grant numbers 01LS2109C and 01LS2109A (PyMiCCS) as part of the CDRterra research program (2022–2025). Open access funding by Agroscope.
Acknowledgments
We appreciate the support in material characterization by the Eurofins Umwelt Ost GmbH laboratories, the department of geosciences at the university of Tübingen, Germany and by the institute for process engineering at the Offenburg university of applied sciences, Germany.
Conflict of interest
The authors declare that the research was conducted in the absence of any commercial or financial relationships that could be construed as a potential conflict of interest.
The author(s) declared that they were an editorial board member of Frontiers, at the time of submission. This had no impact on the peer review process and the final decision.
Generative AI statement
The author(s) declare that no Gen AI was used in the creation of this manuscript.
Publisher’s note
All claims expressed in this article are solely those of the authors and do not necessarily represent those of their affiliated organizations, or those of the publisher, the editors and the reviewers. Any product that may be evaluated in this article, or claim that may be made by its manufacturer, is not guaranteed or endorsed by the publisher.
Supplementary material
The Supplementary material for this article can be found online at: https://www.frontiersin.org/articles/10.3389/fclim.2025.1631368/full#supplementary-material
References
Amann, T., and Hartmann, J. (2019). Ideas and perspectives: synergies from co-deployment of negative emission technologies. Biogeosciences 16, 2949–2960. doi: 10.5194/BG-16-2949-2019
Amann, T., Hartmann, J., Hellmann, R., Pedrosa, E. T., and Malik, A. (2022). Enhanced weathering potentials—the role of in situ CO2 and grain size distribution. Front. Clim. 4:929268. doi: 10.3389/FCLIM.2022.929268
Amann, T., Hartmann, J., Struyf, E., De Oliveira Garcia, W., Fischer, E. K., Janssens, I., et al. (2020). Enhanced weathering and related element fluxes—a cropland mesocosm approach. Biogeosciences 17, 103–119. doi: 10.5194/BG-17-103-2020
Anca-Couce, A., Mehrabian, R., Scharler, R., and Obernberger, I. (2014). Kinetic scheme of biomass pyrolysis considering secondary charring reactions. Energy Convers. Manag. 87, 687–696. doi: 10.1016/J.ENCONMAN.2014.07.061
Azeem, M., Raza, S., Li, G., Smith, P., and Zhu, Y. G. (2022). Soil inorganic carbon sequestration through alkalinity regeneration using biologically induced weathering of rock powder and biochar. Soil Ecol. Lett. 4, 293–306. doi: 10.1007/S42832-022-0136-4
Azzi, E. S., Li, H., Cederlund, H., Karltun, E., and Sundberg, C. (2024). Modelling biochar long-term carbon storage in soil with harmonized analysis of decomposition data. Geoderma 441:116761. doi: 10.1016/J.GEODERMA.2023.116761
Beerling, D. J., Epihov, D. Z., Kantola, I. B., Masters, M. D., Reershemius, T., Planavsky, N. J., et al. (2024). Enhanced weathering in the US corn belt delivers carbon removal with agronomic benefits. Proc. Natl. Acad. Sci. USA 121:e2319436121. doi: 10.1073/PNAS.2319436121
Beerling, D. J., Kantzas, E. P., Lomas, M. R., Wade, P., Eufrasio, R. M., Renforth, P., et al. (2020). Potential for large-scale CO2 removal via enhanced rock weathering with croplands. Nature 583, 242–248. doi: 10.1038/s41586-020-2448-9
Borchard, N., Schirrmann, M., Cayuela, M. L., Kammann, C., Wrage-Mönnig, N., Estavillo, J. M., et al. (2019). Biochar, soil and land-use interactions that reduce nitrate leaching and N2O emissions: a meta-analysis. Sci. Total Environ. 651, 2354–2364. doi: 10.1016/J.SCITOTENV.2018.10.060
Buss, W., Bogush, A., Ignatyev, K., and Mašek, O. (2020). Unlocking the fertilizer potential of waste-derived biochar. ACS Sustain. Chem. Eng. 8, 12295–12303. doi: 10.1021/ACSSUSCHEMENG.0C04336
Buss, W., Hasemer, H., Ferguson, S., and Borevitz, J. (2023). Stabilisation of soil organic matter with rock dust partially counteracted by plants. Glob. Change Biol. 30:543347. doi: 10.1111/gcb.17052
Buss, W., Hasemer, H., Sokol, N. W., Rohling, E. J., and Borevitz, J. (2024). Applying minerals to soil to draw down atmospheric carbon dioxide through synergistic organic and inorganic pathways. Commun. Earth Environ. 5, 1–11. doi: 10.1038/s43247-024-01771-3
Buss, W., Jansson, S., Wurzer, C., and Mašek, O. (2019). Synergies between BECCS and biochar—maximizing carbon sequestration potential by recycling wood ash. ACS Sustain. Chem. Eng. 7, 4204–4209. doi: 10.1021/ACSSUSCHEMENG.8B05871
Buss, W., Wurzer, C., Manning, D. A. C., Rohling, E. J., Borevitz, J., and Mašek, O. (2022). Mineral-enriched biochar delivers enhanced nutrient recovery and carbon dioxide removal. Commun. Earth Environ. 3, 1–11. doi: 10.1038/s43247-022-00394-w
Chikamatsu, T., Shahiduzzaman, M., Yamamoto, K., Karakawa, M., Kuwabara, T., Takahashi, K., et al. (2018). Identifying molecular orientation in a bulk heterojunction film by infrared reflection absorption spectroscopy. ACS Omega 3, 5678–5684. doi: 10.1021/ACSOMEGA.8B00099
Chung, Y. S., Lee, U., Heo, S., Silva, R. R., Na, C. I., and Kim, Y. (2020). Image-based machine learning characterizes root nodule in soybean exposed to silicon. Front. Plant Sci. 11. doi: 10.3389/FPLS.2020.520161
Corbett, T. D. W., Westholm, M., Rosling, A., Calogiuri, T., Poetra, R., Niron, H., et al. (2024). Organic carbon source controlled microbial olivine dissolution in small-scale flow-through bioreactors, for CO2 removal. NPJ Mat. Degrad. 8, 1–13. doi: 10.1038/s41529-024-00454-w
Dalluge, D. L., Kim, K. H., and Brown, R. C. (2017). The influence of alkali and alkaline earth metals on char and volatile aromatics from fast pyrolysis of lignin. J. Anal. Appl. Pyrolysis 127, 385–393. doi: 10.1016/J.JAAP.2017.07.011
de la Rosa, J. M., Paneque, M., Miller, A. Z., and Knicker, H. (2014). Relating physical and chemical properties of four different biochars and their application rate to biomass production of Lolium perenne on a calcic Cambisol during a pot experiment of 79 days. Sci. Total Environ. 499, 175–184. doi: 10.1016/J.SCITOTENV.2014.08.025
Di Blasi, C., Galgano, A., and Branca, C. (2009). Influences of the chemical state of alkaline compounds and the nature of alkali metal on wood pyrolysis. Ind. Eng. Chem. Res. 48, 3359–3369. doi: 10.1021/IE801468Y
Dieguez-Alonso, A., Anca-Couce, A., Frišták, V., Moreno-Jiménez, E., Bacher, M., Bucheli, T. D., et al. (2019). Designing biochar properties through the blending of biomass feedstock with metals: impact on oxyanions adsorption behavior. Chemosphere 214, 743–753. doi: 10.1016/J.CHEMOSPHERE.2018.09.091
EBC. (2024). European biochar certificate—guidelines for a sustainable production of biochar. Ithaka Institute, Arbaz, Switzerland., Version 10.4G of 21st December 2024. Available online at: http://www.european-biochar.org
Enders, A., Hanley, K., Whitman, T., Joseph, S., and Lehmann, J. (2012). Characterization of biochars to evaluate recalcitrance and agronomic performance. Bioresour. Technol. 114, 644–653. doi: 10.1016/J.BIORTECH.2012.03.022
Feng, D., Guo, D., Shang, Q., Zhao, Y., Zhang, L., Guo, X., et al. (2021). Mechanism of biochar-gas-tar-soot formation during pyrolysis of different biomass feedstocks: effect of inherent metal species. Fuel 293:120409. doi: 10.1016/J.FUEL.2021.120409
Gerdemann, S. J., O’Connor, W. K., Dahlin, D. C., Penner, L. R., and Rush, H. (2007). Ex situ aqueous mineral carbonation. Environ. Sci. Technol. 41, 2587–2593. doi: 10.1021/ES0619253
GESTIS. (2025). Sodium acetate. GESTIS Stoffdatenbank. Available online at: https://gestis.dguv.de/data?name=010760
Giudicianni, P., Gargiulo, V., Grottola, C. M., Alfè, M., Ferreiro, A. I., Mendes, M. A. A., et al. (2021). Inherent metal elements in biomass pyrolysis: a review. Energy Fuel 35, 5407–5478. doi: 10.1021/ACS.ENERGYFUELS.0C04046
Global Biochar C-Sink. (2024). Global biochar C-sink. Ithaka Institute, Arbaz, Switzerland. Version 3. Available online at: http://carbon-standards.com
Grafmüller, J., Böhm, A., Zhuang, Y., Spahr, S., Müller, P., Otto, T. N., et al. (2022). Wood ash as an additive in biomass pyrolysis: effects on biochar yield, properties, and agricultural performance. ACS Sustain. Chem. Eng. 10, 2720–2729. doi: 10.1021/ACSSUSCHEMENG.1C07694
Guo, Y., Tan, C., Sun, J., Li, W., Zhang, J., and Zhao, C. (2020). Biomass ash stabilized MgO adsorbents for CO2 capture application. Fuel 259:116298. doi: 10.1016/J.FUEL.2019.116298
Guo, D., Wu, S., Liu, B., Yin, X., and Yang, Q. (2012). Catalytic effects of NaOH and Na2CO3 additives on alkali lignin pyrolysis and gasification. Appl. Energy 95, 22–30. doi: 10.1016/J.APENERGY.2012.01.042
Hagemann, N., Schmidt, H.-P., Bucheli, T. D., Grafmüller, J., Vosswinkel, S., Herdegen, V., et al. (submitted). Proxies for use in biochar decay models: hydropyrolysis, electric conductivity, and H/Corg molar ratio. J. Anal. Appl. Pyrolysis.
Hagemann, N., Schmidt, H. P., Kägi, R., Böhler, M., Sigmund, G., Maccagnan, A., et al. (2020). Wood-based activated biochar to eliminate organic micropollutants from biologically treated wastewater. Sci. Total Environ. 730:138417. doi: 10.1016/J.SCITOTENV.2020.138417
Hagemann, N., Subdiaga, E., Orsetti, S., de la Rosa, J. M., Knicker, H., Schmidt, H. P., et al. (2018). Effect of biochar amendment on compost organic matter composition following aerobic composting of manure. Sci. Total Environ. 613-614, 20–29. doi: 10.1016/J.SCITOTENV.2017.08.161
Hagens, M., Hartmann, J., Vicca, S., and Beerling, D. J. (2023). Editorial: enhanced weathering and synergistic combinations with other CDR methods. Front. Clim. 5:1244396. doi: 10.3389/FCLIM.2023.1244396
Haque, F., Santos, R. M., Dutta, A., Thimmanagari, M., and Chiang, Y. W. (2019). Co-benefits of Wollastonite weathering in agriculture: CO2 sequestration and promoted plant growth. ACS Omega 4, 1425–1433. doi: 10.1021/ACSOMEGA.8B02477
Hartmann, J., West, A. J., Renforth, P., Köhler, P., De La Rocha, C. L., Wolf-Gladrow, D. A., et al. (2013). Enhanced chemical weathering as a geoengineering strategy to reduce atmospheric carbon dioxide, supply nutrients, and mitigate ocean acidification. Rev. Geophys. 51, 113–149. doi: 10.1002/ROG.20004
Haynes, R. J. (2014). A contemporary overview of silicon availability in agricultural soils. J. Plant Nutr. Soil Sci. 177, 831–844. doi: 10.1002/JPLN.201400202
Honvault, N., Tiouchichine, M. L., Sauze, J., Piel, C., Landais, D., Devidal, S., et al. (2024). Additive effects of basalt enhanced weathering and biochar co-application on carbon sequestration, soil nutrient status and plant performance in a mesocosm experiment. Appl. Geochem. 169:106054. doi: 10.1016/J.APGEOCHEM.2024.106054
Howell, A., Helmkamp, S., and Belmont, E. (2022). Stable polycyclic aromatic carbon (SPAC) formation in wildfire chars and engineered biochars. Sci. Total Environ. 849:157610. doi: 10.1016/J.SCITOTENV.2022.157610
Hu, X., Guo, H., Gholizadeh, M., Sattari, B., and Liu, Q. (2019). Pyrolysis of different wood species: impacts of C/H ratio in feedstock on distribution of pyrolysis products. Biomass Bioenergy 120, 28–39. doi: 10.1016/J.BIOMBIOE.2018.10.021
Huang, D., Wang, Y., Song, G., Hu, S., Li, H., Zhang, Y., et al. (2023). Study on thermal properties of bio-char prepared by photo-thermal pyrolysis. Biomass Bioenergy 178:106969. doi: 10.1016/J.BIOMBIOE.2023.106969
IPCC (2018). “Summary for policymakers” in Global warming of 1.5°C. eds. Masson-Delmotte, V., P. Zhai, H.-O. Pörtner, D. Roberts, J. Skea, P. R. and Shukla, A An IPCC special report on the impacts of global warming of 1.5°C above pre-industrial levels and related global greenhouse gas emission pathways. Cambridge, UK and New York, NY, USA: Cambridge University Press. doi: 10.1017/9781009157940.001.Q23
IPCC (2023). Climate change 2023: Synthesis report. Contribution of working groups I, II and III to the sixth assessment report of the intergovernmental panel on climate change. Geneva, Switzerland: IPCC, 184.
Ippolito, J. A., Cui, L., Kammann, C., Wrage-Mönnig, N., Estavillo, J. M., Fuertes-Mendizabal, T., et al. (2020). Feedstock choice, pyrolysis temperature and type influence biochar characteristics: a comprehensive meta-data analysis review. Biochar 2, 421–438. doi: 10.1007/S42773-020-00067-X
Janssens, I. A., Roobroeck, D., Sardans, J., Obersteiner, M., Peñuelas, J., Richter, A., et al. (2022). Negative erosion and negative emissions: combining multiple land-based carbon dioxide removal techniques to rebuild fertile topsoils and enhance food production. Front. Clim. 4:928403. doi: 10.3389/FCLIM.2022.928403
Johansson, K. O., Head-Gordon, M. P., Schrader, P. E., Wilson, K. R., and Michelsen, H. A. (2018). Resonance-stabilized hydrocarbon-radical chain reactions may explain soot inception and growth. Science 361, 997–1000. doi: 10.1126/SCIENCE.AAT3417
Johnston, C. T. (2017). “Biochar analysis by Fourier-transform infra-red spectroscopy” in Biochar: A guide to analytical methods. eds. B. Singh, M. Camps-Arbestain, and J. Lehmann, vol. 34. Boca Raton, FL: CRC Press/Taylor and Francis Group. 163–164.
Joka Yildiz, M., Wurzer, C., Robinson, T., Wietecha, J., and Mašek, O. (2025). Biochar from pellets: influence of binders and pyrolysis temperature on physical properties of pyrolyzed pellets. Sustain. Mater. Technol. 43:e01327. doi: 10.1016/J.SUSMAT.2025.E01327
Jones, D. L., Cross, P., Withers, P. J. A., Deluca, T. H., Robinson, D. A., Quilliam, R. S., et al. (2013). Review: nutrient stripping: the global disparity between food security and soil nutrient stocks. J. Appl. Ecol. 50, 851–862. doi: 10.1111/1365-2664.12089
Joseph, S., Cowie, A. L., Van Zwieten, L., Bolan, N., Budai, A., Buss, W., et al. (2021). How biochar works, and when it doesn’t: a review of mechanisms controlling soil and plant responses to biochar. GCB Bioenergy 13, 1731–1764. doi: 10.1111/GCBB.12885
Kammann, C. I., Schmidt, H. P., Messerschmidt, N., Linsel, S., Steffens, D., Müller, C., et al. (2015). Plant growth improvement mediated by nitrate capture in co-composted biochar. Sci. Rep. 5, 1–13. doi: 10.1038/srep11080
Kelemen, P. B., Matter, J., Streit, E. E., Rudge, J. F., Curry, W. B., and Blusztajn, J. (2011). Rates and mechanisms of mineral carbonation in peridotite: natural processes and recipes for enhanced, in situ CO2 capture and storage. Annu. Rev. Earth Planet. Sci. 39, 545–576. doi: 10.1146/ANNUREV-EARTH-092010-152509
Kong, Z., Liaw, S. B., Gao, X., Yu, Y., and Wu, H. (2014). Leaching characteristics of inherent inorganic nutrients in biochars from the slow and fast pyrolysis of mallee biomass. Fuel 128, 433–441. doi: 10.1016/J.FUEL.2014.03.025
Kray, D., Bucheli, T. D., Grafmüller, Jannis, Schmidt, H. P., and Hagemann, N. (in preparation). Understanding slow pyrolysis: the relationships of pyrolysis process parameters and biochar characteristics in a continuous auger screw reactor.
Kwon, E. E., Lee, T., Ok, Y. S., Tsang, D. C. W., Park, C., and Lee, J. (2018). Effects of calcium carbonate on pyrolysis of sewage sludge. Energy 153, 726–731. doi: 10.1016/J.ENERGY.2018.04.100
Leng, L., and Huang, H. (2018). An overview of the effect of pyrolysis process parameters on biochar stability. Bioresour. Technol. 270, 627–642. doi: 10.1016/J.BIORTECH.2018.09.030
Lewis, A. L., Sarkar, B., Wade, P., Kemp, S. J., Hodson, M. E., Taylor, L. L., et al. (2021). Effects of mineralogy, chemistry and physical properties of basalts on carbon capture potential and plant-nutrient element release via enhanced weathering. Appl. Geochem. 132:105023. doi: 10.1016/J.APGEOCHEM.2021.105023
Liu, Y., Gao, C., Wang, Y., He, L., Lu, H., and Yang, S. (2020). Vermiculite modification increases carbon retention and stability of rice straw biochar at different carbonization temperatures. J. Clean. Prod. 254:120111. doi: 10.1016/J.JCLEPRO.2020.120111
Lu, J., Yang, Y., Liu, P., Li, Y., Huang, F., Zeng, L., et al. (2020). Iron-montmorillonite treated corn straw biochar: interfacial chemical behavior and stability. Sci. Total Environ. 708:134773. doi: 10.1016/J.SCITOTENV.2019.134773
Mašek, O., Buss, W., Brownsort, P., Rovere, M., Tagliaferro, A., Zhao, L., et al. (2019). Potassium doping increases biochar carbon sequestration potential by 45%, facilitating decoupling of carbon sequestration from soil improvement. Sci. Rep. 9, 5514–5518. doi: 10.1038/s41598-019-41953-0
Meng, F., Wang, D., and Zhang, M. (2021). Effect of ultrasonic vibration-assisted pelleting of biomass on biochar properties. J. Clean. Prod. 279:123900. doi: 10.1016/J.JCLEPRO.2020.123900
Meredith, W., Ascough, P. L., Bird, M. I., Large, D. J., Snape, C. E., Sun, Y., et al. (2012). Assessment of hydropyrolysis as a method for the quantification of black carbon using standard reference materials. Geochim. Cosmochim. Acta 97, 131–147. doi: 10.1016/J.GCA.2012.08.037
Meredith, W., McBeath, A., Ascough, P., and Bird, M. (2017). “Analysis of biochars by hydropyrolysis” in Biochar: a guide to analytical methods: aguide to analytical methods. eds. B. Singh, M. Camps-Arbestain, and J. Lehmann (CRD Press), 187–198.
Murtaza, G., Usman, M., Iqbal, J., Hyder, S., Solangi, F., Iqbal, R., et al. (2024). Liming potential and characteristics of biochar produced from woody and non-woody biomass at different pyrolysis temperatures. Sci. Rep. 14, 11469–11412. doi: 10.1038/s41598-024-61974-8
Nan, H., Mašek, O., Yang, F., Xu, X., Qiu, H., Cao, X., et al. (2022). Minerals: a missing role for enhanced biochar carbon sequestration from the thermal conversion of biomass to the application in soil. Earth-Sci. Rev. 234:104215. doi: 10.1016/J.EARSCIREV.2022.104215
Nan, H., Yin, J., Yang, F., Luo, Y., Zhao, L., and Cao, X. (2021). Pyrolysis temperature-dependent carbon retention and stability of biochar with participation of calcium: implications to carbon sequestration. Environ. Pollut. 287:117566. doi: 10.1016/J.ENVPOL.2021.117566
Nan, H., Zhao, L., Yang, F., Liu, Y., Xiao, Z., Cao, X., et al. (2020). Different alkaline minerals interacted with biomass carbon during pyrolysis: which one improved biochar carbon sequestration? J. Clean. Prod. 255:120162. doi: 10.1016/J.JCLEPRO.2020.120162
Nishimura, M., Iwasaki, S., and Horio, M. (2009). The role of potassium carbonate on cellulose pyrolysis. J. Taiwan Inst. Chem. Eng. 40, 630–637. doi: 10.1016/J.JTICE.2009.05.005
Paessler, D. (2022). The “Cartion Park” model for ERW on croplands — carbon drawdown initiative. Available online at: https://www.carbon-drawdown.de/blog/2022-12-7-the-cartion-park-model-for-erw-on-croplands
Patwa, D., Bordoloi, U., Dubey, A. A., Ravi, K., Sekharan, S., and Kalita, P. (2022). Energy-efficient biochar production for thermal backfill applications. Sci. Total Environ. 833:155253. doi: 10.1016/J.SCITOTENV.2022.155253
Patwardhan, P. R., Satrio, J. A., Brown, R. C., and Shanks, B. H. (2010). Influence of inorganic salts on the primary pyrolysis products of cellulose. Bioresour. Technol. 101, 4646–4655. doi: 10.1016/J.BIORTECH.2010.01.112
Peng, X., Deng, Y., Peng, Y., and Yue, K. (2018). Effects of biochar addition on toxic element concentrations in plants: a meta-analysis. Sci. Total Environ. 616-617, 970–977. doi: 10.1016/J.SCITOTENV.2017.10.222
Rathnayake, D., Schmidt, H. P., Leifeld, J., Mayer, J., Epper, C. A., Bucheli, T. D., et al. (2023). Biochar from animal manure: a critical assessment on technical feasibility, economic viability, and ecological impact. GCB Bioenergy 15, 1078–1104. doi: 10.1111/GCBB.13082
Rawal, A., Joseph, S. D., Hook, J. M., Chia, C. H., Munroe, P. R., Donne, S., et al. (2016). Mineral-biochar composites: molecular structure and porosity. Environ. Sci. Technol. 50, 7706–7714. doi: 10.1021/ACS.EST.6B00685
Renforth, P. (2019). The negative emission potential of alkaline materials. Nat. Commun. 10. doi: 10.1038/S41467-019-09475-5
Renforth, P., and Henderson, G. (2017). Assessing Ocean alkalinity for carbon sequestration. Rev. Geophys. 55, 636–674. doi: 10.1002/2016RG000533
Rosas, J. M., Bedia, J., Rodríguez-Mirasol, J., and Cordero, T. (2009). Hemp-derived activated carbon fibers by chemical activation with phosphoric acid. Fuel 88, 19–26. doi: 10.1016/J.FUEL.2008.08.004
Russo, C., Stanzione, F., Tregrossi, A., and Ciajolo, A. (2014). Infrared spectroscopy of some carbon-based materials relevant in combustion: qualitative and quantitative analysis of hydrogen. Carbon 74, 127–138. doi: 10.1016/J.CARBON.2014.03.014
Samuels, T., Bryce, C., Landenmark, H., Marie-Loudon, C., Nicholson, N., Stevens, A. H., et al. (2020). “Microbial weathering of minerals and rocks in natural environments” in eds. Dontsova, K. Balogh-Brunstad, Z., Roux, G. L. Biogeochemical cycles: Ecological drivers and environmental impact, Washington, D.C., USA: American Geophysical Union, 59–79. doi: 10.1002/9781119413332
Schaller, J., Macagga, R., Kaczorek, D., Augustin, J., Barkusky, D., Sommer, M., et al. (2023). Increased wheat yield and soil C stocks after silica fertilization at the field scale. Sci. Total Environ. 887:163986. doi: 10.1016/J.SCITOTENV.2023.163986
Schmidt, H. P., Anca-Couce, A., Hagemann, N., Werner, C., Gerten, D., Lucht, W., et al. (2019). Pyrogenic carbon capture and storage. GCB Bioenergy 11, 573–591. doi: 10.1111/GCBB.12553
Schmidt, H. P., Kammann, C., Hagemann, N., Leifeld, J., Bucheli, T. D., Sánchez Monedero, M. A., et al. (2021). Biochar in agriculture – a systematic review of 26 global meta-analyses. GCB Bioenergy 13, 1708–1730. doi: 10.1111/GCBB.12889
Shao, Y., Guizani, C., Grosseau, P., Chaussy, D., and Beneventi, D. (2018). Biocarbons from microfibrillated cellulose/lignosulfonate precursors: a study of electrical conductivity development during slow pyrolysis. Carbon 129, 357–366. doi: 10.1016/J.CARBON.2017.12.037
Smider, B., and Singh, B. (2014). Agronomic performance of a high ash biochar in two contrasting soils. Agric. Ecosyst. Environ. 191, 99–107. doi: 10.1016/J.AGEE.2014.01.024
Smidt, E., Lechner, P., Schwanninger, M., Haberhauer, G., and Gerzabek, M. H. (2002). Characterization of waste organic matter by FT-IR spectroscopy: application in waste science. Appl. Spectrosc. 56, 1170–1175. doi: 10.1366/000370202760295412
Sokol, N. W., Sohng, J., Moreland, K., Slessarev, E., Goertzen, H., Schmidt, R., et al. (2024). Reduced accrual of mineral-associated organic matter after two years of enhanced rock weathering in cropland soils, though no net losses of soil organic carbon. Biogeochemistry 167, 989–1005. doi: 10.1007/S10533-024-01160-0
Stockmann, G. J., Wolff-Boenisch, D., Gislason, S. R., and Oelkers, E. H. (2011). Do carbonate precipitates affect dissolution kinetics? 1: basaltic glass. Chem. Geol. 284, 306–316. doi: 10.1016/J.CHEMGEO.2011.03.010
Stockmann, G. J., Wolff-Boenisch, D., Gislason, S. R., and Oelkers, E. H. (2013). Do carbonate precipitates affect dissolution kinetics?: 2: Diopside. Chem. Geol. 337–338, 56–66. doi: 10.1016/J.CHEMGEO.2012.11.014
Swoboda, P., Döring, T. F., and Hamer, M. (2022). Remineralizing soils? The agricultural usage of silicate rock powders: a review. Sci. Total Environ. 807:150976. doi: 10.1016/J.SCITOTENV.2021.150976
Tan, C., Guo, Y., Sun, J., Li, W., Zhang, J., Zhao, C., et al. (2020). Structurally improved MgO adsorbents derived from magnesium oxalate precursor for enhanced CO2 capture. Fuel 278:118379. doi: 10.1016/J.FUEL.2020.118379
Tarasov, D., Shahi, C., and Leitch, M. (2013). Effect of additives on wood pellet physical and thermal characteristics: a review. Int. Sch. Res. Not. 2013:876939. doi: 10.1155/2013/876939
te Pas, E. E. E. M., Chang, E., Marklein, A. R., Comans, R. N. J., and Hagens, M. (2024). Accounting for retarded weathering products in comparing methods for quantifying carbon dioxide removal in a short-term enhanced weathering study. Front. Clim. 6:1524998. doi: 10.3389/FCLIM.2024.1524998
te Pas, E. E. E. M., Hagens, M., and Comans, R. N. J. (2023). Assessment of the enhanced weathering potential of different silicate minerals to improve soil quality and sequester CO2. Front. Clim. 4:954064. doi: 10.3389/FCLIM.2022.954064
Van Der Bauwhede, R., Muys, B., Vancampenhout, K., and Smolders, E. (2024). Accelerated weathering of silicate rock dusts predicts the slow-release liming in soils depending on rock mineralogy, soil acidity, and test methodology. Geoderma 441:116734. doi: 10.1016/J.GEODERMA.2023.116734
Van Zwieten, L., Kimber, S., Morris, S., Downie, A., Berger, E., Rust, J., et al. (2010). Influence of biochars on flux of N2O and CO2 from Ferrosol. Soil Res. 48, 555–568. doi: 10.1071/SR10004
Verbruggen, E., Struyf, E., and Vicca, S. (2021). Can arbuscular mycorrhizal fungi speed up carbon sequestration by enhanced weathering? Plants People Planet 3, 445–453. doi: 10.1002/PPP3.10179
Vienne, A., Poblador, S., Portillo-Estrada, M., Hartmann, J., Ijiehon, S., Wade, P., et al. (2022). Enhanced weathering using basalt rock powder: carbon sequestration, co-benefits and risks in a mesocosm study with Solanum tuberosum. Front. Clim. 4:869456. doi: 10.3389/FCLIM.2022.869456
Vorrath, M. E., Amann, T., Meyer zu Drewer, J., Hagemann, N., Aldrich, C., Börker, J., et al. (2025). Pyrogenic carbon and carbonating minerals for carbon capture and storage (PyMiCCS) part II: organic and inorganic carbon dioxide removal in an oxisol. Front. Clim.
Wei, B., Peng, Y., Lin, L., Zhang, D., Ma, L., Jiang, L., et al. (2023). Drivers of biochar-mediated improvement of soil water retention capacity based on soil texture: a meta-analysis. Geoderma 437:116591. doi: 10.1016/J.GEODERMA.2023.116591
Wu, H., Quyn, D. M., and Li, C. Z. (2002). Volatilisation and catalytic effects of alkali and alkaline earth metallic species during the pyrolysis and gasification of Victorian brown coal. Part III. The importance of the interactions between volatiles and char at high temperature. Fuel 81, 1033–1039. doi: 10.1016/S0016-2361(02)00011-X
Wu, E., Wang, Q., Ke, L., and Zhang, G. (2023). Study on carbon emission characteristics and emission reduction measures of lime production—a case of Enterprise in the Yangtze River Basin. Sustain. For. 15:10185. doi: 10.3390/SU151310185
Xiao, X., Chen, Z., and Chen, B. (2020). Proton uptake behaviors of organic and inorganic matters in biochars prepared under different pyrolytic temperatures. Sci. Total Environ. 746:140853. doi: 10.1016/J.SCITOTENV.2020.140853
Zhao, L., Cao, X., Zheng, W., and Kan, Y. (2014). Phosphorus-assisted biomass thermal conversion: reducing carbon loss and improving biochar stability. PLoS One 9:e115373. doi: 10.1371/JOURNAL.PONE.0115373
Keywords: biochar, carbon sink, pyrolysis, co-pyrolysis, enhanced weathering, rock powder, rock-enhanced biochar, mineral-enriched biochar
Citation: Meyer zu Drewer J, Vorrath M-E, Amann T, Hartmann J, De la Rosa JM, Möllmer J, Pérez-Dalí SM, Meredith W, Uguna C, Snape C, Kammann C, Schmidt H-P and Hagemann N (2025) Pyrogenic carbon and carbonating minerals for carbon capture and storage (PyMiCCS) part I: production, physico-chemical characterization and C-sink potential. Front. Clim. 7:1631368. doi: 10.3389/fclim.2025.1631368
Edited by:
Ben W. Kolosz, University of Hull, United KingdomReviewed by:
Martin Taylor, University of Hull, United KingdomMarie-Liesse Aubertin, IFP Energies Nouvelles, France
Copyright © 2025 Meyer zu Drewer, Vorrath, Amann, Hartmann, De la Rosa, Möllmer, Pérez-Dalí, Meredith, Uguna, Snape, Kammann, Schmidt and Hagemann. This is an open-access article distributed under the terms of the Creative Commons Attribution License (CC BY). The use, distribution or reproduction in other forums is permitted, provided the original author(s) and the copyright owner(s) are credited and that the original publication in this journal is cited, in accordance with accepted academic practice. No use, distribution or reproduction is permitted which does not comply with these terms.
*Correspondence: Nikolas Hagemann, bmlrb2xhcy5oYWdlbWFubkBhZ3Jvc2NvcGUuYWRtaW4uY2g=; Johannes Meyer zu Drewer, bXpkQGl0aGFrYS1pbnN0aXR1dC5vcmc=