 Tresa Mary Thomas
 Govindasamy Bala
- 1Department of Earth and Climate Science, Indian Institute of Science Education and Research, Pune, India
- 2Center for Atmospheric and Oceanic Sciences, Indian Institute of Science, Bangalore, India
Tropical monsoons are crucial atmospheric phenomena that impact more than two-thirds of the global population. Numerous previous studies have investigated changes in tropical circulation under climate change for individual ocean basins. In this review, we synthesize the robust changes in tropical atmospheric circulations and precipitation under a warming climate using CMIP6 data for illustration. Sea surface temperature, precipitation, and cloud cover are enhanced over the central and eastern Pacific, similar to El-Niño. In the Indian Ocean basin, the sea surface warming pattern is similar to the positive Indian Ocean Dipole phase, with low-level easterly anomalies in the central tropical Indian Ocean, which diverge into two anticyclones off the east coast of Africa. In the Atlantic, a larger increase in sea surface temperature is simulated along the eastern equatorial Atlantic, like an east Atlantic El-Niño condition. An increase in summer monsoon precipitation over South Asia and a decrease over North and South America, the Maritime continent, and Southern Africa are simulated. In the Northern African monsoon region, an east–west asymmetry is projected with a decrease in rainfall in the west and an increase in the east. The interconnection between the identified robust changes in circulation and precipitation over the three oceanic basins under a warming climate has been explored via earlier studies and model simulations. This review provides a holistic picture of regional tropical circulation and precipitation changes under a warming climate.
1 Introduction
Tropical monsoons are a crucial atmospheric phenomenon for not just the tropics but also extratropical and polar regions (Yuan et al., 2018). This seasonal phenomenon provides copious rainfall and supports large economies like India (Prasanna, 2014). Climate warming in recent years has contributed to unprecedented changes locally and globally (e.g., an increase in the probability and intensity of extreme climate events (Diffenbaugh et al., 2017), rapid retreat and loss of ice volumes (Hock and Huss, 2021), and local extinctions (Panetta et al., 2024) etc.). The influence of warming on tropical monsoons (Dong et al., 2024; He et al., 2020; Pendergrass, 2020; Supari et al., 2019; Xie et al., 2010) has been investigated in observations and climate models (Fan and Dommenget, 2024; Jia et al., 2024; Katzenberger et al., 2021; Norris et al., 2022; Thomas et al., 2022).
The IPCC assessment reports AR5 and AR6 show an increase in global monsoon precipitation and a weakening of global monsoon circulation under a warming climate (Christensen et al., 2013; Douville et al., 2021). However, a contrasting east–west asymmetry is projected for the summer monsoon precipitation, with an increase in the Asian-African monsoon and a decrease in the North and South American monsoon (Douville et al., 2021). Under the RCP4.5 scenario, a decrease in monsoon precipitation is projected over the western Sahel, and an increase in precipitation is projected in the central-eastern Sahel (Monerie et al., 2012). Over the Indian subcontinent, a long-term increase in monsoon precipitation is attributed with high confidence to the increase in available moisture, while the aerosol forcing overcomes near-term increases due to greenhouse gases (Doblas-Reyes et al., 2023). However, there is a large uncertainty in both the magnitude and direction of change in monsoon precipitation between model outputs regarding the future of the Australian monsoon (Narsey et al., 2020).
Apart from the projection of an increase in the global monsoon precipitation, modeling studies (Kjellsson, 2015; Tokinaga et al., 2012; Vecchi et al., 2006) have also projected a decrease in the strength of tropical atmospheric circulation due to greenhouse gas forcings. According to the Clausius-Clapeyron relationship, lower tropospheric water vapor concentration increases by around 7% per degree of global warming, while the rate of global mean precipitation increase is only around 2% (Kjellsson, 2015). It has been, therefore, suggested that the difference between the rate of moistening of the large-scale atmosphere and the rate of precipitation is associated with a decrease in atmospheric overturning circulation under a warming climate (Vecchi et al., 2006). Modeling studies using the emission scenario A1B have found that the precipitation anomalies under a warming climate in the tropics are positively correlated to spatial anomalies of sea surface temperature, and attributed it to equatorial wave adjustments that lead to uniform upper atmospheric warming (Xie et al., 2010).
Under global warming, a seasonal phase delay and amplitude change in the atmospheric circulation and precipitation are found over tropical land and ocean (Biasutti and Sobel, 2009; Song et al., 2021; Chou et al., 2007; Huang et al., 2013). Due to the enhanced atmospheric effective heat capacity and increased convective barrier, the seasonal phase delay is more evident over tropical land (Song et al., 2018, 2020, 2023), while the amplitude enhancement is more evident over the ocean due to the presence of abundant water vapor (Song et al., 2023). Lv et al. (2024) found that among the tropical monsoon regions, phase changes in the annual rainfall cycle are predominant over South America, North and South Africa, while North American, South Asia, East Asia, and Australian monsoon regions are dominated by amplitude changes. Many studies have investigated the phase delay and enhanced amplitude of monsoon precipitation over the tropics in recent years, and CMIP6 models project further seasonal delays (4.2%/C) and amplifications (7.2–17.6%) in the future that can have far-reaching impacts (Song et al., 2021, 2025; Wang et al., 2024).
Studies using climate models have projected enhanced weakening in the zonally asymmetric part of the tropical circulation, the Walker circulation, more than the zonally symmetric part, the Hadley circulation (Vecchi and Soden, 2007). A recent study (Shrestha and Soden, 2023) has also simulated a decrease in tropical circulation under a warming climate in the satellite era; however, other studies (L’Heureux et al., 2013; Toda et al., 2024) found a strengthening of Walker circulation in observations during recent times. Using multiple model experiments, a recent study (Watanabe et al., 2023) found that the recent strengthening of Walker circulation is linked to the SST trend patterns observed in recent decades (with western tropical Pacific warming faster than the eastern tropical Pacific), which is similar to the negative phase of Interdecadal Pacific Oscillations. However, a weakening of Walker circulation is projected under global warming as the pattern of SST warming in the tropical Pacific is projected to be opposite to the recent historical changes. Another study (Fan and Dommenget, 2024) also found a weakening of tropical circulation under a warming climate and used a diagnostic model to attribute it to the lifting of the tropical tropopause height.
Over the Pacific, most climate models simulate a sea surface temperature anomaly pattern that is similar to the El-Niño pattern under a warming climate (Cai et al., 2021; Thirumalai et al., 2024; Wang et al., 2017). Further, when CO2 concentration reaches 700 ppm, the frequency of central Pacific El-Niño events is projected to increase by about five times compared to Eastern Pacific El-Niño events and is attributed to the flattening of the thermocline in the equatorial Pacific (Yeh et al., 2009). The upward branch of the Pacific Walker circulation connects the zonal circulations over the Pacific Ocean and the Indian Ocean (Cai et al., 2019). The weakened Pacific Walker Circulation under El-Niño conditions is also associated with a descent anomaly over the tropical Atlantic, which can result in a low-level anticyclone over India and the northwest Pacific, suppressing monsoon circulation via teleconnections (Cai et al., 2019). A moist linear baroclinic model projects an ascent anomaly over the east and central Pacific and a descent anomaly over the Philippine Sea and east Indian Ocean in response to El-Niño forcing in the equatorial Pacific (Watanabe and Jin, 2003).
While there are numerous studies (Shrestha and Soden, 2023; Vecchi et al., 2006; Vecchi and Soden, 2007) on the tropical circulation changes over the tropical Pacific, papers on circulation changes over the tropical Indian Ocean are limited. Over the Indian subcontinent, a recent global climate model study simulated a weakening of monsoon circulation and enhanced monsoon precipitation under the RCP8.5 scenario (Thomas et al., 2023). The analysis performed in the study (Thomas et al., 2023) also showed a decrease in precipitation in the tropical eastern Indian Ocean and a pair of anticyclones in the tropical western Indian Ocean straddling the equator in association with the weakening of the Indian monsoon circulation. A similar decrease in precipitation in the eastern tropical Indian Ocean and a pair of anticyclones in the western tropical Indian Ocean were also simulated in an earlier climate modeling study for a quadrupling of CO2 (Stowasser et al., 2009). The negative precipitation anomaly over the eastern tropical Indian Ocean was attributed to a descent anomaly over the same region. These two studies identified a pattern of SST changes over the Indian Ocean basin that is similar to positive-Indian Ocean Dipole (p-IOD) and hence implied a weakening of the Indian Ocean Walker circulation. Recent studies (Sharma et al., 2022, 2023) have confirmed this weakening of the Indian Ocean Walker Circulation under a warming climate in CMIP5 and CMIP6 multi-model analysis and attributed it mostly to a positive-Indian Ocean Dipole (p-IOD) pattern of SST changes under climate warming. They also identified an anomalous local Hadley Circulation in the September–November season with rising motion over West Asia and sinking motion over the southeastern equatorial Indian Ocean (Sharma et al., 2022). It is interesting to note that no study has examined the robust link between the changes in the tropical Pacific Ocean and the circulation and precipitation changes identified in previous studies (Sharma et al., 2022, 2023; Stowasser et al., 2009; Thomas et al., 2023).
To summarize, several previous studies have identified individually an El-Niño pattern of sea surface temperature and a weakening of the Pacific and Indian Ocean Walker circulations and other monsoon circulations under a warming climate (Cai et al., 2019, 2021; Menon et al., 2013; Thomas et al., 2023; Wang et al., 2017; Yeh et al., 2009). Recent studies (Fan and Dommenget, 2024; Geng et al., 2022; Li et al., 2023a) have also analyzed various aspects of tropical circulation patterns and teleconnections using CMIP6 data for individual ocean basins. However, a review that presents an integrated picture of the robust circulation changes in the entire tropics and associated tropical precipitation changes under a warming climate is lacking in the literature. Since monsoon circulations are an integral part of tropical circulations and monsoon precipitation affects more than two-thirds of the world’s population (Ha, 2019) and supports large economies (Prasanna, 2014), a synthesis of the potential future changes in tropical circulation and precipitation across the entire tropics under a warming climate is valuable. Here, using data from an ensemble of 30 global climate models that contributed to CMIP6, we illustrate the robustness of changes in tropical circulation and precipitation during the northern hemisphere summer monsoon period, and specifically the link between the circulation changes in the Pacific and Indian oceans under a warming climate, and discuss the mechanisms involved in the simulated changes. The changes in annual means and the southern hemisphere summer season are also briefly discussed.
In this review, we use the CMIP6 data to illustrate the robust changes in tropical monsoon circulation and precipitation under a warming climate. Earlier studies have used CMIP3/5/6 and single models (Christensen et al., 2013; Douville et al., 2021; Flynn and Mauritsen, 2020; Kim et al., 2025; Lee et al., 2023; Sharma et al., 2022, 2023; Wyser, 2020) to understand and investigate tropical circulation and precipitation pattern changes. However, as discussed earlier, the novelty of this review is the documentation and synthesis of the robust circulation and precipitation changes across the entire tropics, and the illustration of these changes using CMIP6 data. The focus of this review is the robust changes in tropical circulation and precipitation during the summer monsoon seasons under a warming climate. Therefore, analyses are performed for the northern hemispheric summer monsoon season (June to September, JJAS) and the southern hemispheric summer monsoon season (November–February, NDJF). A similar documentation and synthesis of circulation changes in a warmer world for the extra-tropics can be found in a previous study (Shaw et al., 2024).
2 Data
To illustrate the robust changes in tropical circulations under a warming climate, two sets of CMIP6 simulations are used: pre-industrial control simulation (piControl) and abrupt-4xCO2 simulation in which the concentration of CO2 in the atmosphere is abruptly increased by four times with respect to the piControl simulations. Variables from 30 global climate models of the CMIP6 data are used (Details of the models are available in the Supplementary Table S1). The first realization (r1i1p1f1) from the ensemble of these two experiments for each of the climate models is used, and means are calculated over the last 100 years of the piControl experiments and over 131–150 years for the abrupt-4xCO2 experiments. Since the focus of the review is the northern hemisphere summer monsoon period (JJAS), mean surface temperature, precipitation, zonal, meridional, vertical winds, specific humidity, and percentage of cloud cover are used. The analyses are performed for the months JJAS (the summer monsoon season for the South Asian monsoon region), to provide uniformity in our review among all the tropical regions. For the sake of completeness and to assess the temporal robustness of the tropical circulation changes, precipitation, and vertical motion are also illustrated for annual means and the southern hemispheric summer (NDJF) season.
Through a rigorous performance analysis, Lee et al. (2024) have found that CMIP6 models outperform their earlier versions in representing global and regional climatologies, variabilities, and feedbacks. However, systematic model biases still exist among the CMIP6 models, e.g., high climate sensitivity (Zelinka et al., 2020), presence of double ITCZ (Tian and Dong, 2020), etc. For instance, Zhou and Xie (2015) have found that the global warming-induced Walker circulation slowdown is weakly biased in the projection using coupled model climatology. However, the biases in the piControl simulations should be present in the 4xCO2 simulations as well. As we analyze only the climate change anomalies throughout this paper, these biases are assumed to get subtracted out. Further, the robustness of the simulated changes among the models gives confidence in our analysis.
The climate system has almost reached a steady state in the piControl and abrupt-4xCO2 simulations during the periods specified in the previous paragraph (Supplementary Figures S1-S4). Averaging is performed over these periods. The variables are regridded to the coarsest model output grid resolution (2.767°x 2.812°) and are averaged with equal weights to obtain the multi-model ensemble means. The effects of climate change on the variables are calculated by subtracting the multimodel ensemble means of the piControl experiment from the abrupt-4xCO2 experiment. Following Chapter 4 of the IPCC WG1 report (Lee et al., 2023), changes are considered to be significant and robust if at least two-thirds of the models project a change larger than interannual variability and at least 80% of the models agree on the sign of this change.
3 Changes under a warming climate during the monsoon period
3.1 Global changes
Using CMIP5 models, the IPCC assessment report AR5 projected that by the end of the century under the RCP8.5 scenario, the global mean surface air temperature could increase by 2.6–4.8 °C, and using CMIP6 data, the assessment report AR6 projected that under SSP5-8.5 scenario, the global mean surface air temperature could increase by 2.7–5.7 °C (Lee et al., 2023). A larger climate sensitivity is found in CMIP6 data compared to CMIP5 models (Flynn and Mauritsen, 2020; Wyser, 2020). In the abrupt-4xCO2 experiment, all the 30 models in CMIP6 simulate an increase in the mean annual surface temperature (Supplementary Figure S1). Individually, 12 models simulate a 4–5 °C increase in the annual mean surface temperature compared to the piControl simulation, 7 models simulate an increase of 5–6 °C, and 6 models simulate an increase of 7–8 °C (Supplementary Figure S2). The multi-model mean increase in global surface temperature across the 30 CMIP6 climate models (Supplementary Table S1) used in this review is approximately 5.4 °C ± 1.1 °C (Here, uncertainty in the estimate of multi-model mean surface temperature is determined as ± one standard deviation of the values from the 30 models). Over the equatorial Pacific (9.7S-9.7N, 120E - 60 W) and Indian Ocean (9.7S-9.7N, 5E -120E), almost half of the 30 CMIP6 models simulate an increase in surface temperature of 3–4 °C with a multimodel mean of 4.4 °C ± 1.0 °C and 4.2 °C ± 0.9 °C (Supplementary Figures S2b,c), respectively. The large climate sensitivity simulated in CMIP6 models is attributed to stronger positive cloud feedback (Zelinka et al., 2020).
Similar to the global mean surface temperature, the IPCC assessment report AR5 projected that under the RCP8.5 scenario, the global mean precipitation could increase by 5%, and using CMIP6 data, the assessment report AR6 projected that under the SSP5-8.5 scenario, the global mean precipitation could increase by 0.9–12.9% (Lee et al., 2023). All 30 models in the abrupt-4xCO2 experiment simulate an increase in global and annual mean precipitation (Supplementary Figure S3). Around 9 models simulate a 6–8% increase in global mean annual precipitation, while 6 models simulate around 8–10% and 6 models simulate around 10–12% increase under a quadrupled CO2 scenario (Supplementary Figure S4a).
Hydrologic sensitivity is defined as the linear change in global mean precipitation with respect to change in global mean temperature and is estimated as the slope of global mean precipitation response to surface temperature change, without considering the rapid adjustments due to forcing agents (Douville et al., 2021; Fläschner et al., 2016; Pendergrass, 2020). The definition of apparent hydrological sensitivity includes the influence of fast adjustments and is found to be lower than hydrologic sensitivity because rapid adjustments cause a reduction in precipitation for CO2 radiative forcing (Bala et al., 2010; Douville et al., 2021; Fläschner et al., 2016; Pendergrass, 2020). Out of the 30 CMIP6 models, 28 models simulate a hydrologic sensitivity of 1.5–3% and an apparent hydrological sensitivity (Modak et al., 2018; Pendergrass, 2020; Samset et al., 2016) of 1–2% per degree of global mean surface temperature change (Supplementary Figures S4b,c). The average hydrologic and apparent hydrologic sensitivity among the 30 CMIP6 models is 2.6 ± 0.3%/°C and 1.6 ± 0.3%/°C, respectively. This is comparable to the hydrologic sensitivities of 2.5%/°C as assessed by an earlier study (Pendergrass, 2020) and 1.7 ± 0.6%/°C in an analysis with 22 CMIP5/CMIP6 models by another study (Douville et al., 2021).
The IPCC assessment report AR6 found that the largest increase in mean surface temperature under the SSP5-8.5 scenario is in the Arctic by about 10 °C, and a 3.5 °C increase occurs in the tropics by the end of the century (Lee et al., 2023). In the tropics spanning 20°S - 20°N, abrupt-4xCO2 simulations from all 30 CMIP6 models used in this review simulate an increase in the average annual surface temperature in the range of 3–7 °C. The multi-model change in average annual surface temperature over the tropics is 4.5 °C ± 0.95 °C, which is less than the global change, indicating a larger warming in the higher latitudes (Fan and Dommenget, 2024). Here, uncertainty in the estimate of the multi-model means surface temperature is determined as ± one standard deviation of the values for all 30 models. The annual average precipitation over the tropics increases in the range of 2–14% among all the 30 CMIP6 models, with a multi-model mean of 6.8 ± 2.6%. The apparent hydrologic sensitivity among the models over the tropics ranges from 0.5–2.5%/°C, with a multi-model mean of 1.5%/°C (Supplementary Figure S5). Thus, the annual average precipitation changes and the apparent hydrologic sensitivity in the tropics are comparable to global averages. A recent study found that tropical hydrologic sensitivity is mostly influenced by the warming patterns in the Pacific (Norris et al., 2022).
The weakening of circulation over the tropics can be estimated directly from the changes in convective mass fluxes (Held and Soden, 2006). However, CMIP6 simulations do not output this variable. Hence, we have used the difference between the apparent hydrological sensitivity and rate of change in precipitable water with warming as a proxy to infer the weakening of tropical circulation. Out of the 30 CMIP6 models considered here, the data for vertically integrated atmospheric water vapor was available only for 23 models. For these 23 models, the percentage change in vertically integrated atmospheric water vapor (precipitable water) over the tropics increases by 30–70% with a multi-model mean of 42 ± 10%. For these models, the increase in precipitable water in the tropics per unit increase in global mean surface temperature is around 9.15%/°C (Supplementary Figure S5). The smaller apparent hydrological sensitivity compared to the rate of precipitable water change with warming in the tropics is an indication of the decrease in convective mass fluxes associated with a weakening of tropical circulation (Held and Soden, 2006). We could not directly estimate the weakening of circulation from the vertical motion at 500 hPa, because the changes in tropical large-scale upward motion would be nearly balanced by changes in the tropical large-scale downward motion. Various climatological indices are calculated for both the global and tropical domains to present a quantitative comparison of the changes in the tropics to the global mean changes.
3.2 Changes over the tropical Pacific Ocean
Numerous studies (Cai et al., 2021, 2022; Power et al., 2013; Stowasser et al., 2009; Wang et al., 2017; Shin et al., 2022) have simulated a larger change in sea surface temperature in the eastern Pacific relative to the western Pacific under a warming climate. This pattern resembles the El-Niño phase of the dominant interannual variability in the tropical Pacific (Ying et al., 2024; Wang et al., 2020). The spatial pattern of changes in the multi-model average of summer (June–September) precipitation is shown in Figure 1a. A similar pattern of change in sea surface temperature has been identified among the models (Figure 1b). In association with this pattern of warming, an increase in precipitation is also projected for the central and eastern tropical Pacific (Figure 1a), which is similar to the Central Pacific El-Niño event (Yeh et al., 2009; Shin et al., 2022).

Figure 1. Multi-model ensemble mean JJAS change in (a) precipitation, (b) sea surface temperature, and (c) change in temperature difference between 200 hPa and 850 hPa levels between the abrupt-4xCO2 and piControl CMIP6 simulations. Means are calculated over the last 100 years of the piControl and over 131–150 years of the abrupt-4xCO2 experiments and averaged over the 30 climate models participating in CMIP6 (Supplementary Table S1). The hatching represents regions of robust significant changes (colour), no change or no robust significant changes (black hatching), and conflicting signals (pink hatching). Significance analysis is performed following Chapter 4, IPCC WG1 report (Lee et al., 2023).
In the tropics, the upper levels warm more than the lower levels, as the tropical atmosphere is governed by moist adiabatic convection (Manabe and Smagorinsky, 1967; Ma et al., 2012; Intergovernmental Panel on Climate Change (IPCC), 2023). This leads to an increase in the vertical stability of the atmosphere and a weakening of atmospheric circulation under a warming climate (Figure 1c). Recent multi-model studies (Huang et al., 2017; Jia et al., 2024; Lee et al., 2023) have also found a similar increase in vertical stability of the tropical atmosphere under a warming climate. The largest increase in vertical atmospheric stability is simulated over the tropical west Pacific and east Indian Ocean (Figure 1c), which is also consistent with a decrease in precipitation over these regions (Figure 1a). The larger increase in stability over the west Pacific is attributed to a smaller increase of low-level air temperature in the Western tropical Pacific compared to the Eastern tropical Pacific under a warming climate (Supplementary Figure S6a). Xie et al. (2010) have found that under a warming climate, the upper tropospheric warming is nearly uniform over the tropics, leading to the in-situ sea surface temperature patterns governing the vertical stability of the tropical atmosphere. The east–west asymmetry of temperature change in the lower levels of the atmosphere in the tropical Pacific (Supplementary Figure S6b) is also consistent with the east–west asymmetry of the SST pattern (Figure 1b). The in-situ SST pattern over the equatorial Pacific is suggested as the major contributor to changes in circulation patterns in recent years (Chadwick et al., 2014; Watanabe et al., 2023). Strong westerly anomalies are simulated in the low levels (850 hPa) along the western and central tropical Pacific, while strong easterly anomalies are simulated along the eastern tropical Pacific, slightly north of the equator (Figure 2a). According to another study (Xie et al., 2010), the low-level westerly anomalies deepen the thermocline and dampen the upwelling along the east coast, and together with zonal advection lead to an increase in SST over the Eastern tropical Pacific.
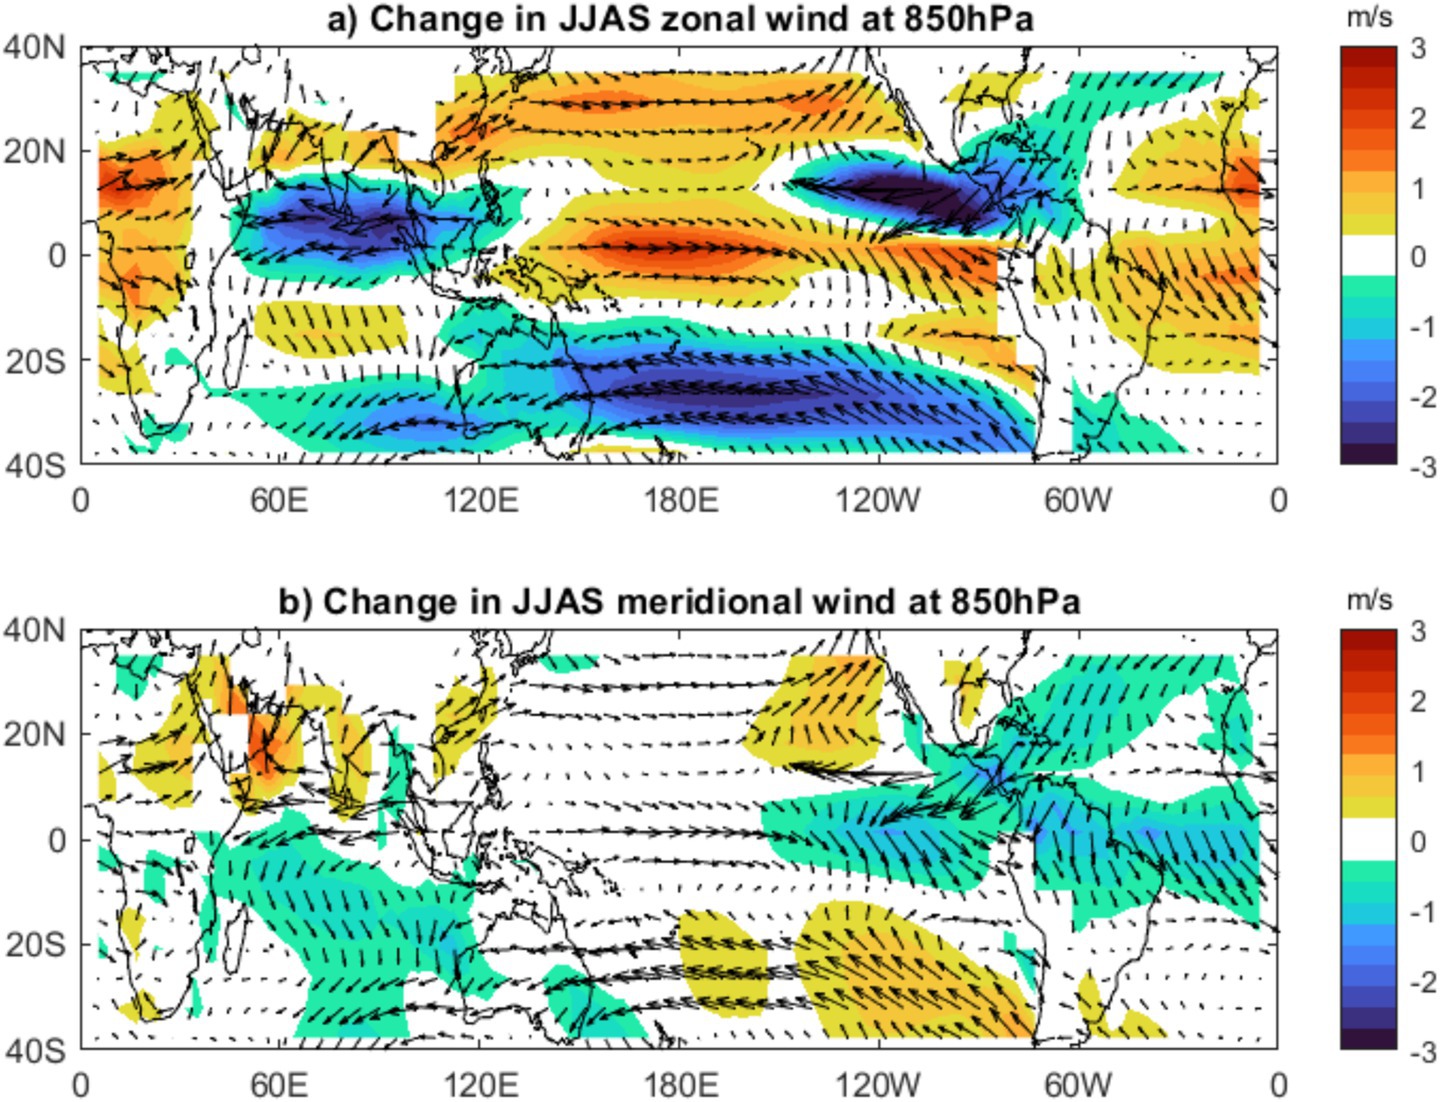
Figure 2. Multi-model ensemble mean JJAS changes in winds (arrows), (a) zonal winds (colour), and (b) meridional wind at 850 hPa between the abrupt-4xCO2 and piControl CMIP6 simulations. Means are calculated over the last 100 years of the piControl and over 131–150 years of the abrupt-4xCO2 simulations and averaged over the 30 climate models participating in CMIP6 (Supplementary Table S1).
A larger increase in the vertical stability of the atmosphere along the tropical western Pacific and eastern Indian Ocean (Figure 1b) is also reflected as a descent anomaly in these same regions (Figure 3a; Supplementary Figure S7a). The longitude-height plot of change in vertical velocity averaged along the tropics (10°S-10°N, Figure 3a) shows two large cells of opposite directions adjacent to each other. Under a warming climate, a descent anomaly occurs along the western tropical Pacific and the eastern Indian Ocean, while an ascent anomaly is found along the tropical central and eastern Pacific Ocean (Figure 3a; Supplementary Figure S7a). In association with an implied low-level divergence over the tropical west Pacific, strong low-level westerly anomalies emanate from the tropical western Pacific and flow toward tropical central and east Pacific (Figure 2a) leading to a relatively larger increase in sea surface temperature over the central and eastern tropical Pacific Ocean similar to that of El-Niño (Figure 1B). The ascent anomaly (Figure 3A; Supplementary Figure S7a) over the tropical central and eastern Pacific leads to an increase in cloud cover at all levels (Figure 3b) and an increase in precipitation (Figure 1a). The ascent anomaly over the eastern and central tropical Pacific and the descent anomaly over the tropical western Pacific and eastern Indian Ocean (Figures 3a; Supplementary Figure S7a) indicate the weakening of the zonal circulation over the tropics, the Pacific Walker circulation.

Figure 3. Vertical pattern of multi-model ensemble mean JJAS change in tropical (a) vertical velocity and (b) cloud cover between the abrupt-4xCO2 and piControl simulations. The variables are averaged over 10°S-10°N at each longitude. Means are calculated over the last 100 years of the piControl and over 131–150 years of the abrupt-4xCO2 simulations and averaged over the 30 climate models participating in CMIP6 (Supplementary Table S1). The hatching in (a) shows regions of robust significant changes (colour), no or no robust significant changes (black hatching), and conflicting signals (pink hatching). Significance analysis is performed following Chapter 4, IPCC WG1 report (Lee et al., 2023).
A recent study (Watanabe et al., 2023) define the Pacific Walker circulation index as the equatorial (5°S-5°N) sea level pressure difference between the central-east Pacific region (160°W-80°W) and the west Pacific and east Indian Ocean region (80°E-160°E). The Pacific Walker circulation index on average decreases by 0.18 ± 0.1 hPa (−9.5 ± 6.2%) per oC of warming during the northern hemisphere summer among the CMIP6 models (Supplementary Figure S8). Here, uncertainty in the estimate of the multi-model Walker circulation index and its percentage change is determined as ± one standard deviation of the values from the 30 models. Though the median (or robust) response is a weakening, one model (the IITM model, Swapna Panickal-personal communication) simulates a strengthening of the Walker Circulation in a warmer climate, and investigating the underlying mechanism responsible for this behavior is beyond the scope of this review. The longitudinal profile of vertical velocity at 500 hPa also shows a descent anomaly over the west tropical Pacific and an ascent anomaly over the east tropical Pacific in a warmer climate (Supplementary Figure S11b), indicating a weakening of the Walker circulation. A schematic representation of the mechanisms associated with the Walker circulation weakening is shown in Figure 4. Thus, there are many similarities in the atmospheric circulation and SST anomalies in the Pacific Ocean between the El-Niño phase of tropical Pacific interannual variability (ENSO) and a warmer world.
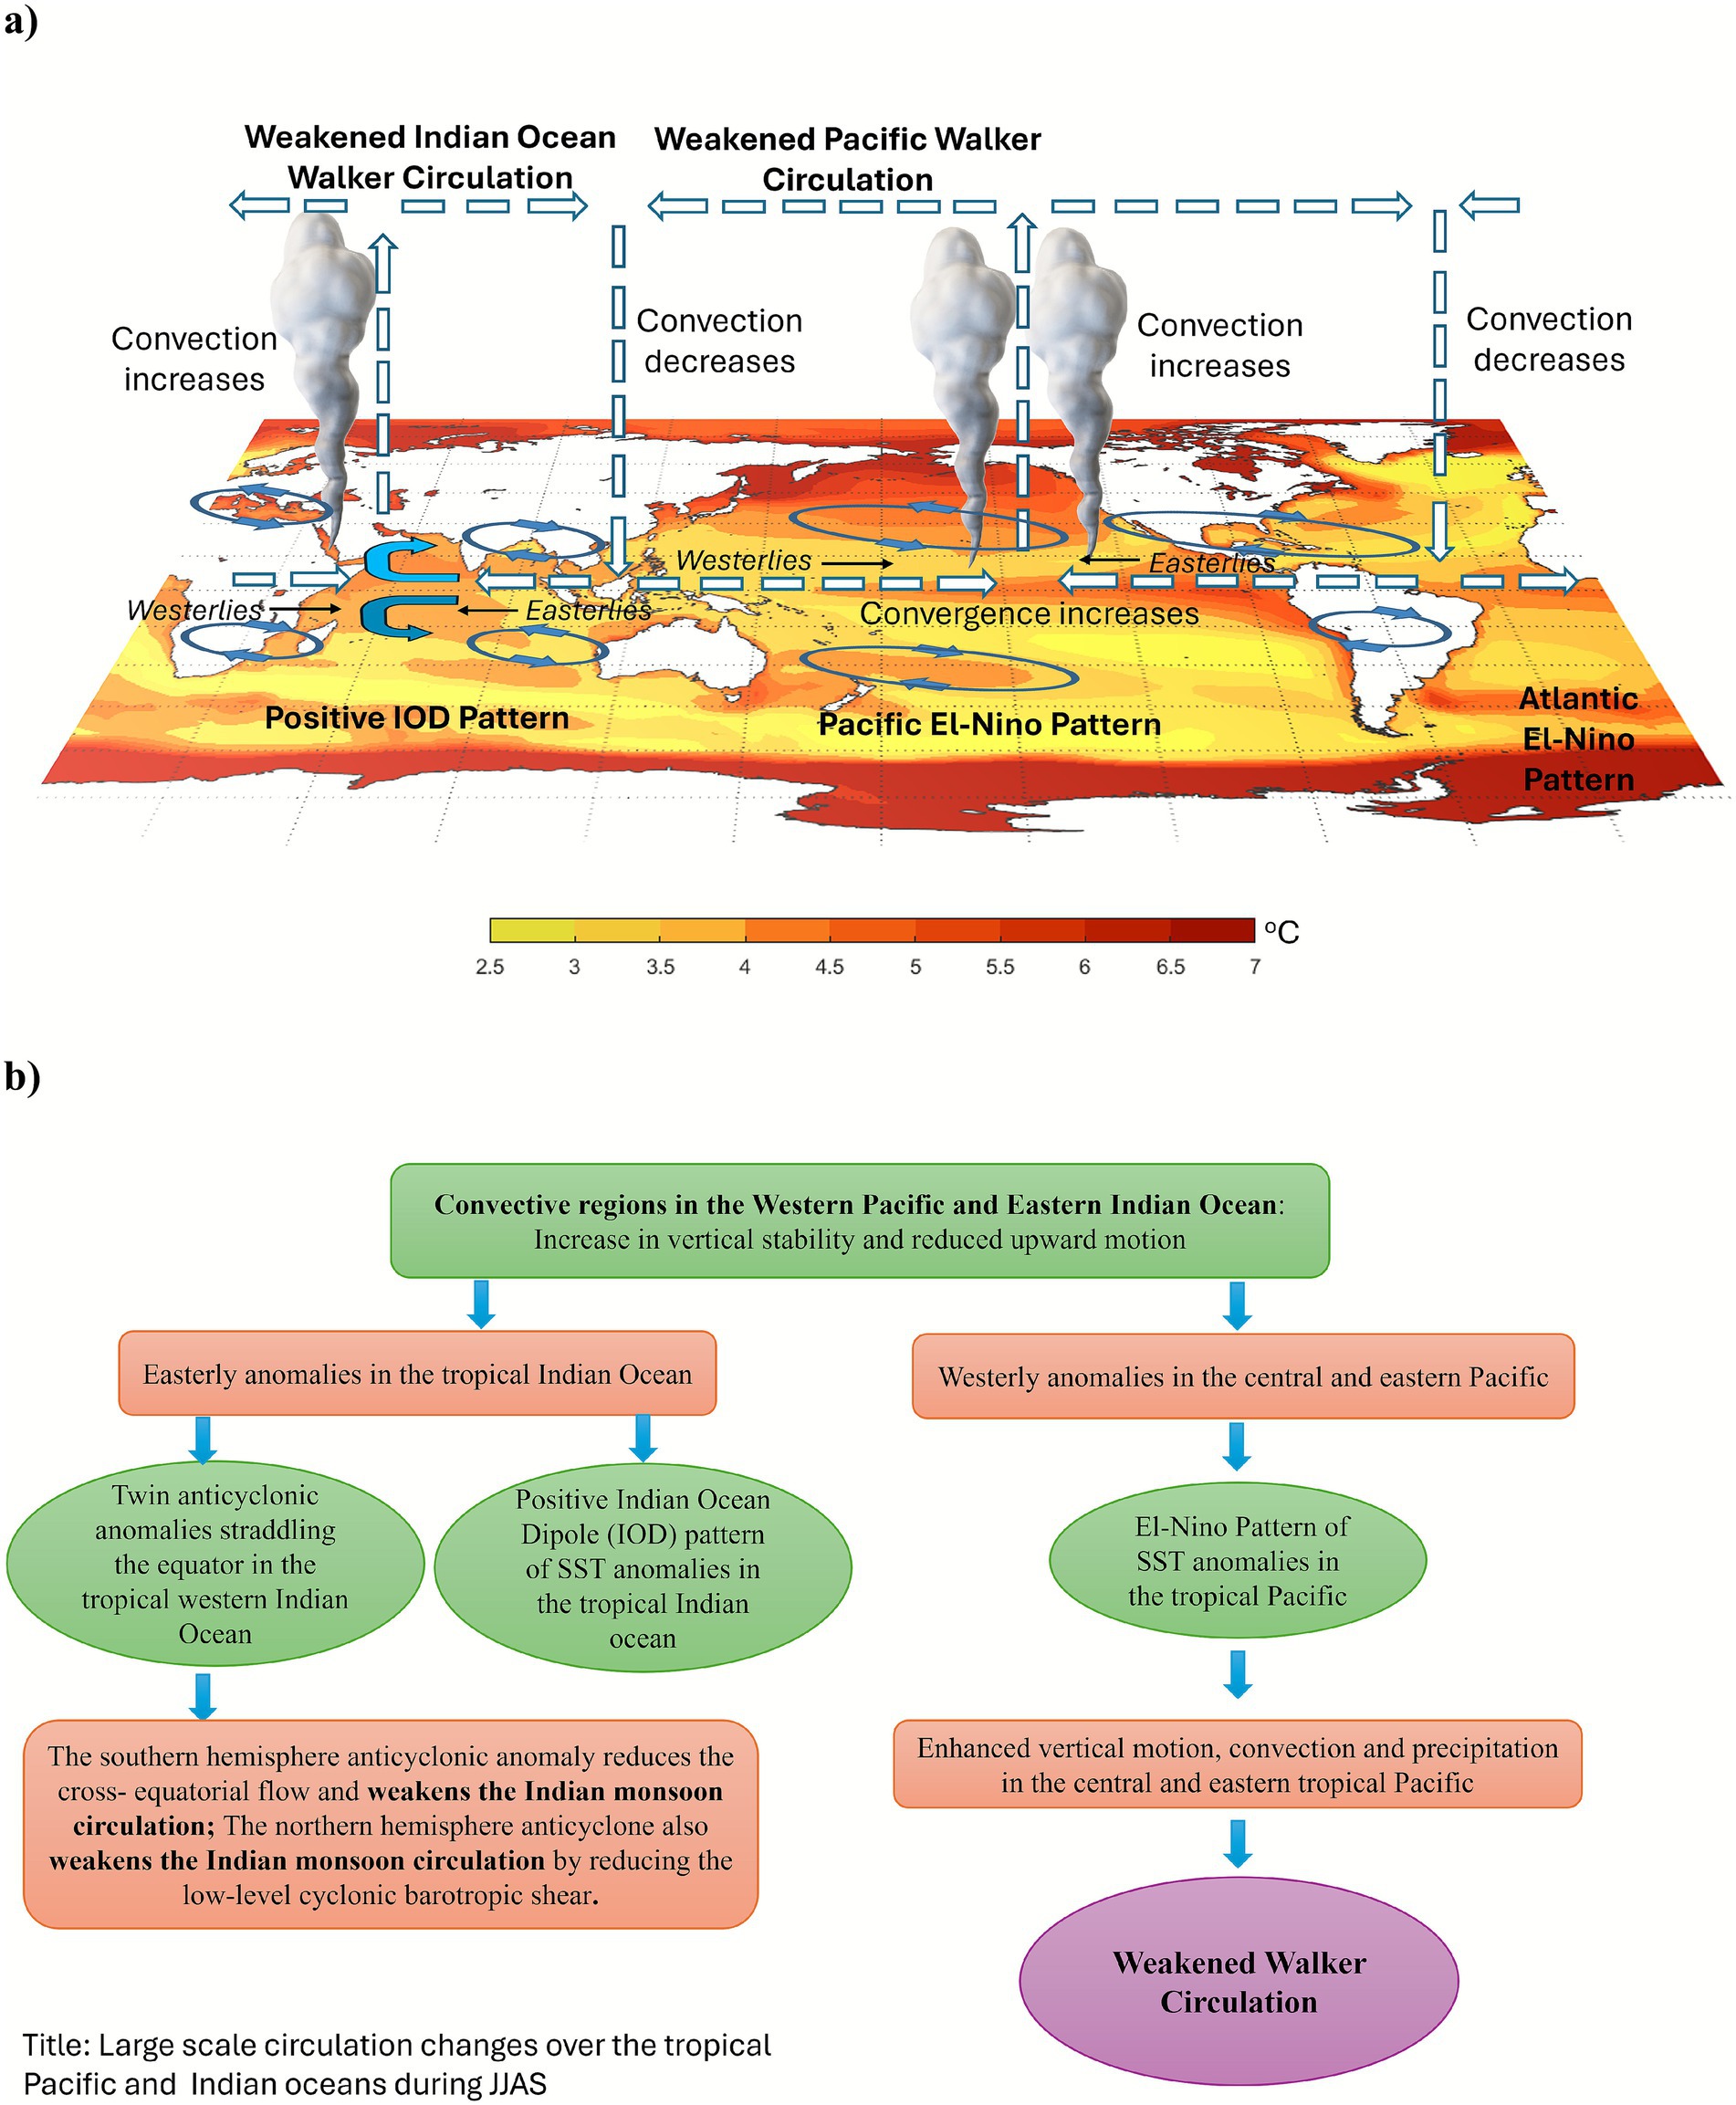
Figure 4. (a) Schematic and (b) flowchart representation of large-scale circulation changes over the tropical Pacific and Indian Ocean during JJAS for a quadrupling of atmospheric CO2. The cyclonic and anti-cyclonic anomalies in (a) show the schematic circulation anomalies in the low levels (850 mb) identified in the CMIP6 ensemble mean, which is consistent with Gill (1980).
3.3 Changes over the tropical Indian Ocean
In the tropical Indian Ocean, many studies (Sharma et al., 2022, 2023; Stowasser et al., 2009; Thomas et al., 2023; Yeh et al., 2009) found the increase in sea surface temperature to be larger over the west compared to the east which bears some resemblance to a positive Indian Ocean Dipole pattern (Figure 1b). In association with this positive Indian Ocean Dipole pattern, a decrease in precipitation is projected on the east side of the tropical Indian ocean (Figure 1a) which is also similar to break phase of the Indian monsoon (Annamalai and Sperber, 2005).
The decrease in upward motion in the tropical western Pacific and eastern Indian Ocean results in a descent anomaly and a reduction in precipitation over these regions (Figures 1a, 3a; Supplementary Figure S7a). Studies (Stowasser et al., 2009; Thomas et al., 2023) using single models simulated twin low-level anticyclones over the western tropical Indian Ocean under a warming climate. In analysis with multiple models of CMIP6, low-level easterly anomalies emanating from the western tropical Pacific flow over the tropical Indian Ocean and split into two low-level anticyclones over the western tropical Indian Ocean just before the east coast of Africa (Figure 1c). On intraseasonal timescales, another study (Annamalai and Sperber, 2005) found a suppressed precipitation over the east Indian Ocean during the break phase and positive Indian Ocean Dipole phase leads to a set of two anticyclones on either side of the equator along the tropical Indian Ocean. Thus, there are large similarities in the atmospheric circulation and SST anomalies in the Indian Ocean between the break phase and positive Indian Ocean Dipole p-IOD (IOD) phase of the monsoon and a warmer world.
The winds associated with the southern hemisphere anticyclone weaken the cross-equatorial flow associated with the Indian summer monsoon (Figure 2) and thus tend to weaken the monsoon circulation measured in terms of kinetic energy of the low-level Somali Jet (Supplementary Figure S9a). The northern hemisphere’s anomalous low-level anticyclone also causes a weakening of the Indian summer monsoon circulation, as the low-level monsoon circulation itself is cyclonic. The divergence of 850 mb meridional winds over the Indian Ocean centered around the equator is also an indication of the weakening of Indian monsoon circulation (Figure 2b). However, the vertically integrated horizontal moisture flux (Supplementary Figure S10a) and mean monsoon precipitation (Supplementary Figure S9b) over the Indian subcontinent are found to increase. Thus, the CMIP6 multi-model means in precipitation and circulation change over the Indian subcontinent are robust and consistent with earlier studies (Sooraj et al., 2015; Stowasser et al., 2009; Thomas et al., 2023), which have found a weakening of monsoon circulation and an increase in water vapor flux and monsoon precipitation over India under a warming climate.
The Indian Ocean Walker Circulation (IWC) index is defined as the difference in average 500 hPa equatorial (10°S-10°N) vertical velocity between the East Indian Ocean (94°E-104°E) and the West Indian Ocean (40°E-50°E) (Sharma et al., 2022). In analysis with 30 CMIP6 models, IWC index increases from −0.06 ± 0.02 Pa/s in the piControl simulations to −0.04 ± 0.02 Pa/s in the abrupt-4xCO2 simulations (7.1 ± 2.7% per degree of warming, Supplementary Figure S11a). This indicates a decrease in ascent over the East Indian Ocean (or enhanced descent anomalies, Figure 3a) and a decrease in descent over the West Indian Ocean (or enhanced ascent anomalies, Figure 3), also evident in the tropical vertical velocities at 500 hPa (Supplementary Figure S11a). Following the definition (Sharma et al., 2022), the zonal SST gradient in the tropical Indian Ocean is estimated as the difference in SST anomalies over the equatorial (10°S-10°N) West Indian Ocean (40°E-50°E) and East Indian Ocean (94°E-104°E). Under quadrupled CO2 concentration, the western Indian Ocean warms more than the eastern Indian Ocean (Figure 1b), amounting to a zonal SST gradient anomaly of 0.84 ± 0.5 K. Studies (Sharma et al., 2022, 2023) have also found a positive IOD pattern and a slowing down of the IWC under a warmer world in the September–November season. They (Sharma et al., 2022, 2023) attribute the weakening of IWC to both greenhouse gas-induced warming and an anomalous Local Hadley Circulation (LHC) with rising motion over the Arabian Sea peninsula and sinking motion over the southeastern equatorial Indian Ocean. Furthermore, under a warming climate, the east–west asymmetry in sea surface temperature and precipitation leads to shoaling of thermocline, which can cause thermocline feedback that enhances the occurrence of positive IOD in the future (Krishnan et al., 2020).
The meridional component of MSLP/Tsurf (ratio of mean sea level pressure to surface temperature) gradient between the East Indian Ocean Region (EIO, 10°S-10°N and 90°E-115°E) and the Arabian Peninsula region (AP, 15°N-35°N and 30°E-55°E) is used to assess the strength of the LHC (Sharma et al., 2022). This quantity is called the LHC index. First, the difference in MSLP/Tsurf between the two regions is computed (step 1), following which, the meridional component of the MSLP/Tsurf is obtained by subtracting the zonal component (10°S-25°N average of MSLP/Tsurf over EIO minus 10°S-25°N average of MSLP/Tsurf over AP) from the ratio (MSLP/Tsurf) computed in step 1. Similar to the definition (Sharma et al., 2022), the multimodel analysis using 30 CMIP6 models also shows an increase in local Hadley cell circulation index under a warming climate (Supplementary Figure S11c). This indicates a larger MSLP decrease over AP than over EIO and the development of a NW-SE-oriented local Hadley Cell circulation between EIO and AP. Thus, changes in IWC index, SST gradient, vertical velocities at 500 hPa, and MSLP gradients are consistent with a positive-IOD type pattern and weakening of IWC as seen in Sharma et al. (2022, 2023).
Precipitation changes over the tropical landmass are crucially dependent on the changes in circulation. Numerous studies (Chen et al., 2020; Katzenberger et al., 2021; Menon et al., 2013; Sooraj et al., 2015; Stowasser et al., 2009; Thomas et al., 2023) have simulated an increase in mean monsoon precipitation over India even with a weakened mean monsoon circulation under a warming climate. Even with a decrease in mean Indian monsoon circulation (Supplementary Figure S9a), an increase in mean Indian monsoon precipitation is projected over India (Figure 1a; Supplementary Figure S9b) by the ensemble of 30 CMIP6 models. The vertically integrated divergence of horizontal moisture flux over the Indian subcontinent shows convergence at most locations in India (Supplementary Figure S10a). Thus, the enhanced thermodynamic effect associated with an increase in vertically integrated moisture flux convergence (Supplementary Figure S10) due to enhanced water vapor in the atmosphere dominates the weakened dynamic effect associated with a decrease in mean monsoon circulation (Supplementary Figure S9a) to produce an increase in mean monsoon precipitation over the Indian subcontinent (Figure 1a; Supplementary Figure S9b), which is consistent with earlier studies (Chen et al., 2020; Katzenberger et al., 2021; Menon et al., 2013; Sooraj et al., 2015; Stowasser et al., 2009; Thomas et al., 2023).
3.4 Changes over the tropical Atlantic Ocean
Under a warming climate, a study (Zhang et al., 2025) found a larger increase in sea surface temperature over the eastern equatorial Atlantic than in the west, which is similar to an east Atlantic El-Niño condition. Consistent with East Atlantic El-Niño pattern, a slight increase in precipitation over the equatorial Atlantic and a significant decrease in precipitation over the north tropical Atlantic are projected by the ensemble of 30 CMIP6 models (Figure 1). The change in sea surface temperature and precipitation are also similar to changes simulated toward the end of the century in multimodel analysis of the SSP3.7 scenario in the CMIP6 archive (Zhang et al., 2025). Earlier studies have found that, similar to the Pacific El-Niño, warm sea surface temperature anomalies in the eastern tropical Atlantic Ocean are associated with westerly anomalies over the tropical Atlantic (Figure 2a) and a deepened thermocline in the east, further warming the sea surface temperature through Bjerknes feedback (Keenlyside and Latif, 2007). Consistently, westerlies are found over the equatorial Atlantic in the northern hemisphere (Figure 2). Further, under climate warming, an increase in vertical stability (Figure 1c), enhanced descent (Figure 3a), and a decrease in cloud cover (Figure 3b) are simulated along the equatorial Atlantic. Under a warmer climate, the ascent anomaly over the central-east tropical Pacific is associated with a descent anomaly over the equatorial Atlantic Ocean (Figure 3). This is consistent with a decrease in cloud cover (Figure 3b) along the equatorial Atlantic. The westerly anomalies in the tropical Atlantic (Figure 2a) deepen the thermocline and further increase the sea surface temperature in the east (Figure 1b). The warmer SST anomalies in the east Atlantic are associated with an increase in precipitation (Figure 1a) over the same region.
3.5 Changes in tropical monsoon regions
Both CMIP5 and CMIP6 simulations project an increase in overall global monsoon precipitation and a weakening of global monsoon circulation (Christensen et al., 2013; Douville et al., 2021; Lee et al., 2023). Regionally, an increase in mean monsoon precipitation in the northern hemisphere and a decrease in the southern hemisphere is projected in the long term (Christensen et al., 2013; Douville et al., 2021; Lee et al., 2023). Similarly, an east–west asymmetry with an increase in precipitation over South Asia and East Africa and a decrease over West Africa and North America is also projected for the future (Christensen et al., 2013; Douville et al., 2021; Lee et al., 2023). Using the 30 CMIP6 climate models, a similar asymmetry in the mean monsoon precipitation between the northern and southern hemispheres, and zonal asymmetry between Asia and America are found (Supplementary Figures S12, S13).
A decrease in mean monsoon precipitation over the tropical maritime continent is projected in a multimodel analysis using CMIP5 models, but with less agreement between the models (Christensen et al., 2013). Under a warming climate, a significant decrease in mean precipitation is simulated along the tropical maritime continent by 30 CMIP6 models (Supplementary Figure S12a). Being a part of the tropical western Pacific and eastern Indian Ocean, the tropical islands of Indonesia lie along the descending part of the circulation anomaly (Figures 3a; Supplementary Figure S7a). The descent anomaly leads to a decrease in cloud cover (Figure 3b), causing a decrease in mean precipitation over the tropical islands of the maritime continent (Supari et al., 2019).
A significant decrease in monsoon precipitation is simulated over tropical North America (Supplementary Figure S12b). This is consistent with multimodel analysis using CMIP5 and CMIP6 models (Christensen et al., 2013; Douville et al., 2021; Kim et al., 2025; Lee et al., 2023). A recent study He et al. (2025) found that the land-sea thermal contrast under an increased atmospheric CO2 concentration leads to the development of a cyclonic circulation over the Eurasian-African continent, leading to a subsidence anomaly over the western flank, suppressing the tropical North American Monsoon. Consistent with this study, multi-model analysis with CMIP6 models also shows a cyclonic circulation over the Eurasian-African continent (Supplementary Figure S14), and enhanced subsidence and reduced cloud cover over tropical North America (Figures 3; Supplementary Figure S7a) under a warming climate, indicating a similar mechanism. Consistency exists between the models in both the sign and magnitude of changes in the mean monsoon precipitation and the enhanced decrease in vertical velocities over tropical North America, which extends throughout the tropical North Atlantic (Supplementary Figures S7, S12b).
The low-level cyclonic circulation over the Eurasian-African continent lies over the north-western margin of the low-level convergence anomaly along the equatorial East-African coast (Supplementary Figure S14). According to a classic modelling study by Gill (1980), heat-induced low-level convergence at the equator leads to the emergence of cyclonic flow on the western margins of the convergence zone. Thus, a cyclonic circulation also lies on the south-western margin of the low-level convergence along the equatorial East-African coast in the southern Hemisphere (Supplementary Figure S14). A similar cyclonic circulation is also found on the north-west and south-west margin of convergence along the eastern tropical Pacific (Supplementary Figures S14, S15). Similarly, an anticyclonic circulation lies at the north and south-western margin of the low-level divergence along the equatorial west Atlantic and east Pacific Ocean (Supplementary Figures S14, S15). At lower levels in the northern hemisphere, the relative vorticity anomalies show an anticyclonic anomaly over the Indian Ocean, a cyclonic anomaly over the western Pacific, an anticyclonic anomaly over the eastern Pacific, and a cyclonic anomaly over the Atlantic Ocean (Supplementary Figure S15). Mirroring counterparts are obtained in the southern hemisphere and at upper levels (Supplementary Figure S15). Essentially, under a warming climate, the tropics can be considered as interconnected oceanic basins with alternate enhanced convergence and divergence anomalies and associated cyclonic and anticyclonic responses as per Gill (1980).
The enhanced subsidence and reduced cloud cover over the tropical North Atlantic under a warming climate extend to northwest Africa, leading to a negative precipitation anomaly in the same region (Figure 3; Supplementary Figures S7a, S12c), while an increase in monsoon precipitation is simulated along northeast tropical Africa (Supplementary Figure S12c). The enhanced subsidence and east–west asymmetry in mean monsoon precipitation found over Northern Africa using 30 CMIP6 models is consistent with a study (Monerie et al., 2012), who found an increase in monsoon precipitation over central-eastern Sahel and a decrease over western Sahel and attributed it to enhanced subsidence in CMIP3 and CMIP5 models under the RCP4.5 scenario. Also similar to the multimodel analysis of CMIP5 models (Christensen et al., 2013), inconsistency in the change of mean monsoon precipitation is high among the CMIP6 models (Supplementary Figure S12c).
An El-Niño pattern of sea surface temperature over the Pacific was found to shift the Walker circulation eastward, resulting in anomalous sinking motion over South America, leading to a decrease in mean monsoon precipitation there (Nath et al., 2024). Consistently, the multimodel mean using 30 CMIP6 models also shows an eastward shift of Walker circulation (Figure 4), a descent anomaly (Supplementary Figure S7b), and a significant decrease in mean monsoon precipitation (Supplementary Figure S13a) over tropical South America during the southern hemisphere summer monsoon period (Nov-Feb). The consistency in both direction and magnitude of changes in mean monsoon precipitation and vertical velocity is high among the 30 CMIP6 models (Supplementary Figures S7b, S13a).
A decrease in monsoon precipitation is simulated over South Africa (Supplementary Figure S13b), consistent with the north–south asymmetry in mean monsoon precipitation found in studies using CMIP6 data (Christensen et al., 2013) during the southern hemisphere summer monsoon months (Nov-Feb). Climatologically, a decrease in mean monsoon precipitation is typically observed over Southern Africa during the El-Niño years (Bellprat et al., 2015; Pomposi et al., 2018), indicating a consistent response under a warming climate as well.
Studies using CMIP5 models have found an increase in monsoon precipitation over northwest Australia and a decrease over the southwest, and attributed it to anthropogenic aerosols (Doblas-Reyes et al., 2023). Synthesis using 30 CMIP6 models shows an increase in monsoon precipitation over east Australia and a decrease over the west during Nov-Feb (southern hemisphere summer) under a quadrupled concentration of CO2 in the atmosphere (Supplementary Figure S13c). However, the consistency among the models regarding the magnitude and sign of the simulated changes in monsoon precipitation is very low (Supplementary Figure S13c). A similar inconsistency was also determined by an earlier study that used an ensemble of CMIP6 models to understand the changes in monsoon precipitation over Australia under a warming climate, and found that the inconsistency has reduced compared to CMIP5 counterparts (Narsey et al., 2020).
Overall, a significant decrease in mean monsoon precipitation is projected by the CMIP6 models under a warming climate over the summer monsoon regions in Northern America, Southern America, and Southern Africa, primarily associated with enhanced sinking over these regions (Supplementary Figures S7, S12, S13). An east–west asymmetry is projected in the changes of mean monsoon precipitation under a warming climate over Northern Africa and Australia, but the consistency between the models with regard to the sign and magnitude of the changes is low (Supplementary Figures S7, S12, S13). In analysis with CMIP6 simulations, Chang et al. (2022) found that, irrespective of emission scenario, precipitation extremes over the global monsoon region increase by around 8.0% per K of global warming, and the dynamic factor leads to the regional differences, while thermodynamic factors lead to a uniform increase in extreme precipitation events throughout the tropics.
4 Conclusion
Previous studies on tropical circulation changes have focused on individual ocean basins (Cai et al., 2019, 2021; Fan and Dommenget, 2024; Geng et al., 2022; Li et al., 2023b; Menon et al., 2013; Thomas et al., 2023; Wang et al., 2017; Yeh et al., 2009). In this review, we document and synthesize the robust circulation changes across the entire tropics. We have also used CMIP6 data to illustrate the robust changes in tropical circulation and associated precipitation during the northern hemisphere summer period (JJAS) under a warming climate. Mean changes for JJAS are estimated from two sets of experiments: pre-industrial control (piControl) and the abrupt-4xCO2 simulations from 30 CMIP6 climate models. Consistent with the IPCC assessment reports AR5 and AR6 (Christensen et al., 2013; Douville et al., 2021), a robust increase in tropical precipitation (~1.5%/oC) and a larger rate of increase in precipitable water (~9%/oC) in the tropics under a warming climate are found, indicating a weakening of tropical circulation. Vecchi et al. (2006) suggested that the difference between the rate of moistening and the rate of precipitation is the measure of the weakening of atmospheric overturning circulation, and another study from the same group (Vecchi and Soden, 2007) found an enhanced weakening of Walker circulation over the central Pacific. A robust weakening of Walker circulation (~9.5%/oC) in the tropical Pacific Ocean is also found among the CMIP6 models, and its link to the changes in the weakening of the Indian summer monsoon circulation has been discussed.
Using CMIP6 data, we illustrate that under a warming climate, the Walker circulation over the tropical Pacific, the Indian Ocean Walker circulation, and the Indian summer monsoon circulation over the tropical Indian Ocean consistently weaken. Under a warming climate, previous studies (Huang et al., 2017; Jia et al., 2024; Lee et al., 2023) project an increase in vertical stability of the tropical atmosphere. A relatively larger increase in vertical stability of the atmosphere over the tropical western Pacific and east Indian Ocean is found (Figure 1c). The enhanced vertical stability results in a weakened ascent over the tropical western Pacific and eastern Indian Ocean region, which is reflected as a descent anomaly in vertical velocity (Figure 3a; Supplementary Figure S7a). The descent anomaly over the western Pacific and east Indian Ocean is associated with low-level westerlies over the tropical Pacific and easterlies over the tropical Indian Ocean (Figure 2a). A recent study (Xie et al., 2010) suggest that the strong low-level westerly anomalies over the Pacific lead to a deepening of the thermocline along central and east Pacific causing a larger increase in sea surface temperature similar to an El-Niño pattern (Figure 1b). Multiple studies (Cai et al., 2021; Power et al., 2013; Stowasser et al., 2009; Wang et al., 2017) have found an El-Niño type SST pattern over the Pacific Ocean under a warming climate. This enhances ascent over the tropical central and eastern Pacific (Figure 3a). These changes involved in the weakening of the Walker circulation along the tropical Pacific are illustrated schematically in Figure 4.
Over the Indian Ocean, individual and multiple model studies (Sharma et al., 2022, 2023; Stowasser et al., 2009; Thomas et al., 2023) have found a positive Indian Ocean Dipole pattern of sea surface temperature, the presence of two low-level anticyclones over the western Indian Ocean, and a weakening of Indian summer monsoon circulation under a warming climate. Consistently, in the CMIP6 simulations, a strong easterly anomaly over the tropical Indian Ocean, which splits into two anticyclones just before the east coast of Africa (Figure 2a), is found, both weakening the Indian summer monsoon circulation (Supplementary Figure S9a). However, an increase in the thermodynamic component (Supplementary Figure S7) associated with enhanced water vapor in the atmosphere overwhelms the decreased dynamic component associated with the monsoon circulation (Supplementary Figure S9a) to result in an increase in monsoon precipitation over the Indian subcontinent (Supplementary Figure S9b). Many studies (Chen et al., 2020; Katzenberger et al., 2021; Sooraj et al., 2015; Stowasser et al., 2009; Thomas et al., 2023) have also found an increase in monsoon precipitation over the Indian subcontinent, even with a weakening of monsoon circulation under a warming climate. However, no previous studies have linked the weakening of Walker circulation in the Pacific (and the associated El-Niño phase of the ENSO oscillation) and the circulation changes over the tropical Indian Ocean such as easterly anomalies near the equatorial Indian Ocean, an SST anomaly pattern similar to the positive phase of IOD, and a twin anticyclonic anomaly in the western tropical Indian Ocean.
The results illustrated using CMIP6 data in this review are consistent with earlier studies that have also found a weakening of Pacific and Indian Ocean Walker circulation and Indian summer monsoon circulation under a warming climate in multi-model analysis using CMIP3/5 or individual model analysis (Dong et al., 2024; Kjellsson, 2015; Menon et al., 2013; Sharma et al., 2022, 2023; Shrestha and Soden, 2023; Stowasser et al., 2009; Thomas et al., 2023; Tokinaga et al., 2012; Vecchi et al., 2006; Vecchi and Soden, 2007). Furthermore, the changes under a warming climate are also consistent and robust across the 30 climate models of the CMIP6 data used in this review. The increase in mean monsoon precipitation simulated over the Indian subcontinent, even with a weakened monsoon circulation, is also consistent with earlier studies (Chen et al., 2020; Katzenberger et al., 2021; Sooraj et al., 2015; Stowasser et al., 2009; Thomas et al., 2023). Additionally, we have provided a comprehensive review of the changes in monsoon precipitation and circulation among all monsoon regions in the tropics and specifically focused on the link between the changes over the tropical Pacific and Indian oceans.
In the Atlantic, a recent study (Zhang et al., 2025) found a larger increase in sea surface temperature along the eastern equatorial Atlantic (Figure 1b) relative to the western equatorial Atlantic, similar to an east Atlantic El-Niño condition. An increase in vertical stability (Figure 1c), descent anomalies (Figure 3a), and a decrease in cloud cover (Figure 3b) are simulated along the equatorial Atlantic. According to another study (Keenlyside and Latif, 2007), westerly anomalies emanating toward the east in the tropics (Figure 2) deepen the thermocline and increase the SST in the east (Figure 1b), leading to enhanced precipitation over the north tropical Atlantic. The changes simulated are also consistent with a previous analysis of the CMIP6 data (Lee et al., 2023).
In the tropics, multiple studies have found a north–south and east–west asymmetry in the change of mean summer monsoon precipitation under a warming climate (Christensen et al., 2013; Douville et al., 2021; Lee et al., 2023). While an increase in mean summer monsoon precipitation over the Asian and northeast African regions is simulated, multiple studies (He et al., 2025; Kim et al., 2025) found a significant decrease over tropical North and South America (Figure 1a; Supplementary Figures S12, S13). Similarly, multiple studies (Christensen et al., 2013; Supari et al., 2019) also found a decrease in mean summer monsoon precipitation in the Southern African region and the Maritime subcontinent (Figure 1a; Supplementary Figures S12, S13). These regions are found to lie along the descending anomaly of vertical velocity (Figure 3a; Supplementary Figure S7) and show a decrease in cloud cover (Figure 3b). The changes found are similar to the regional changes of precipitation patterns obtained in previous multimodel studies using CMIP5 and CMIP6 data (Christensen et al., 2013; Douville et al., 2021; Lee et al., 2023; Supari et al., 2019). Additionally, under a warming climate, the tropics can be considered as interconnected oceanic basins with alternate enhanced convergence and divergence anomalies and associated cyclonic and anticyclonic responses as per Gill (1980).
The broader large-scale changes in mean northern hemisphere summer monsoon (JJAS) precipitation, surface temperature, vertical stability (Figure 1), zonal and meridional winds (Figure 2), vertical velocity, and cloud cover over the tropics (Figure 3) are also qualitatively found during the southern hemisphere summer monsoon (NDJF; Supplementary Figures S16–S18) and also in annual means (Supplementary Figures S18–S20). Under a warming climate during NDJF, as for JJAS, an El-Niño type surface temperature is found over the Pacific (Supplementary Figure S16b) along with increased precipitation over the central and east Pacific (Supplementary Figure S16a), westerlies over the tropical Pacific and easterlies over the tropical Indian Ocean (Figure 1). However, a decrease in precipitation found during JJAS is not simulated during NDJF over the east Indian Ocean (Figure 1a; Supplementary Figure S16a). This is consistent with earlier studies that have used CMIP6 data to project future global climate change (Lee et al., 2023). However, similar to JJAS, a weakening of Walker circulation associated with an upward motion anomaly over the tropical eastern Pacific and descent anomaly over the tropical western Pacific and eastern Indian Ocean is found during NDJF under a warming climate (Figure 3; Supplementary Figure S18). Similarly, annual means also show an El-Niño pattern of sea surface temperature anomalies and precipitation over the tropical Pacific (Supplementary Figures S19a,b), enhanced vertical stability over tropical west Pacific and east Indian Ocean (Supplementary Figure S19c), westerlies over the tropical Pacific and easterlies over the tropical Indian Ocean (Supplementary Figure S20) and ascent anomalies over tropical central and east Pacific and descent anomalies over tropical western Pacific and east Indian Ocean (Supplementary Figure S21). These changes are similar to the changes simulated during JJAS but weaker in magnitude. Thus, the weakening of Walker circulation and associated circulation and precipitation changes simulated during the northern hemisphere summer (JJAS) under a warming climate are also found during southern hemisphere summer (NDJF) and in annual means, indicating a qualitative temporal robustness in our results through the year.
There are several potential directions for future research identified in this review. For instance, we have reviewed only the atmospheric changes associated with a warming climate over the tropical basins, especially the weakening of Walker circulation and its association with the Indian Ocean. The strengthening of Walker circulation in recent decades, which might be associated with the negative phase of the Interdecadal Pacific Oscillation, has not been explored in this review, as this review is focused on long-term changes. In this context, it may be noted that a synthesis and review of the circulation changes in the extra-tropics is provided in an earlier study (Shaw et al., 2024). Ocean circulation changes and atmospheric teleconnections from other regions of the world could influence the enhanced mean monsoon precipitation in the tropics. A detailed analysis of the influence of ocean circulation changes and teleconnections is needed in the future to obtain a holistic picture of the possible changes in tropical monsoon precipitation under a warming climate. The potential link between the strong easterlies over the northern side of the eastern Pacific Ocean and the significant decrease in monsoon precipitation over tropical North America has not been explored. Similarly, a detailed analysis of the sinking anomaly over tropical South America and the ascent anomaly over tropical eastern Africa has also not been performed. Detailed investigations to understand the mechanism and implications of the north–south asymmetry in precipitation changes simulated over the tropical Atlantic are needed in the future. An elaborate decomposition of the dynamic and thermodynamic factors associated with the weakening of Walker circulation on other regional monsoon circulation and precipitation changes merits further studies in the future. This could be achieved using sensitivity experiments aimed at exploring the mechanism of the simulated changes.
In summary, this review has documented our current knowledge and understanding regarding the atmospheric circulation and precipitation changes, and their interconnection along the three tropical oceanic basins under a warming climate. We believe this synthesis would provide deeper insights into changes in the tropical climate, which are vital to the livelihood of nearly two-thirds of the global population.
Author contributions
TT: Conceptualization, Data curation, Formal analysis, Investigation, Methodology, Resources, Software, Validation, Visualization, Writing – original draft, Writing – review & editing. GB: Conceptualization, Investigation, Supervision, Visualization, Writing – review & editing.
Funding
The author(s) declare that financial support was received for the research and/or publication of this article. The first author acknowledges the Department of Science and Technology, Government of India for the fellowship provided through the INSPIRE Faculty Fellowship Scheme (DST/INSPIRE/IFF/BATCH-20/2024-25/IFA 23-EAS 124). The second author acknowledges partial support from the Degrees Initiative [RGA- DMF23IND] and the Grantham Foundation for the Protection of the Environment.
Conflict of interest
The authors declare that the research was conducted in the absence of any commercial or financial relationships that could be construed as a potential conflict of interest.
Generative AI statement
The author(s) declare that no Gen AI was used in the creation of this manuscript.
Any alternative text (alt text) provided alongside figures in this article has been generated by Frontiers with the support of artificial intelligence and reasonable efforts have been made to ensure accuracy, including review by the authors wherever possible. If you identify any issues, please contact us.
Publisher’s note
All claims expressed in this article are solely those of the authors and do not necessarily represent those of their affiliated organizations, or those of the publisher, the editors and the reviewers. Any product that may be evaluated in this article, or claim that may be made by its manufacturer, is not guaranteed or endorsed by the publisher.
Supplementary material
The Supplementary material for this article can be found online at: https://www.frontiersin.org/articles/10.3389/fclim.2025.1713513/full#supplementary-material
References
Annamalai, H., and Sperber, K. R. (2005). Regional heat sources and the active and break phases of boreal summer intraseasonal (30–50 day) variability. J. Atmos. Sci. 62, 2726–2748. doi: 10.1175/JAS3504.1
Bala, G., Caldeira, K., and Nemani, R. (2010). Fast versus slow response in climate change: implications for the global hydrological cycle. Clim. Dyn. 35, 423–434. doi: 10.1007/s00382-009-0583-y
Bellprat, O., Lott, F. C., Gulizia, C., Parker, H. R., Pampuch, L. A., Pinto, I., et al. (2015). Unusual past dry and wet rainy seasons over southern Africa and South America from a climate perspective. Weather Clim. Extremes 9, 36–46. doi: 10.1016/j.wace.2015.07.001
Biasutti, M., and Sobel, A. H. (2009). Delayed Sahel rainfall and global seasonal cycle in a warmer climate. Geophys. Res. Lett. 36:L23707. doi: 10.1029/2009GL041303,
Cai, W., Ng, B., Wang, G., Santoso, A., Wu, L., and Yang, K. (2022). Increased ENSO Sea surface temperature variability under four IPCC emission scenarios. Nat. Clim. Chang. 12, 228–231. doi: 10.1038/s41558-022-01282-z
Cai, W., Santoso, A., Collins, M., Dewitte, B., Karamperidou, C., Kug, J. S., et al. (2021). Changing El Niño–southern oscillation in a warming climate. Nat. Rev. Earth Environ. 2, 628–644. doi: 10.1038/s43017-021-00199-z
Cai, W., Wu, L., Lengaigne, M., Li, T., McGregor, S., Kug, J.-S., et al. (2019). Pantropical climate interactions. Science 363:eaav4236. doi: 10.1126/science.aav4236,
Chadwick, R., Good, P., Andrews, T., and Martin, G. (2014). Surface warming patterns drive tropical rainfall pattern responses to CO2 forcing on all timescales. Geophys. Res. Lett. 41, 610–615. doi: 10.1002/2013GL058504
Chang, M., Liu, B., Wang, B., Martinez-Villalobos, C., Ren, G., and Zhou, T. (2022). Understanding future increases in precipitation extremes in global land monsoon regions. J. Clim. 35, 1839–1851. doi: 10.1175/JCLI-D-21-0409.1
Chen, Z., Zhou, T., Zhang, L., Chen, X., Zhang, W., and Jiang, J. (2020). Global land monsoon precipitation changes in CMIP6 projections. Geophys. Res. Lett. 47:e2019GL086902. doi: 10.1029/2019GL086902
Chou, C., Tu, J.-Y., and Tan, P.-H. (2007). Asymmetry of tropical precipitation change under global warming. Geophys. Res. Lett. 34:L17708. doi: 10.1029/2007GL030327
Christensen, J. H., Kanikicharla, K. K., Aldrian, E., An, S. I., and Cavalcanti, I. F. A. (2013). “Climate phenomena and their relevance for future regional climate change,” in Climate Change 2013–The Physical Science Basis, 1217–1308. Cambridge University Press.
Diffenbaugh, N. S., Singh, D., Mankin, J. S., Horton, D. E., Swain, D. L., Touma, D., et al. (2017). Quantifying the influence of global warming on unprecedented extreme climate events. Proc. Natl. Acad. Sci. 114, 4881–4886. doi: 10.1073/pnas.1618082114,
Doblas-Reyes, F. J., Sörensson, A. A., Almazroui, M., Dosio, A., Gutowski, W. J., Haarsma, R., et al. (2023). “Linking global to regional climate change” in Climate change 2021 – The physical science basis. eds. Masson-Delmotte, P. Zhai, A. Pirani, and S. L. Connors (Cambridge: Cambridge University Press), 1363–1512.
Dong, C., Noyelle, R., Messori, G., Gualandi, A., Fery, L., Yiou, P., et al. (2024). Indo-Pacific regional extremes aggravated by changes in tropical weather patterns. Nat. Geosci. 17, 979–986. doi: 10.1038/s41561-024-01537-8
Douville, H., Raghavan, K., Renwick, J., Allan, R. P., Arias, P. A., Barlow, M., et al. (2021). “Water cycle changes” in Climate Change 2021: The Physical Science Basis. Contribution of Working Group I to the Sixth Assessment Report of the Intergovernmental Panel on Climate Change. eds. P. Z. V. Masson-Delmotte, A. Pirani, and S. L. Connors (Cambridge: Cambridge University Press).
Fan, C.-S., and Dommenget, D. (2024). The weakening of the tropical circulation is caused by the lifting of the tropopause height. Clim. Dyn. 62, 187–201. doi: 10.1007/s00382-023-06909-1
Fläschner, D., Mauritsen, T., and Stevens, B. (2016). Understanding the intermodel spread in global-mean hydrological sensitivity. J. Clim. 29, 801–817. doi: 10.1175/JCLI-D-15-0351.1
Flynn, C. M., and Mauritsen, T. (2020). On the climate sensitivity and historical warming evolution in recent coupled model ensembles. Atmos. Chem. Phys. 20, 7829–7842. doi: 10.5194/acp-20-7829-2020
Geng, Y.-F., Xie, S.-P., Zheng, X.-T., Long, S.-M., Kang, S. M., Lin, X., et al. (2022). CMIP6 intermodel spread in interhemispheric asymmetry of tropical climate response to greenhouse warming: extratropical ocean effects. J. Clim. 35, 4869–4882. doi: 10.1175/JCLI-D-21-0541.1
Gill, A. E. (1980). Some simple solutions for heat-induced tropical circulation. Q. J. R. Meteorol. Soc. 106, 447–462. doi: 10.1002/qj.49710644905
He, C., Li, T., and Zhou, W. (2025). Drier north American monsoon in contrast to Asian-African monsoon under global warming. Cham: Springer.
He, C., Li, T., and Zhou, W. (2020). Drier north American monsoon in contrast to Asian–African monsoon under global warming. J. Clim. 33, 9801–9816. doi: 10.1175/JCLI-D-20-0189.1
Held, I. M., and Soden, B. J. (2006). Robust responses of the hydrological cycle to global warming. J. Clim. 19, 5686–5699. doi: 10.1175/JCLI3990.1
Hock, R., and Huss, M. (2021). “Chapter 9 - glaciers and climate change” in Climate change (third edition). ed. T. M. Letcher (Amsterdam: Elsevier), 157–176.
Huang, P., Chen, D., and Ying, J. (2017). Weakening of the tropical atmospheric circulation response to local sea surface temperature anomalies under global warming. J. Clim. 30, 8149–8158. doi: 10.1175/JCLI-D-17-0171.1
Huang, P., Xie, S.-P., Hu, K., Huang, G., and Huang, R. (2013). Patterns of the seasonal response of tropical rainfall to global warming. Nat. Geosci. 6, 357–361. doi: 10.1038/ngeo1792
Intergovernmental Panel on Climate Change (IPCC) (2023). “Human influence on the climate system” in Climate change 2021 – The physical science basis (Cambridge: Cambridge University Press), 423–552.
Jia, F., Cai, W., Wu, L., Gan, B., Wang, G., Kucharski, F., et al. (2024). Weakening Atlantic Niño–Pacific connection under greenhouse warming. Sci. Adv. 5:eaax4111. doi: 10.1126/sciadv.aax4111
Katzenberger, A., Schewe, J., Pongratz, J., and Levermann, A. (2021). Robust increase of Indian monsoon rainfall and its variability under future warming in CMIP6 models. Earth Syst. Dynam. 12, 367–386. doi: 10.5194/esd-12-367-2021
Keenlyside, N. S., and Latif, M. (2007). Understanding equatorial Atlantic interannual variability. J. Clim. 20, 131–142. doi: 10.1175/JCLI3992.1
Kim, H., Kang, S. M., Pendergrass, A. G., Lehner, F., Shin, Y., Ceppi, P., et al. (2025). Higher precipitation in East Asia and western United States expected with future Southern Ocean warming. Nat. Geosci. 18, 313–321. doi: 10.1038/s41561-025-01669-5
Kjellsson, J. (2015). Weakening of the global atmospheric circulation with global warming. Clim. Dyn. 45, 975–988. doi: 10.1007/s00382-014-2337-8
Krishnan, R., Sanjay, J., Chellappan, G., Mujumdar, M., Kulkarni, A., and Chakraborty, S. (2020). Assessment of climate change over the Indian region. Singapore: Springer Singapore.
Lee, J., Gleckler, P. J., Ahn, M.-S., Ordonez, A., Ullrich, P. A., Sperber, K. R., et al. (2024). Systematic and objective evaluation of earth system models: PCMDI metrics package (PMP) version 3. Geosci. Model Dev. 17, 3919–3948. doi: 10.5194/gmd-17-3919-2024
Lee, J.-Y., Marotzke, J., Bala, G., Cao, L., Corti, S., Dunne, J. P., et al. (2023). “Future global climate: scenario-based projections and near-term information” in Climate change 2021 – The physical science basis. eds. J. B. R. Matthews, T. K. Maycock, T. Waterfield, and O. Yelekçi (Cambridge: Cambridge University Press), 553–672.
L’Heureux, M. L., Lee, S., and Lyon, B. (2013). Recent multidecadal strengthening of the Walker circulation across the tropical Pacific. Nat. Clim. Chang. 3, 571–576. doi: 10.1038/nclimate1840
Li, Y., Du, M., Feng, J., Xu, F., and Song, W. (2023a). Relationships between the Hadley circulation and tropical sea surface temperature with different meridional structures simulated in CMIP6 models. Front. Mar. Sci. 10:1145509. doi: 10.3389/fmars.2023.1145509
Li, Y., Du, M., Feng, J., Xu, F., and Song, W. (2023b). Relationships between the Hadley circulation and tropical sea surface temperature with different meridional structures simulated in CMIP6 models. Front. Mar. Sci. 10:1145509. doi: 10.3389/fmars.2023.1145509,
Lv, S., Song, F., Dong, H., and Wu, L. (2024). Phase and amplitude changes in rainfall annual cycle over global land monsoon regions under global warming. Geophys. Res. Lett. 51:e2024GL108496. doi: 10.1029/2024GL108496
Ma, J., Xie, S., and Kosaka, Y. (2012). Mechanisms for tropical tropospheric circulation change in response to global warming. J. Clim. 25, 2979–2994. doi: 10.1175/JCLI-D-11-00048.1
Manabe, S., and Smagorinsky, J. (1967). Simulated climatology of a general circulation model with a hydrologic cycle ii. Analysis of the tropical atmosphere. Mon. Wea. Rev. 95, 155–169. doi: 10.1175/1520-0493(1967)095<0155:scoagc>2.3.co;2
Menon, A., Levermann, A., Schewe, J., Lehmann, J., and Frieler, K. (2013). Consistent increase in Indian monsoon rainfall and its variability across CMIP-5 models. Earth Syst. Dynam. 4, 287–300. doi: 10.5194/esd-4-287-2013
Modak, A., Bala, G., Caldeira, K., and Cao, L. (2018). Does shortwave absorption by methane influence its effectiveness? Clim. Dyn. 51, 3653–3672. doi: 10.1007/s00382-018-4102-x
Monerie, P.-A., Fontaine, B., and Roucou, P. (2012). Expected future changes in the African monsoon between 2030 and 2070 using some CMIP3 and CMIP5 models under a medium-low RCP scenario. J. Geophys. Res. Atmos. 117:D16. doi: 10.1029/2012JD017510
Narsey, S. Y., Brown, J. R., Colman, R. A., Delage, F., Power, S. B., Moise, A. F., et al. (2020). Climate change projections for the Australian monsoon from CMIP6 models. Geophys. Res. Lett. 47:816. doi: 10.1029/2019GL086816
Nath, D., Nath, R., and Chen, W. (2024). Faster dieback of rainforests altering tropical carbon sinks under climate change. Npj Clim. Atmos. Sci. 7:235. doi: 10.1038/s41612-024-00793-0
Norris, J., Hall, A., Thackeray, C. W., Chen, D., and Madakumbura, G. D. (2022). Evaluating hydrologic sensitivity in CMIP6 models: anthropogenic forcing versus ENSO. J. Clim. 35, 6955–6968. doi: 10.1175/JCLI-D-21-0842.1
Panetta, A. M., Stanton, M. L., and Harte, J. (2024). Climate warming drives local extinction: evidence from observation and experimentation. Sci. Adv. 4:eaaq1819. doi: 10.1126/sciadv.aaq1819
Pendergrass, A. G. (2020). The global-mean precipitation response to CO2-induced warming in CMIP6 models. Geophys. Res. Lett. 47:e2020GL089964. doi: 10.1029/2020GL089964
Pomposi, C., Funk, C., Shukla, S., Harrison, L., and Magadzire, T. (2018). Distinguishing southern Africa precipitation response by strength of El Niño events and implications for decision-making. Environ. Res. Lett. 13:074015. doi: 10.1088/1748-9326/aacc4c
Power, S., Delage, F., Chung, C., Kociuba, G., and Keay, K. (2013). Robust twenty-first-century projections of El Niño and related precipitation variability. Nature 502, 541–545. doi: 10.1038/nature12580,
Prasanna, V. (2014). Impact of monsoon rainfall on the total foodgrain yield over India. J. Earth Syst. Sci. 123, 1129–1145. doi: 10.1007/s12040-014-0444-x
Samset, B. H., Myhre, G., Forster, P. M., Hodnebrog, Ø., Andrews, T., Faluvegi, G., et al. (2016). Fast and slow precipitation responses to individual climate forcers: a PDRMIP multimodel study. Geophys. Res. Lett. 43, 2782–2791. doi: 10.1002/2016GL068064
Sharma, S., Ha, K.-J., Cai, W., Chung, E.-S., and Bódai, T. (2022). Local meridional circulation changes contribute to a projected slowdown of the Indian Ocean Walker circulation. NPJ Clim. Atmos. Sci. 5:15. doi: 10.1038/s41612-022-00242-w
Sharma, S., Ha, K.-J., Yamaguchi, R., Rodgers, K. B., Timmermann, A., and Chung, E.-S. (2023). Future Indian Ocean warming patterns. Nat. Commun. 14:1789. doi: 10.1038/s41467-023-37435-7,
Shaw, T. A., Arblaster, J. M., Birner, T., Butler, A. H., Domeisen, D. I. V., Garfinkel, C. I., et al. (2024). Emerging climate change signals in atmospheric circulation. AGU Adv. 5:e2024AV001297. doi: 10.1029/2024AV001297
Shin, N. Y., Kug, J. S., Stuecker, M. F., Jin, F.-F., Timmermann, A., and Kim, G.-I. (2022). More frequent Central Pacific El Niño and stronger eastern Pacific El Niño in a warmer climate. npj Clim. Atmos. Sci. 5:101. doi: 10.1038/s41612-022-00324-9
Shrestha, S., and Soden, B. J. (2023). Anthropogenic weakening of the atmospheric circulation during the satellite era. Geophys. Res. Lett. 50:784. doi: 10.1029/2023GL104784
Song, F., Leung, L. R., Lu, J., and Dong, L. (2018). Seasonally-dependent responses of subtropical highs and tropical rainfall to anthropogenic warming. Nat. Clim. Chang. 8, 787–792. doi: 10.1038/s41558-018-0244-4
Song, F., Lu, J., Leung, L. R., and Liu, F. (2020). Contrasting phase changes of precipitation annual cycle between land and ocean under global warming. Geophys. Res. Lett. 47:e2020GL090327. doi: 10.1029/2020GL090327
Song, F., Leung, L. R., Lu, J., Dong, L., Zhou, W., Harrop, B., et al. (2021). Emergence of seasonal delay of tropical rainfall during 1979-2019. Nat. Clim. Chang. 11, 605–612. doi: 10.1038/s41558-021-01066-x
Song, F., Leung, L. R., Lu, J., Zhou, T., and Huang, P. (2023). Advances in understanding the changes of tropical rainfall annual cycle: a review. Environ. Res. Climate 2:042001. doi: 10.1088/2752-5295/acf606
Song, F., Dong, H., Wu, L., Leung, L. R., Lu, J., Dong, L., et al. (2025). Hot season gets hotter due to rainfall delay over tropical land in a warming climate. Nat. Commun. 16:2188. doi: 10.1038/s41467-025-57501-6,
Sooraj, K. P., Terray, P., and Mujumdar, M. (2015). Global warming and the weakening of the Asian summer monsoon circulation: assessments from the CMIP5 models. Clim. Dyn. 45, 233–252. doi: 10.1007/s00382-014-2257-7
Stowasser, M., Annamalai, H., and Hafner, J. (2009). Response of the south Asian summer monsoon to global warming: mean and synoptic systems. J. Clim. 22, 1014–1036. doi: 10.1175/2008JCLI2218.1
Supari, A., Linarka, U. A., Rizal, J., Satyaningsih, R., and Chung, J. X. (2019). Indonesian climate under 2°C and 4°C global warming: precipitation extremes. IOP Conf. Series Earth Environ. Sci. 303:2048. doi: 10.1088/1755-1315/303/1/012048
Thirumalai, K., DiNezio, P. N., Partin, J. W., Liu, D., Costa, K., and Jacobel, A. (2024). Future increase in extreme El Niño supported by past glacial changes. Nature 634, 374–380. doi: 10.1038/s41586-024-07984-y,
Thomas, T. M., Bala, G., and Vemavarapu, S. V. (2022). CESM simulation of monsoon low pressure systems over India. Int. J. Climatol. 42, 5964–5984. doi: 10.1002/joc.7571
Thomas, T. M., Bala, G., and Vemavarapu, S. V. (2023). How do the characteristics of monsoon low pressure systems over India change under a warming climate? A modeling study using the NCAR CESM. Clim. Dyn. 61, 5017–5034. doi: 10.1007/s00382-023-06837-0
Tian, B., and Dong, X. (2020). The double-ITCZ bias in CMIP3, CMIP5 and CMIP6 models based on annual mean precipitation. Geophys. Res. Lett. 47:e2020GL087232. doi: 10.1029/2020GL087232
Toda, M., Kosaka, Y., Miyamoto, A., and Watanabe, M. (2024). Walker circulation strengthening driven by sea surface temperature changes outside the tropics. Nat. Geosci. 17, 858–865. doi: 10.1038/s41561-024-01510-5
Tokinaga, H., Xie, S. P., Deser, C., Kosaka, Y., and Okumura, Y. M. (2012). Slowdown of the Walker circulation driven by tropical indo-Pacific warming. Nature 491, 439–443. doi: 10.1038/nature11576,
Vecchi, G. A., and Soden, B. J. (2007). Global warming and the weakening of the tropical circulation. J. Clim. 20, 4316–4340. doi: 10.1175/JCLI4258.1
Vecchi, G. A., Soden, B. J., Wittenberg, A. T., Held, I. M., Leetmaa, A., and Harrison, M. J. (2006). Weakening of tropical Pacific atmospheric circulation due to anthropogenic forcing. Nature 441, 73–76. doi: 10.1038/nature04744,
Wang, G., Cai, W., Gan, B., Wu, L., Santoso, A., Lin, X., et al. (2017). Continued increase of extreme El Niño frequency long after 1.5 °C warming stabilization. Nat. Clim. Chang. 7, 568–572. doi: 10.1038/nclimate3351
Wang, G., Cai, W., and Santoso, A. (2020). Stronger increase in the frequency of extreme convective than extreme warm El Niño events under greenhouse warming. J. Clim. 33, 675–690. doi: 10.1175/JCLI-D-19-0376.1
Wang, X., Luo, M., Song, F., Wu, S., Chen, Y. D., and Zhang, W. (2024). Precipitation seasonality amplifies as earth warms. Geophys. Res. Lett. 51:e2024GL109132. doi: 10.1029/2024GL109132
Watanabe, M., Iwakiri, T., Dong, Y., and Kang, S. M. (2023). Two competing drivers of the recent Walker circulation trend. Geophys. Res. Lett. 50:e2023GL105332. doi: 10.1029/2023GL105332
Watanabe, M., and Jin, F.-F. (2003). A moist linear Baroclinic model: coupled dynamical–convective response to El Niño. J. Clim. 16, 1121–1139. doi: 10.1175/1520-0442(2003)16<1121:AMLBMC>2.0.CO;2
Wyser, K. (2020). On the increased climate sensitivity in the EC-earth model from CMIP 5 to CMIP 6. Geosci. Model Dev, 13, 3465–3474. doi: 10.5194/gmd-13-3465-2020
Xie, S.-P., Deser, C., Vecchi, G. A., Ma, J., Teng, H., and Wittenberg, A. T. (2010). Global warming pattern formation: sea surface temperature and rainfall. J. Clim. 23, 966–986. doi: 10.1175/2009JCLI3329.1
Yeh, S.-W., Kug, J.-S., Dewitte, B., Kwon, M.-H., Kirtman, B. P., and Jin, F.-F. (2009). El Niño in a changing climate. Nature 461, 511–514. doi: 10.1038/nature08316,
Ying, J., Collins, M., Chadwick, R., Ma, J., and Lian, T. (2024). Constraints on the projected tropical Pacific Sea surface temperature warming pattern by the tropical North Atlantic cold SST bias in CMIP6 models. Geophys. Res. Lett. 51:e2024GL111233. doi: 10.1029/2024GL111233
Yuan, X., Kaplan, M. R., and Cane, M. A. (2018). The interconnected global climate system—a review of tropical–polar teleconnections. J. Clim. 31, 5765–5792. doi: 10.1175/JCLI-D-16-0637.1
Zelinka, M. D., Myers, T. A., McCoy, D. T., Po-Chedley, S., Caldwell, P. M., Ceppi, P., et al. (2020). Causes of higher climate sensitivity in CMIP6 models. Geophys. Res. Lett. 47:e2019GL085782. doi: 10.1029/2019GL085782
Zhang, L., Wang, C., Han, W., McPhaden, M. J., Hu, A., and Xing, W. (2025). Emergence of the Central Atlantic Niño. Sci. Adv. 9:eadi5507. doi: 10.1126/sciadv.adi5507
Keywords: El-Niño, walker circulation weakening, positive-Indian Ocean Dipole, monsoon, climate change
Citation: Thomas TM and Bala G (2025) Robust circulation changes in the tropics under a warming climate: a topical review. Front. Clim. 7:1713513. doi: 10.3389/fclim.2025.1713513
Edited by:
Tao Geng, Laoshan Laboratory, ChinaReviewed by:
Jasti S. Chowdary, Indian Institute of Tropical Meteorology (IITM), IndiaFengfei Song, Ocean University of China, China
Copyright © 2025 Thomas and Bala. This is an open-access article distributed under the terms of the Creative Commons Attribution License (CC BY). The use, distribution or reproduction in other forums is permitted, provided the original author(s) and the copyright owner(s) are credited and that the original publication in this journal is cited, in accordance with accepted academic practice. No use, distribution or reproduction is permitted which does not comply with these terms.
*Correspondence: Tresa Mary Thomas, dHJlc2FtYXJ5dGhvbWFzQGFjYWRzLmlpc2VycHVuZS5hYy5pbg==