 Arnaud Dapogny1
 Charline Grossard2Stéphanie Hun3
 Sylvie Serret3
 Ouriel Grynszpan1Séverine Dubuisson1
 David Cohen3
 Kevin Bailly1*
- 1Sorbonne Université, CNRS, Institut des Systèmes Intelligents et de Robotique, ISIR, Paris, France
- 2Service de Psychiatrie de l'Enfant et de l'Adolescent, GHU Pitie-Salpétriere Charles Foix, AP-HP, Paris, France
- 3Université de Nice Sophia Antipolis, Cognition Behaviour Technology (CoBTeK), Nice, France
While there exists a number of serious games geared toward helping children with ASD to produce facial expressions, most of them fail to provide a precise feedback to help children to adequately learn. In the scope of the JEMImE project, which aims at developing such serious game platform, we introduce throughout this paper a machine learning approach for discriminating between facial expressions and assessing the quality of the emotional display. In particular, we point out the limits in generalization capacities of models trained on adult subjects. To circumvent this issue in the design of our system, we gather a large database depicting children's facial expressions to train and validate the models. We describe our protocol to elicit facial expressions and obtain quality annotations, and empirically show that our models obtain high accuracies in both classification and quality assessment of children's facial expressions. Furthermore, we provide some insight on what the models learn and which features are the most useful to discriminate between the various facial expressions classes and qualities. This new model trained on the dedicated dataset has been integrated into a proof of concept of the serious game.
1. Introduction
Autism spectrum disorder (ASD) is a neurodevelopmental disorder that affects communication and socialization. Individuals with ASD present deficits in social emotion reciprocity in non-verbal communication, as well as in developing and maintaining social interaction. These social skills are factors of integration and constitute important factors for one to achieve social competence (Spence, 2003). Specifically, emotional skills are essential to communicate with others, and react adequately. Among emotional skills, correct recognition and production of facial expressions (FEs) are key components of emotional communication and allow people to express and understand emotions (Izard, 2001). Furthermore, FE production shall be adapted to the social context, which requires people to take care of the situation and abide to social rules (Barrett et al., 2011).
Teaching social skills to individuals with ASD is a considerable challenge and the community has made tremendous efforts to tackle this issue, notably by exploring the vein of serious game platforms. Serious games offer the advantages of proposing a playful and immersive environment to create the incentive for the child to learn in the first place. Though enumerating the different serious game platforms that were proposed to teach children with ASD how to adequately produce FEs is out of the scope of this paper, there has been quite a number of attempts to do so in the past (Cockburn et al., 2008; Fernandes et al., 2011; Park et al., 2012; Tan et al., 2013). Also, they do not provide enough feedback on FE productions, nor do they take into account social situations.
On the other hand, the JEMImE project aims at developing such a game. JEMImE is a French acronym standing for “multi-modal educative game for emotional imitation.” Specifically, JEMImE is geared toward providing feedback to children with ASD who are asked in the game to produce FEs that are adequate given a social context (Dapogny et al., 2018). Toward this goal, it relies on an automatic facial expression recognition (FER) system that works in real-time on a standard machine, with consumer sensors (e.g., a single webcam). This system is built upon machine learning and face analysis techniques and meant discriminate children's FEs. Adequate data has been gathered to train and evaluate the predictive capacities of FER models. In order to propose more precise feedback, we not only predict expression classes, but we go one step further and assess the quality of one's emotional display, as defined by its relevance w.r.t. a given context. The contributions of this paper are the following:
1. We propose a protocol for gathering a large corpus of videos depicting children's FEs, involving several recording instructions, such as on request and imitation (explained later).
2. We introduced a database containing 157 children producing FEs with a large variety of ethnicities, genders and age groups, several modalities, and 4 FEs.
3. We applied machine learning to train and validate models for both FE recognition and quality assessment.
4. We propose an information gain-based visualization method based to highlight the most relevant features and face regions for describing each FE, or FE quality.
The rest of the paper is organized as follows: in section 2.1 we describe the protocol that we use to gather data describing children FEs, as well as the database itself. In section 2.2 we describe our face analysis and pipeline to automatically assess children's FEs and FE quality, as well as how we can retrieve the most relevant features to describe each FE class or quality range. In section 3, we show that models trained on available databases, which generally contains mostly young adults, perform poorly when evaluated on children. We then show that we can obtain satisfying recognition accuracies and quality estimations by training on our JEMImE database. Finally, we offer some insight on the most relevant features for FE classification or quality assessment by applying our visualization scheme. Lastly, in section 4 we draw conclusions raised by the proposed study and discuss future work.
2. Methodology
2.1. The JEMImE Database
2.1.1. Related Datasets
In two decades, we are witnessing the emergence of affective computing and emotion-aware technologies. Despite this growing interest, most of the existing datasets for FER contain images of adult faces and there only exists a few datasets with children displaying FEs. Table 1 gathers the main characteristics of the publicly available datasets with children:
• The Radboud Faces Database (Langner et al., 2010)
• The NIMH Child Emotional Faces Picture Set (NIMH-ChEFS) (Egger et al., 2011)
• The Dartmouth Database of Children's Faces (Dalrymple et al., 2013)
• The Child Affective Facial Expression (CAFE) (LoBue and Thrasher, 2015)
• The LIRIS-CSE dataset (Khan et al., 2019)
• The EmoReact dataset (Nojavanasghari et al., 2016)
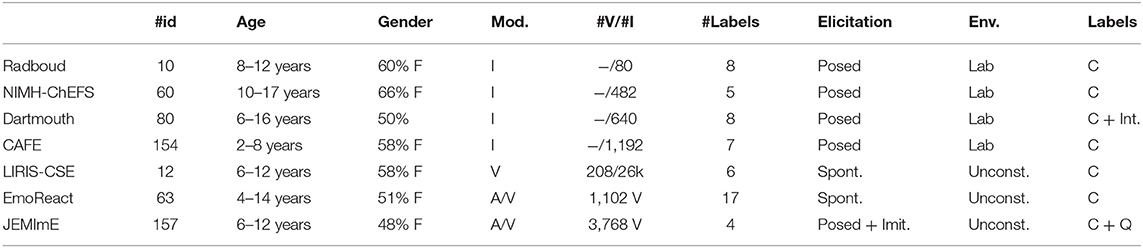
Table 1. Comparison of JEMImE dataset with other emotion datasets with children. F, female; mod., modality; I, image; V, video; AV, audio and video; Spont., spontaneous; Unconst., unconstrained; C, category; Int., intensity; Q, quality.
These datasets greatly differ in terms of (1) number of subjects, (2) the nature of the records (still images, video sequences or audio-visual records), (3) the age range of the participants, (4) the annotation (nature and the number of categories), (5) the emotion elicitation strategy, and (6) the environment conditions (from lab to unconstrained environments). The most related dataset in terms of (1), (2), (3), (4), and (6) is the EmoReact database. Unfortunately this dataset only contains spontaneous behaviors annotated with categorical labels. On the contrary, the JEMImE dataset contains posed emotions that are elicited by two different means : by asking children to produce a specific emotion or to imitate an avatar that produces an emotion. Moreover, video are annotated in both emotion category and quality. This specific protocol is led by our aforementioned use case.
2.1.2. Data Collection
The study was approved by the ethical committee of Nice University (Comité de Protection des Personnes Sud Méditerranée V) under the number 15-HPNCL-02. Participants were recruited in two French schools, one in Paris, one in Nice from January 2015 to January 2016. Before inclusion in the study, written consents were obtained from school directors, parents and children (They were previously informed about the purpose of the study as well as their rights as required by the European law). A total of 157 volunteer children aged between 6 and 11 years were recorded in Paris (63 children) and Nice (94 children). Among this pool of children, 52% were boys and 48% girls. Moreover, 77% were Caucasian, 8.3% Black-African, 7% Asian, and 7% North-African (the ethnic distribution of the sample is representative of the local demography). Each child was asked to produce four facial expressions: neutral, happiness, anger and sadness following two tasks: the on request and imitation FE production tasks.
More specifically, children were put in front of a computer that was recording the emotional display. An examiner stood behind this screen in order to encourage children to keep their heads in front of the screen. The interface for eliciting emotions is illustrated on Figure 1. For the on request task, the screen was explicitly displaying the FE that the child had to produce (“can you show me happiness?”). For the imitation task, the child was presented an avatar displaying the desired FE, and was asked to imitate it. Each child was asked to perform each FE six times total, two times for the on request task and four times for the imitation task, each corresponding to either visual or audiovisual modalities, and with avatars of both genders. The modality and avatar presentation order was randomized to avoid any learning effect. Children were roughly 1 meter away from the recording sensor, and the face crops are ~300 × 400 pixels.
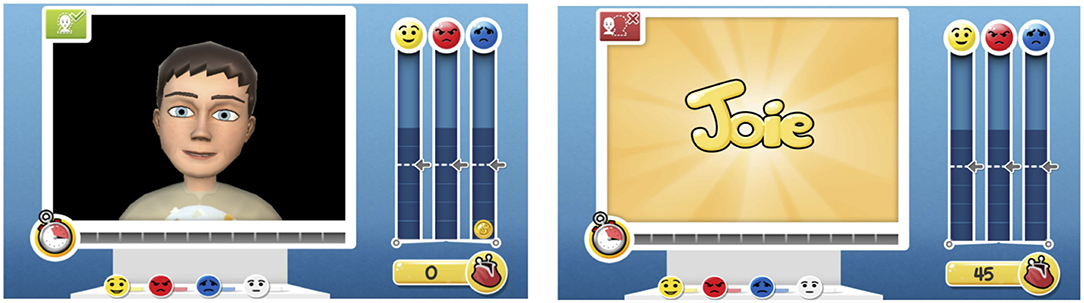
Figure 1. Illustration of the imitation and on request recording instructions.
2.1.3. Annotation and Extraction
Thus, each child was recorded 24 times in total, making a total of 3,768 videos of 3s average length. As previously explained, the JEMImE project is geared toward assessing, through a serious game platform, whether the FEs produced by children with ASD are adequate given a social context. Therefore, we not only had to recognize FEs produced by children, but also to guess to what extent the recognized FE is credible. For that matter, three judges blindly labeled the videos in terms of FE quality. FE quality was measured on a 0–10 continuous interval with the following convention: a 0 corresponds to an unrecognized FE, a 5 corresponds to a recognized but not credible FE, and a 10 corresponds to a completely credible, well-identified expression. For each video, we converted the first frame to grayscale levels, and applied opencv Viola & Jones face detector (Viola and Jones, 2001). Then, we applied the intraface feature point tracker (Xiong and De la Torre, 2013) to locate a set of 49 feature points. We subsequently tracked the feature points on the remaining frames of the video. We selected the last frame of each video for training and testing the FER models, as it usually depicted the peak (apex) of the FE. We discarded some videos for which the feature point tracker could not follow the head motion and extracted a total of 1,458 images for children from Paris and 2,110 images from Nice, each associated to a FE quality label, a children ID number and a set of aligned feature points. In what follow, we respectively refer to those datasets as JEMImE-Paris and JEMImE-Nice. The concatenation of those two datasets is referred as JEMImE-All.
The data repartition for JEMImE-All is showed on Table 2, in terms of FE category and FE qualities, respectively. As it can be seen on Table 2, the database is heavily imbalanced in favor of classes neutral as compared to anger and sadness, as there are roughly three times more examples of the former than of the latter. Thus, the proposed FER pipeline shall be robust to data imbalanced to a certain extent. As for FE quality repartition, Table also reveals that the data is heavily skewed in favor or high qualities and, more importantly, zero-quality FEs. This is not surprising because a zero-quality score for one specific FE and a video clip indicates that this FE has not been recognized; henceforth, ideally all videos labeled with happiness shall have very low quality for neutral, anger, and sadness.

Table 2. Expression label category and quality repartition (%) for JEMImE-All.
2.2. Facial Expression Recognition Pipeline
A traditional FER pipeline (Dapogny et al., 2017) consists in first extracting a set of candidate features upon which a prediction model can be trained. As it will be discussed in the following subsections, we use random forests (RFs) for the purpose of classifying or regressing the facial expressions. This RF framework offers several advantages over its competitors, for instance it is very fast and practically handles heterogeneous data. Furthermore, it allows to generate a large pool of features on-the-fly at the node level (section 2.2.1). Relevant features among those large collections are then selected by minimizing a purity criterion. Last but not least, once training is done, we can easily introspect the models to visualize the most relevant features—see section 2.2.3.
2.2.1. Facial Feature Extraction From Multiple Templates
To perform FER, we essentially extract heterogeneous features (i.e., geometric and appearance) from multiple generic templates (e.g., distance/angle between feature points, or appearance features extracted at a specific location on the space). Each of these feature templates ϕ(i) have different input parameters that are randomly generated during training. More specifically, for each template ϕ(i), the upper and lower bounds are estimated from the training data and candidate thresholds are sampled from uniform distributions within this range prior to training. Those features are then associated with a set of candidate thresholds θ to produce a set of binary split candidates for splitting the data coming at each node. We use two different geometric feature templates which are generated from the set of facial feature points f(x) aligned on image x with SDM (Xiong and De la Torre, 2013). The first geometric feature template is the distance between feature points fa and fb, normalized w.r.t. inter-ocular distance iod(f) for scale invariance (Equation 1).
Because any information relative to orientation is discarded in ϕ(1), we also use the angles between feature points fa, fb and fc as a second geometric feature . In order to ensure continuity for angles around 0, we use the cosine and sine instead of the raw angle value. Thus, ϕ(2) outputs either the cosine or sine of angle , depending on the value of a boolean parameter λ (Equation 2):
As for appearance features, we use Histogram of Oriented Gradients (HOG) for their descriptive power and robustness to illumination changes. To allow fast HOG feature extraction, we use pre-computed integral channels as discussed in Dollár et al. (2009). First, images are rescaled to a constant size of 250 × 250 pixels. Then, we compute horizontal and vertical gradients on the image and use these to generate nine feature maps, the first one containing the gradient magnitude, and the eight remaining correspond to a eight-bin quantization of the gradient orientation. Then, integral images are computed from these feature maps. From here, we define the appearance feature template as an integral histogram computed over channel ch within a window of size s normalized by inter-ocular distance. Such histogram is evaluated at a point defined by its barycentric coordinates α, β, and γ within a triangle τ defined over feature points f(x). Also, we store the gradient magnitude in the first channel to normalize the histograms. Thus, HOG features can be computed with only four access to the channels.
2.2.2. The Random Forest Framework
Random Forests (RFs) is a popular learning framework introduced in Breiman (2001). They have been ubiquitously used in computer vision as they are suited to handle very high-dimensional data (such as images) and can be easily parallelized for fast training and evaluation. Moreover, RFs are suitable predictors to handle heterogeneous data and some measures (such as variable importance or the information gain measurement detailed in section 2.2.1) allow, to a certain extent, to understand the models. A RF is traditionally built from the combination of T decision trees grown by only examining a subset of the whole feature pool (random subspace), and using data bootstraps sampled from the whole training dataset (bagging). In our case, we use bootstraps generated at the level of subject IDs, which allows extra tree randomization as well as faster evaluation using out-of-bag error estimate (see section 3.1). Formally, a tree can be defined recursively as either a split or a leaf node. Split nodes contains information about a binary split function which consists in a feature and an associated threshold. During training, split nodes are set using a greedy procedure. For each node n. We denote l(n) and r(n) the left and right subtrees associated with node n. xn, xl(n), and xr(n) with class labels yn, yl(n), and denote the data at node n, l(n), and r(n), respectively. At node n we generate k(i) binary feature candidates for each template ϕ(i). For each candidate ϕ and threshold θ we compute the information gain G induced by this candidate, defined as a function of an impurity criterion H:
Then, we select the “best" binary feature ϕn among all features from the different templates, i.e., the one that maximizes the information gain G, and use it to set a split at node n. Then, those steps are recursively applied for the left and right subtrees with accordingly routed data until the label distribution at each node is homogeneous, where a leaf node is set. Depending on the purpose of the predictive model (e.g., classification or regression), the nature of the impurity criterion H and the nature of data stored in leaf nodes vary, as explained in the following subsections.
2.2.2.1. RF for classification
For classification purposes, we use Shannon's entropy as the impurity criterion. For a node n with m training examples and for which card(yn = y) denotes the number of elements with label y we have:
Moreover, as in the seminal work of Breiman (2001), the leaf nodes contains the class distributions. During evaluation, an image x is successively routed left or right of each tree according to the outputs of the binary tests, until it reaches a leaf node. Each tree t thus returns the class distribution pt(y|x). The output prediction ŷ is thus given by averaging among the T trees of the forest:
Note that given the highly skewed label distribution showed in Table 2, balancing the dataset to train the classifiers is essential. For that matter, we apply class-wise downsampling of the bootstraps prior to learning each tree. As compared to alternative solutions (e.g., class weighting), downsampling leads to similar results compared to other alternatives (e.g., oversampling or class weighting), with a significantly reduced runtime, as described in Chen et al. (2004).
2.2.2.2. RF for Regression
As for regression, the impurity function measures the variance of the continuous variable yn distribution at node n with m examples and ȳ the average of variable yn over these examples:
Each leaf node contain the average of variable yn for all examples falling into that leaf. The output prediction of a RF can thus be obtained by averaging the value predicted by each separate tree:
Note that the method has to be adjusted when the predicted value is a vector. Generally speaking, when the prediction tasks are closely related (which is the case, for example, for regressing the quality of several expressions), training one regressor for predicting multiple values is better than training a model for each separate output dimension. Thus, as it was successfully applied for Action Unit detection (Dapogny et al., 2017), we train multi-output regression trees by selecting, for each node n, one regression task at random and computing the gain for that task only using Equations (3) and (6). This process allows to add extra randomization to the regression trees, which in turn increases the overall accuracy of the RF.
2.2.3. Visualization of Relevant Features
Given a previously trained RF model, we now want to visualize which features are the most important for classifying or regressing the different expression classes or quality values. To do that we propose a method based on the accumulation of information gain at each split node. To do that, we pass all the examples of the dataset (not just the out-of-bag samples) through the trees once again: for each split node n, we measure the information gain relatively to a transformed binary classification problem. Formally, we denote m(n) is the number of examples that pass down node n ∈ N, and 𝟙(ϕn, ϕ, f) an indicator function defined to have 𝟙(ϕn, ϕ, f) = 1 if ϕn and ϕ correspond to the same feature template and if feature point f appears in the parameters of the split function ϕn. The relative importance of a feature point f is given by:
With Z a normalization factor such that . We thus pass all the examples through the forest once again and build an accumulator in which the information gain for each node is stored for each combination of feature ϕ and feature point f. Designing such indicator function allows to test the relevance of a feature point (relatively to each feature template, geometric or appearance). By transforming a multi-class classification problem or regression problem to a binary classification problem, we can further test the relevance of a feature point to predict one specific class or (in case of a regression problem) a specific interval of values of a continuous variable.
In the case of a classification problem, we can for example visualize relevant features for distinguishing between one class y and every other class, by setting ỹn = 1 if yn = y, and 0 otherwise, for each node n. We can also set ỹn = 1 if yn = y and 0 if to visualize one class (represented by label y) vs. another one (represented by y′). In the latter case, all other elements are discarded during the computation of G(ỹn, ỹl(n), ỹr(n)). Lastly, If y is a continuous variable (e.g., the quality of an expression), we transform the regression problem in a binary classification problem by setting y* = 1 iff Θ1 > y > Θ2. We can thus vary the thresholds Θ1 and Θ2 to observe the variations of the selected feature repartition.
3. Experiments
In this Section, we first describe our experimental protocol in section 3.1. Then, in section 3.2, we study the predictive capacities of models trained on adults for discriminating children's FE in a cross-database fashion. Next, in section 3.3, we present results obtained by cross-validation on the JEMImE database. We also show in Section 3.4 that it is possible to reliably assess the FE quality using multi-output regression trees. In both the classification and regression case, we propose a visualization of the facial features extracted to decipher between the FEs, or between the different quality levels of FEs.
3.1. Experimental Setup
For cross-database evaluation, we train 7-class RF models and unit-normalize the probabilities outputted for classes neutral, happiness, anger, and sadness. Trees are trained by generating 20 distances features, 20 angles and 80 randomly samples HOG for each split node, with 25 thresholds per candidate feature. We grow 500 trees with a maximum depth of 16 for each experiment.
For intra-database experiments, RFs are evaluated using the Out-Of-Bag (OOB) error estimate (Breiman, 2001). More specifically, bootstraps for individual trees are generated at the subject level. Thus, during evaluation, each tree is applied only on subjects that were not used for its training. The OOB error estimate is an unbiased estimate of the true generalization error (Breiman, 2001) which is faster to compute than Leave-One-Subject-Out or k-fold cross-evaluation estimates. Also, it has been shown to be generally more pessimistic than traditional error estimates (Bylander, 2002), further emphasizing the quality of the proposed contributions. Finally, for FE classification we use the unweighted accuracy (trace of the confusion matrix) as the evaluation metric, as it is common in the literature. For regression we report both the mean squared error (MSE) as well as the correlation coefficient (CC).
3.2. Generalization Capacities of Models Trained on Adults
First, we study the applicability of RF models trained on databases from the literature for FER in cross-domain situations, and particularly on the JEMImE database.
3.2.1. Databases
There exists a large number of available FER databases. However, the purpose of this study is not to draw a comprehensive study on cross-databases performances of predictive model trained on each of these, but rather to assess whether or not these models generalize well-enough for predicting children FEs. Thus, we select three broadly used datasets that depict categorical and spontaneous FEs, as well as low intensity expressions. The datasets that we use in this study are the following ones:
The CK+ or Extended Cohn-Kanade database (Lucey et al., 2010) contains 123 subjects, each associated with various numbers of expression records. Those records show a gradual evolution from neutral toward one of the 6 universal FEs described by Ekman and Friesen (1971) (anger, happiness, sadness, fear, digust and surprise), plus contempt. Expressions are acted with no head pose variation and their duration is about 20 frames. From this dataset we extract 309 sequences, each one corresponding to one of the six basic expressions, and use the three first and last frames from these sequences for training. The extracted face crops are ~300 × 400 pixels.
The BU-4DFE database (Yin et al., 2008) contains 101 subjects, each one displaying 6 acted FEs with moderate head pose variations. Expressions are still prototypical but they are generally exhibited with much lower intensity and greater variability than in CK+. Sequence duration is about 100 frames. As the database does not contain frame-wise expression annotations, we manually selected neutral and apex of expression frames as in Dapogny et al. (2015). More specifically, we select 8, 219 frames for training. Face images are 520 × 696 pixels.
The FG-NET FEED database (Wallhoff et al., 2006) contains 19 subjects, each one recorded three times while performing seven spontaneous expressions (the six universal expressions, plus neutral). The data contain low-intensity emotions, very short expression displays, as well as moderate head pose variations. The extracted face images are roughly 120 × 150 pixels.
The JEMImE-Paris and JEMImE-Nice databases contains 1,458 and 2,110 examples, respectively, labeled with FE quality. The concatenated database is referred to as JEMImE-All and contains 3,781 samples. For FE classification, we only use the examples whose quality is rated higher than 7, making 534 and 1,312 examples for JEMImE-Paris and JEMImE-Nice, respectively, and a total of 1,846 examples.
3.2.2. Cross-Database Evaluation
Table 3 shows results obtained for cross-database evaluation of predictive models trained on the three databases, as well as a comparison with the internal (out-of-bag) error estimated on each of these databases for 4-class FE. Note that the baseline results (bolded in the table) are quite variable between the different databases. This indicate that FER on BU-4DFE is a more challenging benchmark than on CK+, due to low intensity expressions. FEED is even more challenging that the two others, due to the spontaneous nature of the expressions as well as the restricted number of subjects.
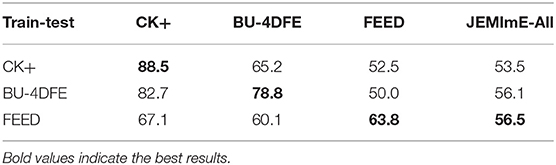
Table 3. Test on JEMImE (% accuracy).
Generally speaking, we observe a dramatic drop in performance when training on one database and testing on another database, when compared to the baseline accuracies. For instance, models trained on CK+ fail to recognize lower intensity or subtle spontaneous FEs. Models trained on prototypical data generalize poorly to spontaneous FER scenarios, and vice-versa. Furthermore, all these models generalize poorly on JEMImE database.
Table 4 displays per-FE accuracies on JEMImE database. We observe that happiness is generally correctly recognized even by models trained on prototypical data. Indeed, even low-intensity children smiles are generally associated with easily identifiable patterns (lip corner raise + cheek raise) that are essentially the same as prototypical smiles. However, the predictors seem to have a much harder time discriminating neutral, anger, and sadness. Due to the spontaneous nature of the expressions in FEED database, the recognition rates are a little higher for anger and sadness, although those are still pretty low.
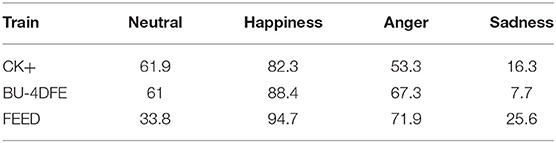
Table 4. Test on JEMImE-All.
To sum it up, FER is heavily dependent on the context and, in the frame of the JEMImE project, training on the JEMImE database will greatly enhance the predictive capacities of the classification models.
3.3. Generalization Capacities of Models Trained on Children
Next, in Table 5 we compare accuracies obtained by training classification models on JEMImE-Paris database, and testing on JEMImE-Nice, and vice-versa. Note however that the two databases were collected using a similar protocol and with the same sensors, so this benchmark does not exactly mimic cross-database scenarios presented in section 3.2.2. However, it provides some insight on the generalization capacities of predictive models in slightly different contexts—luminosity, as well as eventual regional discrepancies.
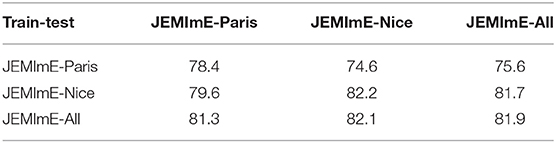
Table 5. Test on JEMImE (% accuracy).
Models trained on JEMImE-Paris does not generalize very well on JEMImE-NICE database, and therefore does pretty bad on the concatenated dataset JEMImE-All. Interestingly, we still observe a drop in performance when training on JEMImE-Nice and testing on JEMImE-Paris, so this can not be only attributed to the lower number of examples in JEMImE-Paris database.
Table 6 presents the per-FE classification scores on JEMImE-All database, along with the average accuracy among the FE classes. As one can see, the classifiers have different biases, as the model trained on JEMImE-Paris outputs better accuracies for neutral and happiness classes, with very poor performance for sadness. Indeed, sadness is the more subtle FE and we believe the low number of examples does not allow to efficiently capture the variability to describe this class. This is confirmed by the accuracies outputted by the models trained on JEMImE-Nice and JEMImE-All that allows more satisfying accuracies for anger and sadness. Table 7 shows the confusion matrix obtained for the best overall model, trained on JEMImE-All. Due to the sheer subtlety and variability of the FEs, anger is frequently misclassified as neutral and sadness is often confounded with either anger or neutral.
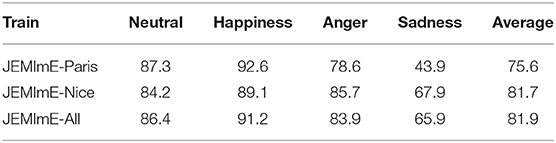
Table 6. Classification of facial expressions on JEMImE-All (% accuracy).
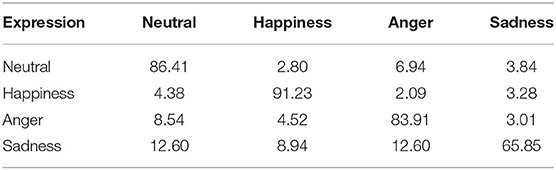
Table 7. Classification of facial expressions on JEMImE-All (% accuracy).
3.4. Expression Quality Assessment
Table 8 shows the accuracies of regression models trained on JEMImE-Paris, JEMImE-Nice and JEMImE-All and evaluated on JEMImE-All. We measured both the MSE and CC for regression models. Echoing the results reported in section 3.3, models trained on JEMImE-All have lower MSE and higher CC for all FEs, as compared to models trained on JEMImE-Paris and JEMImE-Nice.
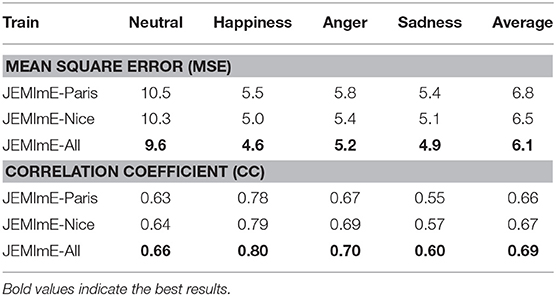
Table 8. Regression of facial expression quality on JEMImE-All.
Overall, the precision of the system for the different FEs seems satisfying, showing that we can not only reliably discriminate between childrens' FEs, but also provide relevant feedback on the quality of the FE display. However, in the case of regression, neutral is the least recognized FE, with a high MSE value and a CC on par with sadness.
3.5. Visualization of Relevant Features
3.5.1. Features for Classification
Figure 2 presents the relative importance of the different face areas for the facial expression classification task, using the method introduced in section 2.2.3. We grouped the features according to their nature, i.e., the template that was used to generate this feature, as well as its relevance for distinguishing between the presence or absence of a specific expression. For instance, expression happiness is mostly characterized by distances and angles related to the lip corners, as well as HOGs extracted on the cheeks (triangles between feature points from the lip corners and eye corners). Anger is most notably characterized by features extracted around the eye/eyebrows region, as well as texture information sampled from the outer eye corners and between the eyes, which respectively advocate for eye closure and eyebrow frowning. Sadness mainly requires distance features from the mouth corner (lip corner depressor) along with angles and HOGs extracted between the eyes and on the inner brows. Neutral presents a feature repartition quite similar to happiness with a little more importance of geometric features located on the eyebrows, which helps the models to distinguish it from anger and sadness.
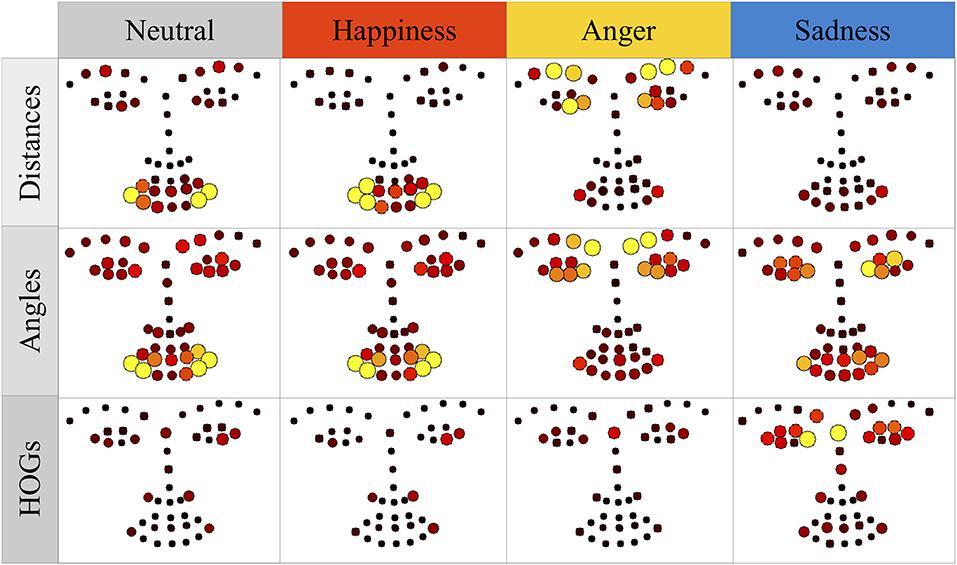
Figure 2. Most relevant features for FE classification (one vs. all). Best viewed in color.
This visualization scheme allow to analyze features extracted relatively to one class against every other class. Conversely, we can also visualize features extracted in a one-vs.-one manner, i.e., plotting each class against each other. The results are compiled in Figure 3. Those results are obtained by tweaking Equation (8) with indicator functions returning 1 for one expression (y-axis on Figure 3) and 0 for another specific one (x-axis on Figure 3). As such visualization is essentially symmetric, we only display the upper diagonal elements of this pseudo-confusion matrix. First, happiness can be distinguished from any other expression using mostly lip corner features. Anger vs. neutral involves features located around the eyes (nose wrinkle) as well as inner brow lowering. Distinguishing sadness from neutral is more reliant on lip corner depressor. Finally, sadness vs. anger is heavily reliant on inner brow raise and nose wrinkles as well as lip corner depressor.
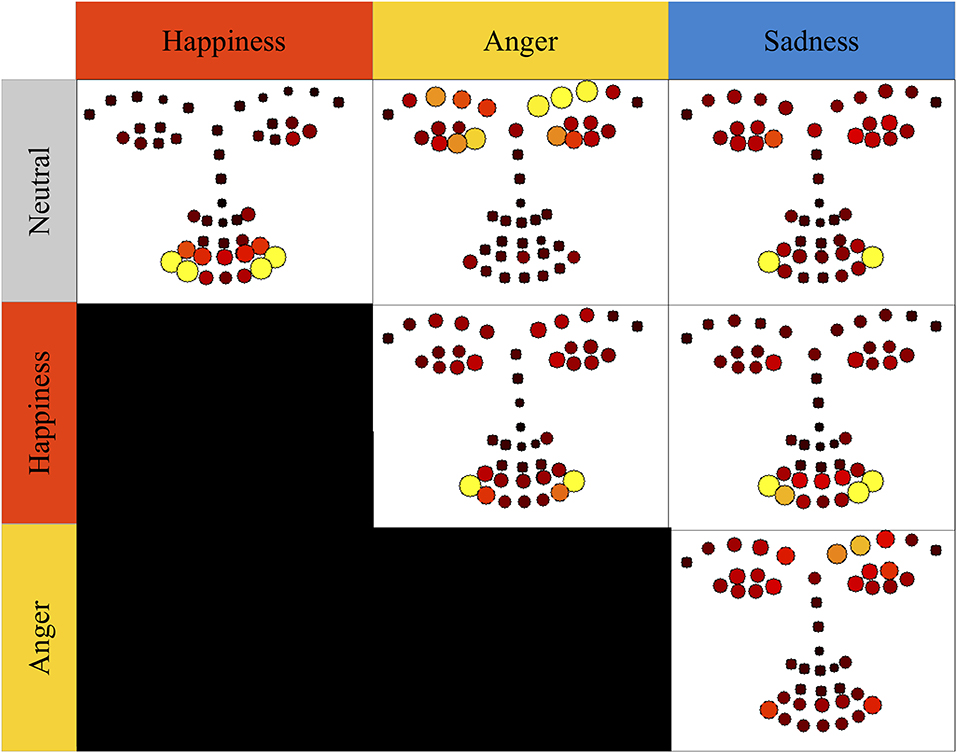
Figure 3. Most relevant features for FE classification (one vs. one).
3.5.2. Features for Quality Regression
Figure 4 shows a visualization of the selected features for the multi-output regression model. We see that the selected features are qualitatively very similar for deciphering high (quality > 7) and low (quality < 3) quality expressions. Thus, the extracted features are very stable, and the results echoes the analysis of the classification model. Overall, we can see that high quality is more reliant on texture information, particularly in areas like between the eyes (presence/absence of nose wrinkle) or eye corners (lid tightening/opening), and less on geometric features, particularly the distances. Indeed, high quality FEs are characterized by very “pure” patterns that excludes any other FE, e.g., high quality happiness shall exclude any nose wrinkle, which is specific to anger. Conversely, a display of anger without any nose wrinkle may be misclassified as sadness. Hereby, its quality is likely to be rated down. Interestingly, intermediate quality (3 < quality < 7) FEs are less reliant on distance features, with more emphasis on angles and texture. Indeed, recall that this quality zone is where FEs are correctly recognized, but not credible. Thus, the models have to fetch subtle features, such as wrinkles for happiness, lip corner pull or mouth opening while expressing sadness.
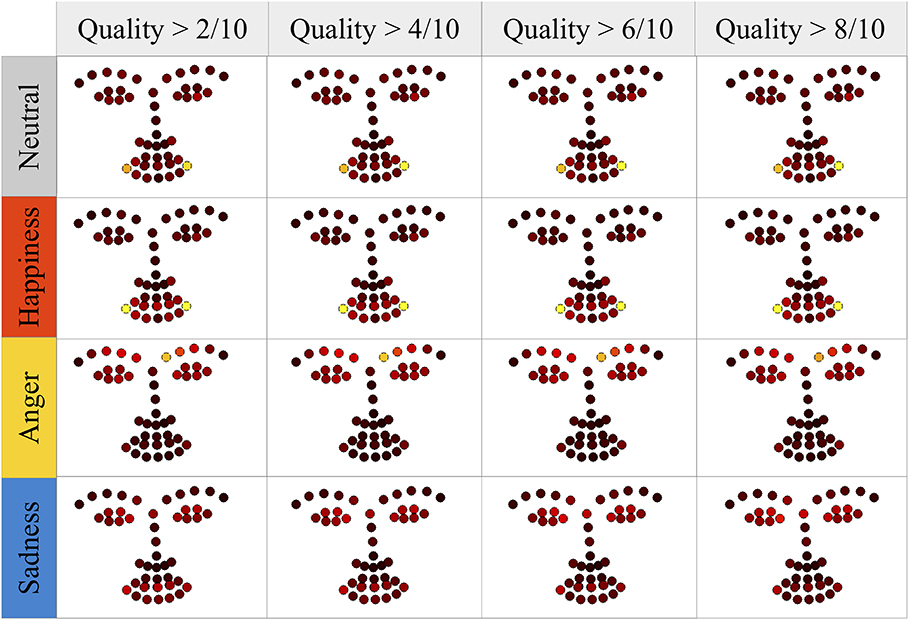
Figure 4. Visualization of features relevant for quality regression. Big, yellow circles indicate a large importance of a feature and face area. Conversely, small and black circles suggest a low relevance. Best viewed in color.
In particular, distinguishing the different quality levels for neutral and happiness involve geometric features extracted from the mouth area, in addition to appearance features extracted around the eyelid, particularly for intermediate quality levels. Anger involves both kinds of features extracted around the eyes and eyebrows and sadness involves a combination of both angle and texture features distributed around the mouth and eyelid, respectively.
4. Discussion and Conclusion
Throughout this work, we tackled the issue of designing classification and regression models to decipher FEs, and more precisely FE quality among children subjects. In particular, we studied the transferability of models trained for FER on adults to children, showing that such models do not generalize well to unseen children data, due to a combination of domain gaps in expressive behavior and environmental recording conditions. Furthermore, the existing FER databases appear as limited in some fashion, whether it concerns the number of subjects, the recording modality, or the nature of the annotation. This motivated us to gather a large database of children FE records involving several modalities that we call the JEMImE database. Most notably, FEs in JEMImE are annotated not only in terms of categorical FEs, but also in term of FE quality, which is a step toward more precise annotation of facial behavior.
Furthermore, we implemented a FER pipeline for FE classification and quality regression, that uses a random forest algorithm trained upon a combination of geometric and appearance features. Such models allows high recognition rates and offer the possibility to visualize relevant features for each expression. We showed that, contrarily to such model trained on adult FE databases, RF models trained on JEMImE database generalize far better on children, both for FE classification and quality regression. Last but not least, we proposed a visualization scheme based on the accumulation of information gain metric for random forest predicts, which shows the most useful features and regions used to discriminate each FE or FE quality level.
While the present work focuses on describing JEMImE database and showing its interest for training and evaluating FER systems for categorical FE classification as well as FE quality regression, there remains a lot of work to be done to investigate the possibilities offered by its rich annotation and experimental protocol. First, from a machine learning standpoint, we only benchmarked with a specific (RF) framework for FER. Though using other algorithms is out of the scope of this study, we conducted some experiments using deep neural networks, that did not significantly outperform RFs. The reasons for this stems from the difficulty to integrate heterogeneous data (such as landmarks and face crops) as well as the low numbers of training examples that make some sort of transfer learning a necessity. More investigations will be required to assess the capacity of such models for future studies. Furthermore, there is still a lot of work to be done to explore the possibilities offered by JEMImE database: for instance, was the on request task better at eliciting FEs, compared to the imitation task? How did the corresponding FEs fare in these two scenarios in terms of FE quality? Would an automated system be able to learn from one and predict the other, and vice-versa? The same questions can be asked for the different modalities (audio/visual). Last but not least, there is still a long road to validate the effectiveness of the presented children FER pipeline for providing real-time feedback for helping ASD children to produce adequate FEs given a social context, which is the ultimate motivation of this work.
As such, future work is 2-folds: first, we will work on the FE recognition models to enhance robustness to head pose variations and partial occlusions. Second, we will integrate the proposed FE recognition and quality regression methods inside JEMImE serious game solution, and validate its usefulness for helping children with ASD to produce realistic FEs, from a clinical standpoint.
Data Availability Statement
The dataset for this manuscript is not publicly available because of the sensitivity of the data (video recordings of minor children).
Ethics Statement
The studies involving human participants were reviewed and approved by the ethical committee of Nice University (Comité de Protection des Personnes Sud Méditerranée) under the number 15-HPNCL-02. Written informed consent for participation was not required for this study in accordance with the national legislation and the institutional requirements.
Author Contributions
AD, CG, and KB: manuscript writing. AD and KB: technical conception. AD: technical development. CG, SH, SS, OG, and DC: protocol, acquisition, and interpretation of data. All authors read, revised, and approved the final manuscript.
Funding
This work has been supported by the French National Agency (ANR) in the frame of its Technological Research CONTINT program (JEMImE, project number ANR-13-CORD-0004) and JCJC program (FACIL, project ANR-17-CE33-0002).
Conflict of Interest
The authors participated in JEMImE serious game development. However, they were all working for Public University with non-profit contract. This research has been conducted in the absence of any commercial or financial relationships that could be considered as a potential conflict of interest.
Acknowledgments
This article is an extended version of a previously published paper (Dapogny et al., 2018).
References
Barrett, L. F., Mesquita, B., and Gendron, M. (2011). Context in emotion perception. Curr. Direct. Psychol. Sci. 20, 286–290. doi: 10.1177/0963721411422522
Bylander, T. (2002). Estimating generalization error on two-class datasets using out-of-bag estimates. Mach. Learn. 48, 287–297. doi: 10.1023/A:1013964023376
Chen, C., Liaw, A., and Breiman, L. (2004). Using Random Forest to Learn Imbalanced Data. Department of Statistics, UC Berkeley Tech Report.
Cockburn, J., Bartlett, M., Tanaka, J., Movellan, J., Pierce, M., and Schultz, R. (2008). “Smilemaze: a tutoring system in real-time facial expression perception and production in children with autism spectrum disorder,” in ECAG 2008 Workshop Facial and Bodily Expressions for Control and Adaptation of Games (Amsterdam), 3.
Dalrymple, K. A., Gomez, J., and Duchaine, B. (2013). The dartmouth database of children's faces: acquisition and validation of a new face stimulus set. PLoS ONE 8:e79131. doi: 10.1371/journal.pone.0079131
Dapogny, A., Bailly, K., and Dubuisson, S. (2015). “Pairwise conditional random forests for facial expression recognition,” in International Conference on Computer Vision (Santiago).
Dapogny, A., Bailly, K., and Dubuisson, S. (2017). “Multi-output random forests for facial action unit detection,” in 2017 12th IEEE International Conference on Automatic Face & Gesture Recognition (FG 2017) (Washington, DC: IEEE), 135–140.
Dapogny, A., Grossard, C., Hun, S., Serret, S., Bourgeois, J., Jean-Marie, H., Foulon, P., et al. (2018). “Jemime: A serious game to teach children with asd how to adequately produce facial expressions,” in 2018 13th IEEE International Conference on Automatic Face Gesture Recognition (FG 2018) (X'ian), 723–730.
Dollár, P., Tu, Z., Perona, P., and Belongie, S. (2009). “Integral channel features,” in British Machine Vision Conference.
Egger, H. L., Pine, D. S., Nelson, E., Leibenluft, E., Ernst, M., Towbin, K. E., et al. (2011). The nimh child emotional faces picture set (NIMH-chEFS): a new set of children's facial emotion stimuli. Int. J. Methods Psychiatr. Res. 20, 145–156. doi: 10.1002/mpr.343
Ekman, P., and Friesen, W. (1971). Constants across cultures in the face and emotion. J. Pers. Soc. Psychol. 17:124. doi: 10.1037/h0030377
Fernandes, T., Alves, S., Miranda, J., Queirós, C., and Orvalho, V. (2011). “Lifeisgame: a facial character animation system to help recognize facial expressions,” in International Conference on Enterprise Information Systems (Beijing: Springer), 423–432.
Izard, C. E. (2001). Emotional intelligence or adaptive emotions? Emotion 1, 249–257. doi: 10.1037//1528-3542.1.3.249
Khan, R. A., Crenn, A., Meyer, A., and Bouakaz, S. (2019). A novel database of children's spontaneous facial expressions (LIRIS-CSE). Image Vis. Comput. 83, 61–69. doi: 10.1016/j.imavis.2019.02.004
Langner, O., Dotsch, R., Bijlstra, G., Wigboldus, D. H., Hawk, S. T., and Van Knippenberg, A. (2010). Presentation and validation of the radboud faces database. Cognit. Emot. 24, 1377–1388. doi: 10.1080/02699930903485076
LoBue, V., and Thrasher, C. (2015). The child affective facial expression (cafe) set: validity and reliability from untrained adults. Front. Psychol. 5:1532. doi: 10.3389/fpsyg.2014.01532
Lucey, P., Cohn, J. F., Kanade, T., Saragih, J., Ambadar, Z., and Matthews, I. (2010). “The extended Cohn-Kanade dataset (CK+): a complete dataset for action unit and emotion-specified expression,” in International Conference on Computer Vision and Pattern Recognition Workshops (San Fransisco, CA), 94–101.
Nojavanasghari, B., Baltrušaitis, T., Hughes, C. E., and Morency, L.-P. (2016). “Emoreact: a multimodal approach and dataset for recognizing emotional responses in children,” in Proceedings of the 18th ACM International Conference on Multimodal Interaction (Tokyo: ACM), 137–144.
Park, J. H., Abirached, B., and Zhang, Y. (2012). “A framework for designing assistive technologies for teaching children with asds emotions,” in CHI'12 Extended Abstracts on Human Factors in Computing Systems (Austin, TX), 2423–2428.
Spence, S. H. (2003). Social skills training with children and young people: theory, evidence and practice. Child Adolesc. Mental Health 8, 84–96. doi: 10.1111/1475-3588.00051
Tan, C. T., Harrold, N., and Rosser, D. (2013). “Can you copyme?: an expression mimicking serious game,” in SIGGRAPH Asia 2013 Symposium on Mobile Graphics and Interactive Applications (Hong Kong: ACM), 73.
Viola, P., and Jones, M. (2001). “Rapid object detection using a boosted cascade of simple features,” in International Conference on Computer Vision and Pattern Recognition, Vol. 1 (Kauai), I–I.
Wallhoff, F., Schuller, B., Hawellek, M., and Rigoll, G. (2006). “Efficient recognition of authentic dynamic facial expressions on the feedtum database,” in ICME (Toronto, ON: IEEE Computer Society), 493–496.
Xiong, X., and De la Torre, F. (2013). “Supervised descent method and its applications to face alignment,” in International Conference on Computer Vision and Pattern Recognition (Portland), 532–539.
Keywords: facial expression recognition, expression quality, random forests, emotion, children, dataset
Citation: Dapogny A, Grossard C, Hun S, Serret S, Grynszpan O, Dubuisson S, Cohen D and Bailly K (2019) On Automatically Assessing Children's Facial Expressions Quality: A Study, Database, and Protocol. Front. Comput. Sci. 1:5. doi: 10.3389/fcomp.2019.00005
Received: 21 May 2019; Accepted: 26 September 2019;
Published: 11 October 2019.
Edited by:
Anna Esposito, University of Campania Luigi Vanvitelli, ItalyReviewed by:
Benjamin Cowley, University of Helsinki, FinlandCarlos Vaz De Carvalho, Polytechnic Institute of Porto, Portugal
Copyright © 2019 Dapogny, Grossard, Hun, Serret, Grynszpan, Dubuisson, Cohen and Bailly. This is an open-access article distributed under the terms of the Creative Commons Attribution License (CC BY). The use, distribution or reproduction in other forums is permitted, provided the original author(s) and the copyright owner(s) are credited and that the original publication in this journal is cited, in accordance with accepted academic practice. No use, distribution or reproduction is permitted which does not comply with these terms.
*Correspondence: Kevin Bailly, a2V2aW4uYmFpbGx5QHNvcmJvbm5lLXVuaXZlcnNpdGUuZnI=