- 1Walker Department of Mechanical Engineering, The University of Texas at Austin, Austin, TX, United States
- 2The MathWorks, Inc., Natick, MA, United States
With the huge and ever-growing volume of industrial data, an enormous challenge of how this data should be handled, stored, and analyzed emerges. In this paper, we describe a novel method that facilitates automated signal parsing into a set of exhaustive and mutually exclusive segments, which is coupled with extraction of physically interpretable signatures that characterize those segments. The resulting numerical signatures can be used to approximate a wide range of signals within some arbitrary accuracy, thus effectively turning the aforementioned signal parsing and signature extraction procedure into a signal compression process. This compression converts raw signals into physically plausible and interpretable features that can then be directly mined in order to extract useful information via anomaly detection and characterization, quality prediction, or process control. In addition, distance-based unsupervised clustering is utilized to organize the compressed data into a tree-structured database enabling rapid searches through the data and consequently facilitating efficient data mining. Application of the aforementioned methods to multiple large datasets of sensor readings collected from several advanced manufacturing plants showed the feasibility of physics-inspired compression of industrial data, as well as tremendous gains in terms of search speeds when compressed data were organized into a distance-based, tree-structured database.
Introduction
It is not widely known that industrial equipment already generates more data than computer and social networks, with almost double the growth rate, leading to tremendous amounts of pertinent data (Kalyanaraman, 2016). This provides an ever-growing opportunity to mine that data for useful information via e.g., prediction of outgoing product quality, process monitoring and control or optimization of operations.
Nevertheless, applications of Artificial Intelligence (AI) and Machine Learning (ML) in industry are lagging behind advancements in the realm of computer and social networks (Nasrabadi, 2007). The main reason is that the nature and characteristics of the data in physical processes or industrial internet of things (Gilchrist, 2016) are different from what we see in computer and social networks (Atzori et al., 2010). In the realm of computer science, information about events that are relevant to modeling and characterization of the underlying system are directly available in the data—e.g., who is talking to whom, for how long and what the relevant locations are, or which website you are on, for how long and which website you are going to go after that, etc. On the other hand, in the industrial internet of things (IIoT), events are embedded in the data and are not directly visible. For instance, beginning and ending moments of a reaction in a chemical reactor, or moment and location of particle emission and trajectory of that particle in a semiconductor vacuum tool—all this information is not directly observable and is embedded in the signals emitted during the corresponding processes. Finding and characterizing such events in industrial data can link the mining of useful information from those signals to the realm of discrete mathematics and thus leverage tremendous advancements of AI and ML in the domains of computer and social networks. The work presented in this paper can be seen as an effort in the direction of establishing such a link.
At this moment, let us note that one of the main problems in utilizing the ever-growing volume of industrial data is the way that the data is handled at the very source. When it comes to sensor readings from manufacturing machines and equipment, industries tend to store the raw time-series (Kendall and Ord, 1990), with occasional use of various, usually lossless compression methods adopted from computer science in order to cope with the enormous data volumes (Sayood, 2002). These compression tools, such as run-length based compression (Hauck, 1986), Huffman compression (Tharini and Ranjan, 2009), delta compression appliance (Mogul et al., 2002), or the Lempel–Ziv–Welch (LZW) compression methods (Ping, 2002), are inherently designed to maximize compression rates, while minimizing information loss.
The purpose of the aforementioned compression tools is to turn raw signals into a set of coefficients that is much smaller than the original signal and is able to represent it perfectly, or very close to perfection, thus achieving compression and enabling storage of larger amounts of data. However, the resulting coefficients in the compressed domain do not have any relevance to the physical characteristics of the relevant processes and in order to perform mining of useful information from such data, one needs to decompress (reconstruct) the signal and extract the informative signatures out of it (Alves, 2018), as illustrated in Figure 1. Those informative signatures include metrics such as mean value, standard deviation, peak-to-peak values and other, usually statistics-inspired or expert-knowledge based quantities calculated for one or multiple signal portions deemed to be interesting for the data mining process1.
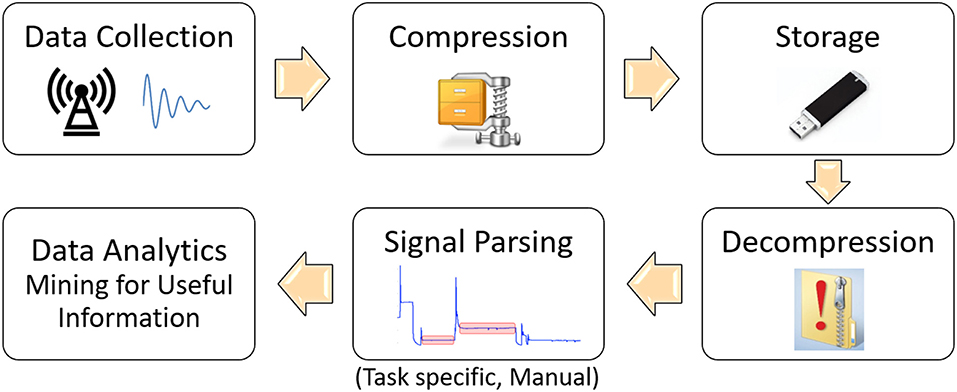
Figure 1. Illustration of the traditional data processing and management for data mining in manufacturing.
Nevertheless, determination of the informative signal portions and relevant signatures involves a tremendous amount of expert process knowledge to insure the necessary information is indeed embedded in them (Djurdjanovic, 2018), which inherently makes this stage subjective and error prone. In addition, one is effectively blind to events in signal segments that were not selected for analysis, or to whatever is not depicted in the characteristics extracted from the raw signals. These drawbacks will be addressed in this paper by introducing a method for automated time-domain based segmentation of a signal into a set of exhaustive and mutually exclusive segments of steady state and transient behaviors, out of which we will extract a set of statistics-based and dynamics-inspired signatures that approximate the signal in those segments. Based on such signal segmentation and signatures extracted from each segment, one could approximately reconstruct the signal, which means that this procedure could be seen as a signal compression tool. In addition, physical interpretability of the newly proposed signal segmentation and signature extraction will enable mining for useful information about the underlying process directly in that compressed domain, without blind spots (segments) and without the need for human involvement in the process of signal parsing and extraction of signatures. Figure 2 illustrates the novel data curation process that could be facilitated via the methods proposed in this paper.

Figure 2. Illustration of the newly enabled paradigm for data processing and management for data mining in manufacturing.
More details can be found in the rest of the paper, which is organized as follows. In Methodology section, we will present the method for automated parsing of signals into a set of exhaustive and mutually exclusive steady state and transient segments, along with methods to characterize those segments using a set of physically interpretable signatures that facilitate approximate reconstruction of the signal and thus can be seen as its approximate compression. Furthermore, this section will present an approach to organize the compressed data into a distance-based tree structure that is much more efficient for search and retrieval than the temporally organized, list-based database structure traditionally utilized for industrial data. In Result section, we will present results of applying the newly introduced data compression and organization methods to sensor data gathered from several modern semiconductor manufacturing fabs. Finally, Conclusion and future work section gives conclusions of the research presented in this paper and outlines possible directions for future work.
Methodology
This section describes the novel physically-inspired data compression and management methodology. In Physics-inspired signal parsing & feature extraction for approximate signal compression section, the method for automated signal parsing and signature extraction will be explained, including a novel method for approximation-oriented physically-interpretable characterization of automatically detected transient portions of the signal. This signature extraction approach enables better reconstruction of the signal than what can be achieved using signal characterization based on only standard transient features described in IEEE 2011 (Pautlier et al., 2011). In Tree-structured data organization section, a distance-based tree-structured organization of industrial data will be proposed, enabling quick and accurate search of industrial databases directly in the compressed domain of coefficients extracted from the signals.
Physics-Inspired Signal Parsing & Feature Extraction for Approximate Signal Compression
Traditional signal parsing in the time domain is performed using human-defined windows based on physical knowledge of the process and human expertise. Such signal windows are selected usually because they correspond to a key portion of the process or are for whatever reason known or assumed to contain useful information. This often implies that the analysis ends up focusing on the steady state portions of the signals, where the processes actually take place. From these portions, a number of time and/or frequency domain signatures can be extracted, including mean, standard deviation, kurtosis, frequency peak locations and intensities, instantaneous frequency, group delay and so on. Consequently, large portions of the signal can be left unanalyzed, especially if the signal contains significant portions of transient behaviors (Kazemi, 1969; Hughes et al., 1979; Ramirez-Nunez, 2018; Yeap et al., 2018). Figure 3 illustrates such traditional signal parsing based on user-defined windows, which leads to blind spots, redundancies in signatures and usually leaves out of the analysis process at least some (usually many or all) transient signal portions.
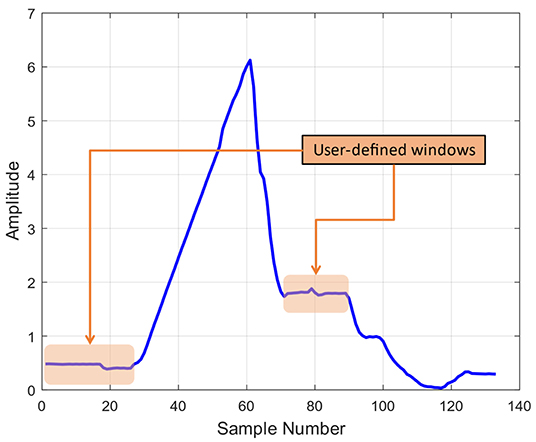
Figure 3. Illustration of signal windowing utilized in traditional signal parsing and feature extraction.
Recent publication (Haq et al., 2016) proposed a method for automatic segmentation of time-domain signal descriptions into a series of exhaustive and mutually exclusive segments of transient and steady state behaviors, as illustrated in Figure 4. From each steady state, statistics-inspired features, such as segment durations, or expected value and standard deviations of the sensor readings within the segment are extracted. On the other hand, from the transient portions, standard dynamics-inspired features, such as transition amplitudes, settling times, rise times, as well as post-shoot and pre-shoot features are derived (Pautlier et al., 2011). This ability for automated mining of the entire signal rather than only a selected subset of its portions led to great improvements in virtual metrology (Haq and Djurdjanovic, 2016) and defectivity analysis (Haq and Djurdjanovic, 2019) in advanced semiconductor manufacturing.
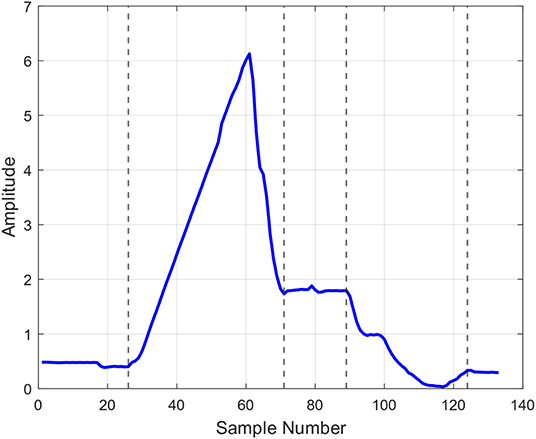
Figure 4. Result of applying the automated signal parsing method introduced in (Haq et al., 2016) to the same signal as the one shown in Figure 3.
In addition, this automatic signal analysis opens the door to a significantly novel way of managing and utilizing densely sampled machine signals that are increasingly frequently encountered in modern industry. Namely, we can fully leverage the automatic parsing capabilities reported in (Haq et al., 2016) to enable encoding of a raw signal via a set of physically-interpretable statistical and dynamics-inspired signatures that compress the data into a domain which can be directly mined.
More specifically, within each transient segment, we can approximate the data using linear combination of sufficiently many complex exponential functions of the form
where ŷ(t) is the compressed transient model and for a given model order N, coefficients2 Ci and λi can be determined using the well-known least squares fitting to the data. This form can be seen as a decomposition of a signal segment into contributions each of which can be associated with a dynamic mode of a linear differential equation (coefficients λi can be seen as roots of the characteristic polynomial of the differential equation that generated that segment, while coefficients Ci can be seen as strengths of the corresponding dynamic contribution to that segment). In this paper, the appropriate model order N in (1) was determined using Akaike Information Criterion3 (AIC) (Sakamoto et al., 1986), though other information-theoretical or statistical approaches could be utilized for this purpose. Moreover, in addition to what was reported in (Haq et al., 2016), for each transient portion of the signal we also evaluated whether it can be better described as a single segment of form (1), or as a concatenation of two distinct segments of that form4, with the more favorable option also selected using the AIC metric.
The original signals can be approximately reconstructed utilizing the signatures extracted from the steady state and transient segments. Specifically, in this paper, each steady state segment was approximated via the expected value of the amplitudes of the data points in that segment, while Equation (1) fit to any given transient section of the signal was used to approximate that signal portion.
In order to evaluate the efficacy of reconstructing the original signal from the compressed domain, adjusted R-squared (R2) metric is utilized (Miles, 2014). Furthermore, in order to evaluate compression efficacy of our approach, we employ the intuitive metric expressing compression rate as
where NC is the number of coefficients (approximately) representing the signal in the compressed domain and L is the total length of the original signal.
In order to facilitate comparison and mining of the extracted signatures, one must ensure that corresponding signal segments populate consistent portions of the feature vector. Namely, though signals emitted by industrial processes usually have a fairly consistent structure, with a great majority of them having consistent number of segments, inherent process noise and inconsistencies could lead to situations when some of the signals have a slightly5 larger or smaller number of segments, as compared to the majority of signals (Kosir and DeWall, 1994; Haq et al., 2016). For example, Figure 5 shows signals emitted by the same sensor during processing of 4 distinct wafers in a semiconductor manufacturing tool. Signals A and B are two different signals with the segmentation form that appeared most frequently in that process, while Signal C contains two extra segments and Signal D has a missing segment. All these signals with different feature vectors need to be aligned in order to be consistently compared.
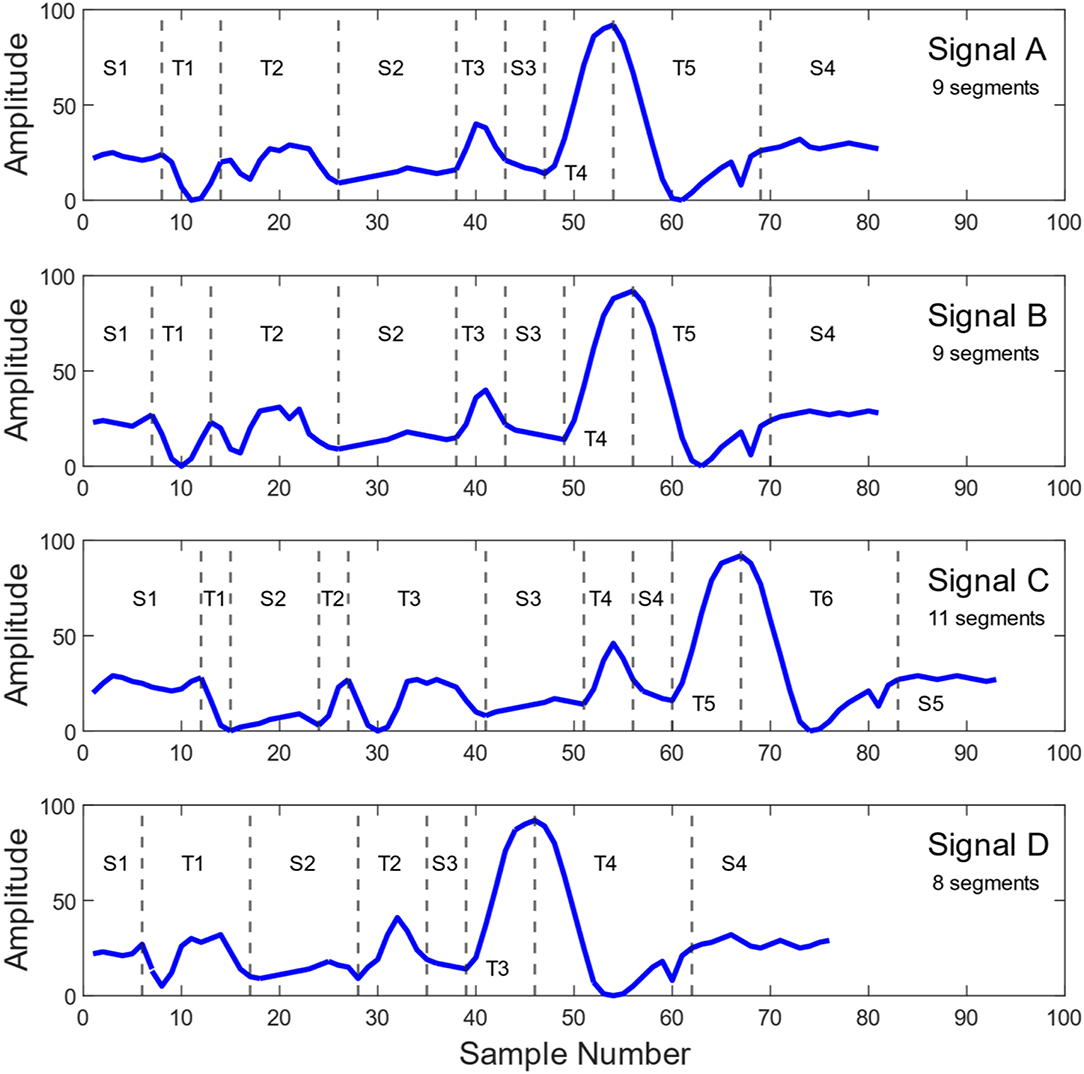
Figure 5. Four distinct signals from a throttle valve angle sensor used in a Plasma Enhanced Chemical Vapor Deposition (PECVD) process operating in a major 300 mm wafer semiconductor fab. Signals (A,B) have the segmentation that appeared most frequently among the relevant process signals. Compared to signals (A,B), signal (C) has one additional steady state segment and one additional transient segment. Signal (D) has one missing transient compared to signals (A,B). Please note that steady state and transient segments are denoted as “S” and “T,” respectively.
In order to perform the alignment of feature vectors, we identify all feature vectors in the available data that have the maximum number of segments and use them to create a standard vector, , that has the same (maximal) number of steady-state and transient segments, each of which is characterized by averages of relevant coefficients, with any order inconsistencies within transient segments being resolved by adding appropriate number of zeros to lower order transients. For a feature vector that has fewer segments compared to the standard vector, we add appropriate placeholder segments to match the number and type of segments (steady state or transient) between that feature vector and the standard vector. Each steady state placeholder segment was characterized by statistical characteristics set to zero (duration, mean, standard deviation, kurtosis, min, max, etc.), while each transient placeholder segment was characterized by the duration and all dynamic coefficients Ci and λi set to zero, with the number of dynamic coefficients in the transient placeholder depending on where in the signal it was inserted. The appropriate locations for placeholder insertions were found by evaluating all possibilities, with each candidate insertion option yielding a feature vector of the same dimensionality as the standard vector , and its similarity to the standard vector being evaluated via the cosine between the two vectors
where 〈·, ·〉 denotes Euclidean inner product between two vectors and ||·|| denotes the corresponding vector norm. The option that yielded the highest similarity metric (3), i.e., insertion option that ended being the most co-linear with the standard vector was ultimately chosen. Figure 6 demonstrates how the proposed alignment methodology is performed in a situation where a feature vector with a missing transient segment is being aligned to the standard vector6.
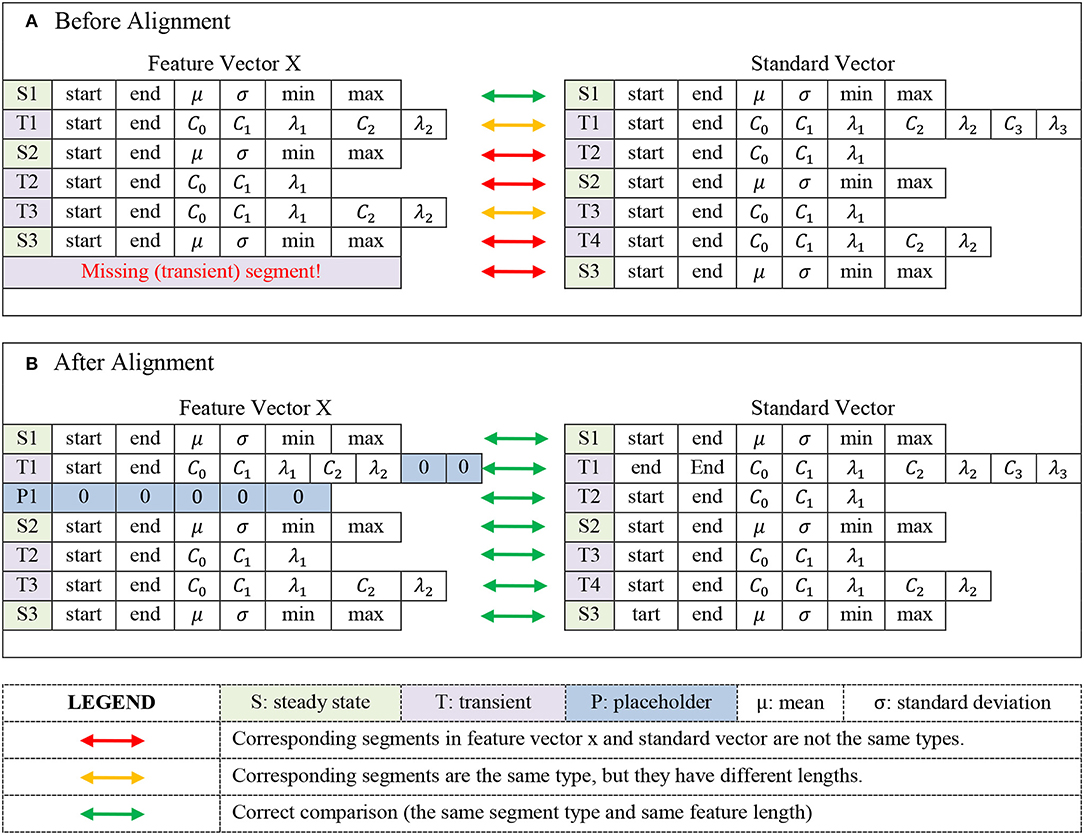
Figure 6. Illustration of comparison between a feature vector with one missing segment and the standard vector before the alignment (A), and after the alignment (B). Based on segmentation of the standard vector, feature vector X misses a transient segment and hence, a placeholder corresponding to a transient segment should be inserted into it. Plot (B) illustrates how segments in the feature vector X are aligned with their corresponding segments in the standard vector by inserting a transient placeholder between segments T1 and S2 of the signal X, as well as by adding appropriate number of zeros to the set of C and λ coefficients in the T1 segment. Please note that insertion location for the transient placeholder is determined via the method described in sec Physics-inspired signal parsing & feature extraction for approximate signal compression.
It should be noted that as new data arrives, one could observe new feature vectors containing extra segments compared to the standard vector. In that case, the standard vector can be updated and all previously collected and aligned feature vectors would then need to be realigned based on the new standard vector. This could obviously be a rather computationally involved process, especially in large datasets. Nevertheless, our experience with real industrial data indicates that after a certain amount of data, the standard vector settles and rarely gets changed. Hence, it is recommended to perform feature vector alignments using sizeable initial datasets in order to make arrivals of feature vectors with extra segments less likely.
Tree-Structured Data Organization
Indexed databases with tree-based structures can be searched with logarithmic gains over databases organized as lists (Ramakrishnan and Gehrke, 2000). This is well-known within the computer science community, but is less known within the general engineering, and especially manufacturing research and practice communities. Recently, Aremu et al. (2018) suggested what is essentially a tree-based organization of industrial databases for the purpose of data curation for condition monitoring. The authors propose a hierarchical organization of the industrial data based on a number of criteria, including the underlying equipment condition and behavior modes. Nevertheless, the details of how to differentiate those condition and behavior modes when such information is not explicitly visible in the data, which is usually the case in real-life industrial processes, was not discussed. In addition, the authors did not discuss nor demonstrate quantitative benefits of such data organization.
To that end, in this paper, we propose the use of unsupervised clustering to autonomously identify underlying operating modes and conditions that are embedded in the physically-interpretable signatures obtained via compression of equipment sensor readings described in the previous section. Specifically, we use a Fritzke's growing gas based Growing Self-Organizing Map (GSOM) (Fritzke, 1994, 1995) to represent a given database of equipment sensor signatures via an appropriate number of clusters of data entries that are near to each other, as expressed via some distance matric7. GSOM-based clustering is accomplished through growth and adaptation of so-called weight vectors that tessellate the underlying data space into Voronoi sets, each of which consists of points that are nearest to a specific weight vector in the GSOM (Kohonen, 1990). Each cluster is formed by data entries that are inside a specific Voronoi set, which means that the data inside a cluster are closer to the weight vector associated with that cluster than any other weight vector in the GSOM. Following abundant research in machine condition-monitoring (Siegel and Lee, 2011; Lapira et al., 2012; Siegel, 2013; Hendrickx et al., 2020), clusters yielded by unsupervised clustering of equipment sensor signatures, such as those extracted through physically-interpretable compression described in section Physics-inspired signal parsing & feature extraction for approximate signal compression, can be seen as representative of the underlying equipment condition and operating regimes, and can thus serve as the foundation for the hierarchical tree-based organization of databases of those signatures.
Figure 7 illustrates the structure of such a database. Searching within it would consist of first identifying the nearest GSOM weight vector, thus identifying the cluster of entries similar to the query entry, after which only entries inside that cluster should be searched rather than the entire database. Of course, with large size databases, the number of clusters in the GSOM could grow as well, leading to the possibility to cluster the weight vectors (clusters) themselves and facilitate a multi-level tree-based database, as reported in (Sabbagh et al., 2020). Generally, such a “divide and conquer” approach that focuses the search onto areas of the database that are similar to the query item rather than exploring the whole database is the key factor enabling logarithmic acceleration of searches within such hierarchical, tree-based databases (Chow and Rahman, 2009).

Figure 7. Tree-based database organization enabled by unsupervised clustering of equipment signatures implemented using self-organizing maps (SOM).
The abovementioned acceleration, however, does come with some costs. Namely, if a query items falls close to the boundary of a Voronoi set (i.e., close to the boundary of a cluster), then some database entries similar to it could reside in the neighboring cluster or clusters. Search that focuses only on the cluster to which that query item belongs (i.e., only to the cluster corresponding to the weight vector nearest to the query item) will miss entries that reside in the neighboring clusters, which leads to deteriorated search precision and recall metrics (Buckland and Gey, 1994; Bhattacharya, 2014). These problems are well-known in computer science, which is why searches in tree-based databases can be augmented by expanding the search to database sections in the neighborhood of the section identified in the initial stages of the search (leaves of the database tree that are in the neighborhood of the tree leaf to which the search initially focuses). Consequently, in this paper, we explored possibilities to search database clusters in the topological neighborhood of the cluster identified by the nearest (best matching) GSOM weight vector (Balaban, 1982). Such expanded search takes longer time to accomplish, but it improves the search precision and recall metrics.
Results
The newly proposed data compression methodology described in Physics-inspired signal parsing & feature extraction for approximate signal compression section of this paper was evaluated on two large datasets. One of those datasets (Dataset A) includes sensor readings obtained from a Plasma Enhanced Chemical Vapor Deposition (PECVD) process performed on a 300 mm wafer tool operating in a major semiconductor manufacturing fab. Sensor readings in Dataset A were collected from 50 different sensors at a 10 Hz sampling rate during production of over 45,000 wafers. The other dataset (Dataset B) contains sensor readings emitted by a 300 mm wafer plasma etch tool operating in another high-volume semiconductor manufacturing fab. Dataset B contains readings from 110 different sensors collected at 5 Hz during etching of 4,500 wafers.
Table 1 summarizes key metrics characterizing the compression rates and signal reconstruction performance in the relevant datasets. In terms of computational times8, average time to process all signals relevant to a single wafer was 5.2 s in Dataset A, and 119 s in Dataset B. For illustration purposes, Figure 8 shows two examples of original and reconstructed signals, with corresponding signal compression and reconstruction metrics. Both signals in Figure 8 were taken from Dataset A.

Figure 8. Examples of the original and reconstructed signals for one pressure sensor reading (Signal A) and one throttle valve angle sensor reading (Signal B) observed in the Dataset A. The compression rate for the pressure sensor reading on the left of this figure was 0.6975, while the R-Squared metric for the reconstructed signal was 0.9987. Compression rate for the throttle valve signal on the right of this figure was 0.3355, while the R-Squared for the reconstructed signal was 0.9846.
Furthermore, Dataset A was large enough to realistically evaluate benefits of the distance-based data organization methodology proposed in Tree-structured data organization section. Signatures extracted via compression of the initial 1,000 signals from the Dataset A were clustered using Fritzke's growing gas GSOM method to yield the initial tree-based data organization. From the remaining 46,000 wafers, we randomly selected 200 wafers and for each vector of signatures extracted from signals emitted during manufacturing of those wafers, we evaluated the search performance of finding 10 nearest neighbors in the database. Such queries of industrial databases are of paramount importance for e.g., condition monitoring, where one needs to rapidly and correctly identify sensory signatures in the database that look most alike the newly observed (query) signature.
Growth and updating of the database were simulated by adding compressed sensor signatures from successive batches of 1,000 wafers from the Dataset A and adapting the GSOM to facilitate clustering and subsequent tree-based organization of the ever-growing dataset. Figure 9 shows evolution of the number of clusters of the resulting SOM, while Figure 10 shows computational times it took the GSOM to settle after each introduction of signals from 1000-wafer batches9. Each time compressed signal signatures from a new batch of 1000 wafers were added to the database and the GSOM adaptation stopped, we again randomly selected 200 wafers that were not yet presented to the database and for each vector of compressed sensory signatures obtained from those wafers, we evaluated the search performance in finding 10 nearest neighbors in the database.
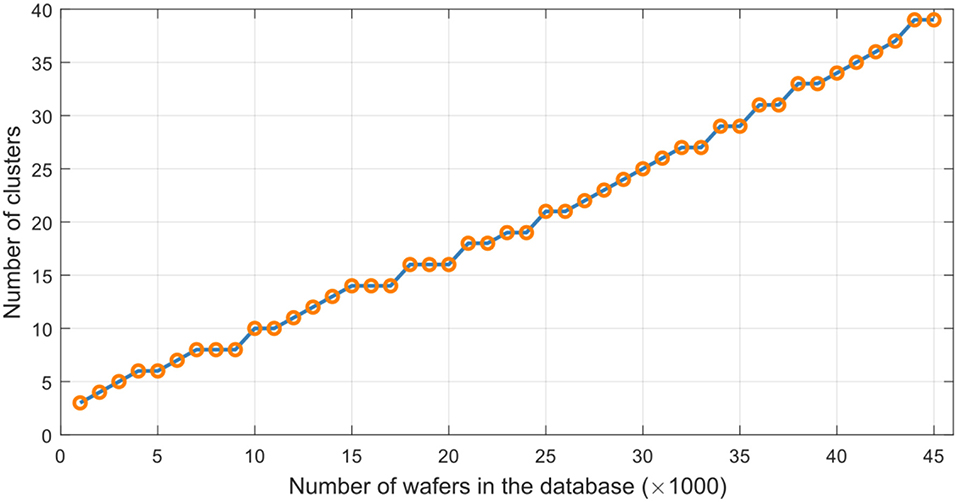
Figure 9. Number of GSOM clusters in unsupervised clustering-based organization of the database of compression signatures obtained from the Dataset A.
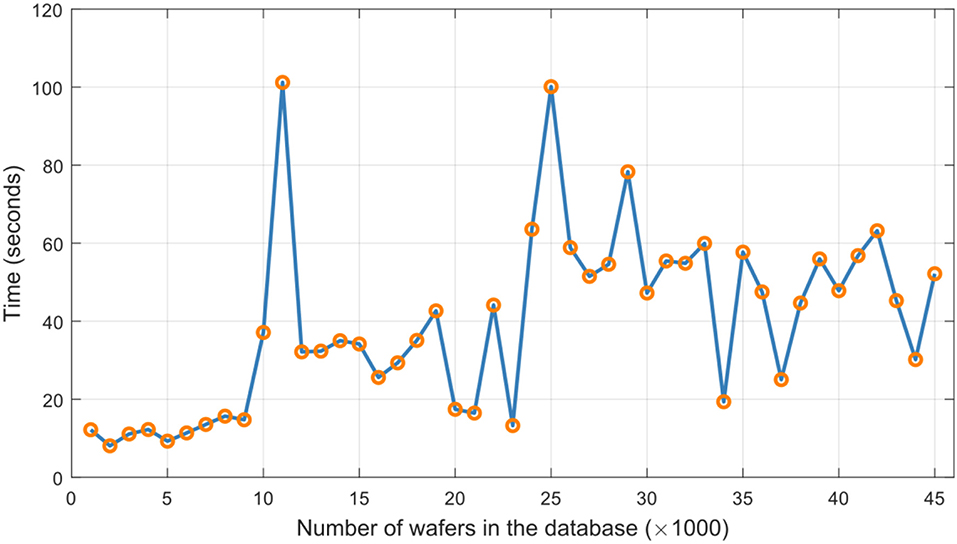
Figure 10. Behavior of elapsed times needed for adjustments of the database of signatures obtained using newly proposed physically-interpretable compression of signals from Dataset A.
Search performance was evaluated using average precision and recall metrics, as well as the average speed of those searches for the cases when only the nearest database cluster was searched, as well as when GSOM clusters with topological distance 1 and 2 from the nearest cluster were searched10. Figure 11A shows the average ratio of times needed to search the GSOM-based database and times needed to conduct the corresponding search in the traditional, temporally organized database on the form of a list, while Figures 11B,C, respectively, show the average precision and recall metrics of those searches.
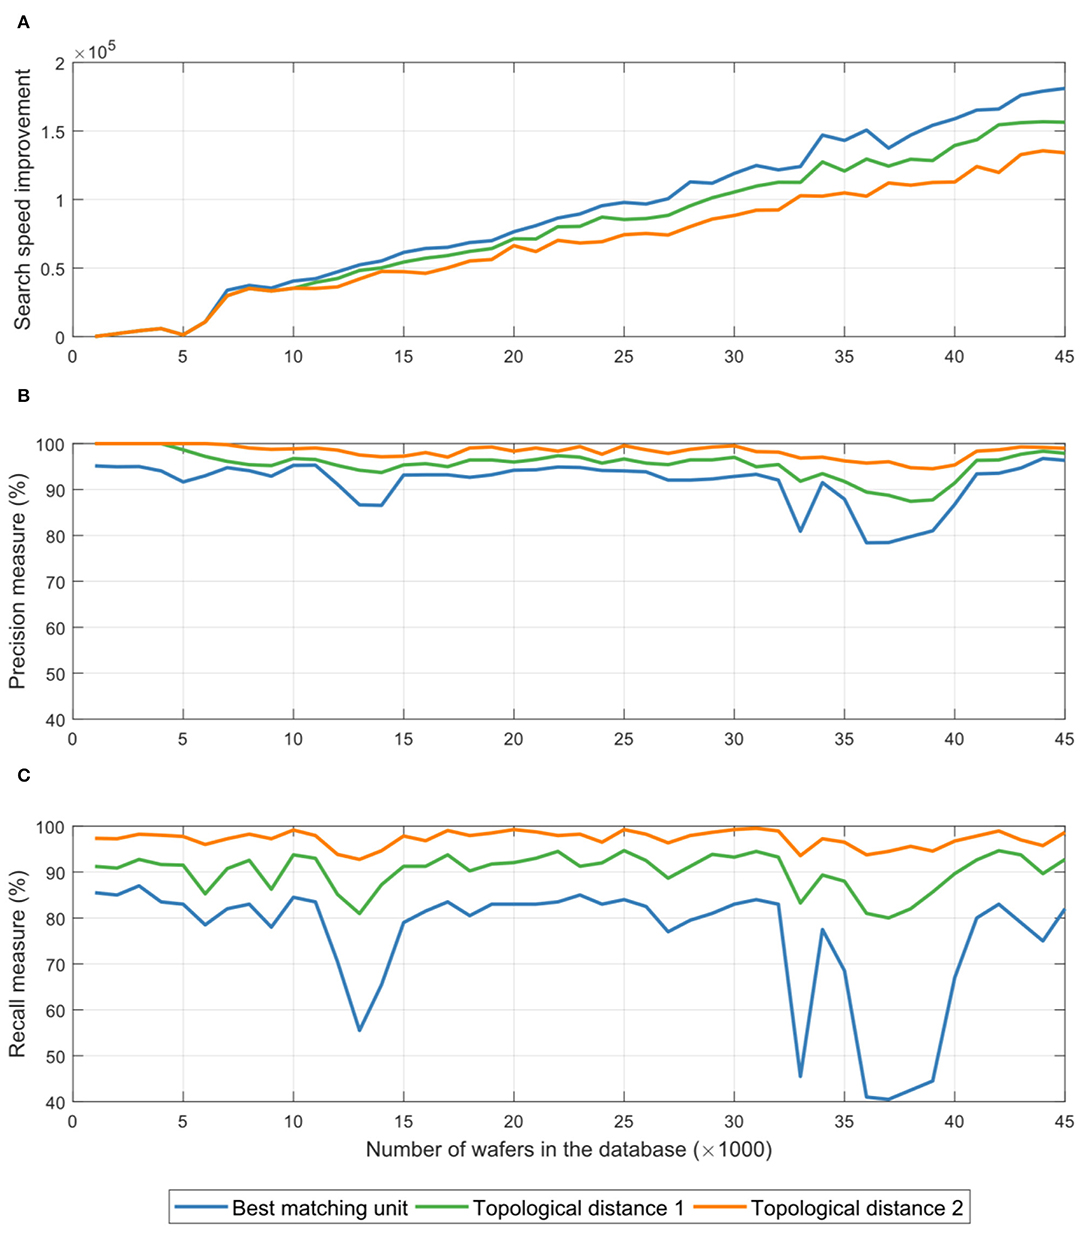
Figure 11. Plot (A) shows the average ratio of times needed to search the GSOM-based database and times needed to conduct the corresponding search in the traditional, temporally organized database on the form of a list. Plots (B,C), respectively, show the average precision and recall metrics of those searches. All tests were evaluated for searches that involved only the cluster corresponding to the weight vector nearest to the query item (blue curves), clusters in the immediate neighborhood of the one corresponding to the weight vector nearest to the query item (green curves), and clusters whose topological distance away from the one corresponding the weight vector nearest to the query item is less or equal to two (orange curves).
As expected, one can see from Figure 11 that expanding the search into neighboring regions of the tree-based database leads to improved precision and recall metrics (more accurate search results). It can also be seen that these improvements come at the cost of additional times needed to conduct the searches. Nevertheless, it is clear that the tree-based database organization consistently yields search-time improvements that grow with the size of the database, with expanded searching of the tree slightly slowing the search, while delivering nearly perfect search results (average precision above 98% and average recall above 97% when one searches GSOM clusters, i.e., segments of the database tree, with topological distance 2 away from the best matching cluster).
Conclusion and Future Work
This paper presents an automated method for approximate compression of a signal based on extracting physically interpretable signatures from its time-domain description. Thus, the proposed data compression approach is appropriate for signals for which useful information is embedded directly in the time domain. Those are usually sensors of thermofluidic variables, such as flow, temperature, and pressure sensor readings in semiconductor tools, petrochemical plants, or pharmaceutical industries. However, in signals for which information is embedded in the frequency or joint time-frequency domain, such as vibrations from gearboxes and bearings, or acoustic emissions signals from cutting tools in machining, or civil engineering structures, this compression method is not appropriate.
The newly proposed method converts raw signals into signatures that can then be directly used for mining of useful information via e.g., detection and characterization of anomalies, quality prediction, or process control. The method also reduces the data storage burden since the signal could be approximately reconstructed from the extracted signatures. In addition, an unsupervised clustering method was used to organize the compressed data into a distance-based, tree-structured database. Such tree-based data organization is known in computer science to offer significant advantages in terms of speeding up searches in large databases. The benefits of the proposed methodology for data compression and organization were evaluated utilizing two large datasets from modern semiconductor manufacturing fabs. The results illustrate the feasibility of the aforementioned data compression method, as well as superior performance in terms of speed and accuracy of data searches in the newly proposed database structure, compared to searches in the conventionally organized industrial databases in the form of temporal lists.
Methodologically, a natural next step forward in this research would be to explore the possibilities of enabling physically plausible signal compression methodology in the frequency and time-frequency-domains. Such capabilities could be of tremendous benefits for condition-monitoring applications in rotating machinery and other mechanical systems. Another direction for future work should be the use of more powerful and general distance-based measures to organize the compressed database. e.g., stochastic automata (Eilenberg, 1974) could be used to yield alternative distance measure to determine the “similarity” between data points. which would greatly improve one's ability to compare signals even when novel segments that were not previously seen appear in the signal, or a segment that is usually there, but does not appear in the newly observed signal.
From the practical point of view, the methods described in this paper can be developed and implemented in an actual industrial setting, where the sheer volume of data represents a unique challenge. e.g., a modern semiconductor fabrication facility processing 300 mm wafers can stream well over 100 K signals, each of which can be (is) sampled at 10 Hz or higher. Effectively enabling data curation capabilities described in this paper in such a setting requires methodologies and solutions that intricately and innovatively link the software implementing data curation methodologies with the hardware that enables moving and processing of such enormous amounts of data. Such solutions require highly interdisciplinary skills in both hardware and software and their pursuit is outside the scope of this paper.
Data Availability Statement
The data analyzed in this study is subject to the following licenses/restrictions: The datasets were given to our research group by semiconductor manufacturing companies for the research purposes only. Requests to access these datasets should be directed toZHJhZ2FuZEBtZS51dGV4YXMuZWR1.
Author Contributions
RS was the leading author coded majority of the methodologies, produced results, and participated in the writing of the manuscript. ZC was the first graduate student involved in this research, who implemented the AIC based identification of orders of transient segments, and conducted first search speed tests with SOM based database organization. AS contributed with research advising of graduate students and participated in the drafting and proofreading of the manuscript. DD defined the research topic, led the underlying research and participated in the drafting, and proofreading of the manuscript. All authors contributed to the article and approved the submitted version.
Funding
This work was supported in part by the National Science Foundation (NSF) under Cooperative Agreement No. EEC-1160494 and Cooperative Agreement No. IIP-1266279. This work is also supported in part by a membership of The MathWorks, Inc. in the University of Texas at Austin campus of the NSF Industry-University Cooperative Research Center on Intelligent Maintenance Systems. Any opinions, findings and conclusions or recommendations expressed in this paper are those of the authors and do not necessarily reflect the views of the NSF, or The MathWorks, Inc.
Conflict of Interest
AS was employed by the company The MathWorks, Inc.
The remaining authors declare that the research was conducted in the absence of any commercial or financial relationships that could be construed as a potential conflict of interest.
Footnotes
1. ^These signatures can be extracted from descriptions of relevant signal segments in various domains, such as time-domain, frequency-domain, or time-frequency-domain of signal representations (Chen and Lipps, 2000; Phinyomark et al., 2009; Suresh et al., 2013; Celler et al., 2019).
2. ^These coefficients can be real or complex.
3. ^AIC is a well-known information-theoretical criterion that can be utilized to elegantly indicate when further increases in model complexity are not justified by the corresponding improvements in model accuracy.
4. ^In a very similar manner, one could certainly explore possibilities to describe signal transients using concatenation of more than two segments of form (1). Nevertheless, our experience with real industrial data indicates that representing signal transients with up to two concatenated segments described by Eq. (1) led to excellent representation of a wide range of signals. This is why we only implemented a procedure that considers up to two distinct segments within each transient, though we once again acknowledge that a more general procedure should consider a more elaborate transient segmentation.
5. ^For industrial processes, which are usually behaving in a fairly consistent manner, the difference in numbers of segments is small, with signals having at most a couple of extra or missing segments, and even such inconsistencies not appearing too often.
6. ^Please note that in Figure 6, FV and SV associated with the Eq. (3) are the concatenated vectors containing all the extracted feature from feature vector X and the standard vector respectively.
7. ^E.g. Euclidean, Mahalanobis, Manhattan or some other distance metric. Furthermore, please note that one same database can be indexed in multiple ways, using GSOM-based clustering based on different distance metrics. This would yield multiple sets of centroids (database keys) that parse that database and facilitate acceleration of searches.
8. ^The times reported here correspond to processing on a regular Personal Computer with 32.0 GB RAM and a 6-core Intel® Xeon® CPU E5-1650 v4 @ 3.60GHz processor.
9. ^These times correspond to the so-called computational overhead needed to maintain the tree-based database organization (Bhattacharya, 2014). In the case of a list-based database organization, this time is essentially zero, since there are no adaptations needed to maintain the database organization.
10. ^Such searching of database segments (bins) in the neighborhood of the initial search focus within a tree-based database is yet another common practice utilized to improve accuracy of database search results (Bhattacharya, 2014).
References
Aremu, O. O., Salvador Palau, A., Hyland-Wood, D., Parlikad, A. K., and McAree, P. R. (2018). Structuring data for intelligent predictive maintenance in asset management. IFAC-PapersOnLine. 51, 514–519. doi: 10.1016/j.ifacol.2018.08.370
Atzori, L., Iera, A., and Morabito, G. (2010). The internet of things: a survey. Comput. Netw. 54, 2787–2805. doi: 10.1016/j.comnet.2010.05.010
Balaban, A. T. (1982). Highly discriminating distance-based topological index. Chem. Phys. Lett. 89, 399–404. doi: 10.1016/0009-2614(82)80009-2
Bhattacharya, A. (2014). Fundamentals of Database Indexing and Searching. New York, NY: CRC Press. doi: 10.1201/b17767
Buckland, M., and Gey, F. (1994). The relationship between recall and precision. J. Am. Soc. Inf. Sci. 45, 12–19. doi: 10.1002/(SICI)1097-4571(199401)45:1<12::AID-ASI2>3.0.CO;2-L
Celler, B. G., Le, P. N., Argha, A., and Ambikairajah, E. (2019). GMM-HMM based blood pressure estimation using time domain features. IEEE Trans. Instrum. Meas. 69, 3631–3641. doi: 10.1109/TIM.2019.2937074
Chen, V. C., and Lipps, R. D. (2000). Time frequency signatures of micro-Doppler phenomenon for feature extraction. Wavelet Appl. 4056, 220–226. doi: 10.1117/12.381683
Chow, T. W. S., and Rahman, M. K. M. (2009). Multilayer SOM with tree-structured data for efficient document retrieval and plagiarism detection. IEEE Trans. Neural Netw. 20, 1385–1402. doi: 10.1109/TNN.2009.2023394
Djurdjanovic, D. (2018). “Condition Monitoring and Operational Decision-Making in Modern Semiconductor Manufacturing Systems,” in Proceedings of the Pacific Rim Statistical Conference for Production Engineering (Seoul), 41–66. doi: 10.1007/978-981-10-8168-2_5
Fritzke, B. (1994). Growing cell structures—a self-organizing network for unsupervised and supervised learning. Neural Netw. 7, 1441–1460. doi: 10.1016/0893-6080(94)90091-4
Fritzke, B. (1995). A growing neural gas network learns topologies. Adv. Neural Inform. Proc. Syst. 7, 625–632.
Gilchrist, A. (2016). Industry 4.0: the Industrial Internet of Things. A press. doi: 10.1007/978-1-4842-2047-4_10
Haq, A. A. U., Wang, K., and Djurdjanovic, D. (2016). Feature construction for dense inline data in semiconductor manufacturing processes. IFAC-PapersOnLine 49, 274–279. doi: 10.1016/j.ifacol.2016.11.047
Haq, A. U., and Djurdjanovic, D. (2016). Virtual metrology concept for predicting defect levels in semiconductor manufacturing. Procedia CIRP 57, 580–584. doi: 10.1016/j.procir.2016.11.100
Haq, A. U., and Djurdjanovic, D. (2019). Dynamics-inspired feature extraction in semiconductor manufacturing processes. J. Ind. Inf. Integr. 13, 22–31. doi: 10.1016/j.jii.2018.12.001
Hauck, E. L. (1986). Data Compression Using Run Length Encoding and Statistical Encoding. Google Patents.
Hendrickx, K., Meert, W., Mollet, Y., Gyselnck, J., Cornelis, B., Gryllias, K., et al. (2020). A general anomaly detection framework for fleet-based condition monitoring of machines. Mech. Syst. Signal Process. 139:106585. doi: 10.1016/j.ymssp.2019.106585
Hughes, T. J. R., Pister, K. S., and Taylor, R. L. (1979). Implicit-explicit finite elements in nonlinear transient analysis. Comput. Methods Appl. Mech. Eng. 17, 159–182. doi: 10.1016/0045-7825(79)90086-0
Kalyanaraman, S. (2016). Industry 4.0 meets Cognitive IoT: Internet of Things Blog. Available online at: https://www.ibm.com/blogs/internet-of-things/industry-4-0-meets-cognitive-iot/
Kazemi, H. (1969). Pressure transient analysis of naturally fractured reservoirs with uniform fracture distribution. Soc. Pet. Eng. J. 9, 451–462. doi: 10.2118/2156-A
Kosir, P., and DeWall, R. (1994). “Feature alignment techniques for pattern recognition,” in Proceedings of National Aerospace and Electronics Conference (NAECON'94) (Dayton, OH), 128–132.
Lapira, E., Brisset, D., Ardakani, H. D., Siegel, D., and Lee, J. (2012). Wind turbine performance assessment using multi-regime modeling approach. Renew. Energy 45, 86–95. doi: 10.1016/j.renene.2012.02.018
Miles, J. (2014). R squared, adjusted R squared. Wiley StatsRef Stat. Ref. Online. doi: 10.1002/9781118445112.stat06627
Mogul, J., Krishnamurthy, B., Douglis, F., Feldmann, A., Goland, Y., van Hoff, A., et al. (2002). Delta Encoding in HTTP. Gennaio: IETF. 65, doi: 10.17487/rfc3229
Nasrabadi, N. M. (2007). Pattern recognition and machine learning. J. Electron. Imaging 16:49901. doi: 10.1117/1.2819119
Pautlier, N. G., Antonellis, J., Balestrieri, E., Blair, J., Calvin, J., Dallet, D., et al. (2011). IEEE Std. 181-2011-IEEE Standard for Transitions, Pulses, and Related Waveforms (Revision of IEEE Std. 181-2003).
Phinyomark, A., Limsakul, C., and Phukpattaranont, P. (2009). A novel feature extraction for robust EMG pattern recognition. arXiv Prepr. arXiv 1, 71–80. Available online at: https://arxiv.org/abs/0912.3973v2
Ramirez-Nunez, J. A. (2018). Evaluation of the detectability of electromechanical faults in induction motors via transient analysis of the stray flux. IEEE Trans. Ind. Appl. 54, 4324–4332. doi: 10.1109/TIA.2018.2843371
Sabbagh, R., Gawlik, B., Sreenivasan, S. V., Stothert, A., Majstorovic, V., and Djurdjanovic, D. (2020). “Big data curation for analytics within the cyber-physical manufacturing metrology model (CPM3),” in Procedia CIRP (Chicago, IL).
Sakamoto, Y., Ishiguro, M., and Kitagawa, G. (1986). “Akaike Information Criterion Statistics” in Akaike Information Criterion Statistics, ed D. Reidel (Dordrecht), 81.
Sayood, K. (2002). Lossless Compression Handbook. Amesterdam; Boston; London; New York, NY; Oxford; Paris; San Diego, CA; San Francisco, CA; Singapore; Sydney; Toky: Elsevier.
Siegel, D. (2013). Prognostics and Health Assessment of a Multi-Regime System Using a Residual Clustering Health Monitoring Approach. Cincinnati, OH: University of Cincinnati.
Siegel, D., and Lee, J. (2011). An auto-associative residual processing and K-means clustering approach for anemometer health assessment. Int. J. Progn. Heal. Manag. 2:117. Available online at: http://citeseerx.ist.psu.edu/viewdoc/summary?doi=10.1.1.369.8241
Suresh, P., Thayaparan, T., Obulesu, T., and Venkataramaniah, K. (2013). Extracting micro-doppler radar signatures from rotating targets using Fourier–Bessel transform and time–frequency analysis. IEEE Trans. Geosci. Remote Sens. 52, 3204–3210. doi: 10.1109/TGRS.2013.2271706
Tharini, C., and Ranjan, P. V. (2009). Design of modified adaptive Huffman data compression algorithm for wireless sensor network. J. Comput. Sci. 5:466. doi: 10.3844/jcssp.2009.466.470
Keywords: industrial data analytics, physically-interpretable data compression, industrial database organization, industrial database searching, industrial internet of things
Citation: Sabbagh R, Cai Z, Stothert A and Djurdjanovic D (2020) Physically Inspired Data Compression and Management for Industrial Data Analytics. Front. Comput. Sci. 2:41. doi: 10.3389/fcomp.2020.00041
Received: 07 July 2020; Accepted: 06 August 2020;
Published: 11 September 2020.
Edited by:
Dimitris Kiritsis, École Polytechnique Fédérale de Lausanne, SwitzerlandReviewed by:
Alexandros Bousdekis, National Technical University of Athens, GreeceHongbae Jun, Hongik University, South Korea
Copyright © 2020 Sabbagh, Cai, Stothert and Djurdjanovic. This is an open-access article distributed under the terms of the Creative Commons Attribution License (CC BY). The use, distribution or reproduction in other forums is permitted, provided the original author(s) and the copyright owner(s) are credited and that the original publication in this journal is cited, in accordance with accepted academic practice. No use, distribution or reproduction is permitted which does not comply with these terms.
*Correspondence: Ramin Sabbagh, c2FiYmFnaEB1dGV4YXMuZWR1
 Ramin Sabbagh1*