 Ben Steichen1*†
 Bo Fu2†
- 1Department of Computer Science, California State Polytechnic University, Pomona, CA, United States
- 2Department of Computer Engineering and Computer Science, California State University, Long Beach, CA, United States
Information visualizations can be regarded as one of the most powerful cognitive tools to significantly amplify human cognition. However, traditional information visualization systems have been designed in a manner that does not consider individual user differences, even though human cognitive abilities and styles have been shown to differ significantly. In order to address this research gap, novel adaptive systems need to be developed that are able to (1) infer individual user characteristics and (2) provide an adaptation mechanism to personalize the system to the inferred characteristic. This paper presents a first step toward this goal by investigating the extent to which a user's cognitive style can be inferred from their behavior with an information visualization system. In particular, this paper presents a series of experiments that utilize features calculated from user eye gaze data in order to infer a user's cognitive style. Several different data and feature sets are presented, and results overall show that a user's eye gaze data can be used successfully to infer a user's cognitive style during information visualization usage.
Introduction
With the proliferation of large quantities of data across all aspects of our daily lives (ranging from reading news articles to reaching critical business decisions), it has become paramount to research new paradigms to help users deal with such data efficiently and effectively. One technique that has generally proven successful in data analysis is to make use of graphical representations of data and particularly computer-generated representations. A key reason for the success of such information visualizations is the fact that they are making use of “the highest bandwidth channel from the computer to the human” (Ware, 2004), namely, the human visual system. As such, information visualization can be regarded as one of the most powerful cognitive tools to significantly amplify human cognition (Ware, 2004; Card, 2007; Mazza, 2009).
While information visualization systems have largely been successful in helping humans perceive and analyze information, they have typically been designed in a non-personalized manner, i.e., each individual user/viewer is being shown the same visualization in the same form. This nonadaptive nature of systems assumes that cognitive processing is mostly identical across humans and, therefore, that all users would equally benefit from the same visualization. However, a large body of research has found that there are significant differences among humans, particularly in terms of cognitive abilities and styles. Examples of cognitive abilities include perceptual speed (“a measure of speed when performing simple perceptual tasks”) and verbal/visual working memory (“a measure of storage and manipulation capacity of verbal/visual information”). As with cognitive abilities, cognitive style has been studied extensively in psychology, and a number of different definitions, models, and tests have been proposed and developed (Hudson, 1967; Witkin et al., 1975; Kirton and De Ciantis, 1986; Riding and Cheema, 1991; Riding, 1997, 2001; Kozhevnikov, 2007). In a general sense, cognitive style may refer to “people's characteristics and typically preferred modes of processing information” (Sternberg and Grigorenko, 1997) and can hence be regarded as more of a preference (“lying at the junction between cognition and personality” Raptis et al., 2016a) rather than an ability. In the context of our paper, cognitive style refers to the field dependence–independence (FD-I) style, which distinguishes between field-dependent and field-independent people (Witkin et al., 1975). Specifically, field dependent people are theorized as having more problems in recognizing details in complex scenes, while people who are field independent can separate structures from surrounding visual context with ease (Witkin et al., 1975).
For both cognitive abilities and cognitive styles, individual differences have been shown to significantly influence user behaviors with different systems and user interfaces, including information visualization systems (Toker et al., 2012; Steichen and Fu, 2019). It can therefore be envisaged that more personalized systems (rather than the current one-size-fits-all model) could be of great benefit to information visualization users.
Besides information visualization, there are many other research fields that have explored individual user differences and personalized system designs for decades. Examples range from personalized search systems (Steichen et al., 2012), to personalized e-learning (Jameson, 2007), to adaptive Web systems (Brusilovski et al., 2007). Many of these examples have taken human-centered design approaches, whereby individual human differences are taken into account to develop systems that adapt to each individual person. Specifically, the two main steps to approach such a design are typically to (1) infer individual user characteristics and (2) provide an adaptation mechanism to personalize the system to the inferred characteristic (e.g., through recommendations, adaptive interface changes, etc.). Similar to these examples, there have been several recent efforts in information visualization to personalize to individual users. However, such systems have primarily focused on cognitive abilities (Steichen et al., 2014; Conati et al., 2015; Raptis et al., 2016a) rather than cognitive style. Since an individual person's cognitive style has been shown to have significant effects on human performance, particularly on the processing of visual information (i.e., the main interaction mechanism with visualizations), it is important to further investigate this characteristic for adaptation.
The overall aim of our work is thus to develop the first information visualization system that adaptively supports individual users depending on their cognitive style. Specifically, this system is envisioned to consist of a two-step process. The first step is to infer an information visualization user's cognitive style based on the user's exhibited behavior with the system. The second step will then use the inferred cognitive style to make a decision on how to best support the user in a personalized manner either through recommendations of alternative visualizations or through real-time changes to the current visualizations (or the recommendation of such changes).
Some aspects of this second step have already been investigated in prior work. In particular, the prior work in Steichen and Fu (2019) investigated the idea of “adaptive overlays,” where visual artifacts would be added to the user's current information visualization. Examples of such overlays included adding grid lines for providing additional structure or displaying data point values directly on the graph. Additionally, it was found that different types of overlays were preferred by individuals with different cognitive styles, hence making a compelling case for tailoring the adaptation of the visualization to each user's style.
Complementing this prior work, this paper focuses specifically on the first step, by investigating the extent to which a user's cognitive style can be inferred from the user's behavior with an information visualization system. Given the fact that information visualizations typically have limited interaction (e.g., using a mouse or keyboard), the specific user behavior data used for this inference will be a user's eye gaze as captured through eye tracking. This work is a direct extension of Steichen et al. (2020), with a significantly expanded literature review, additional experiments that analyze different feature sets (see No Areas of Interest, Information Searching, and Information Processing Feature Sets section) and data sets (see Data Set Split Based on Information Density section), as well as expanded discussions and conclusions of all of the results.
Related Work
The study of adaptive and personalized interfaces and systems has featured in a number of different research fields over the last few decades. In fact, the adaptation to an individual user's characteristics, such as the user's abilities (e.g., cognitive abilities), preferences (e.g., personal interests), or contexts (e.g., current task), has become ubiquitous across several types of information systems, ranging from personalized search systems (Steichen et al., 2012), to adaptive e-learning systems (Jameson, 2007), to adaptive Web systems (Brusilovski et al., 2007). To achieve such personalization, researchers typically first investigate which user characteristics may have a significant influence on a user's system interaction, followed by the development of a system that can detect behaviors indicative of different levels of these characteristics. This detection/inference component is then integrated into a system that adaptively assists an individual user, for example, through personalized recommendations or adaptive interface changes.
In the field of information visualization, researchers have similarly explored the concepts of personalized systems, i.e., information visualizations that adapt to individual users and their behaviors. As part of this work, prior research has first looked at the influence of several different human characteristics on information visualization usage (Velez et al., 2005; Green and Fisher, 2010; Ziemkiewicz et al., 2011; Toker et al., 2012; Carenini et al., 2014). For example, Toker et al. (2012) explored the effect of different cognitive abilities (including perceptual speed and working memory) and found that they indeed have some influence on a user's performance (particularly in terms of time on task) with different visualizations. Likewise, Ziemkiewicz et al. (2011) found that the human personality trait of locus of control had a significant relative influence on different visualizations, with internal locus of control participants performing worse when information visualizations employed a containment metaphor, while external locus of control participants showed good performance with such systems. More recently, additional characteristics have been found that influence visualization comprehension, such as reading proficiencies (Toker et al., 2019) and visualization literacy (Lallé and Conati, 2019).
Similar to the above studies, the human characteristic of cognitive style has been studied in terms of its influence on user performance on different types of interfaces, including information visualizations (Steichen and Fu, 2019). As mentioned in the Introduction, cognitive style may generally be referred to as “people's preferred modes of processing information” (Sternberg and Grigorenko, 1997), rather than an ability. Several different theories and models have been proposed (Hudson, 1967; Witkin et al., 1975; Kirton and De Ciantis, 1986; Riding and Cheema, 1991; Riding, 1997, 2001), and recent work has also attempted to unify several of these models (Kozhevnikov, 2007). One of the most prominent models of cognitive styles was introduced by Riding (1997, 2001) and Riding and Cheema (1991), who proposed that there are two main continuous dimensions by which a user's cognitive style may be defined. Firstly, the “analytic-wholist” dimension distinguishes between individuals who process information into its component parts (“analytics”), while others retain or prefer a global/overall view of information (“wholists”). Secondly, the “verbal–imagery” dimension distinguished between people who prefer to represent information through verbal thinking (“verbalizers”) and those who prefer mental pictures (“imagers”). By contrast, Kirton's adaption-innovation theory (Kirton and De Ciantis, 1986) distinguished individuals on a single continuous dimension. Specifically, in this theory, some people prefer to adapt established techniques to solve a problem (“adaptors”), while others seek innovative techniques and technologies (“innovators”). Similarly, Hudson's convergence–divergence dimension (Hudson, 1967) distinguishes between people who prefer established and familiar problem solutions (“convergent”) and individuals who use more creative (“divergent”) techniques and thinking processes. The FD-I theory (Witkin et al., 1975) similarly distinguishes individuals on a single continuum. Specifically, it defines “field-dependent” people in terms of their reliance on external structures and directions, while “field-independent” individuals prefer autonomy and tend to be better at creating their own structure and perform restructuring. Likewise, field-independent people can visually separate structures from surrounding visual context with ease, while field-dependent people have more problems in recognizing details in complex scenes.
Since information visualizations often consist of multiple visual artifacts that create a complex overall view of data, the FD-I theory appears particularly suited for the investigation of the influence of individual user differences on the user's behavior with such systems. Moreover, since FD-I has already been found to specifically influence people's preferences with different information visualization overlays (Steichen and Fu, 2019), we hypothesize that this type of cognitive style may significantly influence a user's processing of information visualizations and that this difference may be exhibited by the user's eye gaze. Moreover, inferring a user's cognitive style along the FD-I dimension also represents a great potential for adaptation to improve system interaction, particularly since the work in Steichen and Fu (2019) found that users with different styles along the FD-I dimension may benefit from different kinds of adaptive help. The work described in this paper therefore focuses specifically on this model of cognitive style. This focus is also in line with other human–computer interaction work (e.g., in gaming or e-commerce), which similarly found that FD-I can lead to different information processing behaviors and patterns when interacting with visual interfaces (Mawad et al., 2015; Raptis et al., 2016b).
In terms of capturing or inferring user characteristics based on user interactions, prior research has explored several different kinds of behavioral data. In fields outside of information visualization, many systems typically employ interaction data such as mouse clicks or keyboard presses (e.g., result selections or query inputs in search systems Steichen et al., 2012). Likewise, if a visualization has interactive elements (e.g., zooming, panning, etc.), interaction device data can also be used (e.g., as in the interactive visualizations used in Gotz and Wen, 2009). However, given the fact that the majority of interactions with visualizations typically entail a user simply looking at a visualization without using a mouse, keyboard, or other interaction device, researchers have started to explore alternative ways to capture a user's behavior. Most promisingly, eye tracking has been shown to be a powerful tool for analyzing user attention patterns. For example, Toker et al. (2013) found several connections between different users' eye gaze behaviors and their respective individual user characteristics. Furthermore, eye gaze data have been used successfully to infer and predict user and task characteristics (Steichen et al., 2014; Raptis et al., 2017).
The work described in this paper builds on this prior research by examining the extent to which eye-tracking data can be used to infer a user's cognitive style while the user is interacting with an information visualization system (i.e., performing a task by looking at a visualization). This in turn is envisioned to be integrated into an adaptive information visualization system, which (1) will be able to determine a user's cognitive style as the user is interacting with a visualization and (2) will dynamically adapt to the user's cognitive style, e.g., through adaptive overlays as proposed in Kirton and De Ciantis (1986), or in the form of alternative visualization recommendations, as presented in Gotz and Wen (2009).
Data Collection
In order to collect sufficient data for performing cognitive style inference experiments, we first conducted an eye-tracking user study with 40 participants. Specifically, the study involved participants performing a series of tasks with the help of simple information visualizations while their eye gaze was recorded.
Study Visualizations and Tasks
The visualizations used in the study consisted of simple bar graphs and line graphs (see bar graph and line graph examples in Figure 1). These graphs were chosen due to their widespread popularity across multiple domains and diverse user bases, as well as their use in prior studies involving user differences (Toker et al., 2012; Steichen et al., 2014). Note that to keep variables at a minimum, only these two graphs were used, while other graphs are left for future research. For both types of graphs, we also devised different “information density” versions, namely, “low information density” (where only two series were shown) and “high information density” (where seven or more series were shown). This variation in graphs was intended to simulate “simple” and “more complex” graphs.
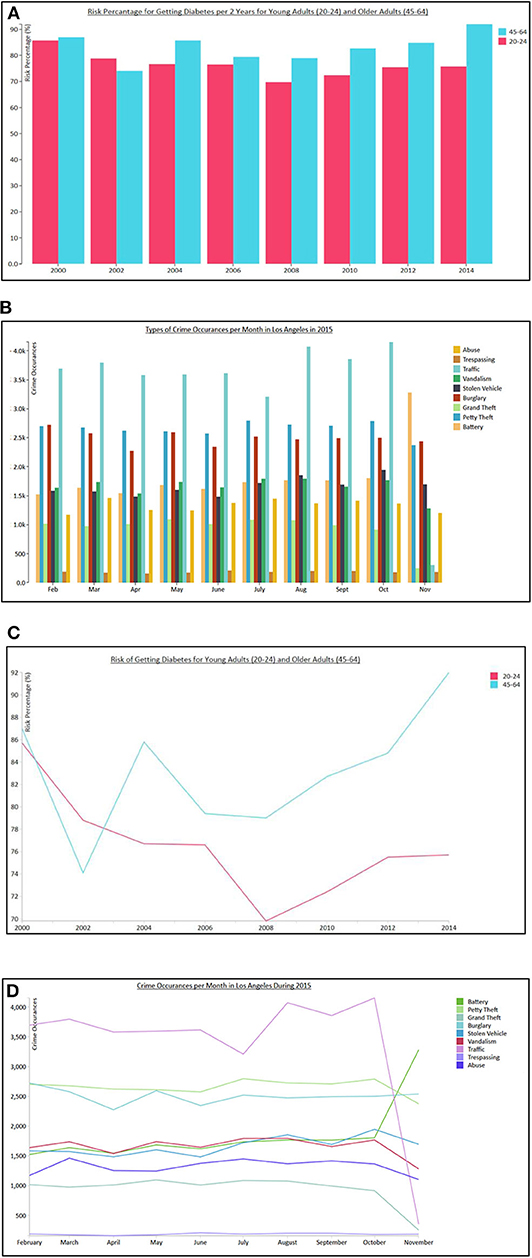
Figure 1. Sample visualizations as used in the study. (A) shows a low information density bar graph example for the diabetes data set, (B) shows a high information density bar graph for crime data set, (C) shows a low information density line graph for the diabetes data set, and (D) shows a high information density line graph for crime data set.
Each of the graphs depicted one of two datasets from Data.gov, namely, the Diabetes Data Set1 and the Los Angeles Crime Data Set2 (e.g., as in Figure 1). The specific tasks devised for the study were based on these data sets, with participants answering sets of questions using given visualizations. These questions required participants to either give a single answer (using radio buttons) or provide a set of correct answers (using checkboxes). For example, given a visualization depicting all occurrences of different crimes for a specific year, a participant may be asked “What crimes occurred more than vandalism crimes in November?” The types of tasks were based on the taxonomy provided in Amar et al. (2005) and consisted of “Retrieve Value,” “Filter,” “Compute Derived Value,” and “Find Extremum” tasks.
Study Procedure
Participants began by filling out a consent form, followed by a demographic questionnaire, which included age, gender, as well as self-reported expertise with different visualizations (i.e., how frequently they use/work with line and bar graphs).
This was followed by the calibration of the eye tracker (Tobii X3-120) using a standard 9-point calibration procedure through the iMotions3 eye-tracking package. Participants then performed two practice tasks (one with a bar graph, one with a line graph). These practice tasks provided participants with an opportunity to learn about the types of tasks, as well as the visualizations themselves. Participants then proceeded to perform a series of 50 tasks (25 with each visualization; total of 20 high information density, 30 low information density). To avoid any learning or ordering effects, all variables were counterbalanced, including visualization type, task question, and density (i.e., the same tasks were not always associated with the same graph). A within-study setup (in terms of all users receiving all visualization types, tasks questions, and density) was chosen to investigate whether a system could infer a user's cognitive style regardless of the visualization or task type, i.e., whether it would be able to infer cognitive style on any given visualization/task combination for a given user.
After all tasks were completed, users performed a test to determine their cognitive style, specifically an online version of the Group Embedded Figures Test (GEFT) (Oltman et al., 1971). This test is a proven and reliable instrument to determine a user's field dependence (FD) (on a scale of 0–18, 0 meaning very field dependent, and 18 meaning very field independent) and has been used in several of the prior works mentioned in the Related Work section (Mawad et al., 2015; Raptis et al., 2016b). Participants were compensated with a $20 gift voucher, and each session lasted ~1 h on average.
Participant Demographics and Gaze Data
The authors advertised the study through several University mailing lists, with the aim of recruiting a relatively heterogeneous pool of participants in terms of age, fields of expertise, and cognitive style. A total of 40 participants was recruited, with an age range of 18–70 years (mean 28). Among them, 24 participants were female and 16 were male, while the distribution across colleges and departments (e.g., arts, engineering, administration) was relatively balanced. GEFT score evaluations showed a mean of 13.75 (out of 18, SD = 4.24), which suggests that the population was slightly leaning toward field independence (FI). Participants' prior experience with visualizations (as captured through self-rated questionnaires) was also well balanced, with an average of 3.18 out of 5 (SD = 0.93) for simple bar graphs, 2.50 (SD = 1.04) for complex bar graphs, 3.40 (SD = 0.87) for simple line graphs, and 2.80 (SD = 0.88) for complex line graphs.
As with most studies involving eye-tracking equipment, some data-recording issues were encountered with some participants, leaving data from 30 participants to be retained (the majority of the data for the other 10 participants were invalid). This number is in line with similar studies for inferring user characteristics from eye gaze data (e.g., Steichen et al., 2014).
Cognitive Style Inference Experiments
Using the data collected from the above user study, we devised a series of experiments aimed at inferring a user's cognitive style from the user's eye gaze data. Specifically, the raw eye gaze data were first transformed into a series of high-level gaze features, which were then used as input features for classification experiments.
Eye-Tracking Data and High-Level Features
The raw gaze data produced by an eye tracker that consists of simple data points that denote the exact time, duration (in ms), and location (in x–y coordinates) of a user's gaze on a given screen. These precise moments where a user maintains gaze for a specified period of time at a specific point on the screen are referred to as gaze fixations (see Figure 2, which was first presented in Steichen et al., 2014).
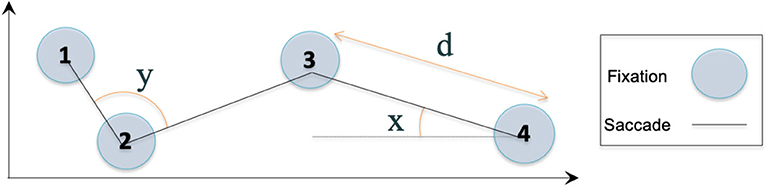
Figure 2. Basic eye gaze data, including fixations, saccades, saccade distance (d), absolute saccade angle (x), and relative saccade angle (y).
From these fixations, additional basic data can be extracted, such as the movements/transitions from one fixation to another (referred to as saccades; see Figure 2), which have a length (in pixels) and two types of angles (in degrees), namely, a relative angle (i.e., angle between two consecutive saccades) and an absolute angle (i.e., angle between a saccade and the horizontal).
Furthermore, such fixation and saccade data can be analyzed holistically for an entire screen, as well as for particular individual areas of interest (AOIs), i.e., areas that may be of particular interest in terms of analyzing the users' relative attention on different parts of the screen. For our study, particular AOIs were the Graph itself, the Legend, the graph Title, the task Question, the list of task Answers options, as well as the X-axis and Y-axis (Figure 3). Using these raw gaze measures and AOIs, we calculated a large set of gaze statistics for each user, including both fixation- and saccade-based features for the whole screen and the different AOIs (Table 1). Furthermore, we calculated each of these features on an individual user task basis (i.e., only task 1, only task 2, etc.), as well as on a complete user session basis (i.e., combining all tasks for a user).
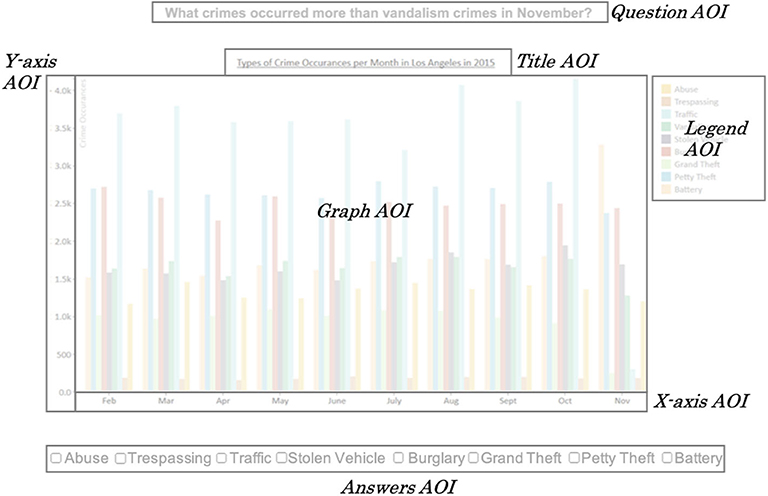
Figure 3. Areas of interest.
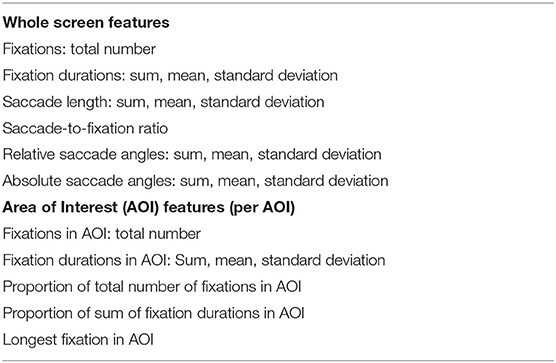
Table 1. Features calculated from gaze data.
Experiment Setup
Using the abovementioned features, we ran a series of classification experiments to investigate the extent to which a user's cognitive style can be inferred based on a user's eye gaze data. In particular, the aim of the experiments was to infer whether a participant was either more inclined toward FD or FI.
A participant's correct FD-I inclination was based on the GEFT scores obtained from the user study. Specifically, we first split participants into two groups using a median split. In addition, we also ran experiments with participants being split using a three-way split (as recommended in Cureton, 1957). Specifically, the three-way split considered the upper 27% of experiment participants as field independent, the lower 27% as field dependent, and the middle participants as neutral (Cureton, 1957).
In terms of data sets, we ran experiments with each user's complete session interaction (i.e., combined gaze features from all of a user's tasks), as well as individual user tasks (i.e., inferring a user's cognitive style based on a single task interaction).
Furthermore, we ran additional experiments with several subsets of the gaze features, namely, a feature set without AOI-related features, a feature set with features that are known to indicate information searching, a feature set with features known to indicate information processing. Lastly, we also ran separate experiments for high information density tasks only, as well as low information density tasks only.
For model learning and classification, we used the Waikato Environment for Knowledge Analysis (WEKA) machine learning toolkit (Hall et al., 2009). Specifically, we used the following algorithms: logistic regression, support vector machines, neural networks, as well as the decision tree algorithms J48 (Quinlan, 1993) and RandomForest (Breiman, 2001), using 10-fold cross-validation. The decision for using these algorithms was based on their successful use in prior works using eye gaze data (e.g., Steichen et al., 2014; Conati et al., 2020). While there may be other algorithms that may work even better in our scenario, it should be noted that this work was not meant to be an exhaustive search for the most accurate model, but rather an investigation into the general feasibility of using general purpose machine learning algorithms for cognitive style inference. Likewise, many of these models may be optimized by modifying different configurations. However, for the purposes of the experiments, all default configurations from the WEKA toolkit were used (version 3.8.4). All models were compared to a baseline model (ZeroR), which always predicts the majority class. With the exception of Support Vector Machines, all of the tested algorithms generally performed better than the baseline model. In particular, J48 and RandomForest performed the best throughout the experiments, and therefore, the rest of the analysis will be focused on these two algorithms. As previously mentioned, the default configurations were used for these algorithms without any additional feature selection prior to classification and no specification of maximum depth. The classification output was compared using the standard measure of accuracy. This measure was chosen due to its equal focus on both “positive” and “negative” classifications (i.e., FD vs. FI). Moreover, given that our data sets were reasonably balanced, accuracy represented the most accurate way of gauging the extent to which an adaptive system would receive correct predictions from an inference component. The comparison of these algorithms with the baseline model was also tested for statistical significance using paired t-tests using a significance level of 0.05 (note that WEKA does not output t scores, and therefore, they are not reported, similar to prior work, e.g., Steichen et al., 2014). In order to account for multiple comparisons, we applied Bonferroni correction within each set of classification experiments [e.g., for the user session-based experiment using complete feature sets, the correction accounted for the multiple (3) comparisons involving the baseline, J48, and RandomForest algorithms].
Results
The Classifications Using the Complete Feature Set
As mentioned above, each of the classification results was compared to a baseline that consisted of a majority classifier (ZeroR). This baseline for the binary FD-I classification had accuracies of 63.33 and 53.96% for the complete user session and individual task data sets, respectively. As shown in Figure 4, when using all of the calculated eye gaze features, several algorithms performed better than this baseline (which was found to be statistically significant, p < 0.05), achieving accuracies of up to 86%. In particular, two tree-based algorithms (J48 and RandomForest) always outperformed the baseline classifier with statistical significance. Similar results were found for both data sets, i.e., when using a user's complete session interaction, as well as when using only data from an individual task, although the task-based accuracies were overall a little lower (with a top accuracy of 80%). This slight drop in accuracy is understandable, however, given the significantly lower amount of data available for classification.
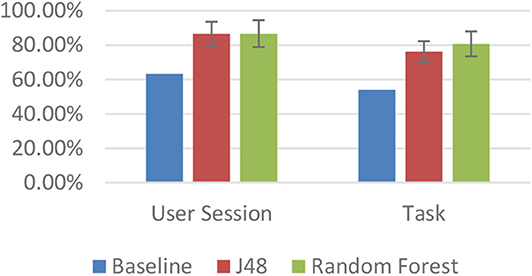
Figure 4. Accuracies for binary field dependence–independence (FD-I) classification using the complete feature set.
When splitting users using a three-way split (i.e., FD, middle, FI), the baseline accuracies were between 46.67 and 55.03%. By contrast, the models learned that using participants' eye gaze data could again achieve significantly better results, with accuracies of up to 76.67% (Figure 5).
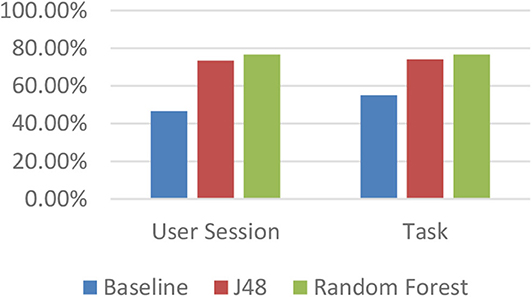
Figure 5. Accuracies for three-way field dependence–independence (FD-I) classification using the complete feature set.
In addition to these accuracy results, we also analyzed what features contributed the most to these classifications. In particular, when analyzing the decision rules for the decision trees, we found that several features were consistently appearing as some of the most informative. The top three most important features, as observed for many of the machine learning models used, were related to saccade length, as well as features related to the Graph AOI (Table 2). Specifically, a low value for saccade length sum indicated FD, while a high value indicated FI. This may indicate that field-independent participants are able to traverse a graph in greater strides, whereas field-dependent people have smaller saccades overall. Likewise, the standard deviation of saccade lengths was found to be higher for field-independent participants, which indicates that field-independent people have both long and short saccade lengths, while field-dependent people seem to be more restricted in their saccade lengths. Additionally, a low value for the proportion of fixation durations in the Graph AOI (i.e., the duration of fixations that are occurring in the Graph AOI compared to other AOIs) was indicative of field-independent participants, suggesting that less attention is required by such participants to perform tasks. In other words, these results suggest that field-dependent users need to perform longer fixations to understand graph elements, while field-independent users may be able to move more easily around a graph. Since the graph itself elicits the biggest differences between users, our intuition regarding the strong influence of cognitive style on visual element processing appears confirmed. Likewise, the saccade length results may be a direct consequence of this as well, since many saccades may occur inside of the Graph AOI. These results should hold across different types of visualizations (and even if the visualization is smaller, or if there are multiple visualizations); however, this would require additional future experiments to focus specifically on such variations.
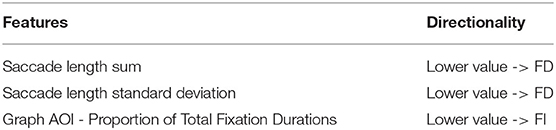
Table 2. Most informative gaze features for predicting cognitive style (full feature set).
No Areas of Interest, Information Searching, and Information Processing Feature Sets
In addition to these classifications using the complete feature set, we also ran several experiments using specific feature subsets.
Firstly, we investigated the extent to which a user's cognitive style could be inferred when using only features that are not related to any AOIs (i.e., only whole screen features). The rationale for this feature set was to examine the relative information gain attained from AOI and non-AOI features (particularly since many of the most informative features in the above experiments were not related to AOIs). Additionally, this analysis may provide insights into inferring cognitive style when the inference system does not have any information about which specific visualization a user is currently looking at. In particular, if non-AOI features were shown to be similar to the full feature set, it could be argued that the non-AOI feature set would ease the requirement for the inference system to be fully integrated with the visualization system. This would improve the generalizability of the inference system, which may hence be added as a third-party application rather than a fully connected component.
Results for this No AOI feature set showed that classification accuracies did not drop significantly. As shown in Figure 6, for each of the different types of classifications (i.e., user-session vs. task-based and binary vs. three-way classifications), the No AOI feature set was very comparable to the full feature set. In fact, when running statistical tests (specifically paired t-tests, with Bonferroni correction), we did not find any statistically significant differences in accuracies. This finding confirms that it may indeed be sufficient to just observe a user's overall eye gaze data, as opposed to knowing the exact location of the different AOIs of the user's screen. This lies in contrast with previous studies that investigated different user characteristics, such as perceptual speed, or visual and verbal working memory (Steichen et al., 2014), where it was found that the inclusion of AOI features led to significantly higher accuracies. This may suggest that other characteristics are more strongly influenced by a variety of AOIs compared to cognitive style. For example, highly textual AOIs such as the graph title or the legend were previously found to strongly influence verbal working memory experiments. Since the Graph AOI is the most dominant AOI in a visualization task, and given the previous finding that this AOI most strongly elicits differences between users with respect to cognitive style, it appears that the inclusion of fine-grained AOI elements is not necessary in this case. As with the Complete Feature Set, we also analyzed the most informative features and again found features related to saccade length to be prominent (Table 3). Specifically, a low value for saccade length sum again indicated FD, while a high value indicated FI. In addition, this classification showed that a low fixation duration average was indicative of field dependence, meaning that field-dependent users generally have shorter fixations. Likewise, low saccade absolute angle standard deviations were indicative of FD, meaning that field-dependent users have more uniform saccades, whereas field-independent users are more “flexible” in their movements. This is again in line with the results above for the complete feature set findings on saccade lengths.
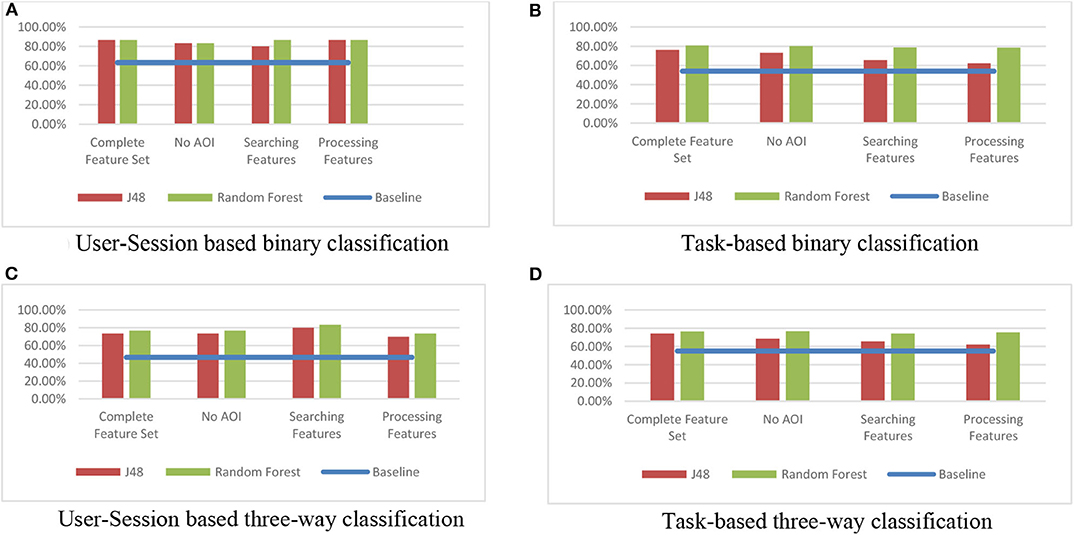
Figure 6. Accuracies for different feature subsets. (A) User–Session-based binary classification. (B) Task-based binary classification. (C) User–Session-based three-way classification. (D) Task-based three-way classification.
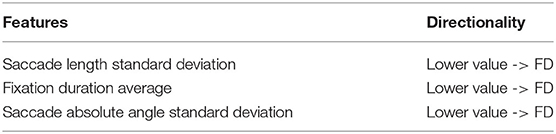
Table 3. Most informative gaze features for predicting cognitive style (No AOI features).
In addition to the No AOI feature set, we also investigated the extent to which cognitive style could be inferred when using only features that are specifically related to Information Searching, as well as only features that are specifically related to Information Processing. As suggested in Goldberg and Kotval (1999), a user's information search behavior is related to the efficient traversing of a visualization in terms of both the speed of finding visual cues and the number of visual objects that need to be sampled to complete a task. Therefore, Information Searching may be conveyed by the number of fixations and saccades generated, as well as saccadic length features. Similarly, a user's Information Processing of a visualization has been linked to the time for a user to understand the given visual information (Goldberg and Kotval, 1999). Thus, if a user spends shorter amounts of time on specific elements, it may be argued that the user had less issues with the visual processing. Likewise, a user's saccade–to–fixation ratio could provide insights into the relative time spent on searching vs. processing. Therefore, the gaze feature set for Information Processing included fixation duration and saccade–to–fixation ratio features only.
As shown in Figure 6, both the Information Searching and Information Processing features fared very well, and in most cases, there was no statistically significant difference in accuracies compared to the Complete Feature Set or the full No AOI feature set. The fact that both of these feature sets were able to accurately produce inferences suggests that cognitive style significantly influences both a user's information searching and a user's information processing behavior when using information visualization systems. This also confirms the above analysis of important features, since many Information Searching and Information Processing features were previously shown to be informative for classifications. When specifically analyzing the features used in the information searching subset experiments, low saccade length standard deviations and saccade length sums were again indicative of FD (Table 4). In addition, a low total number of fixations feature was found to indicate FI, meaning that field-independent users need less fixations to find the information they are looking for. As shown in Table 5, information processing features related to fixation durations such as standard deviation and average were again indicative of FD, while additionally a low fixation duration sum was indicative of FI. This is in line with the results for the complete feature set, as well as the information searching feature set.
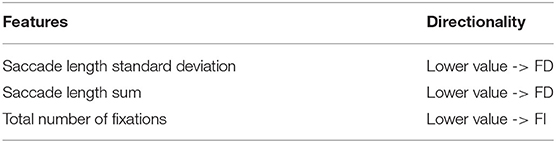
Table 4. Most informative gaze features for predicting cognitive style (Searching features).
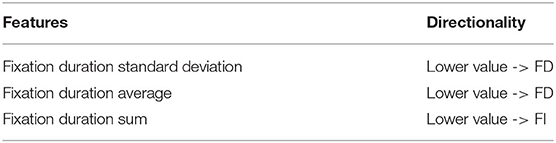
Table 5. Most informative gaze features for predicting cognitive style (Processing features).
Data Set Split Based on Information Density
Lastly, we performed a series of experiments to evaluate whether inferences would be comparably easy or difficult depending on different information density tasks. To this end, we split our data set according to information density and ran separate classification experiments. Our hypothesis was that the higher information density tasks may be more discriminative, as they may elicit user differences more strongly.
As shown in Figure 7, the highest accuracies were indeed achieved when trying to classify users during high information density tasks (specifically using the RandomForest classifier). In fact, the accuracies achieved during this task-based classification were as high as the best user–session-based accuracies reported in Classifications Using the Complete Feature Set section, namely, up to 86%. This is particularly impressive considering that these inferences only used gaze data from a single task. In terms of feature analysis, the most indicative features were again highly similar to the above analyses. The differences were found to be statistically significantly for the three-way classification, but not the binary classification.
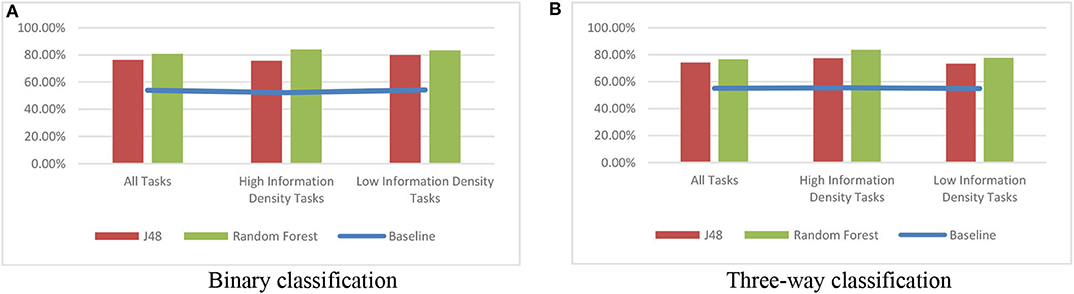
Figure 7. Accuracies for classifications using only high or only low information density tasks. (A) Binary classification. (B) Three-way classification.
Overall, these results confirm our intuition that cognitive style has a greater influence as tasks get more complex, or at least that cognitive style leads users to produce greater differences in eye gaze behaviors for more complex tasks. This suggests that a system that attempts to infer a user's cognitive style should do so during more complex tasks, as this should lead to the best possible prediction accuracy.
Summary and Discussion
Overall, the results from the gaze-based inference experiments have proven that it is feasible to determine a user's cognitive style with relatively high accuracy while a user is simply engaged in a typical information visualization task. In fact, the accuracies achieved are comparable to prior work (e.g., Raptis et al., 2017), where user tasks had been specifically designed with the purpose of inferring cognitive styles. Moreover, compared to cognitive ability inference experiments (e.g., Steichen et al., 2014), the accuracies found are generally higher, suggesting that cognitive style may have a stronger influence during visualization tasks than cognitive abilities, or at least influence eye gaze behavior more strongly.
High accuracies were found across different sets of gaze features, including a Complete feature set, a No AOI feature set, as well as Information Searching and Information Processing feature sets. The fact that the No AOI feature set performed almost as well as the Complete feature set shows that the most important differences between field-dependent and field-independent users can be found at an overall interaction level, rather than within individual AOIs. This result is very encouraging in light of building systems that are added on to information visualization systems, rather than fully integrated systems that need to be fully aware of the exact location of individual graph components.
The more detailed analyses of the classification features revealed that saccade lengths, saccade angles, and fixation durations were the most informative. Specifically, it was found that field-dependent users typically have more “uniform” gaze trajectories (e.g., lower standard deviations of saccade lengths or fixation durations), while field-independent users seem to have greater adaptability. In addition, the fact that most of these informative features are typically associated with both Information Searching and Information Processing explains why the two additional feature subsets each fared relatively well compared to the Complete feature set. This finding also suggests that cognitive style influences both Information Searching and Information Processing of users when interacting with information visualization systems.
Our findings also suggested that higher information density tasks elicited stronger differences between users, meaning that an adaptive system is more likely to correctly infer a user's cognitive style if the user's task at hand is more complex. Most notably, for high information density tasks, accuracies achieved using task-based classifications (i.e., classifying a user based on only a single task interaction) were even on par with classifications that used a user's full session data. However, knowing the exact task, or at least the complexity/density of the graph, would again require a very tight coupling of the inference system with the actual visualization system, which may not always be practical.
Combined with the findings in Steichen and Fu (2019), namely, that users with different cognitive styles may benefit from different types of overlay aids (e.g., dynamically overlaying data values within a graph, overlaying horizontal/vertical grids, etc.), the overall results from this paper therefore suggest that an integrated adaptive information visualization system may be feasible. In particular, the system would first infer a user's cognitive style using the models presented above, followed by a personalized adaptation of the graph. However, further research needs to be conducted in terms of when and how to deliver such personalized assistance, as well as measuring the actual perceived and objective benefit of such assistance. Specifically, if a system were to provide adaptive personalization without a user's intervention, the disruption caused by the system may be greater than the achieved benefits. Therefore, great care needs to be taken in terms of the adaptive delivery, which may for example take the form of system-driven support to customization, as proposed in Lallé and Conati (2019).
Moreover, while the inference experiments in this work have been largely successful, they have so far been limited to two types of graphs, namely, bar graphs and line graphs, and a pool of 40 participants. Further research needs to be conducted to see whether other visualizations, particularly more complex ones or ones that differ in terms of other visualization modalities, will lead to similar results and whether an increased number of participants may even increase the accuracies achieved. Likewise, future research would be needed to investigate whether other types of user interfaces would also elicit such differences between users. In particular, since it was found that the graph itself elicited the biggest differences, it may be hypothesized that it may not necessarily also be possible to perform inferences with other interfaces. However, given prior research on the influence of cognitive style on many different visual tasks, it may nonetheless be possible to do so, and it is worth studying the extent of this.
Lastly, while this research was conducted using research-grade equipment, such eye-tracking technology has so far not been fully integrated into general-purpose desktop and mobile computers. However, recent outlooks continue to suggest significant growth in the deployment and adoption of eye-tracking equipment (Eye Tracking Global Forecast to 2025, 2020), and lower-cost devices are already starting to be sold either as stand-alone equipment or even integrated into mobile and AR/VR devices. While it is difficult to estimate the ultimate penetration rate of such equipment, it is conceivable that the production and procurement costs of this technology will reduce sufficiently to allow large-scale deployment within the next decade. In addition, several successful efforts have demonstrated that eye tracking may even be performed using standard cameras (e.g., as found on laptops and phones) (Papoutsaki et al., 2016, 2017), and we are currently in the planning stages for a follow-up study that will investigate the feasibility of our approach using such technology.
Conclusions and Future Work
This paper has presented an initial step toward building information visualization systems that can adaptively support users based on their individual cognitive style. In particular, this paper has shown that it is possible to infer a user's cognitive style using only the user's eye gaze information while performing simple information visualization tasks. Several different feature sets have been shown to provide sufficient informative features to accurately infirm cognitive style, revealing that detailed information on the actual visualization shown (e.g., through detailed AOI information) is not necessary. In addition, it was found that more complex tasks elicited bigger differences in terms of eye gaze behaviors.
Our next steps are to integrate the inference models with adaptation mechanisms in order to study a fully working personalized information visualization system. In particular, Steichen and Fu (2019) had found that different visualization overlays were preferred by users with different cognitive styles, for example, added data values being particularly preferred by field-dependent users, and our inference system could be combined with such overlays to dynamically change the current visualization to best suit individual users. As part of this future work, several different adaptation delivery methods will also be studied, including fully automated, as well as system-driven support to customization mechanisms. In addition, we will conduct further studies to expand on the set of information visualizations beyond simple bar and line graphs, as well as additional adaptation methods beyond the overlays proposed in Steichen and Fu (2019) (e.g., recommending entirely different visualizations). Lastly, we will run additional studies investigating the extent to which the results in this paper may be replicated using standard camera technology, as opposed to research-grade eye trackers.
Data Availability Statement
The datasets presented in this article are not readily available because of the original IRB application specifications. Requests to access the datasets should be directed to Ben Steichen, YnN0ZWljaGVuQGNwcC5lZHU=.
Ethics Statement
The studies involving human participants were reviewed and approved by Cal Poly Pomona Institutional Review Board. The patients/participants provided their written informed consent to participate in this study.
Author Contributions
All authors listed have made a substantial, direct and intellectual contribution to the work, and approved it for publication.
Conflict of Interest
The authors declare that the research was conducted in the absence of any commercial or financial relationships that could be construed as a potential conflict of interest.
Footnotes
1. ^https://catalog.data.gov/dataset/diabetes
2. ^https://catalog.data.gov/dataset/crime-data-from-2010-to-present-c7a76
References
Amar, R. A., Eagan, J., and Stasko, J. T. (2005). “Low-level components of analytic activity in information visualization,” in 16th IEEE Info. Vis. Conf., 15–21.
Brusilovski, P., Kobsa, A., and Nejdl, W., (eds.). (2007). The Adaptive Web: Methods and Strategies of Web Personalization, Vol. 4321. Springer Science & Business Media.
Card, S. (2007). “Information visualization,” in The Human-Computer Interaction Handbook: Fundamentals, Evolving Technologies, and Emerging Applications. eds A. Sears and J. A. Jacko (Lawrence Erlbaum Assoc Inc.).
Carenini, G., Conati, C., Hoque, E., Steichen, B., Toker, D., and Enns, J. T. (2014). “Highlighting interventions and user differences: informing adaptive information visualization support,” in Proceedings of the SIGCHI Conference on Human Factors in Computing Systems, 1835–1844.
Conati, C., Carenini, G., Toker, D., and Lallé, S. (2015). “Towards user-adaptive information visualization,” in Proceedings of the Twenty-Ninth AAAI Conference on Artificial Intelligence (AAAI′15) (AAAI Press), 4100–4106.
Conati, C., Lallé, S., Rahman, M. A., and Toker, D. (2020). Comparing and combining interaction data and eye-tracking data for the real-time prediction of user cognitive abilities in visualization tasks. ACM Trans. Interact. Intell. Syst. 10:2. doi: 10.1145/3301400
Cureton, E. E. (1957). The upper and lower twenty-seven per cent rule. Psychometrika 22, 293–296. doi: 10.1007/BF02289130
Goldberg, J. H., and Kotval, X. P. (1999). Computer interface evaluation using eye movements: methods and constructs. Int. J. Indus. Ergon. 24, 631–645. doi: 10.1016/S0169-8141(98)00068-7
Gotz, D., and Wen, Z. (2009). “Behavior-driven visualization recommendation,” in ACM Int. Conf. on Intelligent User Interfaces, 315–324.
Green, T. M., and Fisher, B. (2010). “Towards the personal equation of interaction: The impact of personality factors on visual analytics interface interaction,” in IEEE Visual Analytics Science and Technology (VAST).
Hall, M., Frank, E., Holmes, G., Pfahringer, B., Reutemann, P., and Witten, I. H. (2009). The WEKA data mining software: An update, ACM SIGKDD Explor. Newslett. 11, 10–18. doi: 10.1145/1656274.1656278
Hudson, L. (1967). Contrary Imaginations; a Psychological Study of the English Schoolboy. Harmondsworth: Penguin.
Jameson, A. (2007). Adaptive interfaces and agents,” in The Human-computer Interaction Handbook (CRC Press), 459–484.
Kirton, M. J., and De Ciantis, S. M. (1986). Cognitive style and personality: the kirton adaption-innovation and cattell's sixteen personality factor inventories. Person. Individ. Differ. 7, 141–146. doi: 10.1016/0191-8869(86)90048-6
Kozhevnikov, M. (2007). Cognitive styles in the context of modern psychology: toward an integrated framework of cognitive style. Psychol. Bull. 133:464. doi: 10.1037/0033-2909.133.3.464
Lallé, S., and Conati, C. (2019). “The role of user differences in customization: a case study in personalization for infovis-based content,” in Proceedings of the 24th International Conference on Intelligent User Interfaces (IUI ′19) (New York, NY: Association for Computing Machinery), 329–339.
Mawad, F., Trías, M., Giménez, A., Maiche, A., and Ares, G. (2015). Influence of cognitive style on information processing and selection of yogurt labels: Insights from an eye-tracking study. Food Res. Int. 74, 1–9. doi: 10.1016/j.foodres.2015.04.023
Oltman, P. K., Raskin, E., and Witkin, H. A. (1971). Group Embedded Figures Test. Consulting Psychologists Press.
Papoutsaki, A., Laskey, J., and Huang, J. (2017). “SearchGazer: webcam eye tracking for remote studies of web search,” in Proceedings of the 2017 Conference on Conference Human Information Interaction and Retrieval (CHIIR ′17), 17–26.
Papoutsaki, A., Sangkloy, P., Laskey, J., Daskalova, N., Huang, J., and Hays, J. (2016). “Webgazer: scalable webcam eye tracking using user interactions,” in Proceedings of the Twenty-Fifth International Joint Conference on Artificial Intelligence (IJCAI′16) (AAAI Press), 3839–3845.
Raptis, G. E., Fidas, C. A., and Avouris, N. M. (2016a). “Do field dependence-independence differences of game players affect performance and behaviour in cultural heritage games?” in Proceedings of the 2016 Annual Symposium on Computer-Human Interaction in Play - CHI PLAY ′16, 38–43.
Raptis, G. E., Fidas, C. A., and Avouris, N. M. (2016b). “Using eye tracking to identify cognitive differences: a brief literature review.” in Proceedings of the 20th Pan-Hellenic Conference on Informatics.
Raptis, G. E., Katsini, C., Belk, M., Fidas, C., Samaras, G., and Avouris, N. (2017). “Using eye gaze data and visual activities to infer human cognitive styles: method and feasibility studies,” in Proceedings of the 25th Conference on User Modeling, Adaptation and Personalization (UMAP ′17), 164–173.
Riding, R., and Cheema, I. (1991). Cognitive styles - an overview and integration. Educ. Psychol. 11, 193–215. doi: 10.1080/0144341910110301
Riding, R. J. (1997). On the nature of cognitive style. Educ. Psychol. 17, 29–49. doi: 10.1080/0144341970170102
Riding, R. J. (2001). The nature and effects of cognitive style. Perspect. Think. Learn. Cogn. Styles 47:72. doi: 10.4324/9781410605986-3
Steichen, B., Ashman, H., and Wade, V. (2012). A comparative survey of personalised information retrieval and adaptive hypermedia techniques. Inform. Process. Manage. 48, 698–724. doi: 10.1016/j.ipm.2011.12.004
Steichen, B., Carenini, G., and Conati, C. (2014). Inferring visualization task properties, user performance, and user cognitive abilities from eye gaze data. ACM Transact. Interact. Intell. Syst. 4:2. doi: 10.1145/2633043
Steichen, B., and Fu, B. (2019). Towards adaptive information visualization - a study of information visualization aids and the role of user cognitive style. Front. Artif. Intell. 2:22. doi: 10.3389/frai.2019.00022
Steichen, B., Fu, B., and Nguyen, T. (2020). “Inferring cognitive style from eye gaze behavior during information visualization usage,” in Proceedings of the international ACM conference on User Modeling, Adaptation, and Personalization (UMAP 2020), 348–352.
Sternberg, R. J., and Grigorenko, E. L. (1997). Are cognitive styles still in style? Am. Psychol. 52, 700–712. doi: 10.1037/0003-066X.52.7.700
Toker, D., Conati, C., and Carenini, G. (2019). Gaze analysis of user characteristics in magazine style narrative visualizations. User Model User Adap. Inter. 29, 977–1011. doi: 10.1007/s11257-019-09244-5
Toker, D., Conati, C., Carenini, G., and Haraty, M. (2012). Towards adaptive information visualization: on the influence of user characteristics. UMAP 2012, 274–285. doi: 10.1007/978-3-642-31454-4_23
Toker, D., Conati, C., Steichen, B., and Carenini, G. (2013). “Individual user characteristics and information visualization: connecting the dots through eye tracking,” in Proceedings of the SIGCHI Conference on Human Factors in Computing Systems (CHI ′13), 295–304.
Velez, M. C., Silver, D., and Tremaine, M. (2005). “Understanding visualization through spatial ability differences,” in IEEE Visualization, VIS, 511–518.
Ware, C. (2004). Information Visualization: Perception for Design, 2nd Edn. San Francisco, CA: Morgan Kaufmann.
Witkin, H. A., Moore, C. A., Goodenough, D. R., and Cox, P. W. (1975). Field-dependent and field-independent cognitive styles and their educational implications. ETS Res. Bull. Ser. 1975, 1–64. doi: 10.1002/j.2333-8504.1975.tb01065.x
Keywords: adaptation, cognitive style, eye-tracking, human-centered computing, personalization, information visualization
Citation: Steichen B and Fu B (2020) Cognitive Style and Information Visualization—Modeling Users Through Eye Gaze Data. Front. Comput. Sci. 2:562290. doi: 10.3389/fcomp.2020.562290
Received: 15 May 2020; Accepted: 26 October 2020;
Published: 27 November 2020.
Edited by:
Marko Tkalcic, University of Primorska, SloveniaReviewed by:
Federica Cena, University of Turin, ItalyMartijn Millecamp, KU Leuven Department of Computer Science, Belgium
Copyright © 2020 Steichen and Fu. This is an open-access article distributed under the terms of the Creative Commons Attribution License (CC BY). The use, distribution or reproduction in other forums is permitted, provided the original author(s) and the copyright owner(s) are credited and that the original publication in this journal is cited, in accordance with accepted academic practice. No use, distribution or reproduction is permitted which does not comply with these terms.
*Correspondence: Ben Steichen, YnN0ZWljaGVuQGNwcC5lZHU=
†These authors have contributed equally to this work