 Roozbeh Sadeghian
 J. David Schaffer
 Stephen A. Zahorian
- 1Department of Data Analytics, Harrisburg University, Harrisburg, PA, United States
- 2Institute for Justice and Well-Being, Binghamton University, Binghamton, NY, United States
- 3Department of Electrical and Computer Engineering, Binghamton University, Binghamton, NY, United States
Automatic Speech Recognition (ASR) is widely used in many applications and tools. Smartphones, video games, and cars are a few examples where people use ASR routinely and often daily. A less commonly used, but potentially very important arena for using ASR, is the health domain. For some people, the impact on life could be enormous. The goal of this work is to develop an easy-to-use, non-invasive, inexpensive speech-based diagnostic test for dementia that can easily be applied in a clinician’s office or even at home. While considerable work has been published along these lines, increasing dramatically recently, it is primarily of theoretical value and not yet practical to apply. A large gap exists between current scientific understanding, and the creation of a diagnostic test for dementia. The aim of this paper is to bridge this gap between theory and practice by engineering a practical test. Experimental evidence suggests that strong discrimination between subjects with a diagnosis of probable Alzheimer’s vs. matched normal controls can be achieved with a combination of acoustic features from speech, linguistic features extracted from a transcription of the speech, and results of a mini mental state exam. A fully automatic speech recognition system tuned for the speech-to-text aspect of this application, including automatic punctuation, is also described.
Introduction
Dementia is broadly defined as deterioration in memory, thinking and behavior that decreases a person's ability to function independently in daily life (McKhann et al., 2011). The clinical diagnosis of dementia, particularly Alzheimer’s disease (AD), is very challenging, especially in its early stages (Dubois et al., 2015). It is widely believed to be underdiagnosed, even in developed countries, and even more so in less developed countries. As people live longer, the prevalence of AD is huge and growing, with more than five million AD sufferers estimated in the US alone and an annual negative economic impact of over $200 billion (Association, 2019). New diagnostics are appearing, but they are often costly (e.g. involving brain imaging or novel lab tests), invasive (e.g. involving spinal taps, blood samples or the use of radioactive tracers), or both. A simple quick non-invasive test would be very desirable. In addition, recruitment for clinical trials of putative dementia therapies is hampered by lack of tests capable of yielding cohorts with a high likelihood of having the condition the therapy is designed to effect. An accurate diagnostic test would increase the feasibility and reliability of clinical outcome monitoring.
There are good indications that dementias can be characterized by several aphasias (defects in the production and use of speech) (Jacobs et al., 1995; Lowit et al., 2006; Cuetos et al., 2007). This seems plausible since speech production involves many brain regions, and thus a disease that effects particular regions seems likely to leave detectable “finger prints” in the speech of those with dementia. There are many relevant background scientific studies reported in the literature including those that attempt to establish specific voice-based features whose distributions are statistically different between those with dementia vs. normal controls (Bucks et al., 2000; Pakhomov et al., 2010; Meilán et al., 2014; König et al., 2015; López-de-Ipiña et al., 2015). Recently, a study by Eyigoz et al. (Manera et al., 2020) has provided additional evidence that the emergence of AD can be predicted using linguistic features.
Using speech as a neuropsychological assessment tool is now widely accepted. For example, the Boston Naming Test (BNT) (König et al., 2015) asks patients to see a picture and respond to questions within a short amount of time. Verbal fluency by describing a picture (Hernández-Domínguez et al., 2018) is another approach involved in diagnosing Alzheimer’s. In most of these works, the features are manually extracted and their correlation to psychological benchmarks such as MCI (Mild Cognitive Impairment) or MMSE (Mini-Mental State Exam) are analyzed. MMSE, is a neuropsychological test (pencil and paper) which yields a score in the 0–30 range in about 10–15 min. Scores above 25 usually are assumed to indicate normal cognition. While not specifically designed for Alzheimer’s diagnosis, it is often a first assessment applied by physicians, and can provide a useful “first cut” assessment. In the current work, we report on experimental results that combine MMSE test scores, basic demographic features (age, gender, race, and years of education) and a pool of features extracted from a voice sample. Using pattern discovery algorithms to identify minimal size feature sets, we provide evidence that combining selected speech features with the MMSE can yield an improved diagnostic test for detecting probable Alzheimer’s disease. These results were obtained using features extracted automatically by algorithms applied to the speech signal (wave file) and either manually produced transcripts or fully automated transcripts produced by a custom designed ASR and punctuation system. The manually generated transcripts and automatically generated transcripts achieve approximately the same level of diagnostic precision, giving support to the hypothesis that current speech recognition technology is capable of supporting a fully automatic system.
The classical approaches to AD diagnosis (McKhann et al., 2011) rely on clinical criteria, often using neuropsychological tests, but require an autopsy for definitive diagnosis. Hence, recently, there has been much effort devoted to more reliable tests, seeking biomarkers in bodily fluids or imaging. Unfortunately, such tests are usually costly in time and money and bring their own risks (e.g. using radioactive tracers, or punctures). It is widely believed that AD is underdiagnosed, particularly in the undeveloped world, but also in the more developed nations. It is also believed that the disease pathology is at work years or decades before cognitive decline becomes apparent. This inability to accurately detect the disease early and accurately may have also contributed to the failures of clinical trials of putative AD agents. Hence, we believe there is a strong need for an accurate diagnostic test that is easy to execute, non-invasive and inexpensive. Here, we present results of efforts to produce such a test based on samples of human speech.
While there is yet no definitive evidence that such a test is possible, we subscribe to the intuition that speech, unique to our species, and requiring the coordinated activity of a number of brain regions, may have the characteristic that a lesion in one or more of these brain regions may well leave distinct finger prints in the speech. Furthermore, it is known that some speech-based tests have diagnostic utility (e.g. verbal fluency). Given recent advances in computational linguistics, this intuition seems to have a growing following based on the recent increase of research publications aimed in this direction.
We perceive two major challenges: one scientific, and one engineering. Can we provide convincing evidence that accurate diagnosis is possible with speech-based features, and can such a test be automated to the level that relatively untrained clinicians can use it? We believe our results provide encouragement that both challenges can be met.
This paper is organized as follows. In Speech Sample Collection we review the collected dataset and give some analysis of the dataset. In Using ASR to Obtain the Transcripts, the methodology of speech-to-text analysis is described. In Classifier Design the final machine learning model that we used is described. Conclusions are given in Conclusions.
Speech Sample Collection
A popular protocol for collecting speech samples for aphasia analysis work is to ask volunteers to describe what they see in a picture. They are able to view the picture while they speak. This protocol was used for all speech samples used in this work. There are some speech samples available on the web from the Dementia Bank audio database (Weiss and Bourgeois, 2012), but the audio quality is quite low. For our earlier work (Schaffer et al., 2005), we did exploit 140 of the Dementia Bank cases using manually prepared transcripts. This significantly increased our sample size. These samples were examined for use, but were generally of too low quality to be used for the experimental work reported in this study, especially the automatic speech recognition component. Since our long range goal was a fully automatic diagnostic tool, later work used our ASR system, which limited our samples to our own with high audio quality.
Since we elected not to use the Dementia bank database, 72 new samples (summarized in Table 1) were collected using modern digital recording equipment and a new picture (Sadeghian et al., 2015; Sadeghian et al., 2017). Twenty-six of these participants were AD (identified by measuring MMSE score, and verified by physician assessments) while 46 of them were normal. The average sample length was 75.1 s (sd 61.0 s) and the average age was 73.8 years (sd 12.1 yrs). Some modest preprocessing was performed on audio files, such as removing the beginning and ending pauses, click removal and signal strength normalization. These steps are straightforward to automate. The resulting acoustic speech files were processed directly for acoustic features such as pauses and pitch contours. A manual transcript was generated for each of the 72 samples. The manual transcripts were used to extract linguistic features (e.g. word counts, syntactic complexity, idea density). For comparison, we also created transcripts using ASR (Automatic Speech Recognition) and give diagnostic results based on the automatic methods.
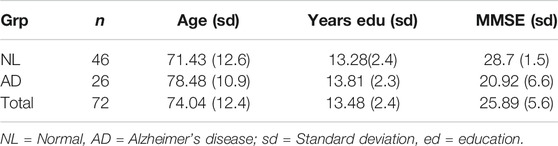
TABLE 1. Demographic Summary of dataset.
Features, Subset Selection and Classification Approach
Each transcript was passed to the Charniak Parser (Charniak, 2000) trained with the Penn Treebank Switchboard corpus. The raw text of the transcript, and the part-of-speech (POS) tagged parser outputs were used to compute a number of linguistic metrics. These metrics include (but not limited to): average number of words per sentence, percentage of sentences that are classified as being “short,” i.e. at most 5 words, length of the shortest sentence, the fraction of the words in the transcript that are auxiliary verbs or infinitives.
The syntactic complexity measures computed by Roark et al. (2011)) were computed, including a re-implementation of idea density (Snowdon et al., 1996). A number of metrics that capture various aspects of vocabulary richness were also computed as well as counts of words related to the picture content. The Linguistic Inquiry Word Count (LIWC2015 (Pennebaker et al., 2015)) features were also computed. These and all the other features, such as speech pauses and pitch features, were combined into a single feature vector for each subject. These 231 features from the speech samples were combined with four demographic features and the MMSE score to give 236 total potential features. This feature computational procedure is illustrated in Figure 1.
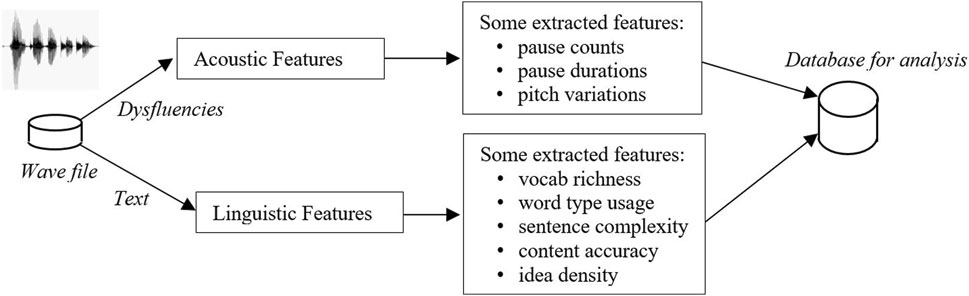
FIGURE 1. Block diagram for creating database of features.
Using ASR to Obtain the Transcripts
In a fully automatic system, all the steps must be done automatically, including the crucial step of speech-to-text. There were about 72 min of data collected from participants. All the ASR work was done with Kaldi software (Povey et al., 2011). We made use of a combination of Hidden Markov Model (HMM) and Deep Neural Network (DNN) methods. In the beginning stages of this work we attempted to use a commercial off the shelf system, but did not find it suitable to be adapted for this application.
ASR Design
The first step for designing an ASR system is to prepare the dictionary (lexicon), which is a listing of all the words used in the language model, and the allowable pronunciations for each of these words. For the ASR acoustic models, we first created simple monophone models, then used those models to design triphone models, and finally implemented a DNN-based recognizer using the triphone models. All models were built using 39 Mel Frequency Cepstral Coefficient (MFCC) features, computed with 25 ms frames spaced apart by 10 ms. A Bigram language model was developed based on the manual transcriptions. For monophone models, 3-state HMMs with 64 mixtures were used whereas for triphone models, 500 tied states were modeled with 8,000 Gaussian mixtures.
For the DNN part of the recognizer, a network with two hidden layers was used in which each layer had 300 neurons. The initial learning rate was α = 0.015 and it was decreased to α = 0.002 in the final step. The activation function was hyperbolic tangent and the minibatch size was 128. To estimate the initial parameters of the model, we tested using the training data (ten different sets of test data were chosen with replacement from the same training cohort). Results are given in Table 2. We refer to cases where the train and test sets are the same as “cheating,” and these cases are clearly not a true indication of performance on unseen data. Such cases, however, are useful to estimate an upper limit on accuracy possible with a given method.
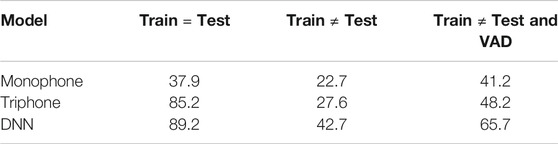
TABLE 2. ASR Word Accuracy (%).
When we used “honest” (completely separate training and test data) with 10-fold cross validation (Bishop, 2006), the word accuracy for test data was dramatically degraded to 47% from the best DNN case (89.2%) given in Table 2. This extremely poor generalization from training to test data led us to look for problems by carefully examining the speech files. By listening carefully to the files, we observed many silences (pauses) in the files that could be removed with an algorithm. We speculated that these silence intervals were severely degrading ASR accuracy. To address this issue we used a VAD (Voice Activity Detector) system.
A Voice Activity Detector (VAD) is a method for detecting the presence of speech in an audio signal. Several VAD algorithms are available (Savoji, 1989; Benyassine et al., 1997; Sohn et al., 1999). The method which we chose for this work was based on Sohn et al. (1999)). In this method, the unknown parameters are estimated using maximum likelihood (ML) and a likelihood Ratio Test (LRT). Further decision optimizations were performed using the decision directed (DD) method (Ephraim and Malah, 1984) and a hang-over scheme based on Hidden Markov Models (HMMs) for estimation of the unknown parameters. We describe and illustrate this method a little more in the next paragraph.
Consider a speech signal which is degraded by uncorrelated additive noise. In this case, for each frame we can define null and alternative hypotheses as (where S is signal and N represents noise):
An overview of the method is depicted in Figure 2. Applying VAD to the speech files removed an enormous amount of silence within the speech files. Figure 3 shows the effect of this VAD on one of the speech samples from the database. As can be seen, most of the silence in the speech file is removed using the VAD algorithm. VAD helps to improve ASR accuracy. Although the average of the recognizer HMM + DNN “honest” accuracy is increased to around 65.7%, in comparison to state-of-the-art ASR methods, the accuracy still seems low.
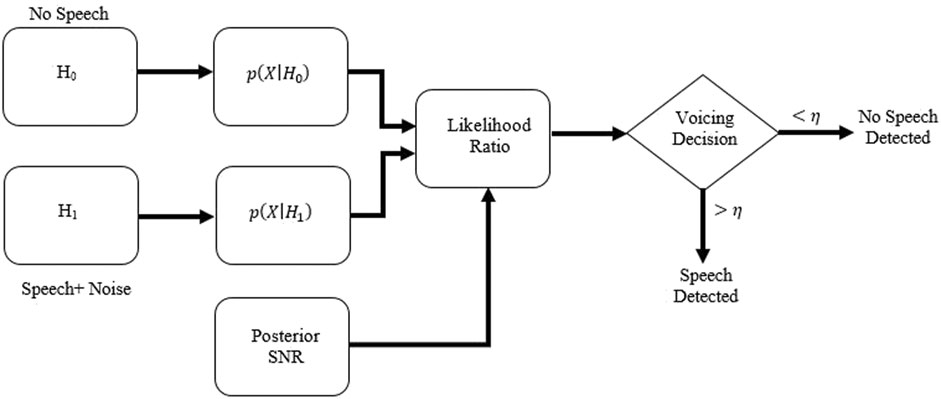
FIGURE 2. Diagram of using VAD for speech Bishop, 2006.
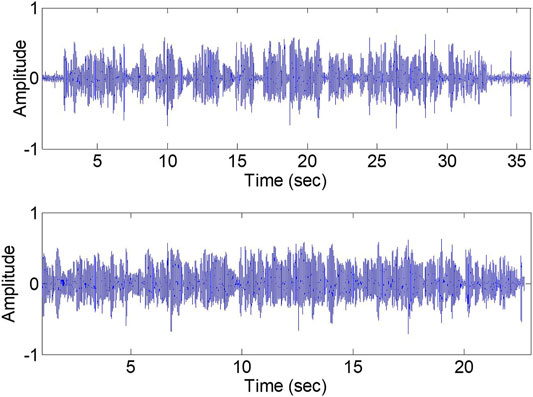
FIGURE 3. Plot of sample speech segment before (upper) and after (lower) applying VAD.
The accuracy highly depends on the number of speakers used for training. Increasing the size of the training database improves the acoustic model by using more samples which results in better Gaussian Mixture Model (GMM) and other parameter estimates. Additionally, the language model also highly depends on the number of training speakers. Since the number of speakers in the database was only 72, the best way to examine this effect was to use the Leave one out (LOO) method where we used 71 speakers for training and just one for testing, and then repeat for each speaker. The minimum accuracy among all the speakers was 22.4% and the maximum accuracy was 93.9%; the average accuracy was 68.7% with a standard deviation of 16. A closer examination of the worst case speaker revealed that the speaker still had a large number of pauses and OOV (Out of Vocabulary) words. Although the improvement in accuracy from 68% to 68.7% is very modest, at least it is in the right direction and also the LOO method allows us to look at the performance of each speaker individually. Based on the assumption that a word accuracy of 68.7% would be sufficient, and the fact that there were no clear-cut ways to improve this accuracy for this very difficult small database, we used the ASR method just described for the remainder of this work.
Automatic Punctuation
As mentioned earlier, we wanted to make use of two type of speech features, acoustic and linguistic features. For extracting linguistic features, the main punctuation needed is the sentence boundaries. The accuracy needed in the determination of sentence boundaries, the accuracy of determining “.” vs. no punctuation, and the benefit of determining other punctuation is not clear. One method for automatic punctuation is to determine the sentence boundaries using a Support Vector Machine (SVM) and place the periods through a machine learning method (Beeferman et al., 1998). One other method which is popular is to use Conditional Random Fields (CRF) in the lexicon and, based on pause information, detect the sentence boundaries (Wei and Ng, 2010). Batista and Mamed (Batista and Mamede, 2011) used a combination of these two methods in Portuguese speech. The method that we used for this work was based on the method of Tilk (Tilk and Alum, 2016). In this method, a model based on a Recursive Neural Net (RNN) is developed which is trained using provided transcriptions. The structure of this model is depicted in Figure 4. The inputs of this model are one-hot encoded sequences of words in sentences where an end of sequence token is added to the list. The ultimate output of the network at time t is the prediction of the probability of punctuation yt which is used between word −1 and xt. The Gated Recurrent Unit (GRU) approach was developed by Cho et al. (2014)) whereby each recurrent neuron captures the dependencies of different time scales adaptively. Using a GRU activation function with a shared embedding layer weight of We, the state ht for the forward recurrent layer is defined by:
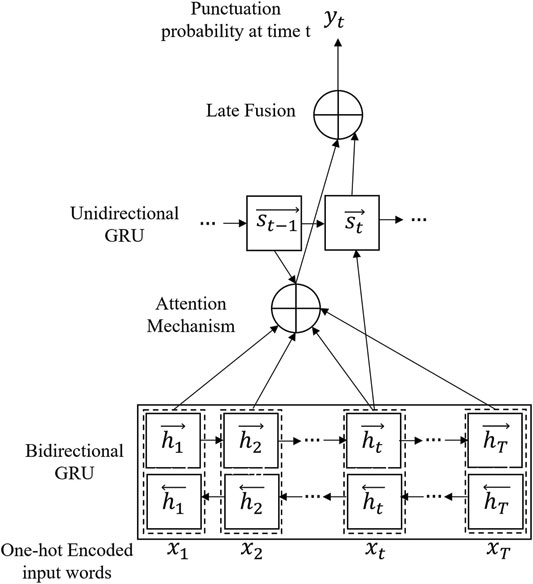
FIGURE 4. The structure of the punctuation detection model.
Similarly, a reverse recurrent state can be defined with
On top of this bidirectional state, there is a unidirectional GRU which keeps the track of the position at time t (based on the mechanism explained by Bahdanau et al. (2015)). There is a late attention that can consider both bidirectional and unidirectional outputs and creates an output to the late fusion step. The output of this model is the probability of using each punctuation at time t in the sequence of words. For our project, since only the boundary of sentences was important, we considered the “period” as the only punctuation that is required to be predicted. For this whole process of punctuation prediction, the effect of the acoustic part of speech is not considered. Tilk and Alum (2016) described another variation of this method in which another layer is added to the model that uses the effect of the duration of the pause in model design and it is considered part of the input training data. Although it may improve the results, this method was not used in this work, due to the added complexity.
For training the model, originally we used our own database but, because of the low number of sentences, the model was not accurate. Therefore, we used one of the available free databases, “Europal v7” (Kohen, 2005). In the English version of this corpus, 2,218,201 sentences from more than 800 speakers, containing more than 53 million words, were used. Around 90% of these data were used for training while 10% were used as a development (validation) set. There are two classes--no punctuation and period. The training and testing data is chosen based on the sequence of the punctuations and their location in sentences.
The RNN model was trained using a learning rate of 0.02 while an L-2 norm of the gradient was kept below the threshold of 2 by renormalization whenever it exceeded the threshold. The stopping criteria for training was whenever the perplexity of the development set became worse for the first time during the iterations. In the first step, the weights were initialized using the normalization technique with zero bias. All the hidden layers contained 256 neurons. For training the model the Theano package (Bastien et al., 2012) with a GPU (Graphical Processing Unit) was used. The sequence of input words was chunked into 200 word long slices where each slice starts with the first word of the relevant sentence and if the slice ends with an unfinished sentence, the sentence is copied to the beginning of the next slice. Clearly, the output sequence is one element shorter since no punctuation is placed before the first word. Because of the huge amount of training data, the slices were grouped to mini-batches of 128 slices and were shuffled before each epoch. The output vocabulary can predict any punctuation such as comma, period, question mark and no punctuation. However, for this project, we only predicted the period. The error rate of punctuation prediction in this case is 15.3%. This error rate is computed by comparing the predicted punctuation and the actual one from manual punctuation. The f1-score (test of accuracy) was also obtained. This value is computed from the combination of precision (correctly positive predictive values out of all the predicted positive values) and recall (correctly positive predictive values out of all the actual positive values). The f1-score is below what we expected but this is mostly due to many OOVs in transcription that the DNN is not capable of punctuating accurately. The confusion matrix, cumulative over all 72 subjects, is given in Table 3.
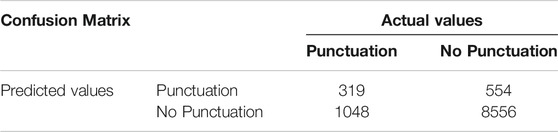
TABLE 3. Confusion Matrix of Punctuation Detector.
Classifier Design
The end goal of this work, from a technical perspective, is a two-way classifier to determine AD vs. NL (Normal) from a slate of features selected from the very large group described above. This problem is very challenging due to the very large number of candidate features (236), and the small database (72 speakers). We hypothesized that only 5–10 of these 236 features would be needed and useful for the final decision making. The challenge was to “discover” these “good” features using a small database, and in a manner that these features and classifier would perform well for data other than those used in this study. The two-way classifier model and the feature subset selector are depicted in Figure 5. All subjects were divided 90/10 into training and validation sets and full 10-fold cross validation was performed. For thoroughness, three approaches were used to investigate this step—GA-SVM, Random Forest, and Neural Network.
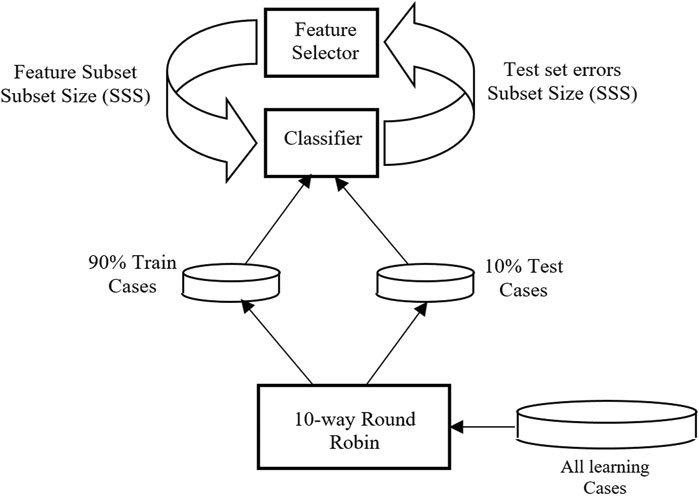
FIGURE 5. Overview of classifier to determine AD/NL decision.
In our first approach, based on the diagram shown in Figure 5, a genetic algorithm (GA) was used as the feature subset selector while a Support Vector Machine (SVM) was the classifier which was trained using the features selected by the GA. This GA-SVM approach has been successfully applied to a number of bioinformatics pattern discovery tasks (Schaffer et al., 2005). This approach may generate and test more than a million subsets before it halts. An array of top candidates usually yields several alternative feature-set classifiers with differing performance. Summarizing, the genetic algorithm strives to locate feature sets of high accuracy and minimum size.
We used a 10-fold cross-validation approach. Each fold used 90% of subjects for feature subset identification and model training. The remaining subjects were tested only once. The different folds often found different feature sets to be best, but there were many commonalities. In the end, we identified 12 different feature sets, all comprising combinations of only 10 features. The five most important features are listed in Table 4. Each of these feature-sets (called classifiers) was then trained on each fold’s training data and tested on the test cases only once. Experiments showed that 12 different classifiers typically made errors on different subjects, so their classification predictions could profitably be combined with an ensemble method. A Generalized Regression Neural Network (GRNN) (Specht, 1991) oracle is a maximum-likelihood, minimum variance unbiased estimator that has been shown to give very robust classification performance (Masters et al., 1998). Theoretically, it is the best one can do with a fixed data set. Since each of the 12 classifiers made different errors, they were combined using the GRNN oracle ensemble method yielding a single diagnosis predictor.
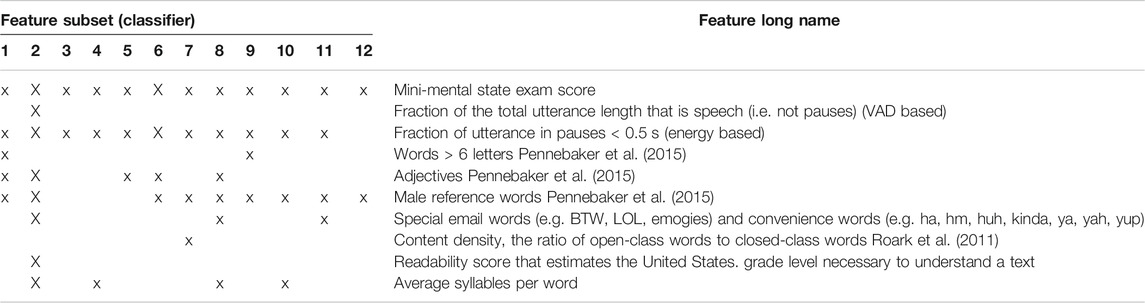
TABLE 4. Selected Features By Classifier.
Since we had so few cases, we did not try to locate new features subsets that might have benefited from the automatic transcripts, but simply applied the same classifiers found on the large dataset, but tuned them separately for the manual and automatic transcripts in the same 10-fold fashion. The MMSE alone, the oracle using manual transcripts, and the oracle using automatic transcripts all made eight errors (8/72 = 11.1%), with seven subjects being misclassified on all. They made an error on one unique subject each. These seven common erroneously classified subjects were also errors of the oracle trained on the large dataset. From these results, we draw confidence that the fully automatic diagnostic test is likely to have the same success1.
Random Forest
Random forest (RF) is a machine learning technique in which a decision tree is developed using the training data. RF was introduced by Ho (1995). Generally, decision trees or recursive partitioning models are a decision tool based on tree-like graphs and their possible consequences. It creates a flow chart which contains nodes (leaves) and decisions extracted from each node (branches). These leaves and branches form a tree-shaped graph which is referred to as decision tree. This model can yield high accuracy, robust performance and ease of use. This method is, however, highly sensitive to data. Hence, resampling is used to mitigate this issue. Every node in a decision tree, represents a decision (target) based on a single feature and a threshold which splits the dataset into two so that similar response values are collected in the same set. On this fully automated system, 90% of the data (66 subjects) were used for training while the remaining speakers were used just one time for testing. A 12-fold cross-validation was used with the training data which means that 90% of the data were used for training and the rest for a validation set. The training data were processed by the RF model to determine the best combination of the features. The total number of features was experimentally found to be 25, with10 trees in the forest. The function of the quality of split is called “Gini.” Gini impurity is the factor showing how often a randomly selected label is incorrectly assigned based on the actual target distribution. Mathematically, it is the summation of the multiplication of the probability of the properly chosen label (pi)) times the probability of the incorrectly chosen label (1−pi) for all labels
The function is minimized when all the classes in the node lead to a similar target. Nodes were expanded until all leaves are pure or until all leaves contain fewer than two samples. Each node was split until its impurity was higher than a threshold of 1e-7; otherwise it was considered as a leaf. Due to the randomness of the process, the experiments were repeated 100 times and the most repeated features were considered as the desired ones. After finding the best combination of 25 features, these features were tested only one time on the test set. A diagram of this method is depicted in Figure 6.
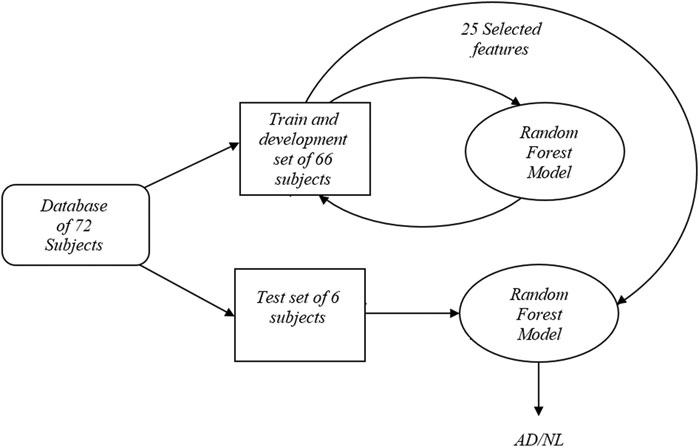
FIGURE 6. Block diagram of random forest approach.
A 12-fold cross validation test was considered whereby each speaker was used only one time as the test speaker. The overall accuracy using this methodology was 84.00%. Using LOO (Leave One Out) cross validation, improved the overall accuracy to 87.5% which shows again how having more data can improve the overall accuracy for this technique. In this technique, all speakers except one were used for feature selection and, after training the model using the most frequently used features, the model is evaluated on only one speaker. This procedure is repeated for all the subjects individually.
Multi-Layer Perceptron
As yet another method, the feature selection was repeated using a using a NN (Neural Network) - Multi-Layer Perceptron. For this model, a NN with one hidden layer (containing 25 nodes) was used as a two-way classifier. The activation functions were sigmoid. The inputs were features to be evaluated (from training data) and the outputs were assigned labels for each subject. A greedy approach was used whereby initially each of the 236 potential features was evaluated individually and the best performing feature was found. Best performance was determined by highest accuracy on a group of test speakers. After the best 1-feature classifier was found, the best 2-feature classifier was found by testing all 2-feature options, given that that one of these 2 features was the best feature for the 1-feature classifier. This process was repeated until some termination point (explained below) was reached.
The initial experiments “over fit” the training set due to minimizing the expected loss instead of empirical loss defined on the training set. To resolve this issue, a weight decay (Krogh and Hertz, 1991) term was added to the loss function, i. e.
where l(W,b) is the original loss function, λ is the weight decay parameter and R(W) is defined by:
The decay parameter (L1-regularization) for this experiments was set to be 0.1 experimentally. Another popular approach for preventing overfitting, which was also used in our work, was dropout (Srivastava et al., 2014). The idea of dropout is that α percent of neurons are omitted from hidden layers during the training phase. This adds some random noise to the network through some hidden layers whereas even with similar inputs, there is no guarantee that higher layers will receive similar inputs. This is achieved by forcing the activation nodes to zero while in the test phase the average of the neurons are used. The rate of dropout for this work was 0.02, again experimentally determined.
For inputting data to the model, the Stochastic Gradient Descent (SGD) (Bottou, 1998) technique was used. This method updates the parameters of the NN model from only a single training sample. One main advantage of SGD is that, despite batch learning, due to its noisy gradient estimation it can easily jump out of the local minima in estimation iterations.
For the first part of the experiments, 72 subjects (fully automated system) were used where the data were partitioned as explained previously. Ten-fold cross validation was used to find the best combination of the features through the greedy approach described above. The best feature sets which were revealed by validation data were later used on a test set to determine the accuracy of the model. Using these features, the average accuracy of the testing set was 94.44%. As a comparison, the same model was created using manual transcripts, which increased the accuracy slightly to 95.83%. The top three features using this strategy were MMSE, fraction of pauses greater than 1 s and fraction of total speech recording that was silence.
As we mentioned earlier, the MMSE score is the most important feature (best single feature) for an AD/NL classifier. To see its strength, we tested this feature as the only feature for the classifier. An accuracy of 70.83% was obtained. To see how well the MMSE feature could be compensated for by other features, we removed the MMSE feature and used the NN feature selector/classifier as described above. This gave an accuracy of 91.67% for manual transcripts and 93.05% for the automatic one. The top three features using this strategy were speech rate, idea density and fraction of pauses greater than 1 s.
A summary of the key results for the random forest and neural network two way classifiers (AD/NL) are given in Table 5, in terms of accuracy, sensitivity, and specificity.
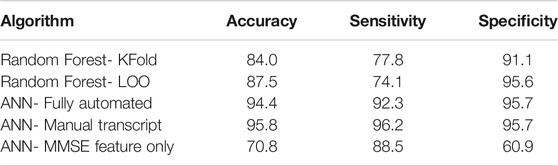
TABLE 5. Final Accuracy, Sensitivity, and Specificity (%) of Different ML Models.
Conclusions
There do appear to be strong patterns among the speech features that are able to discriminate the subjects with probable Alzheimer’s disease from the normal controls. The GA-based feature subset selection approach provides a powerful way to locate multiple classifiers that contain many common features combined with some less common ones, lending themselves to being combined with ensemble methods (Masters et al., 1998). We have shown this elsewhere (Land and Schaffer, 2015) along with a method for enabling the classifier to know when it should not be trusted. However, these results are likely to be sensitive to small samples, suggesting larger samples should be used for future research in this domain.
The greedy algorithm combined with the neural network two-way classifier was very promising for both feature selection and final recognizer. For feature selection, this approach was at least two orders of magnitude faster than the GA method. The limitation of the NN method is that the search of the feature space is not nearly as exhaustive as for the GA method. In future work, the NN method could be improved in terms of more thorough searching by saving the top N (where N is some small number such as 5–10) choices at the end of each iteration, at the expense of some slowdown in speed. The NN classifier, using common features, was also as good as the SVM used as the final classifier with the GA.
We believe this study provides encouragement to seek speech patterns that could be diagnostic for dementia. The weaknesses of this study, aside from the obviously very small sample size, include the cross-sectional design that strives for a single pattern that works over the whole variety of subjects in each class. A longitudinal study would permit each subject to serve as his own control, helping to mitigate the large within-group variance in speaking patterns, as well as introduce the possibility for predicting dementia that is currently not manifest. The features used are by no means all the speech features that have been associated with dementia. The computational linguistics domain contains several additional interesting speech features that, with some effort, could be included in our basket of candidate features.
The best accuracy of ∼ 96% achieved in this study for diagnosing Alzheimer seems promising considering the small number of samples used. Additionally, the results of manually and automatically transcribed systems are similar, which shows that the ASR system worked in an acceptable range and the punctuator system was likely accurate enough. Summarizing across all the Alzheimer’s experiments, we conclude the following with respect to features (from possibilities including MMSE score, demographics, and acoustic speech features, linguistic speech features) and approximate detection accuracy:
1) The most informative single parameter is the MMSE alone, which results in a detection accuracy of about 71%.
2) If all possible features, including MMSE scores, are considered, a detection accuracy of approximately 94% is possible, using fully automatic methods. Based on the features listed in Table 4, MMSE is always chosen as one of the key features. Three linguistic and one acoustic features are selected, which are fraction of pauses more than 5 s in duration, speech and the LIWC quantitative feature.
3) If all possible features, except MMSE scores, are considered, a detection accuracy of approximately 92% is possible, based on the features listed in Table 4.
4) If only demographic and acoustic features (the “easy” ones) are considered, a detection accuracy of approximately 83.33% is possible. However, for this case, there was low sensitivity. That is, there was a high error rate for AD subjects (often diagnosed as NL). The most important features for this case are speech rate (using energy and VAD), fraction of speech length to the length of whole audio and fraction of pause length to the whole audio file.
Data Availability Statement
The datasets presented in this article are not readily available because we will consider sharing the data with others with the consent of the University's Ethics Committee, as it may always be possible to identify research subjects from their voices. Requests to access the datasets should be directed to David Schaffer,ZHNjaGFmZmVAYmluZ2hhbXRvbi5lZHU=.
Ethics Statement
The studies involving human participants were reviewed and approved by the State University of New York at Binghamton University and United Health Services. All subjects provided written informed consent, and in the cases of subjects with AD, a healthcare proxy also provided informed consent. The patients/participants provided their written informed consent to participate in this study.
Author Contributions
RS worked on implementing the speech recognition and machine learning tests and providing the first draft of paper. JS, collected the samples and created the manual transcripts and worked on initial GA-SVM model. He also worked on preparing the manuscript. SZ, was the lead of team and advisor of the group. He worked on preparing the final manuscript.
Conflict of Interest
The authors declare that the research was conducted in the absence of any commercial or financial relationships that could be construed as a potential conflict of interest.
Footnotes
1The interested reader may find many more details on our analyses of these data in Walker and Schaffer (2019)
References
Association (2019). 2015 Alzheimer's disease facts and figures. Alzheimers Dement 11, 332–384. doi:10.1016/j.jalz.2015.02.003
Bahdanau, D., Cho, K., and Bengio, Y. (2015). Neural machine translation by jointly learning to align and translate. arXiv.
Bastien, F., Lamblin, P., Pascanu, R., Bergstra, J., Goodfellow, I., Bergeron, A., et al. (2012). Theano: new features and speed improvements. arXiv.
Batista, F., and Mamede, N. (2011). Recovering capitalization and punctuation marks on speech transcriptions. PhD dissertation. Lisboa, Portugal: Instituto Superior Técnico.
Beeferman, D., Berger, A., and Lafferty, J. (1998). “Cyberpunc: a lightweight punctuation annotation system for speech,” in Proceedings of the 1998 IEEE International Conference on Acoustics, Speech and Signal Processing, ICASSP'98, Seattle, WA, May 15, 1998 (IEEE). doi:10.1109/ICASSP.1998.675358
Benyassine, A., Shlomot, E., Su, H. Y., Massaloux, D., Lamblin, D., and Petit, J. P. (1997). ITU-T Recommendation G.729 Annex B: a silence compression scheme for use with G.729 optimized for V.70 digital simultaneous voice and data applications. IEEE Commun. Mag. 35, 64–73. doi:10.1109/35.620527
Bottou, L. (1998). Online learning and stochastic approximations. On-line Learn. Neural networks 17 (9), 142. doi:10.1017/CBO9780511569920.003
Bucks, R. S., Singh, S., Cuerden, J. M., and Wilcock, G. K. (2000). Analysis of spontaneous, conversational speech in dementia of Alzheimer type: evaluation of an objective technique for analysing lexical performance. Aphasiology 14 (1), 71–91. doi:10.1080/026870300401603
Cho, K., Merrienboer, B. V., Gulcehre, C., Bahdanau, D., Bougares, F., Schewenk, H., et al. (2014). Learning phrase representations using RNN encoder-decoder for statistical machine translation. arXiv. doi:10.3115/v1/D14-1179
Cuetos, F., Arango-Lasprilla, J. C., Uribe, C., Valencia, C. F., and Lopera, F. (2007). Linguistic changes in verbal expression: a preclinical marker of alzheimer's disease. J. Int. Neuropsy. Soc. 13, 433–439. doi:10.1017/S1355617707070609
Dubois, B., Padovani, A., Scheltens, P., Rossi, A., and Dell’Agnello, G. (2015). Timely diagnosis for alzheimer's disease: a literature review on benefits and challenges. J. Alzheimers Dis. 49 (3), 617–631. doi:10.3233/jad-150692
Charniak, E. (2000). “A maximum-entropy-inspired parser,” in Proceedings of the 1st North American chapter of the Association for Computational Linguistics conference, April, 2000, Stroudsburg, PA, United States, pp. 132–139.
Ephraim, Y., and Malah, D. (1984). Speech enhancement using a minimum-mean square error short-time spectral amplitude estimator. IEEE Trans. Acoust. Speech Signal Process. 32 (6), 1109–1121. doi:10.1109/tassp.1984.1164453
Hernández-Domínguez, L., Ratté, S., Sierra-Martínez, G., and Roche-Bergua, A. (2018). Computer-based evaluation of Alzheimer's disease and mild cognitive impairment patients during a picture description task. Alzheimer’s Demen. Assess. Dis. Monit. 10, 260–268. doi:10.1016/j.dadm.2018.02.004
Ho, T. K. (1995). “Random decision forests,” in Proceedings of the 3rd international conference on document analysis and recognition, Montreal, QC, August 14–16, 1995 (IEEE), 278–282. doi:10.1109/ICDAR.1995.598994
Jacobs, D. M., Sano, M., Dooneief, G., Marder, K., Bell, K. L., and Stern, Y. (1995). Neuropsychological detection and characterization of preclinical alzheimer's disease. Neurology 45, 957–962. doi:10.1212/wnl.45.5.957
König, A., Satt, A., Sorin, A., Hoory, R., Toledo-Ronen, O., Derreumaux, A., et al. (2015). Automatic speech analysis for the assessment of patients with predementia and Alzheimer's disease. Alzheimers Dement (Amst) 1, 112–124. doi:10.1016/j.dadm.2014.11.012
Krogh, A., and Hertz, J. A. (1991). “A simple weight decay can improve generalization,” in Proceedings of the 4th International Conference on Neural Information Processing Systems, San Francisco, CA, December 1991 (NIPS), 950–957.
Land, W. H., and Schaffer, J. D. (2015). Predicting with confidence: extensions to the GRNN oracle enabling quantification of confidence in predictions. Proced. Comp. Sci. 61, 381–387. doi:10.1016/j.procs.2015.09.164
López-de-Ipiña, K., Solé-Casals, J., Eguiraun, H., Alonso, J. B., Travieso, C. M., Ezeiza, A., et al. (2015). Feature selection for spontaneous speech analysis to aid in Alzheimer's disease diagnosis: a fractal dimension approach. Comp. Speech Lang. 30 (1), 43–60. doi:10.1016/j.csl.2014.08.002
Lowit, A., Dobinson, B. C., and Howell, P. (2006). An investigation into the influences of age, pathology and cognition on speech production. J. Med. Speech Lang. Pathol. 14, 253–262.
Manera, E., Mathur, S., and Santamaria, M. (2020). Guillermo cecchi, and melissa naylor, "linguistic markers predict onset of alzheimer's disease. Eclinical Med. 27, 100583. doi:10.1016/j.eclinm.2020.100583
Masters, T., Land, W. H., and Maniccam, S. (1998). “An oracle based on the general regression neural network,” in IEEE International Conference on Systems, Man, and Cybernetics - SMC, San Francisco, CA, October 14, 1998 (IEEE), 1615–1618.
McKhann, G. M., Knopman, D. S., Chertkow, H., Hyman, B. T., Jack, C. R., Kawas, C. H., et al. (2011). The diagnosis of dementia due to alzheimer's disease: recommendations from the national institute on aging-alzheimer's association workgroups on diagnostic guidelines for alzheimer's disease. Alzheimers Dement 7, 263–269. doi:10.1016/j.jalz.2011.03.005
Meilán, J. J., Martínez-Sánchez, F., Carro, J., López, D. E., Millian-Morell, L., and Arana, J. M. (2014). Speech in Alzheimer's disease: can temporal and acoustic parameters discriminate dementia?. Dement Geriatr. Cogn. Disord. 37 (5–6), 327–334. doi:10.1159/000356726
Pakhomov, S. V., Smith, G. E., Chacon, D., Feliciano, Y., Graff-Radford, N., Caselli, R., et al. (2010). Computerized analysis of speech and language to identify psycholinguistic correlates of frontotemporal lobar degeneration. Cogn. Behav. Neurol. 23 (3), 165–177. doi:10.1097/WNN.0b013e3181c5dde3
Pennebaker, J. W., Boyd, R. L., Jordan, K., and Blackburn, K. (2015). The development and psychometric properties of LIWC2015. Austin, TX: The University of Texas at Austin.
Povey, D., Ghoshal, A., Boulianne, G., Burget, L., Glembek, O., Goel, N., et al. (2011). “The Kaldi speech recognition toolkit,” in IEEE 2011 workshop on automatic speech recognition and understanding, Hawaii, United States, December 2011 (IEEE).
Roark, B., Mitchell, M., Hosom, J. P., Hollingshead, K., and Kaye, J. (2011). Spoken language derived measures for detecting mild cognitive impairment. IEEE Trans. Audio Speech Lang. Process. 19 (7), 2081. doi:10.1109/TASL.2011.2112351
Sadeghian, R., Schaffer, D. J., and Zahorian, S. A. (2015). Using automatic speech recognition to identify dementia in early stages. The J. Acoust. Soc. America 138 (3), 1782. doi:10.1121/1.4933648
Sadeghian, R., Schaffer, J. D., and Zahorian, S. A. (2017). “Speech processing approach for diagnosing dementia in an early stage”, in InterspeechStockholm, August 20–24 2017, Sweden. doi:10.21437/interspeech.2017-1712
Savoji, M. H. (1989). Robust algorithm for accurate end pointing of speech. Amesterdam, Netherlands: Speech communication.
Schaffer, J. D., Janevski, A., and Simpson, M. (2005). “Genetic algorithm approach for discovering diagnostic patterns in molecular measurement data,” in IEEE Symposium on Computational Intelligence in Bioinformatics and Computational Biology, La Jolla, CA, November 15, 2005 (IEEE), 7803–9387. doi:10.1109/CIBCB.2005.1594945
Snowdon, D. A., Kemper, S. J., Mortimer, J. A., Greiner, L. H., Wekstein, D. R., and Markesbery, W. R. (1996). Linguistic ability in early life and cognitive function and Alzheimer's disease in late life. Findings from the Nun Study. JAMA J. Amer. Medi. Ass. 275 (7), 528–532. doi:10.1001/jama.275.7.528
Sohn, J., Kim, N. S., and Sung, W. (1999). A statistical model-based voice activity detection. IEEE Signal. Process. Lett. 6 (1), 1–3. doi:10.1109/97.736233
Specht, D. F. (1991). A general regression neural network. IEEE Trans. Neural Netw. 2 (6), 568–576. doi:10.1109/72.97934
Srivastava, N., Hinton, G. E., Krizhevsky, A., Sutskever, I., and Salakhutdinov, R. (2014). Dropout: a simple way to prevent neural networks from overfitting. J. Machine Learn. Res. 15 (1), 1929–1958.
Tilk, O., and Alum, T. (2016). “Bidirectional recurrent neural network with attention mechanism for punctuation restoration”, in Interspeech, September 8–12 2016, San Fransisco. doi:10.21437/interspeech.2016-1517
Walker, H. J., and Schaffer, J. D. (2019). The art and science of machine intelligence: with an innovative application for Alzheimer’s detection from speech. Switzerland: Springer, International Publishing AG.
Wei, L., and Ng, H. T. (2010). “Better punctuation prediction with dynamic conditional random fields”, in Proceedings of the 2010 conference on empirical methods in natural language processing, Massachusetts, October 9–10, 2010.
Keywords: speech processing, natural language processing, machine learning, alzheimer's disease, dementia
Citation: Sadeghian R, Schaffer JD and Zahorian SA (2021) Towards an Automatic Speech-Based Diagnostic Test for Alzheimer’s Disease. Front. Comput. Sci. 3:624594. doi: 10.3389/fcomp.2021.624594
Received: 31 October 2020; Accepted: 16 February 2021;
Published: 07 April 2021.
Edited by:
Fasih Haider, University of Edinburgh, United KingdomReviewed by:
Kevin El Haddad, University of Mons, BelgiumLoredana Sundberg Cerrato, Nuance Communications, United States
Copyright © 2021 Sadeghian, Schaffer and Zahorian. This is an open-access article distributed under the terms of the Creative Commons Attribution License (CC BY). The use, distribution or reproduction in other forums is permitted, provided the original author(s) and the copyright owner(s) are credited and that the original publication in this journal is cited, in accordance with accepted academic practice. No use, distribution or reproduction is permitted which does not comply with these terms.
*Correspondence: Roozbeh Sadeghian, cnNhZGVnaGlhbkBoYXJyaXNidXJndS5lZHU=