 Patrik Jonell1†*
 Birger Moëll1†*
 Krister Håkansson2,3†
 Gustav Eje Henter1
 Taras Kucherenko4Olga Mikheeva4Göran Hagman2,3Jasper Holleman2,3
 Miia Kivipelto2,3Hedvig Kjellström4Joakim Gustafson1
 Jonas Beskow1
- 1Division of Speech, Music and Hearing, School of Electrical Engineering and Computer Science, KTH Royal Institute of Technology, Stockholm, Sweden
- 2Department of Neurobiology, Care Sciences and Society, Karolinska Institutet, Stockholm, Sweden
- 3Karolinska University Hospital, Stockholm, Sweden
- 4Division of Robotics, Perception and Learning, School of Electrical Engineering and Computer Science, KTH Royal Institute of Technology, Stockholm, Sweden
Non-invasive automatic screening for Alzheimer’s disease has the potential to improve diagnostic accuracy while lowering healthcare costs. Previous research has shown that patterns in speech, language, gaze, and drawing can help detect early signs of cognitive decline. In this paper, we describe a highly multimodal system for unobtrusively capturing data during real clinical interviews conducted as part of cognitive assessments for Alzheimer’s disease. The system uses nine different sensor devices (smartphones, a tablet, an eye tracker, a microphone array, and a wristband) to record interaction data during a specialist’s first clinical interview with a patient, and is currently in use at Karolinska University Hospital in Stockholm, Sweden. Furthermore, complementary information in the form of brain imaging, psychological tests, speech therapist assessment, and clinical meta-data is also available for each patient. We detail our data-collection and analysis procedure and present preliminary findings that relate measures extracted from the multimodal recordings to clinical assessments and established biomarkers, based on data from 25 patients gathered thus far. Our findings demonstrate feasibility for our proposed methodology and indicate that the collected data can be used to improve clinical assessments of early dementia.
Introduction
Alzheimer’s disease and other neurocognitive disorders with a neuropathological origin develop gradually over many years before existing criteria of a clinical diagnosis are fulfilled (Blennow et al., 2006; Jack et al., 2018). The irreversible nature of these diseases and the long preclinical phase could make effective preventive non-pharmacological approaches especially appropriate, e.g., life-style changes that promote brain health and that have no negative side-effects (Kivipelto et al., 2017). Making a correct diagnosis is a challenging task, especially in early stages of these diseases (Håkansson et al., 2018); it has been estimated that more than 50% of cases of dementia are undetected (Lang et al., 2017), and that the diagnostic accuracy is only between 70 and 90%, compared to what is revealed in post-mortem neuropathology (Villemagne et al., 2018; Gauthreaux et al., 2020).
The diagnostic uncertainty in neurocognitive disorders incurs great human and monetary costs to patients and society. For the patient, a false diagnosis inflicts unnecessary trauma with devastating consequences on quality of life, in addition to medication with likely negative side-effects. For society, large cost savings are possible if only persons with a high probability of neuropathology are referred to more detailed examinations. In addition, if an underlying pathology can be correctly identified at an earlier stage, this will probably improve the efficacy of pharmacological as well as non-pharmacological counteractive measures. It is therefore of high priority to develop diagnostic tools for these diseases that are more sensitive, less invasive, more cost-effective, and easier to administer. Approaches based on machine learning have proved successful for processing complex information and assisting in medical decisions in several diseases (Hamet and Tremblay, 2017). In recent years, such methods have been developed also for neurocognitive disorders (Bruun et al., 2019; Koikkalainen et al., 2019; Lee et al., 2019a). Typically, clinical information collected through established diagnostic routines is automatically analysed, e.g., via automatic analysis of brain images. But machine learning has also been used to combine many types of clinical data to further aid in the diagnosis of neurocognitive disorders (Bruun et al., 2019; Koikkalainen et al., 2019; Lee et al., 2019a). Another potential application of machine learning for neurocognitive disorders could be the automatic capture and analysis of behavioural signals of potential clinical relevance, both for reducing the risk that such signals are missed by the clinician and for adding new and complementary information beyond what normally is collected in the medical examination. Such applications have been tested and evaluated for single digital biomarkers, such as speech or gaze, and the results have been promising in several cases, as further described in Related Work.
In this study we describe the first comprehensive and highly multimodal approach where signals from numerous behavioural and physiological channels are captured and analysed in parallel in real patients, as an integrated part of the regular clinical examinations at a major regional hospital. To offer a rationale for this multimodal approach, we first (in Medical Background) give a short medical background to neurocognitive disorders and diagnostic challenges, including neuropathological characteristics and behavioural manifestations. In Related Work we then describe recent developments in digital biomarkers of special relevance for this project, including speech patterns, gaze, non-verbal behaviours, and physiological signals. Data Collection then details our comprehensive, multimodal approach for gathering patient behaviour data during clinical interviews. This is followed by Data Analysis, which describes how the data can be analysed to extract digital biomarkers, and Preliminary Findings, which illustrates how the diagnostic relevance of the extracted biomarkers can be analysed. The implications of our preliminary findings and of our data gathering in general are discussed in Discussion, while Conclusion concludes.
Medical Background
Neurocognitive Disorders
Due to continued global increase in life expectancy, the number of persons with chronic diseases is expected to grow dramatically. As for many of these chronic diseases, age is the most important risk factor for getting a neurocognitive disorder (NCD) with a doubled risk for every 5 years of life. At the age of 90, around 50% of the population carries a dementia diagnosis, and the prevalence is around 20% higher for women than for men (Cao et al., 2020). In the case of major neurocognitive disorders (NCD), previously named dementia, no pharmacological treatment exists that can cure or halt the disease process. Approximately 50 million persons today carry some form of NCD, a number that is expected to grow to around 150 million in 2050 if no cure will be been found (Prince, 2015). Due to high-intensive need of care in later phases, these diseases put a high burden on limited care resources and societal economies. Combating these disorders has been declared a priority by the World Health Organization (World Health Organization and Alzheimer’s Disease International, 2012). Neurocognitive disorders exist in various forms, where Alzheimers disease (AD) is the most common globally, accounting for approximately 60% of all cases, but limitations in vascular function to provide sufficient oxygen and nutrients to nerve cells often contribute to cognitive impairments, either alone (vascular dementia), or in parallel with e.g. AD. Cognitive disorders in older age may also derive from other neuropathological conditions such as Lewy-Body Dementia (LDB), Fronto-temporal Dementia (FTD) and Parkinson Dementia (PD), accounting in total for around 30% of all NCD cases (Cao et al., 2020). These neuropathologies are all progressive and ultimately lethal, and they typically develop during a long pre-clinical phase that, in the case of AD, may have been initiated at least a decade before diagnostic criteria are fulfilled (Jack et al., 2018). With more refined measurement techniques, including determination of various protein levels in cerebrospinal fluid and high-resolution brain imaging, it is often possible to determine which of these pathologies may lie behind also a minor NCD, previously globally referred to as “mild cognitive impairment” (MCI).
Neuropathological Characteristics and Processes
There may be several reasons for the failure to find a cure against these disorders, in spite of massive research investments across the world. The dominating disease model, on which hundreds of failed clinical trials have been based, states that AD develops through a cascade of events that are triggered by formation of beta amyloid (Aβ) protein plaques, as originally suggested by Hardy and Higgins (Hardy and Higgins, 1992). More recently, the upstream formation of neurotoxic Aβ oligomers have become more in focus than the plaques, oligomers that may later contribute to plaque formation (McGirr et al., 2020). Even if pharmacological success has been made Alzheimer’s disease in terms of targeting amyloid proteins with an assumed toxicity, and even dissolving amyloid plaques, patients in these trials have not benefitted symptomatically in any of these trials (Kepp, 2017). One reason for appointing special variants of betamyloid proteins, especially the Aβ 1–42 peptide, as the culprit, is the early appearance of level increases in the brain during early phases of the neuropathological development (Long and Holtzman, 2019). But association does not prove causation, and one troubling fact for adherents of this hypothesis, besides the failures of all amyloid-based drug trials until now, is that many elderly persons have amyloid plaques, but without any clinical signs of Alzheimer’s disease (Lane et al., 2018). The fact that betaamyloid accumulation does not continue to increase after the initial phase of disease development, seems to suggest that it is not directly related to the disease itself, but possibly a trigger—or even an early protective reaction against the disease (Castellani et al., 2009; Kumar et al., 2016; Li et al., 2018). As a result, doubts have been voiced against the dominating Aβ paradigm (Kepp, 2017) and other disease-related events in the brain have received increasing attention. A major alternative mechanism is related to changes in the tau protein, a building block for microtubuli, the tiny pipelines that transport substances between the soma and the synapses inside the nerve cell, but that also serve as a skeleton to maintain the structure of the cell. Degradation of the tau protein during the progression of the disease, through dysregulated phosphorylation and transformation into hyperphosphorylated proteins, makes microtubuli axonal transport progressively less efficient, leads to synapse loss, to formation of neurofibrillary tangles (NFT) and ultimately cell death. Some findings indicate that these changes start in very early stages of disease development, even before changes in Ab (Insel et al., 2020). In contrast to Aβ changes, degradation of tau progresses further in parallel with the disease (Long and Holtzman, 2019) and may therefore be a better indicator of disease stage, compared to measures of Aβ (Lane et al., 2018). Changes in Ab and tau proteins are often seen as related, and, according to advocates of the betaamyloid cascade hypothesis, changes in extracellular Aβ precede and trigger tau hyperphosphorylation inside the neuron (Phillips et al., 2020); a detailed diagnostic evaluation typically involves measurement of both these proteins in cerebrospinal fluid, especially levels of the Aβ 1–42 molecule and levels of total tau and phosphorylated tau (p-tau). The coexistence of extracellular accumulation of beta-amyloid and the development of neurofibrillary tangles (NFT) are still considered as the main pathological markers of AD, but no drug trials based on either of these targets have so far been successful (Long and Holtzman, 2019). Other suggested mechanisms include cholinergic deficits, evidenced by the relative efficacy of cholinesterase inhibitors to hamper cognitive decline in AD (Sharma, 2019), and inflammation, indicated by microglia and astrocyte activation in AD.
Behavioural Manifestations
Whatever the mechanisms behind, established effects on cognition (Henneges et al., 2016) and on behaviour seem logical from what we know about the underlying pathology and its progression. Usually these pathological changes in AD start in the medial temporal part of the brain, from where it propagates to neighbouring areas, and to areas with projections from already affected areas. As this part of the brain, including the hippocampus and entorhinal cortex, has a central role for especially working memory and episodic memory, these functions are typically affected in early phases, albeit subtly at first. The olfactory bulbs are close neighbours, and impaired olfaction is also a typical early sign (Phillips et al., 2020).
Both the ability to understand language and to speak have important centres in the parieto-temporal and the temporal lobe, and are also typically affected relatively early, and could lead to slower and less articulated speech, difficulty in finding words, and difficulties to understand language. These functions are normally controlled from the left hemisphere, while the right parieto-temporal hemisphere is relatively more important for spatial functions and orientation. Difficulty in drawing figures and navigation are common behavioural manifestations that most probably are related to impaired function in this part of the brain, in combination with impairments in especially the enthorhinal cortex. Decreasing efficiency of neural functional (e.g. in axonal transport, transmitter substance deficits, and an impoverished synaptic network and neural interconnectivity) will also have a number of more general effects that in a progressive manners will affect associative ability, reaction time, balance and motor coordination. When the neuropathology spreads further, impulse control, attention, and the ability to focus are affected, mainly regulated by the fronto-temporal lobes (Migliaccio et al., 2020).
Long-term memory, especially procedural memory, are spared until late in the pathological development, indicating less importance of parieto-temporal regions for these functions. The different effects on short term vs. long term memory is often illustrated by the ability to detail events that happened decades ago, while the person may have no recollection of what happened earlier the same day or week. For example, patient with clinical AD may not remember that he or she can play the piano, but positioned in front of one, could still start to play it. Recently it has been suggested that the typical AD phenotype is not the only one, and what we call Alzheimer’s disease should be considered as a family of related diseases, but with important differences in neuropathology, e.g., in terms of primarily affected areas and thereby also in cognitive and behavioural manifestations and the sequence of their appearance (Ferreira et al., 2017). The progressive nature of AD and other neuropathological diseases means that eventually the whole brain will be severely affected and thereby all cognitive and behavioural functions. As a result, dementia care in late stages is resource demanding and, in combination with increasing longevity and the high prevalence in old age, presents a large and growing economic burden for societies worldwide (Wimo et al., 2017).
Assumptions and Rationale for This Project
It seems plausible that odds would improve with earlier intervention for any strategy against any disease, including both pharmacological and non-pharmacological strategies, as long as it is based on an adequate assumption of the underlying disease mechanism. There are however special challenges with AD and other neuropathologies leading to NCD, due to a very long progressive disease development with subtle symptoms in the earliest stages. The limited therapeutic success against AD and other neuropathological diseases indicates that the underlying mechanisms are not yet fully understood, which could justify a broad, open and non-biased approach. A fundamental starting point for such a non-biased and exploratory approach is the assumption of a link between brain and behaviour; we know for sure that these diseases are diseases of the brain, and this means that aspects of behaviour related to affected brain areas also should be affected, albeit subtly in early stages. To exemplify, episodic memory is typically affected in AD, most probably due to early damages to hippocampal and entorhinal regions. It could be assumed that this cognitive domain is also subtly affected in very early stages, but may not easily be captured by test scores in existing cognitive tests. But even if actual test scores should appear non-indicative of an existing neuropathology, the subtly affected person may still feel more anxious and need to make more of an effort to perform at this level, which should reflect in various ways in the behaviour of the person, not easily detected by the naked eye. The same principle should apply to any other cognitive domain that has been subtly affected, whether it be reading ability, executive functioning, word finding, or processing speed, depending on the type of neuropathology and which brain areas are affected by it. Another example is autonomic function that typically has a lower range of variability, being “flatter”, if a person is carrying a neuropathological disease (Algotsson et al., 1995). Autonomic function should reflect in degrees of heart rate variability, variability in emotional expressions, skin temperature fluctuations, speech volume variation, and in pupil size variations. Could any or several of these indicators be identified in early stages and will they differ between different types of NCD?
In this project we use a broad approach to automatically and continuously capture a large number of potential digital biomarkers with high precision, by using different sensors. We then subject the collected data to machine learning to identify signals and patterns of signals that could indicate an underlying neuropathology. In the following we will in greater detail describe the rationale behind each type of potential digital biomarker that we capture.
Related Work
This section explores how related sensor data, and digital biomarkers extracted from such data, across different modalities have previously been considered for clinical assessment of Alzheimer’s disease.
Digital Biomarkers
The term digital biomarkers is used here to specify metrics extracted from sensor data and differentiate them from biological biomarkers extracted from biological measurements. A digital biomarker reflects the underlying state of the biological system (the human brain) and a good candidate for a digital biomarker is one that shows promise in identifying both diagnostic criteria of AD and correlates with established biomarkers used in AD examination. This section outlines what digital biomarkers have been used in previous research. All digital biomarkers used throughout this article are written in italics.
Speech and Language
Alzheimer’s disease leads to a decline in cognitive and functional abilities, such as memory loss and language impairments. There have been numerous review studies on linguistic biomarkers that have been used for detecting the progression of AD (Mueller et al., 2018; Slegers et al., 2018; Voleti et al., 2019; de la Fuente Garcia et al., 2020; Calzà et al., 2020). These include both acoustic features (prosodic, spectral, vocal and fluency), and textual features (lexical, syntactic, semantic, and pragmatic). Vocal features such as speaking rate, fluency and voice quality could be useful as biomarkers for early detection of AD, since they stem from atrophy in the medial temporal lobe (König et al., 2015). In a longitudinal study Ahmed et al. (2013) found that lexical, syntactic and semantic complexity changed significantly as the the disease progressed, but not voice quality or fluency. Speaking rate have been found to be the earliest measurable linguistic feature for AD detection (Szatloczki et al., 2015). MCI patients have been found to have a more breathy (H1-A3) and weaker voice (CPP) than NC (Themistocleous et al., 2020). Number of silent pauses (especially those longer than 2 s) have proven to be useful for AD detection (Yuan et al., 2020), as has the average length of silent pauses (Roark et al., 2011; Tóth et al., 2018). The increase in pause frequencies has been attributed to struggles with lexical retrieval, but might also reflect other cognitive impairments as pauses increases with cognitive load (Pistono et al., 2016). In a study on language use in unstructured interviews, AD subjects were found to use fewer Nouns, while more Adjectives, Verbs and Pronouns than healthy older participants. They also used a smaller vocabulary size (Bucks et al., 2000). The lexico-semantic variables appear to be the most useful for the diagnosis of later stages of AD (Boschi et al., 2017). These results suggest that the occurrence of dementia is associated to reduced syntactic complexity, difficulty in connecting one event to the next, in maintaining the theme, and in understanding the story. Furthermore, grammatical errors have mainly been observed in severe AD groups (Jarrold et al., 2014). Some semantic features seem to be relevant for MCI though. Asgari et al. (2017) tagged transcription of patient doctor interviews using the Linguistic Inquiry and Word Count (LIWC). Using this, they divided the words into five broad categories: Linguistic processes; Personal concerns, Psychological processes; Relativity and Spoken categories. The category that was most significant for MCI was the relativity category that included words dealing with time and space. Haider et al. (2019) demonstrated the usefulness of purely acoustic features, e.g. eGeMAPS (Eyben et al., 2015), openSmile (Eyben et al., 2010), and ComParE (Eyben et al., 2013), that has proven useful for other paralinguistic detection tasks.
Facial Gestures
The effects of AD on facial gesture and expressiveness can be significant, but it is a complex relationship. Overall facial biomarkers are most related to the later stages of AD with the MCI group having different facial expression in relation to the AD group. On the one hand, apathy is one of the most common behavioural symptoms of AD and is linked to deficits in goal-directed behaviour, decreased goal-related thought content and emotional indifference with flat affect (Cai et al., 2020), which in turn leads to overall reduced facial expressivity (Seidl et al., 2012). Asplund et al. (1991) found that patients in the later stages of AD struggled to show facial emotional reactions when experiencing emotional stimuli. Burton and Kaszniak (2006) found reduced correlation between emotional state (valence) and zygomatic activity (smiling) for patients with AD. The AD patients experience the emotion (happiness) but are less likely to do the linked zygomatic activity (smile). On the other hand, dementia is also generally linked to reduced control over facial expression, in many cases leading to increased facial expressiveness. Smith (1995) found that people with mild dementia exhibited reduced control of negative expression during a picture stimuli experiment. The relationship between stimuli and facial muscle expression of emotion is complicated since deficit in emotional facial expression can be caused by several factors. Seidl et al. (2012) concluded that cognitive deficits are associated with increased rate of total facial expression after controlling for apathy. In addition, Matsushita et al. (2018) found that AD patients had an increased tendency to use smile as a “save appearance response” when they fail to provide the correct answer to questions.
Motor Signs (Hand and pen Motion)
Even though cognitive impairments are the most common signs of dementia, motor functions are also affected by the disease. Motor signs like speech/facial expression, rigidity, posture, gait and bradykinesia have been found to increase in frequency and severity over time in AD patients (Scarmeas et al., 2004). Chung et al. (2012) has developed an inertial-sensor-based wearable and a stride detection algorithm for analysis of Alzheimer patients’ gait behaviour. In a user study they were able to show difference in gait profiles between the AD patients and the healthy controls. The finger tapping test is used as a neuropsychological assessment of fine motor skills (Reitan and Wolfson, 1985). It has been found useful for AD assessment, where AD patients produced a finger tapping pattern that was lower in frequency with slower, more variable inter-tap interval than the health control group (Roalf et al., 2018). Previous studies show that MCI and AD patient have a lower drawing speed when performing handwriting tasks with lower pen pressure with the differences corresponding to the groups with more deteriorated groups showing larger differences. Only using these kinematic measures, a classification accuracy of 69–72% was achieved. (Werner et al., 2006). Gatouillat et al. (2017) propose some novel measurements/features: pen-tip normal force, total grip force, and an objective writing quality assessment. They do not correlate with cognitive aspects per se, but measure trade-offs between timing and accuracy in the writing and such things. Garre-Olmo et al. (2017) used a digital pen in a number of tasks (Clock test, copying two and-three dimensions drawings, copying one sentence, writing dictated sentence). Apart from speed and pressure, they found that the time the pen was in the air was a discriminant feature between AD, MCI and NC.
Gaze and Pupil Dilation
There has been research on understanding cognitive deterioration and dementia from eye movements (Zhang et al., 2016). For different tasks, the eye movements of people with AD differs from control subjects (Beltrán et al., 2018). Gaze patterns of patients with AD show greater variance in all directions. This is linked to cognitive decline and deficits in attention which leads to more frequent eye and facial movement (Nam et al., 2020). AD patients have also been found to have problems following a moving target (Molitor et al., 2015). These variations in gaze in AD patients are likely due to damage to frontal and parietal lobe regions related to attention (Garbutt et al., 2008). When comparing facial muscles and eye movement, less variability is seen for AD patients compared to healthy controls (Nam et al., 2020). Pupil dilation is a robust predictor of cognitive load, the working memory demands of performing a certain task (Gavas et al., 2017). Pupillary response, mainly in terms of changes in reaction to light, has been proposed as a biomarker of early stages for Alzheimer’s disease (Granholm et al., 2017), However, a longitudinal study with AD biomarkers is needed to confirm whether pupillary responses can provide a predictive biomarker of risk specific to AD-related declines.
Autonomic Nervous System
Heart rate variability (HRV) has been used extensively to predict dementia (Allan et al., 2005; Zulli et al., 2005; Negami et al., 2013) as was recently reviewed in da Silva et al. (2018). There is no consensus in the field, as some studies found that HRV time and domain parameters were lower in patients with AD than in patients with MCI and controls (Zulli et al., 2005; de Vilhena Toledo and Junqueira, 2010), while others found no difference (Wang et al., 1994; Allan et al., 2005). In general, there is no strong evidence to use of the HRV alone as biomarkers to diagnose dementia (da Silva et al., 2018). The sympathetic nervous system can also be probed using a Galvanic Skin Response sensor, such as the Empatica wrtistband, has been found to be useful in determining stress during activities (Schlink et al., 2017). Sympathetic skin response (SSR) and HRV together were used to detect an abnormality of autonomic function in patients with AD (Negami et al., 2013).
Thermal Emission
Experiments on using Thermal imaging for inferring stress indicate a relationship between an increase of workload and thermal emissions (Anzengruber and Riener, 2012). Zhou et al. (2019) used a wearable thermal sensor and found that it can be possible to use such a system for estimating mental workload. Ruminski and Kwasniewska (2017) presents a review of thermal imaging in mobile conditions together with a proposed prototype. Furthermore, sleep-disordered breathing is associated with a higher risk of AD onset after matching and adjusting for other risk factors (Lee et al., 2019b). Recent pilot study, Tiele et al. (2020) confirms the potential utility of analysing breath volatile organic compounds to distinguish between MCI, AD and controls. Respiration rate has successfully been extracted from thermal imaging by automatically analysing the thermal fluctuations in the nostril area (Lewis et al., 2011). Cho (2018) used a mobile thermal imaging device in order to infer “stress” levels by extracting respiration rate.
Automatic Capture and Analysis of Cognitive Assessment Tests
Recently, there have been large efforts in automating the screening of Alzheimer’s disease. Tóth et al. (2015) report a completely automated speech-based screening pipeline that yielded significant discrimination results. König et al. (2018) has developed an iPad application that can perform a semantic verbal fluency test and automatically perform a fine-grained analysis of the spoken input. ICAT is an internet-based cognitive assessment tool that uses speech recognition for a delayed list learning task and drag and drop GUI input for a number sorting task (Hafiz et al., 2019). In the Talk2Me project anonymous people can contribute with both speech and text via a web interface (Komeili et al., 2019). The speech tasks include describing a picture and retelling a story that is displayed on the screen for a short while. The text-input tasks include image naming, word naming and providing word definitions. The authors have also developed a linguistic analysis package called COVFEFE that they have made available as open source. Intelligent Virtual Agents have also been used to collect spoken interactions, for example to automate parts of the initial interview at a memory clinic Mirheidari et al. (2017). In a series of studies the team has used a mix of automatically generated acoustic and lexical features with manually acquired conversational analysis inspired features to predict AD (Mirheidari et al., 2019; Walker et al., 2020). Today’s smart phones and wearables have a large number of sensors that could be used in data collection for dementia detection. This includes camera, microphone, accelerometer/gyryscope, touch, geoposition, ECG and IR cameras (Kourtis et al., 2019). Using wearable consumer products have been used for continuous monitoring of symptoms related to cognitive impairment (Chen et al., 2019). As an example, UbiCAT is a ubiquitous cognitive assessment tool for smart watches, that includes three cognitive tests: the Arrow two-choice reaction-time test, the N-back letter test, and the Stroop color-word test (Hafiz and Bardram, 2020).
In the current study we present a multimodal capture and analysis framework that makes use of non-obtrusive and affordable sensors in capturing the human behaviour during memory tests. It has been integrated into the fast-track cognitive assessment procedure that is used at the memory clinic of a major regional hospital in Sweden.
Data Collection
We now describe the setup and procedures we used for gathering our multimodal behavioural and phsyiological data. All recordings were performed during clinical examinations at the Memory Clinic at Karolinska Hospital in Stockholm, Sweden. The examinations are part of an established fast-track analysis where a multi-disciplinary team assess the patient within one week. The complete examination includes brain scanning (MRI), neuropsychological assessment, speech and language assessment, assessment of motor skills, physical examination, and a 1-h clinical interview. Our recordings took place during the clinical-interview portion of the examinations, the procedure of which was minimally modified and standardised to accommodate the recordings, as described in Procedure.
During most of the clinical assessments at the clinic the patient and the clinician are sitting on opposite sides of a table. In some cases, including some of our recordings, a partner or relative of the patient may be present and sitting beside the patient. For our study, these assessments took place in a particular room at the clinic, where the room and the table had been instrumented for multimodal data capture. Figure 1 shows the custom-built, instrumented “recording table” used. The entire setup encompasses sensors for recording, interfaces for controlling, monitoring, and performing data gathering, along with miscellaneous other equipment, e.g., for storing the data, and a recording software infrastructure that coordinates the different devices and ties everything together. The remainder of this section describes the various components in more detail, along with the procedures for conducting the clinical sessions and exporting the data. For an overview of what modalities each sensor captured, please see Table 1. Figure 1 shows the data collection setup from the clinical environment. The clinical assessments at the hospital conclude with a physical examination in a different part of the room, but this part of the assessment procedure was not recorded, since the potential added benefits of such data was not considered commensurate to the privacy intrusion it would entail.
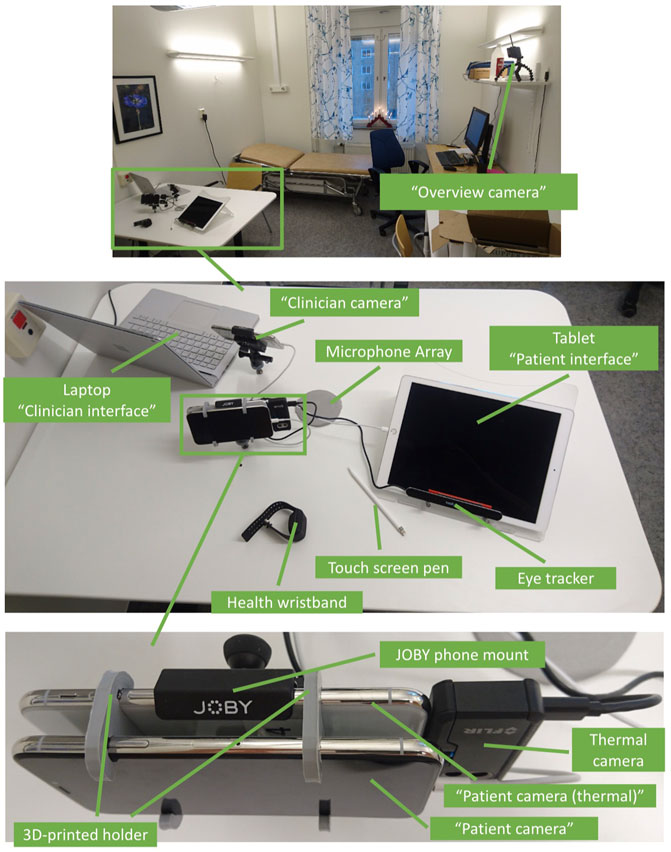
FIGURE 1. The data collection setup. At the top an overview of the room is given, showing both the instrumented recording table and the position of the “overview camera”. In the middle the various devices on the instrumented recording table are shown and at the bottom a close-up of the patient facing cameras.
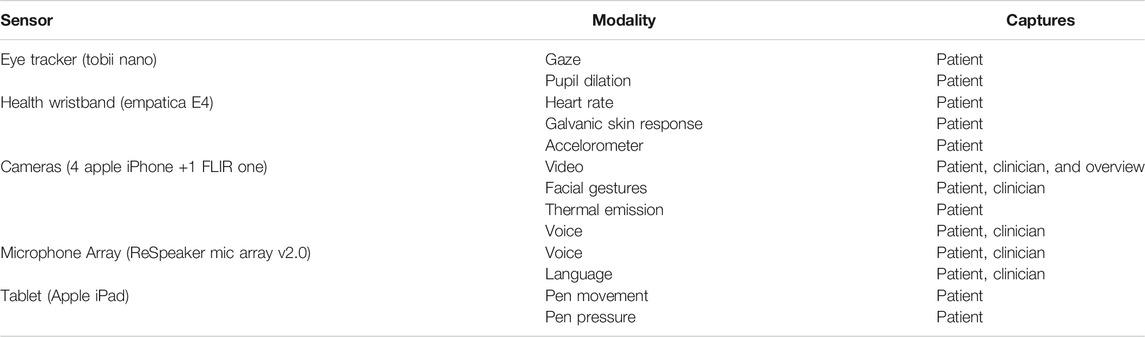
TABLE 1. A summary table of what modalities each sensor captures.
Design Considerations
A key consideration when designing the data-collection methodology was to create a setup with a minimal impact on the clinical assessment, in order to maintain the ecological validity of the collected corpus. For example, eye movements and pupil dilation can be collected either using a display-mounted eye tracker or by having the user wear eye-tracking glasses. Although the glasses are much more effective, they are cumbersome to wear, distractive, and also increase the sense of being monitored. We therefore opted for a display-mounted eye tracker instead. The case of audio recording is similar: a head-mounted microphone provides better quality than microphones fixed to the table generally do, but again, requires equipping the patient with hardware. Considering these facts, we settled on using a setup with mobile phones (Apple iPhones) mounted to the table, which are less associated with looking like cameras than other types of “normal” cameras, for capturing video and facial data. We also use an array microphone integrated into the table which is able to capture speech from both the clinician and the patient. For eye-tracking we opted to use a Tobii Nano which is able to capture eye movement and pupil dilation at a distance, attached to the bottom of the tablet. The only device which the patient is carrying is a health wristband, which was considered to not be as invasive, since it is not uncommon to wear a watch on the wrist.
Sensors
Below we introduce the various sensors and equipment used for the data collection procedure (Table 2).
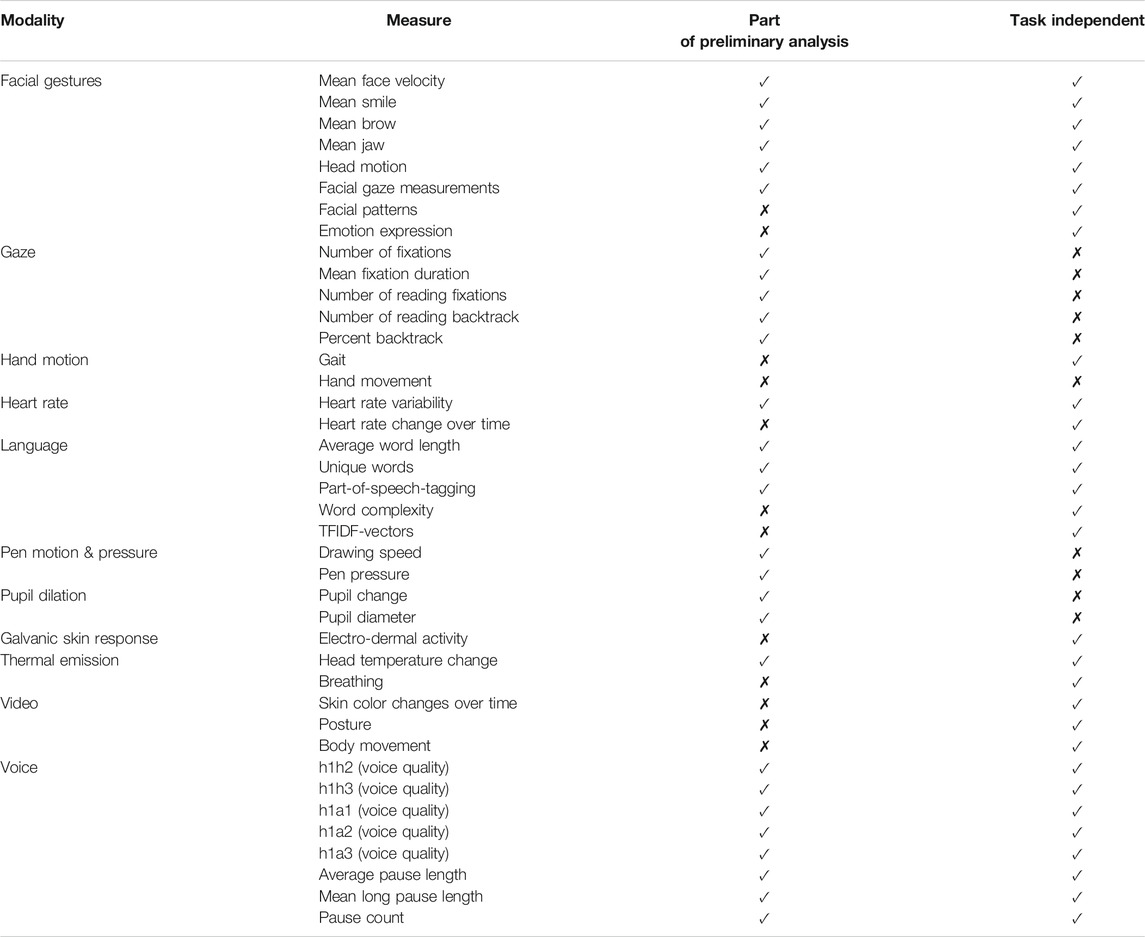
TABLE 2. A summary table of what physiological and behavioural measures can be extracted from each modality, an indication of which ones are used in the correlation analysis and an indication if the measure is task independent.
Cameras
Similar to Malisz et al. (2019) a pair of Apple iPhones X (from here on referred to as “Patient camera” and “Clinician camera”) were used in order to record both the patient and the clinician. An additional, third iPhone X was used for capturing thermal data [“Patient camera (thermal)”] from the patient, and a fourth capturing the whole interaction from a distance (“Overview camera”). Please see Figure 2 to see how the iPhones were connected with the system, and Figure 1 to see how the cameras were placed and mounted. For the three iPhones capturing close-ups of the patient and clinician (“Patient iPhone”, “Patient camera (thermal)”, and “Clinician camera”), a mount from JOBY was modified and attached to the table. Furthermore a holder was 3D-printed in order to attach the “Patient camera” with the “Patient camera (thermal)” (see Figure 1). As can be seen in Figure 1 the “Patient camera (thermal)” had a FLIR One thermal camera attached to it, together with a charging cable. These iPhones used a software developed specifically for these data recordings, and synchronised their time with the FARMI server. When starting the application all the recording options were presented, and which data streams that should be captured could be selected. Those were; RGB video, facial gestures (parametrised facial expressions and head movement), depth data, 3D-mesh data, thermal video, RGB reference video for the thermal video, and thermal data. As can be seen in Figure 3, the various data streams can be turned on or off. The iPhones were configured to send out an image every 3 s which the status page could display, in order for the technician to act in case there were issues with the video.
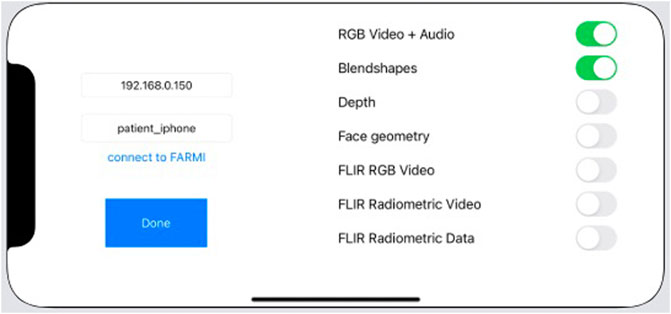
FIGURE 2. Diagram showing each sensor component and how they are linked together with the data capturing framework.
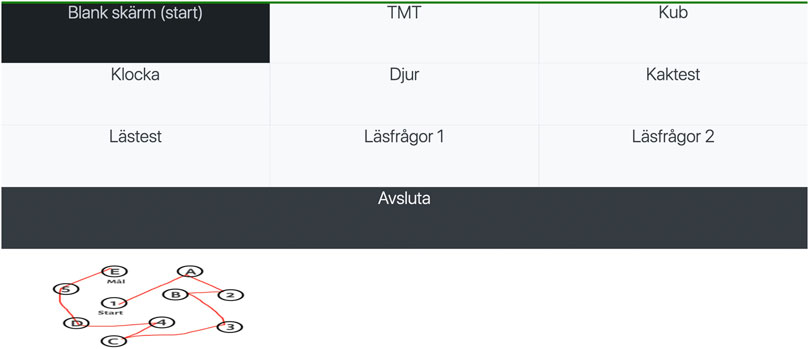
FIGURE 3. The interface used to set up the iPhones before a data capturing session. Here one can set the IP address and an identifying name of the phone. Furthermore one can select which data streams to capture.
Health Wristband
Originally an Apple Watch was used in order to capture heart rate and accelerometer data for the patients. The apple watch was later replaced with an Empatica E4 wristband that captures heart rate, accelerometer data, and electrodermal activity.
Microphone Array
A microphone array (ReSpeaker Mic Array v2.0) was installed into the table in an approximately 10 cm round hole in the center of the table. The microphone array was covered with a mesh cloth (see Figure 1). The microphone array was connected using a USB cable to the central computer. The default LED lights indicating the direction of speech were disabled, as they were deemed distracting.
Eye Tracker
A Tobii Nano was used in order to capture eye movement and pupil dilation of the patient while interacting with the Tablet. Figure 1 shows how the eye tracker was placed. A custom mount for the tablet was 3D-printed in order to place the eye tracker at an appropriate height and angle with respect to how the patient sits. A manual calibration procedure was required before each session, where the patient was asked to focus their gaze at circles displayed on the tablet. The calibration was initiated from the status page and performed together with a technician. The eye tracker was connected to the central computer. The eye tracker collected data throughout the whole assessment but was meant primarily for when the patient interacted with the tabled.
Tablet
A tablet was used (Apple iPad) together with a touch enabled pen (Apple Pencil) which hosted the clinician interface (described in Clinician Interface). The tablet was placed in a stand with some inclination (see Figure 1) such that it would be easily operated for the patient without the need of moving the tablet.
Interfaces
There were three user interfaces, one for the patient, one for the clinician, and a monitoring tool for monitoring the session. All of the user interfaces were web applications which were hosted on the central computer. Each of them are described below.
Patient Interface
A tablet interface was developed to replace certain parts of the MOCA test. The tablet interface was a web interface controlled by the clinicians interface (described below) and was black when nothing was displayed in order to not to be distracting. The tablet was used for six tasks:
Cookie theft test, where the participant was presented an image and asked to describe what they see.
Cube drawing, where the participant is asked to draw a copy of a three-dimensional cube which is presented to them.
Three images, where the participant is presented with three images, and asked to describe them
Trail making test (TMT), where the participant is presented with a number of letters and numbers, and asked to trace a line between them in ascending order alternating between letter and number each time (1, A, 2, B … ).
Clock drawing, where the participant is asked to draw a clock, with the time set to ten after eleven.
For the tasks were the patient had to input something (Cube drawing, TMT, and Clock test) the interactions were performed using an Apple Pencil, and all movements together with the pressure applied when drawing was recorded.
Clinician Interface
The clinician interface (see Figure 4) was a web application displayed through a touch-enabled laptop (Microsoft Surface). The clinician was able to choose what was displayed on the tablet interface for the patient, or just to make the patient screen go blank. It was also possible for the clinician to end the recording from this interface. The clinician also received the results from the drawing tasks through this interface, as the tablet was positioned toward the patient. These drawings could then be printed and added to the patients medical journal.
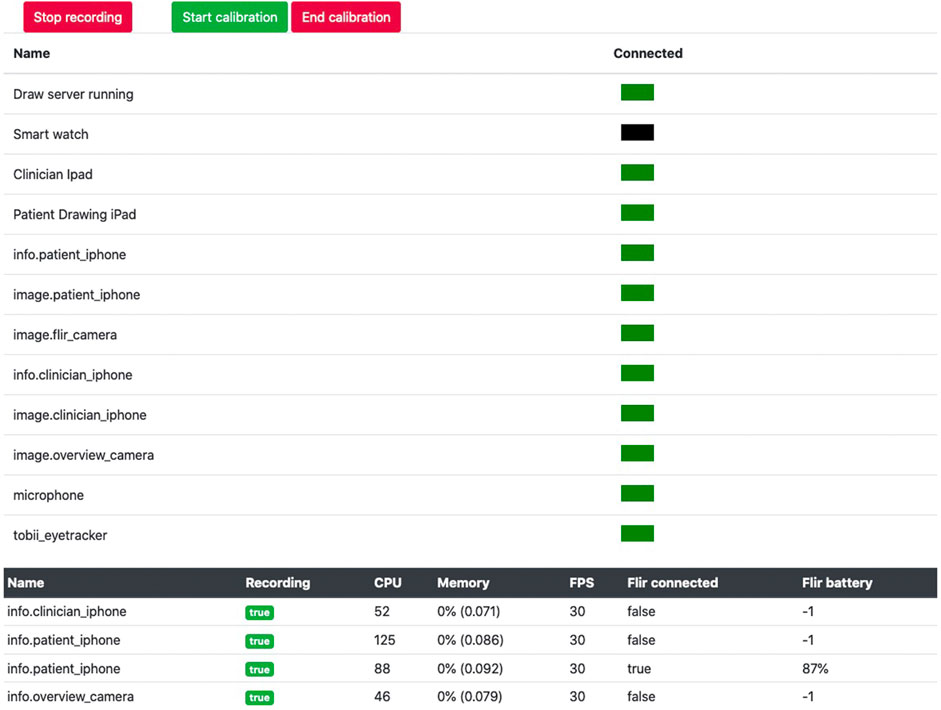
FIGURE 4. The clinician interface (in Swedish). The patient has just performed the TMT test, and drawn the connecting lines. The clinician has then made the screen blank. The interface is designed to be operated through a touch screen.
Monitoring Tool
A monitoring tool in the form of a web application was created in order to be able to monitor the recordings (see Figure 5). Each sensor except the wristband sent a “heartbeat” signal with an interval of 5 s to the recording server (described below). This heartbeat was used in order to determine whether a device was connected to the recording setup or not, and displayed as a red or green indicator on the status page. Furthermore a still image captured by the iPhones every 3 s was also shown on the status page in order to see that data is being collected accordingly. Statistics about memory and processing usages, and battery information for the FLIR One camera was also presented. The status page was used to start and stop the recordings, and also initiated the eye-tracking calibration on the patient interface.
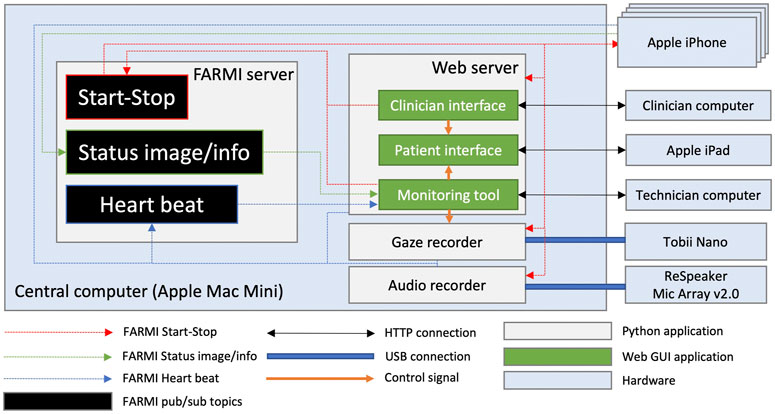
FIGURE 5. Interface of the monitoring tool used by the technician. The images from the cameras have been cropped out for privacy reasons.
Recording Software Infrastructure
Since the aim was to have a recording setup with a large number of sensors, computers, mobile devices and wearables working together, it was of central importance to have a communication framework that would allow for a finely controlled synchronisation of all data streams and remote access to start and stop recordings across the various devices involved. To accomplish this, we used a modified version of the open-source FARMI framework1 for recording multimodal interactions (Jonell et al., 2018).
The different devices used for the recordings provide data streams of different frame rates, and each device has its own internal system time that is likely to differ between devices. FARMI was designed to synchronise such streams in a robust manner. It acts like a publish–subscribe framework, meaning that components in the system can either publish data at a certain topic or subscribe to receive data from a certain topic, and ensures that each device always has a known time offset relative to a central server, and that each data packet which is stored or sent out is timestamped with a timestamp synchronised with that central server. The overall software architecture is illustrated in Figure 2. It is a decentralised system where each component works independently of the other. Three publish-subscribe topics were used, one named “Start-Stop”, which was used for sending out a signal to all devices to start recording, one named “Status image/info”, which the cameras used to send a an image every 3 s to the monitoring tool along with various usage statistics, and lastly a heartbeat topic which was used by all devices to signal to FARMI that the devices were still operational.
Besides being a framework, FARMI also provides a server. Specifically, each sensor or interface would start a ZeroMQ2 server, and send their IP addresses together with a topic name to the central FARMI server. This server would then be used as a directory service by other parts of the network for knowing which IP address a certain type of data was being published at. When a new sensor connected to the framework, this information was sent to all other connected devices so that they could connect to the new device if needed and subscribe to its data stream(s). To verify that they were still operating correctly, all sensors also published a so-called “heartbeat” signal at 5 s intervals that the FARMI server subscribed to. This was used to remove entries in the directory that had not properly sent an explicit shutdown signal to the server.
The different interfaces used to control, monitor, and carry out recording also leveraged FARMI. Specifically, each of the the patient interface, clinician interface, and monitoring tool was a web interfaces hosted on the central computer named “Web server” in Figure 2. The clinician interface could control what was shown on the patient interface, through communication via websockets3. Both the clinician interface and the monitoring tool could send out a start or stop signal via the FARMI Start-Stop topic. Furthermore, the monitoring tool could instantiate calibration of the eye tracker, and would at the same send a signal via websockets to the patient interface to show the eye-tracker calibration screen.
Most of the software connecting the sensors with the central computer was written using Python and the FARMI framework, however the code for the cameras, which were Apple iPhones, was written in Swift, utilising the FLIR framework4 for thermal images, the ARKit framework5 for capturing facial gestures and video, and the FARMI framework for communication with other devices. Sound was also recorded. This data was then stored locally on the phone, but timestamped using synchronised timestamps from the FARMI framework. Images and phone health statistics were published using FARMI every third second in order to be displayed on the monitoring interface. All sensors subscribed to the Start-Stop topic in order to receive a signal when to start and stop recordings. The gaze recorder used the Tobii SDK6 to communicate with the Tobii Nano device, while the audio recorder used a Python library from ReSpeaker7 to communicate with the microphone array.
Other Equipment
A printer was used for the clinicians to print out the results from the MOCA test for purposes of medical record keeping. The printer was connected via WiFi to the router, and could be accessed from the clinician’s computer. A router (Asus RT-AC66U) was used to connect all the devices. For data security, this router was not connected to the Internet, meaning that the entire data-collection setup was isolated from the Internet. A Bluetooth-connected button was initially used for capturing points of interests deemed by the clinician during the recording sessions. This turned out to be difficult to maintain, and is thus not part of the final dataset.
Procedure
In this section we describe the procedure of the data capture from selection of patients to recordings during clinical assessments, data export and collection of biomarkers.
Selection and Recruitment of Participants
The participants in this study are recruited among patients at the Memory Clinic at Karolinska University Hospital in Solna, Sweden. The clinic specialises in relatively young patients with cognitive complaints, and many the patients are referred from other clinics to receive a thorough and advanced evaluation. The prevalence of dementia is below 1% for persons between 60 and 65 in all parts of the world (Ferri et al., 2005) and a dementia diagnosis below the age of 55 is very rare. Persons below 55 years of age were therefore excluded for reasons of clinical relevance and generalisability. To avoid expectation effects on patient behaviour in the interview situation, patients with an obvious or very probable neurocognitive disorder, as revealed by referral medical documentation, were also excluded. To reduce variability from interviewer behaviour, almost all interviews are carried out by one of two physicians who were trained to perform the examination to fit the requirements of the study (including use of tablets instead of paper and pen in some tasks, positioning of chairs for optimal video capture, and administration of additional tasks, as described above).
At this point, we have recorded 25 patients before the outbreak of the COVID-19 pandemic suspended the data gathering, with our aim being to recruit and record 100 patients in total. Based on previous data from the clinic, we expect that approximately 50% of these will be diagnosed with a neurocognitive disorder, a prognosis that seems adequate based on the diagnostic outcomes so far.
In this project each patient has given consent to use their medical record information for research purposes, information that is used to evaluate the clinical relevance of recorded behavioural signals in the interview situation, and that will be used for development and refinement of algorithms to optimise prognostic validity of our system. Ethical approval for the study was obtained from the Stockholm Ethical Board in decision dnr. 2018/1962-31.
Recordings During the Clinical Assessment
Each patient who fulfils the criteria for participation receives written information beforehand about the study, along with the summons for the examination. A week later a nurse calls the patient to ask if they want to participate in the study. After arrival to the clinic, the patient is asked again if they are still willing to participate and, if so, to sign the written consent form. The wristband is mounted and calibrated and the patient then walks with a physician to the examination room. Once the patient is seated, the eye tracker on the lower part of the tablet is calibrated. The researchers then leave the room and the multimodal recording starts. One technician continually monitors the recording a screen outside the room, as described in more detail below. The recording is terminated when the physical examination part starts, usually after 45–60 min of interviewing and testing. The examination is performed according to the normal clinical procedure at the clinic, but with some adaptations and additions to fit the purpose of our study: The first part of the interview is about the patient’s background; living conditions, current and previous occupations, family situation, interests, memory problems or other cognitive problems, changes in personality, medication, sleep, medical history, and orientation in time and space (date, day of week, the location they are in). This part can be described as a conversation between the physician and the patient, and was carried out according to normal routine.
The second part includes a number of tasks that the patient performs to evaluate cognitive status, including the Montreal Cognitive Assessment (MoCA) (Nasreddine et al., 2005). This screening instrument includes various tasks to test performance in different cognitive domains, including drawing a line between letters and numbers (trail making), copying a figure, naming animals, drawing a clock that shows a certain time, immediate and delayed recall of words, generation of words, backwards counting, finger tapping, and abstract thinking. The figure copying and clock tests in particular are made to measure visuospatial constructional abilities and executive functioning (Charernboon, 2017). MoCA is a standard part of the examination protocol at the clinic, but for the patients who participate in the study it is adapted to be performed on a tablet, thereby allowing for detailed registration of pen movements and eye movements while the tasks are being performed, including trail making, the clock test, figure copying, and presentation of animals that the patient should name. For the tasks that involve drawing on the tablet, these drawings are mirrored in real time on a separate screen that the physician can see. The Boston Cookie Theft test (Giles et al., 1996) was added to the protocol for the purpose of this study, but is commonly used for screening. In this task the patient is asked to describe what is happening in a picture, a kitchen scene with a woman and two children. This picture is also shown on the tablet, allowing to sync eye movements and pupil changes with audio and video. When this part of the examination is over, the recording stops, and the wrist band is removed.
Export of Data
An export tool chain was created to export all of the files collected during the session in a standardised way, producing a set of CSV files. This step was performed by the clinician. The data was then stored on small hard drives in safety vaults. The data from the computers and phones was removed.
Further Tests and Collection of Other Biomarkers
After this first interview and examination of the patient, further data are collected to evaluate the cognitive status during the same and consecutive days, including more advanced cognitive testing, evaluation of mood and depressive symptoms, blood sample analysis, brain imaging (MRI, sometimes with the addition of PET if needed), and collection of CSF for analysis of biomarkers (levels of β-amyloid (Ab 40 and 42), tau, p-tau, and neurofilaments). The diagnostic decision is normally made within a week from the first interview, supported by the Combinosticsâ„¢ (Bruun et al., 2019) AI tool to combine results from the different sources of clinical information.
Data Analysis
In order to verify the validity of the data collected to date and to be able to compare against available measurements from each of the recorded patients, we perform a series of analyses and extract several descriptive physiological and behavioural metrics based on our captured modalities with a potential to serve as digital biomarkers. The extracted measures are summarised in Table 3. In most cases these metrics are calculated using basic statistics directly or indirectly over the collected data streams. For each of the extracted markers, we then calculate the correlation against a subset of clinical assessment metrics and biomarkers available as part of the regular memory clinic examination procedure. These are indicated in Table 4. A high correlation between one of our metrics and a clinical assessment variable indicates a potential suitability for that metric as a digital biomarker for AD. Below we describe how we extracted and analysed the various metrics from the captured modalities. As there is a large number of possible analysis that can be made, some have not been analysed in the scope of this work, and are instead suggestions for what can be analysed in the future. The modalities that were not analysed in this work were heart rate, skin conductivity, hand motion, and video. The others are described below.
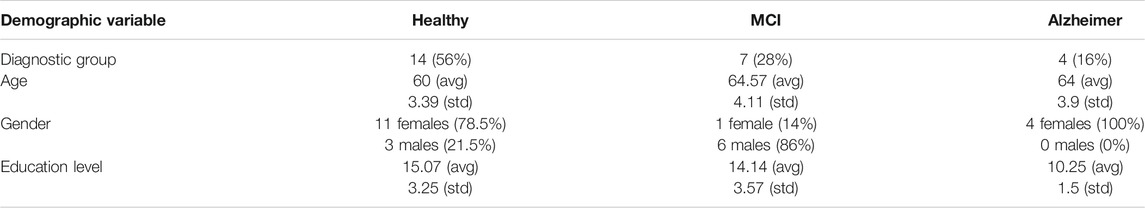
TABLE 3. A demographic table with age, gender and education level for participants based on diagnostic group.
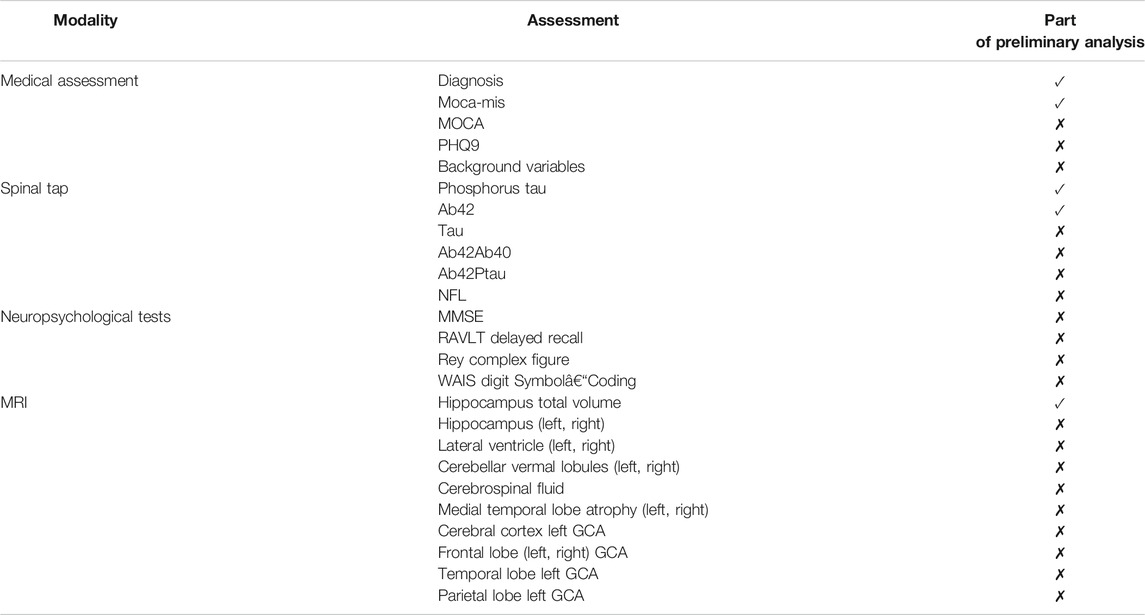
TABLE 4. Summary table of clinical assessment metrics available, and an indication of which ones are used in the correlation analysis. From the MRI we have relative volume measurements for 248 brain regions; the table lists regions whose absolute Pearson correlation with diagnosis exceeds 0.7.
Facial Gestures
The blendshape face data, including information on head motion and gaze, was captured from the “patient camera” sensor. From this data the following low level statistics were extracted: smile mean, smile stdev, eyebrow stdev, head yaw/pitch/roll stdev, vertical/horizontal gaze shifts stdev and vertical/horizontal gaze shifts absolute mean.
In addition we calculated the correlation between vertical gaze shifts and vertical head movement as well as the correlation between horizontal gaze shifts and horizontal head movement.
Gaze
From the gaze data we extracted the following digital biomarkers: number of fixations, mean fixation duration, number of reading fixations, number of reading backtracks (how many times during reading a fixation occurs to the left and above the previous fixation) and percentage of reading backtracks.
Language
The patient-clinician pairs of audio files were transcribed using Google Cloud Speech To Text in Swedish. The transcribed text was available as words with a start and end time and a confidence score for the translations. The transcribed patient text was used for language analysis. We extracted the following high-level metrics from the transcriptions: Total number of words and total number of utterances (during interview), Average turn length (Average number of words in a passage of patient speech with no in-between clinician speech) and Percentage unique words (number of unique words divided by total number of words). The ASR output was POS tagged with Universal-Dependencies formalism using the Stanford-NLP python package. These were used to develop 35 language features related to word type, open or closeness of word categories and average for all word categories. Examples of features are Relative occurrence of adjectives, adverbials, verbs and nouns.
Pen
The pen data from the parts of the clinical assessment where the patient was expected to draw something on the tablet was used to extract several different metrics, both independently for each part of the three drawing exercises in the MOCA test (trail, cube and clock) and for all of them taken together. The following metrics were calculated: number of gaps (how many times pen was lifted), gap length, mean and standard deviation (for how long was pen lifted), drawing speed, mean and standard deviation (how fast was the pen moving) and pen pressure, mean and standard deviation.
Pupil Dilation
From the gaze sensor data, we extracted pupil dilation measurements recorded together with the gaze tracking data, in order to study at pupil diameter across the each sessions. Measurements for left and right pupil were averaged, and rate-of-change was calculated by taking the difference between each consecutive reading. A median filter of length nine was applied to the rate-of-change signal to remove outliers due to sensor noise. We then extracted following metrics: pupil maximum positive rate-of-change (how fast can the pupil expand) and pupil maximum negative rate-of-change (how fast can the pupil contract), pupil maximum rate-of-change (how fast can the pupil change, regardless of direction), pupil mean absolute rate-of-change (how fast does pupil change on average) as well as pupil diameter standard deviation. All metrics were extracted independently for each of the exercises on the patient interface.
Thermal Emission
The “Patient camera (thermal)” sensor produces a thermal video, a thermal data file with temperatures given in Kelvin, and a RGB reference video. The RGB reference video is aligned to match the thermal video and thermal data file. Images from the RGB reference video and thermal video were extracted at one frame per second. Using the RGB reference frames it was then possible to apply the openpose pose extraction framework, Cao et al. (2021), to extract the pose of the patient. This was then used to determine a bounding box around the head, and the 10 highest values were then extracted from the corresponding region in the thermal images. The values were then aggregated and averaged for each minute of the interaction, and converted into percentages. Given the sequences of temperature readings with one value per minute, we extracted four metrics: temp mean, temp stdev, temp rate-of-change mean and temp rate-of-change stdev.
Voice
The recordings from the Microphone Array were split into patient and clinician audio files based on the angle of the sound source as reported by the microphone. The patient audio was used for voice analysis. In this preliminary analysis, minor irregularities were present in the voice splitting due to inaccuracy of direction of arrival (DoA) estimation, resulting in small segments of patient audio being labelled as clinician audio and vice versa, in particular in sections where there are overlapping speech (typically quite rate). More accurate methods can be applied by combining the four raw mic signals from the mic array.
Pauses and Speech Rate
All gaps in the patient’s speech of a duration longer than 200 ms, with no intermediate speech from the clinician, were regarded as pauses. Start and end times for each word were retrieved from the output of the automatic speech recognition. We extracted several pause related metrics, such as pause count (total number of pauses), average pause length as well as percentage pauses that are longer than 1, two or 3 s. Furthermore, we extracted speech rate in syllables/second by counting number of syllables (approximated by number of vowels in the transcription) and divided by the total speech time.
Voice Quality Measures
In order to quantify vocal strength and breathiness, we calculated several acoustic measures of voice quality. All of the measures below are based on the relative amplitudes of the harmonics of the voice, where h1, h2 and h3 refers to the amplitude (in dB) of the first three harmonics, respectively, and a1, a2 and a3 denote the amplitude of the harmonic closest to the peak of the first, second and third formant, respectively. We extracted five metrics: h1h2 (h2−h1), h1h3, h1h3, h1a1, h1a2 and h1a3. We used REAPER8 to extract fundamental frequency from all patient speech and SNACK9 to extract formant trajectories. We measured the amplitudes of the harmonics in corresponding STFT spectrograms extracted using librosa10 in Python. All measures were averaged over all voiced frames in the recording.
Preliminary Findings
In this section, we give some example analyses that illustrate how the digital biomarkers in the previous section may be connected to other diagnostic criteria. As our data gathering is far from complete, it is not possible to draw reliable conclusions about the diagnostic relevance from the material available thus far. Consequently, the analysis and results presented here are highly preliminary, and primarily serve to sketch the processes by which the digital biomarkers may be validated against other data available through the study. We deliberately omit p-values from the analyses so that readers are not tempted to treat the example analysis findings as statistically or scientifically significant.
At the time of writing 25 of 100 patients have been recorded. Our patients had a mean age of 61.92 years in the range 58–70 (standard deviation (4.16). 16 were females (64%) and 9 males (36%). Average length of education in years was 14.5 (standard deviation 3.55). From the 25 patients 4 patients were diagnosed with Alzheimer’s disease, 7 with mild cognitive impairment and 14 received a diagnosis of subjective cognitive impairment, meaning the clinical examination found no clinical signs of impairment. Further demographic data is shown in Table 3.
Below we report how our extracted behavioural and physiological measures correlate to the following five biological biomarkers and clinical diagnostic measures:
These measures were chosen since they are relatively independent variables within our dataset with a strong correlation to AD diagnosis (Moca-MIS 0.70, p-tau 0,65, Ab42 -0.647, Hippocampus, -0.766).
Moca Memory Index Score (MoCA-MIS) is a sub-scoring of MOCA that focus on memory tasks. The MoCA-MIS is calculated by adding the number of words remembered in free delayed recall, category-cued recall, and multiple choice–cued recall multiplied by 3, 2 and 1, respectively, with a score ranging from 0 to 15 Julayanont et al. (2014). MOCA-MIS was chosen over full scale MOCA since it has a stronger correlation to diagnostic then the full MOCA test. Ab42 and p-tau are both linked to AD pathology. The scientific debate regarding the relationship and validity of Ab42 and p-tau as diagnostic criteria in AD is ongoing. We chose to present Ab42 and p-tau independently although they have good diagnostic validity as a single biomarker in our dataset (Ab42/p-tau, −0.7179). Hippocampus was chosen since it is a well studied brain region closely tied to AD pathology. In our preliminary analysis of the data collected to date, we found many correlations between our extracted metrics and the above measures (please see 8). Below we report the most prominent ones (Figure 6). We used Pearson correlations for all our correlation measurements. We made a comparison between Pearson and Spearman correlations but no major differences were found (mean average difference −0.01 ± 0.17). In our current situation, where the amount of data is very small, we believe that making distributional assumptions (i.e., the Pearson correlation) offers the most appropriate bias-variance trade-off, especially since the analysis is only intended to be preliminary.
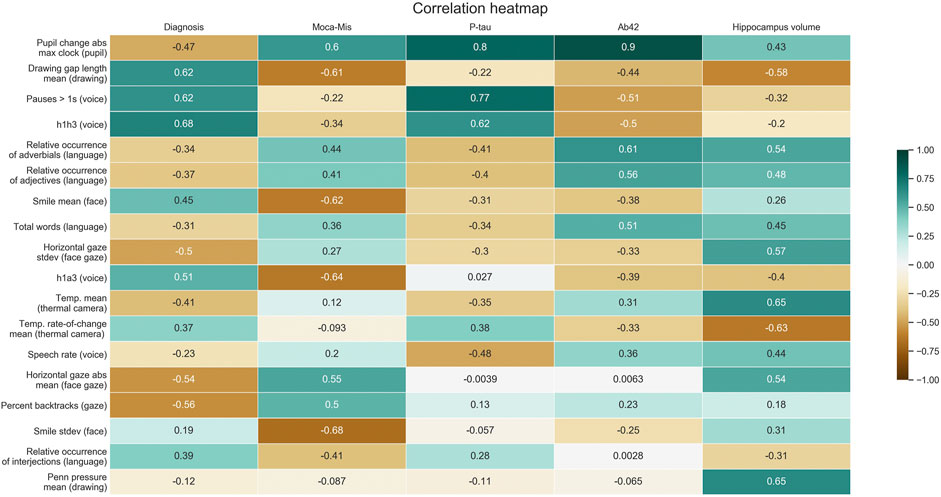
FIGURE 6. Summary of correlations between selected digital biomarker candidate metrics and clinical assessment measures.
Facial Gestures
We found that the Moca-MIS score correlated negatively with smile mean (-0.62) and smile standard deviation (-0.68). For the gaze data captured by the iphone during the interview part, we found a negative correlation of horizontal gaze (sideways gaze movements) and diagnosis of -0.54 for horizontal gaze absolute mean and -0.5 for horizontal gaze standard deviation. These statistics also correlated positively with hippocampus total volume (0.57 and 0.54 respectively).
Gaze
From the data captured by the gaze tracker during interactions with the ipad, we found that the total number of fixations correlated with diagnosis (−0.32) and with hippocampus total volume (0.67). Further, mean fixation duration correlated with diagnosis (0.45) and hippocampus total volume (−0.78).
Language
Total word count correlated with Moca-MIS (0.36), Ab42 (0.51) hippocampus total volume (0.45), while Percentage unique words correlated with Moca-MIS (0.37), Ab42 (0.54) and hippocampus total volume (0.44). For the word type metrics, relative occurance of Adjectives was the most relevant feature with a correlation with Moca-MIS (0.44), Ab42 (0.61) hippocampus total volume (0.54).
Pupil dilation
The metric pupil maximal absolute rate-of-change generally correlated well with several of the biomarkers, but correlations varied across the different sub tasks. Highest correlations was achieved for tasks that involved drawing (path, cube and clock tests): for clock drawing test and cube test, correlation with diagnosis was −0.47 and −0.56 respectively, Moca-MIS (0.6 and 0.54), p-tau (0.8 and 0.75) and Ab42 (0.9 and 0.77).
Thermal Emissions
For face temperature measurements captured with the “Patient camera (thermal)” sensor we found that temp mean correlated with diagnosis (−0.41) and hippocampus total volume (0.65) while temp rate-of-change mean correlated with diagnosis (0.37) and hippocampus total volume (−0.63).
Pen Motion and Pressure
Figures 7 and 8 show typical output from two of the drawing tasks for sample subjects of each of the diagnosis categories. Looking at the statistics of pen motion and pen pressure, we found that two features were particularly interesting: mean drawing gap length correlated with diagnosis (0.62), Moca-MIS (−0.61) and Hippocampus total volume (−0.58), and mean pen pressure correlated with p-tau (−0.88) and Hippocampus total volume (0.86).

FIGURE 7. Cube drawing based on category. From left to right: Healthy, MCI, Alzheimer.
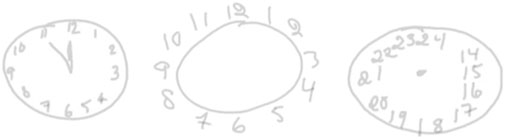
FIGURE 8. Clock drawing based on category. From left to right: Healthy, MCI, Alzheimer.
Voice
Two classes of voice related features are included in this analysis: voice source metrics and pause/speech rate features. Several of the extracted voice quality metrics (breathiness/vocal strength) showed correlation to diagnosis and biomarkers. The most relevant were h1h3 that correlated with diagnosis (0.68) and p-tau (0.62) and h1a3 that correlated with diagnosis (0,51) and Moca-MIS (−0.64). Percentage pauses longer than 1 s correlated with diagnosis (0.62) and p-tau (0.77) while speech rate correlated with p-tau (−0.48) and hippocampus total volume (0.44).
Discussion
Our study describes how to design and implement a multimodal sensor recording system in a clinical setting. Furthermore we report our preliminary findings from our sensor data capture. Several of the digital biomarkers abstracted from sensor data were highly correlated to both the diagnostic outcome and to biomarkers of Alzheimer’s disease, suggesting that a multimodal approach has the potential to complement and improve current diagnostic processes. In the remainder of this section, we discuss the results of the preliminary analysis of the digital biomarkers we studied, and consider the implications of our data capture and its findings for dementia detection and treatment.
Discussion of Analysis Findings
For the purposes of this article, a digital biomarker is useful if it is sensitive to early signs of AD, or informative about the current stage of the patient’s disorder, or both. At present, three biomarkers are considered to be central for a state-of-the-art evaluation of a possible neurocognitive disorder:
levels of β-amyloid (levels of Ab 42, and/or the ratio between Ab42/Ab40);
levels of Tau (Both Total Tau and P-tau); and
cerebral atrophy (including both in specific regions, such as the entorhinal region and hippocampus, and general atrophy (including enlarged ventricles).
A high-quality and detailed examination will include all three biomarkers, and their coexistence, which was performed for all patients included in our study (along with other in-depth assessments, as described earlier). Due to costs, limited resources, and the invasive nature of these measurements, it is important to identify for which patients this extensive examination is needed and for which patients it is not. It is obviously advantageous if this can be done in a non-invasive and non-intrusive way. With the assumption that the above biomarkers in combination adequately reflect the underlying neuropathology with a high level of sensitivity and specificity, digital biomarkers of clinical utility will need to demonstrate a high correlation with these existing biomarkers.
Our data analysis covered both established and novel digital biomarkers. For the former, our findings were in line with previous AD research. Pause length and vocal strength metrics h1h3, specifically, correlated with AD diagnosis, β amyloid-42 protein, and p-tau. Overall, we also found that voice measures correlated more strongly with clinical assessment metrics than language measures did. Voice features may generally be more useful than language measures for early dementia detection, since the semantic features of language are more obviously disrupted in the later stages of AD. As our dataset contains only 3 individuals diagnosed with AD, our findings are likely more informative for indicating utility in early diagnostics, than for the ability of different biomarkers to distinguish AD patients from the two less-affected patient groups we considered.
Another promising digital biomarker we studied that has been previously proposed for AD assessment was pupil change. We found that maximum change during cognitively taxing tasks strongly correlated with both diagnosis, moca-mis, p-tau, Ab42, and hippocampal volume. The fact that a difference was noticeable between non-taxing (cookie test) and taxing (clock, cube, path drawing) tasks shows that this might potentially be a useful biomarker in combination with a cognitive test. Unlike voice and language, this digital biomarker quantifies physiological responses in the patient that clinicians cannot feasibly detect, which increases its potential to complement existing diagnostic procedures.
We also identified several promising new digital biomarkers. In particular, the mean head temperature rate of change correlated strongly with diagnosis, p-tau, Ab42, and hippocampal volume. The pen-drawing gap length correlated strongly with diagnosis, moca-mis, Ab42 and hippocampus. Furthermore it was highly correlated to vocal pause length measurements (correlation coefficient 0.72). Both pause length and pen-drawing gap length are likely related to sympathetic nervous system responses, which differ for patients with AD or MCI, compared to those with no objective impairment (Borson et al., 1989). This potential utility in early detection can be contrasted against assessments of the drawings themselves, where only 53.3% of normal elderly can copy the cube correctly, although most are able to correctly draw the clock (Charernboon, 2017). Without pen data, drawing tests in general are thus sensitive detectors of AD but not MCI.
Tasks and Sensors
When considering different digital biomarkers and their capture, it is worth distinguishing between task-dependent and task-independent digital biomarkers. A task-independent digital biomarker is one that can be gathered at any (or all) point in the interaction. As such, these are arguably more valuable since they are much easier to capture, and do not put constraints on the specifics of the clinical interview. Among the different measures in our study, voice and language features can be seen as mostly task-independent while quantities extracted from gaze, pupil, and drawing depend on a task. Although task-dependent digital biomarkers are more specific and targeted, which might increase accuracy and specificity, that has to be weighted against the relative increase in complexity of the associated data capture. A microphone can simply record a person’s voice while gaze, pupil and drawing sensors all depend on a well-designed task for gathering data that enables accurate diagnosis.
All things considered, microphones are arguably the most useful among those we considered for dementia detection and diagnostics. The relative ease of unobtrusive audio capture and the ability to extract powerful features (e.g., pause length, voice source h1a3) makes it a cheap and useful diagnostic tool. Furthermore, automatic transcripts of the gathered interview audio can also be used to extract linguistic digital biomarkers via text processing, although this may be less relevant for early diagnosis and the digital tools and their maturity will differ across languages, whereas the tools used to extract voice measures do not.
Because of the notable correlation of pupilary data with AD diagnosis, p-tau, Ab42, and hippocampal volume, device-mounted eye-trackers capable of accurately measuring pupil size also have shown potential for augmenting and improving diagnostic procedures, and there might be promise in building an application that combines pupilary measurements with a cognitive test to build more accurate automatic screening tests for dementia. Measures based on drawing and pen pressure have the drawback that they mainly appeared useful for diagnosing between healthy control and AD, a result that should be interpreted with caution since only three individuals with AD were included in the preliminary analysis. That said, various associated digital biomarkers such as gap length show potential and merit more study.
Broader Implications
The non-invasive and non-intrusive nature of our data-capture setup brings several benefits. Non-invasive procedures generally have lower cost and complexity than invasive ones, and also limit the need for health-care personnel since the risk of adverse effects and reactions is much lower. Our non-intrusive data capture does not alter the diagnostic interview in a meaningful way. This is helpful both for obtaining ecologically valid data and in building trust for data-driven diagnostics among both clinicians and patients. By basing the data gathering on affordable and widely-available consumer electronics we hope to demonstrate how to the access to sensor-based diagnostic tools for dementia detection and monitoring can be democratised.
A key strength of using a multimodal approach as described in this article is that the different measurements can reinforce each others’ predictive power while limiting risks from data loss and inaccuracies in the data pipeline. Our in-depth descriptions of our technical setup, data capture procedure, and data processing should enable independent replication of our findings using similar sensors. To further simplify such replication, we will release the the code used for the data capture and processing as open source.
An important consideration in the bigger picture is the temporal and neuronal aspect of AD. Although the diagnostic criteria is limited to healthy, MCI or AD, beneath the diagnosis lies a progressive disorder with a unique pattern of brain functioning for each patient. Assessment of AD is an assessment of the individual’s cognitive functions and their deficits. Streamlined diagnostics offer the potential of continuous assessment of cognitive functions for individuals in the MCI/AD group. For patients with MCI, deficits are specific to certain areas of functioning and continuous assessment enables adaptive care with limited restrictions. This is likely to improve the daily life of the patient, which in turn might help the patient not progress to AD (through better quality of life and reduced life stressors). Continuous screening as part of behavioural interventions might help furthermore develop a virtuous cycle of improved understanding of the disorder, through data capture that leads to better targeted interventions.
If non-invasive measurements can accurately predict underlying brain atrophy in different areas, that also opens the door to a future where quick tests can quantify disease progress. This could help in the quest to find a cure, since behavioural interventions and targeted pharmaceutical drugs might be used to target specific brain atrophies caused by the disorder.
Conclusion
We have described a non-invasive and non-intrusive system for collecting synchronous behavioural and physiological data in order to facilitate detection of early signs of Alzheimer’s disease, based on a large and diverse set of modalities including speech, gaze, pupillometry, facial motion capture, drawing, heart rate and thermal data in existing clinical assessments of dementia, and also used the initial data thus gathered for a preliminary analysis of selected digital biomarkers available through our approach, and their diagnostic value.
The modalities we capture allow both behavioural and physiological measurements in an objective and quantitative manner, and thus complementing the intuitive and qualitative observations made by the assessing clinician. The studied modalities may not only quantify the observations and “gut feeling” of the clinician, but can also measure aspects of the patient and interaction that are inaccessible to human perception. Our work demonstrates that the proposed approach is feasible with commodity hardware and open-source software that we are preparing for public release.
Our multimodal approach to digital biomarkers has the potential to improve precision in patient selection for further and more invasive examinations, thereby saving personnel-time and financial resources for society, and avoiding unnecessary delays, suffering, and discomfort for patients. While existing full-fledged diagnostic procedures are advanced, they still result in a troubling amount of misdiagnoses (Villemagne et al., 2018; Gauthreaux et al., 2020). To the extent that systems and measurements of the kind described in this article also can contribute to diagnostic accuracy, that should benefit patients and their families in several ways, including reducing exposure to unnecessary medication with negative side-effects and avoiding life-quality losses associated with a false positive diagnosis.
Our analysis finds that single modalities can be used for AD prediction in isolation. Some of these have not been reported previously: Our preliminary results indicate that head temperature change and drawing gap length are two new digital biomarkers that correlated with AD diagnosis and biological biomarkers. Pupillary response has been used for AD prediction but to our knowledge not in the context of cognitively demanding tasks. Other preliminary results confirm what is known from previous work, such as the correlation of pause length, vocal strength and gaze patterns with a dementia diagnosis. This demonstrates that a broad and inclusive data-gathering approach has the potential to discover new digital biomarkers of clinical utility, which in turn can serve as further clues to understand underlying mechanisms of AD and other neurocognitive disorders. The fact that isolated modalities correlate well with established biomarkers and the clinical diagnosis also suggests the potential of combining different modalities and measures for further improved diagnostic accuracy. It should be noted that all of the metrics explored in the current study are manually crafted features. As is well known from machine learning e.g. in speech and image processing, automatically learned features generally outperform hand crafted features when sufficient amounts of data are available. Machine learning based feature extraction, prediction and classification methods will be a central area of exploration as these data collection efforts continue.
As it stands, a limitation of the results presented in this paper is the relatively small number of patients, which does not allow statistically rigorous conclusions nor discriminating between different types of neurocognitive disorders. Our preliminary results therefore mainly pertain to patients with AD, the most common dementia diagnosis. Another limitations is that, also for reasons of statistical power, we have only focused on measures relevant to atrophy in brain regions known to be especially affected by AD. In future studies with more patients, we intend to explore measures and modalities that associate with changes in a broader range of brain regions.
Data Availability Statement
The datasets presented in this article are not readily available because Since clinical patient data is used, the access to data is highly restricted but we will work with frontiers to comply with frontiers guidelines as well as Swedish regulatory guidelines related to clinical patient data. Requests to access the datasets should be directed to Jonas Beskow YmVza293QGt0aC5zZQ==.
Ethics Statement
The studies involving human participants were reviewed and approved by Regionala Etikprövningsnämnden i Stockholm. The patients/participants provided their written informed consent to participate in this study.
Author Contributions
PJ Planning, design, and setup of the data collection system. Responsible for the majority of the implementation of the data collection system at Karolinska University Hospital (KUH). Manuscript writing and editing, primarily sections 4–5. Data analysis. BM Setup of clinical data capture KUH. Data analysis and feature extraction. Manuscript writing and editing, mainly sections 5–8. KH Setup of clinical data capture KUH. Manuscript writing, primarily the medical aspects of the manuscript. GH Setup of clinical data capture KUH. Manuscript writing and editing. TK Technical and manuscript discussions, and data quality assurance. OM Technical discussions and data quality assurance. GH Clinical assessment KUH JH Clinical data capture KUH MK Co-PI of the project. Overall strategic planning and discussions on clinical data collection activities. HK PI of the project. Planning and disscussions on technical activities. Manuscript editing. JG Co-PI of the project. He has been in charge of section 3 Related work in the current paper. JB Co-PI of the project. Coordination and planning of data collection and data analysis. Speech and multimodal data processing. Manuscript writing, primarily sections 5–6.
Funding
This research was funded by Swedish Foundation of Strategic Research (SSF), project EACare under Grant No RIT15-0107.
Conflict of Interest
The authors declare that the research was conducted in the absence of any commercial or financial relationships that could be construed as a potential conflict of interest.
Footnotes
1https://github.com/kth-social-robotics/multisensoryprocessing
3https://developer.mozilla.org/en-US/docs/Web/API/WebSockets_API
4https://developer.flir.com/mobile/flironesdk/
6http://developer.tobiipro.com/python.html
7https://github.com/respeaker/respeaker_python_library
8https://github.com/google/REAPER
9http://www.speech.kth.se/snack/
10https://librosa.org/doc/latest/index.html
References
Ahmed, S., Haigh, A.-M. F., de Jager, C. A., and Garrard, P. (2013). Connected speech as a marker of disease progression in autopsy-proven Alzheimer’s disease. Brain 136, 3727–3737. doi:10.1093/brain/awt269
Algotsson, A., Viitanen, M., Winblad, B., and Solders, G. (1995). Autonomic dysfunction in Alzheimer’s disease. Acta Neurolo. Scand. 91, 14–18. doi:10.1111/j.1600-0404.1995.tb05836.x
Allan, L. M., Kerr, S. R. J., Ballard, C. G., Allen, J., Murray, A., McLaren, A. T., et al. (2005). Autonomic function assessed by heart rate variability is normal in alzheimer's disease and vascular dementia. Dement Geriatr. Cogn. Disord. 19, 140–144. doi:10.1159/000082885
Anzengruber, B., and Riener, A. (2012). “FaceLight - potentials and drawbacks of thermal imaging to infer driver stress,” in ACM SIGCHI international conference on automotive user Interfaces and interactive vehicular applications, Portsmouth, NH, October 2012, 209–216. doi:10.1145/2390256.2390292
Asgari, M., Kaye, J., and Dodge, H. (2017). Predicting mild cognitive impairment from spontaneous spoken utterances. Alzheimer's Demen. Transl. Res. Clin. Intervent. 3, 219–228. doi:10.1016/j.trci.2017.01.006
Asplund, K., Norberg, A., Adolfsson, R., and Waxman, H. M. (1991). Facial expressions in severely demented patients?a stimulus-response study of four patients with dementia of the Alzheimer type. Int. J. Geriat. Psychiatry 6, 599–606. doi:10.1002/gps.930060809
Beltrán, J., García-Vázquez, M. S., Benois-Pineau, J., Gutierrez-Robledo, L. M., and Dartigues, J.-F. (2018). Computational techniques for eye movements analysis towards supporting early diagnosis of Alzheimer’s disease: a review. Comput. Math. Methods Med. 14, 2676409. doi:10.1155/2018/2676409
Blennow, K., de Leon, M. J., and Zetterberg, H. (2006). Alzheimer’s disease. Lancet 368, 387–403. doi:10.1016/s0140-6736(06)69113-7
Borson, S., Barnes, R. F., Veith, R. C., Halter, J. B., and Raskind, M. A. (1989). Impaired sympathetic nervous system response to cognitive effort in early Alzheimer’s disease. J. Gerontol. 44, M8–M12. doi:10.1093/geronj/44.1.m8
Boschi, V., Catricala, E., Consonni, M., Chesi, C., Moro, A., and Cappa, S. F. (2017). Connected speech in neurodegenerative language disorders: a review. Front. Psychol. 8, 269. doi:10.3389/fpsyg.2017.00269
Bruun, M., Frederiksen, K. S., Rhodius-Meester, H. F. M., Baroni, M., Gjerum, L., Koikkalainen, J., et al. (2019). Impact of a clinical decision support tool on dementia diagnostics in memory clinics: the PredictND validation study. Curr. Alzheimer. Res. 16, 91–101. doi:10.2174/1567205016666190103152425
Bucks, R. S., Singh, S., Cuerden, J. M., and Wilcock, G. K. (2000). Analysis of spontaneous, conversational speech in dementia of alzheimer type: evaluation of an objective technique for analysing lexical performance. Aphasiology 14, 71–91. doi:10.1080/026870300401603
Burton, K. W., and Kaszniak, A. W. (2006). Emotional experience and facial expression in Alzheimer’s disease. Aging Neuropsychol. Cogn. 13, 636–651. doi:10.1080/13825580600735085
Cai, Y., Li, L., Xu, C., and Wang, Z. (2020). The effectiveness of non‐pharmacological interventions on apathy in patients with dementia: a systematic review of systematic reviews. Worldviews Evidence‐Based Nurs. 17, 311–318. doi:10.1111/wvn.12459
Calzà, L., Gagliardi, G., Favretti, R. R., and Tamburini, F. (2020). Linguistic features and automatic classifiers for identifying mild cognitive impairment and dementia. Comp. Speech Lang. 65, 101113. doi:10.1016/j.csl.2020.101113
Cao, Q., Tan, C.-C., Xu, W., Hu, H., Cao, X.-P., Dong, Q., et al. (2020). The prevalence of dementia: a systematic review and meta-analysis. J. Alzheimers Dis. 73, 1157–1166. doi:10.3233/JAD-191092
Cao, Z., Hidalgo, G., Simon, T., Wei, S.-E., and Sheikh, Y. (2021). Openpose: realtime multi-person 2D pose estimation using part affinity fields. IEEE Trans. Pattern Anal. Mach. Intell. 43, 172–186. doi:10.1109/tpami.2019.2929257
Castellani, R. J., Lee, H.-g., Siedlak, S. L., Nunomura, A., Hayashi, T., Nakamura, M., et al. (2009). Reexamining Alzheimer’s disease: evidence for a protective role for amyloid-β protein precursor and amyloid-β. J Alzheimers Dis. 18, 447–452. doi:10.3233/jad-2009-1151
Charernboon, T. (2017). Diagnostic accuracy of the overlapping infinity loops, wire cube, and clock drawing tests for cognitive impairment in mild cognitive impairment and dementia. Int. J. Alzheimer's Dis. 2017, 5289239. doi:10.1155/2017/5289239
Chen, R., Jankovic, F., Marinsek, N., Foschini, L., Kourtis, L., Signorini, A., et al. (2019). “Developing measures of cognitive impairment in the real world from consumer-grade multimodal sensor streams,” in ACM SIGKDD international Conference on knowledge discovery & data mining, Anchorage, AK, United States, July 2019 (Association for Computing Machinery), 2145–2155. doi:10.1145/3292500.3330690
Cho, Y. (2018). “Automated mental stress recognition through mobile thermal imaging,” in International Conference on affective Computing and intelligent interaction, San Antonio, TX, United States, Oct. 2017 (IEEE). doi:10.1109/ACII.2017.8273662
Chung, P.-C., Hsu, Y.-L., Wang, C.-Y., Lin, C.-W., Wang, J.-S., and Pai, M.-C. (2012). “Gait analysis for patients with Alzheimer’s disease using a triaxial accelerometer,” in IEEE international Symposium on Circuits and systems, Seoul, Korea (South), May 2012 (IEEE).
da Silva, V. P., Ramalho Oliveira, B. R., Tavares Mello, R. G., Moraes, H., Deslandes, A. C., and Laks, J. (2018). Heart rate variability indexes in dementia: a systematic review with a quantitative analysis. Curr. Alzheimer Res. 15, 80–88. doi:10.2174/1567205014666170531082352
de la Fuente Garcia, S., Ritchie, C., and Luz, S. (2020). Artificial intelligence, speech and language processing approaches to monitoring Alzheimer’s disease: a systematic review. J Alzheimers Dis. 78, 1547–1574. doi:10.1007/s10286-009-0035-
de Vilhena Toledo, M. A., and Junqueira, L. F. (2010). Cardiac autonomic modulation and cognitive status in Alzheimer's disease. Clin. Auton. Res. 20, 11–17. doi:10.1007/s10286-009-0035-0
Eyben, F., Scherer, K. R., Schuller, B. W., Sundberg, J., André, E., Busso, C., et al. (2015). The Geneva minimalistic acoustic parameter set (gemaps) for voice research and affective computing. IEEE Trans. Affective Comput. 7, 190–202. doi:10.1109/TAFFC.2015.2457417
Eyben, F., Weninger, F., Gross, F., and Schuller, B. (2013). “Recent developments in opensmile, the Munich open-source multimedia feature extractor,” in ACM international Conference on multimedia, Barcelona, Spain, October 2013 (Association for Computing Machinery), 835–838. doi:10.1145/2502081.2502224
Eyben, F., Wöllmer, M., and Schuller, B. (2010). “Opensmile: the Munich versatile and fast open-source audio feature extractor,” in ACM international Conference on multimedia, Firenze Italy, October 2010 (Association for Computing Machinery), 1459–1462. doi:10.1145/1873951.1874246
Ferreira, D., Verhagen, C., Hernández-Cabrera, J. A., Cavallin, L., Guo, C.-J., Ekman, U., et al. (2017). Distinct subtypes of Alzheimer’s disease based on patterns of brain atrophy: longitudinal trajectories and clinical applications. Scientific Rep. 7, 46263. doi:10.1038/srep46263
Ferri, C. P., Prince, M., Brayne, C., Brodaty, H., Fratiglioni, L., Ganguli, M., et al. (2005). Global prevalence of dementia: a delphi consensus study. Lancet 366, 2112–2117. doi:10.1016/s0140-6736(05)67889-0
Garbutt, S., Matlin, A., Hellmuth, J., Schenk, A. K., Johnson, J. K., Rosen, H., et al. (2008). Oculomotor function in frontotemporal lobar degeneration, related disorders and Alzheimer’s disease. Brain 131, 1268–1281. doi:10.1093/brain/awn047
Garre-Olmo, J., Faúndez-Zanuy, M., López-de Ipiña, K., Calvó-Perxas, L., and Turró-Garriga, O. (2017). Kinematic and pressure features of handwriting and drawing: preliminary results between patients with mild cognitive impairment, alzheimer disease and healthy controls. Curr. Alzheimer Res. 14, 960–968. doi:10.2174/1567205014666170309120708
Gatouillat, A., Dumortier, A., Perera, S., Badr, Y., Gehin, C., and Sejdić, E. (2017). Analysis of the pen pressure and grip force signal during basic drawing tasks: the timing and speed changes impact drawing characteristics. Comput. Biol. Med. 87, 124–131. doi:10.1016/j.compbiomed.2017.05.020
Gauthreaux, K., Bonnett, T. A., Besser, L. M., Brenowitz, W. D., Teylan, M., Mock, C., et al. (2020). Concordance of clinical Alzheimer diagnosis and neuropathological features at autopsy. J. Neuropathol. Exp. Neurol. 79, 465–473. doi:10.1093/jnen/nlaa014
Gavas, R., Chatterjee, D., and Sinha, A. (2017). “Estimation of cognitive load based on the pupil size dilation,” in IEEE International Conference on Systems, Man, and Cybernetics (SMC). Banff, AB, October 5–8, 2017 (IEEE). doi:10.1109/smc.2017.8122826
Giles, E., Patterson, K., and Hodges, J. R. (1996). Performance on the Boston Cookie theft picture description task in patients with early dementia of the Alzheimer’s type: missing information. Aphasiology 10, 395–408. doi:10.1080/02687039608248419
Granholm, E. L., Panizzon, M. S., Elman, J. A., Jak, A. J., Hauger, R. L., Bondi, M. W., et al. (2017). Pupillary responses as a biomarker of early risk for Alzheimer’s disease. Jad 56, 1419–1428. doi:10.3233/jad-161078
Hafiz, P., and Bardram, J. E. (2020). The ubiquitous cognitive assessment tool for smartwatches: design, implementation, and evaluation study. JMIR Mhealth and Uhealth 8, e17506. doi:10.2196/17506
Hafiz, P., Miskowiak, K. W., Kessing, L. V., Jespersen, A. E., Obenhausen, K., Gulyas, L., et al. (2019). The internet-based cognitive assessment tool: system design and feasibility study. JMIR Formative Res. 3, e13898. doi:10.2196/13898
Haider, F., de la Fuente, S., and Luz, S. (2019). An assessment of paralinguistic acoustic features for detection of Alzheimer’s dementia in spontaneous speech. IEEE J. Selected Top. Signal Process. 14, 272–281. doi:10.1109/JSTSP.2019.2955022
Håkansson, K., Ngandu, T., and Kivipelto, M. (2018). “The patient with cognitive impairment,” in Treatable and potentially preventable dementias. Editor V. Hachinsky (Cambridge, United Kingdom: Cambridge University Press), 52–80.
Hamet, P., and Tremblay, J. (2017). Artificial intelligence in medicine. Metabolism 69, S36–S40. doi:10.1016/j.metabol.2017.01.011
Hardy, J., and Higgins, G. (1992). Alzheimer’s disease: the amyloid cascade hypothesis. Science 256, 184–185. doi:10.1126/science.1566067
Henneges, C., Reed, C., Chen, Y.-F., Dell’Agnello, G., and Lebrec, J. (2016). Describing the sequence of cognitive decline in Alzheimer’s disease patients: results from an observational study. J Alzheimers Dis 52, 1065–1080. doi:10.3233/jad-150852
Insel, P., Donohue, M., Berron, D., Hansson, O., and Mattsson-Carlgren, N. (2020). Time between milestone events in the Alzheimer’s disease amyloid cascade. bioRxiv. doi:10.1101/2020.05.18.103226
Jack, C. R., Bennett, D. A., Blennow, K., Carrillo, M. C., Dunn, B., Haeberlein, S. B., et al. (2018). NIA-AA research framework: toward a biological definition of Alzheimer’s disease. Alzheimer's Demen. 14, 535–562. doi:10.1016/j.jalz.2018.02.018
Jarrold, W., Peintner, B., Wilkins, D., Vergryi, D., Richey, C., Gorno-Tempini, M. L., et al. (2014). “Aided diagnosis of dementia type through computer-based analysis of spontaneous speech,” in Workshop on computational Linguistics and clinical psychology: from linguistic Signal to clinical reality, Baltimore, Maryland, June 2014 (Association for Computational Linguistics), 27–37. doi:10.1109/smc.2017.8122826
Jonell, P., Bystedt, M., Fallgren, P., Kontogiorgos, D., Lopes, J., Malisz, Z., et al. (2018). “FARMI: a framework for recording multi-modal interactions,” in International Conference on language Resources and evaluation, Miyazaki, Japan
Julayanont, P., Brousseau, M., Chertkow, H., Phillips, N., and Nasreddine, Z. S. (2014). Montreal cognitive assessment memory index score (MoCA-MIS) as a predictor of conversion from mild cognitive impairment to Alzheimer’s disease. J. Am. Geriatr. Soc. 62, 679–684. doi:10.1111/jgs.12742
Kepp, K. P. (2017). Ten challenges of the amyloid hypothesis of Alzheimer’s disease. J. Alzheimers Dis. 55, 447–457. doi:10.3233/JAD-160550
Kivipelto, M., Mangialasche, F., and Ngandu, T. (2017). Can lifestyle changes prevent cognitive impairment? Lancet Neurol. 16, 338–339. doi:10.1016/s1474-4422(17)30080-7
Koikkalainen, J. R., Rhodius-Meester, H. F., Rhodius-Meester, H. F. M., Frederiksen, K. S., Bruun, M., Hasselbalch, S. G., et al. (2019). Automatically computed rating scales from mri for patients with cognitive disorders. Eur. Radiol. 29, 4937–4947. doi:10.1007/s00330-019-06067-1
Komeili, M., Pou-Prom, C., Liaqat, D., Fraser, K. C., Yancheva, M., and Rudzicz, F. (2019). Talk2me: automated linguistic data collection for personal assessment. PLoS ONE 14, e0212342. doi:10.1371/journal.pone.0212342
König, A., Linz, N., Tröger, J., Wolters, M., Alexandersson, J., and Robert, P. (2018). Fully automatic speech-based analysis of the semantic verbal fluency task. Dement Geriatr. Cogn. Disord. 45, 198–209. doi:10.1159/000487852
König, A., Satt, A., Sorin, A., Hoory, R., Toledo‐Ronen, O., Derreumaux, A., et al. (2015). Automatic speech analysis for the assessment of patients with predementia and Alzheimer’s disease. Alzheimer's Demen. Diagn. Assess. Dis. Monit. 1, 112–124. doi:10.1016/j.dadm.2014.11.012
Kourtis, L. C., Regele, O. B., Wright, J. M., and Jones, G. B. (2019). Digital biomarkers for Alzheimer’s disease: the mobile/wearable devices opportunity. npj Digital Med. 2, 1–9. doi:10.1038/s41746-019-0084-2
Kumar, D. K. V., Choi, S. H., Washicosky, K. J., Eimer, W. A., Tucker, S., Ghofrani, J., et al. (2016). Amyloid-β peptide protects against microbial infection in mouse and worm models of Alzheimer’s disease. Sci. Translational Med. 8, 340ra72. doi:10.1126/scitranslmed.aaf1059
Lane, C. A., Hardy, J., and Schott, J. M. (2018). Alzheimer's disease. Eur. J. Neurol. 25, 59–70. doi:10.1111/ene.13439
Lang, L., Clifford, A., Wei, L., Zhang, D., Leung, D., Augustine, G., et al. (2017). Prevalence and determinants of undetected dementia in the community: a systematic literature review and a meta-analysis. BMJ Open 7, e011146, doi:10.1136/bmjopen-2016-011146
Lee, G., Nho, K., Kang, B., Sohn, K.-A., and Kim, D. (2019a). Predicting Alzheimer’s disease progression using multi-modal deep learning approach. Scientific Rep. 9, 1–12. doi:10.1038/s41598-018-37769-z
Lee, J. E., Yang, S. W., Ju, Y. J., Ki, S. K., and Chun, K. H. (2019b). Sleep-disordered breathing and Alzheimer’s disease: a nationwide cohort study. Psychiatry Res. 273, 624–630. doi:10.1016/j.psychres.2019.01.086
Lewis, G. F., Gatto, R. G., and Porges, S. W. (2011). A novel method for extracting respiration rate and relative tidal volume from infrared thermography. Psychophysiol. 48, 877–887. doi:10.1111/j.1469-8986.2010.01167.x
Li, H., Liu, C.-C., Zheng, H., and Huang, T. Y. (2018). Amyloid, tau, pathogen infection and antimicrobial protection in Alzheimer’s disease – conformist, nonconformist, and realistic prospects for AD pathogenesis. Translational neurodegeneration 7, 34. doi:10.1186/s40035-018-0139-3
Long, J. M., and Holtzman, D. M. (2019). Alzheimer disease: an update on pathobiology and treatment strategies. Cell 179, 312–339. doi:10.1016/j.cell.2019.09.001
Malisz, Z., Jonell, P., and Beskow, J. (2019). “The visual prominence of whispered speech in Swedish,” in International Congress of phonetic sciences
Matsushita, M., Yatabe, Y., Koyama, A., Katsuya, A., Ijichi, D., Miyagawa, Y., et al. (2018). Are saving appearance responses typical communication patterns in Alzheimer’s disease? PLOS ONE 13, e0197468. doi:10.1371/journal.pone.0197468
McGirr, S., Venegas, C., and Swaminathan, A. (2020). Alzheimer’s disease: a brief review. J. Exp. Neurol. 1, 89–98.
Migliaccio, R., Tanguy, D., Bouzigues, A., Sezer, I., Dubois, B., Le Ber, I., et al. (2020). Cognitive and behavioural inhibition deficits in neurodegenerative dementias. Cortex 131, 265–283. doi:10.1016/j.cortex.2020.08.001
Mirheidari, B., Blackburn, D., Harkness, K., Walker, T., Venneri, A., Reuber, M., et al. (2017). Toward the automation of diagnostic conversation analysis in patients with memory complaints. J Alzheimers Dis 58, 373–387.doi:10.3233/jad-160507
Mirheidari, B., Blackburn, D., Walker, T., Reuber, M., and Christensen, H. (2019). Dementia detection using automatic analysis of conversations. Comp. Speech Lang. 53, 65–79. doi:10.1016/j.csl.2018.07.006
Molitor, R. J., Ko, P. C., and Ally, B. A. (2015). Eye movements in Alzheimer’s disease. J Alzheimers Dis 44, 1–12. doi:10.3233/jad-141173
Mueller, K. D., Hermann, B., Mecollari, J., and Turkstra, L. S. (2018). Connected speech and language in mild cognitive impairment and Alzheimer’s disease: a review of picture description tasks. J. Clin. Exp. Neuropsychol. 40, 917–939. doi:10.1080/13803395.2018.1446513
Nam, U., Lee, K., Ko, H., Lee, J.-Y., and Lee, E. C. (2020). Analyzing facial and eye movements to screen for Alzheimer’s disease. Sensors 20, 5349. doi:10.3390/s20185349
Nasreddine, Z. S., Phillips, N. A., Bã©dirian, V. r., Charbonneau, S., Whitehead, V., Collin, I., et al. (2005). The montreal cognitive assessment, moca: a brief screening tool for mild cognitive impairment. J. Am. Geriatr. Soc. 53, 695–699. doi:10.1111/j.1532-5415.2005.53221.x
Negami, M., Maruta, T., Takeda, C., Adachi, Y., and Yoshikawa, H. (2013). Sympathetic skin response and heart rate variability as diagnostic tools for the differential diagnosis of Lewy body dementia and Alzheimer’s disease: a diagnostic test study. BMJ Open 3, e001796. doi:10.1136/bmjopen-2012-001796
Phillips, N., Al-Yawer, F., Giroud, N., Rehan, S., Pappadatos, Z., Mick, P., et al. (2020). “Sensory function, cognition, and brain structure in SCD, MCI, and AD: initial findings from the COMPASS-ND study,” in Alzheimer’s association international conference Clinical Manifestations 16, e044056. doi:10.1002/alz.044056
Pistono, A., Jucla, M., Barbeau, E. J., Saint-Aubert, L., Lemesle, B., Calvet, B., et al. (2016). Pauses during autobiographical discourse reflect episodic memory processes in early Alzheimer’s disease. J Alzheimers Dis 50, 687–698. doi:10.3233/jad-150408
Prince, M. J. (2015). World Alzheimer Report 2015. The global impact of dementia: an analysis of prevalence, incidence, cost and trends (Alzheimer’s Disease International)
Reitan, R. M., and Wolfson, D. (1985). The Halstead-Reitan neuropsychological test battery: theory and clinical interpretation. London: Neuropsychology Press.
Roalf, D. R., Rupert, P., Mechanic-Hamilton, D., Brennan, L., Duda, J. E., Weintraub, D., et al. (2018). Quantitative assessment of finger tapping characteristics in mild cognitive impairment, Alzheimer’s disease, and Parkinson's disease. J. Neurol. 265, 1365–1375. doi:10.1007/s00415-018-8841-8
Roark, B., Mitchell, M., Hosom, J.-P., Hollingshead, K., and Kaye, J. (2011). Spoken language derived measures for detecting mild cognitive impairment. IEEE Trans. Audio Speech Lang. Process. 19, 2081–2090. doi:10.1109/tasl.2011.2112351
Ruminski, J., and Kwasniewska, A. (2017). Evaluation of respiration rate using thermal imaging in mobile conditions. Appl. Infrared Biomed. Sci. 14, 311–346. doi:10.1007/978-981-10-3147-2_18
Scarmeas, N., Hadjigeorgiou, G. M., Papadimitriou, A., Dubois, B., Sarazin, M., Brandt, J., et al. (2004). Motor signs during the course of Alzheimer disease. Neurology 63, 975–982. doi:10.1212/01.wnl.0000138440.39918.0c
Schlink, B. R., Peterson, S. M., Hairston, W., König, P., Kerick, S. E., and Ferris, D. P. (2017). Independent component analysis and source localization on mobile eeg data can identify increased levels of acute stress. Front. Hum. Neurosci. 11, 310. doi:10.3389/fnhum.2017.00310
Seidl, U., Lueken, U., Thomann, P. A., Kruse, A., and Schröder, J. (2012). Facial expression in Alzheimer’s disease. Am. J. Alzheimers Dis. Other Demen. 27, 100–106. doi:10.1177/1533317512440495
Sharma, K. (2019). Cholinesterase inhibitors as Alzheimer’s therapeutics (Review). Mol. Med. Rep. 20, 1479–1487. doi:10.3892/mmr.2019.10374
Slegers, A., Filiou, R.-P., Montembeault, M., and Brambati, S. M. (2018). Connected speech features from picture description in Alzheimer’s disease: a systematic review. J Alzheimers Dis 65, 519–542. doi:10.3233/jad-170881
Smith, M. (1995). Facial expression in mild dementia of the Alzheimer type. Behav. Neurol. 8, 149–156.
Szatloczki, G., Hoffmann, I., Vincze, V., Kalman, J., and Pakaski, M. (2015). Speaking in Alzheimer’s disease, is that an early sign? Importance of changes in language abilities in Alzheimer’s disease. Front. Aging Neurosci. 7, 195. doi:10.3389/fnagi.2015.00195
Themistocleous, C., Eckerström, M., and Kokkinakis, D. (2020). Voice quality and speech fluency distinguish individuals with mild cognitive impairment from healthy controls. PLoS ONE 15, e0236009. doi:10.1371/journal.pone.0236009
Tiele, A., Wicaksono, A., Daulton, E., Ifeachor, E., Eyre, V., Clarke, S., et al. (2020). Breath-based non-invasive diagnosis of Alzheimer’s disease: a pilot study. J. Breath Res. 14, 026003. doi:10.1088/1752-7163/ab6016
Tóth, L., Gosztolya, G., Vincze, V., Hoffmann, I., Szatlóczki, G., Biró, E., et al. (2015). “Automatic detection of mild cognitive impairment from spontaneous speech using ASR,” in Annual Conference of the international speech communication association.
Tóth, L., Hoffmann, I., Gosztolya, G., Vincze, V., Szatlóczki, G., Bánréti, Z., et al. (2018). A speech recognition-based solution for the automatic detection of mild cognitive impairment from spontaneous speech. Curr. Alzheimer. Res. 15, 130–138. doi:10.2174/1567205014666171121114930
Villemagne, V. L., Doré, V., Burnham, S. C., Masters, C. L., and Rowe, C. C. (2018). Imaging tau and amyloid-β proteinopathies in Alzheimer disease and other conditions. Nat. Rev. Neurol. 14, 225–236. doi:10.1038/nrneurol.2018.9
Voleti, R., Liss, J. M., and Berisha, V. (2019). A review of automated speech and language features for assessment of cognitive and thought disorders. IEEE J. Selected Top. Signal Process. 14, 282–298. doi:10.1109/JSTSP.2019.2952087
Walker, T., Christensen, H., Mirheidari, B., Swainston, T., Rutten, C., Mayer, I., et al. (2020). Developing an intelligent virtual agent to stratify people with cognitive complaints: a comparison of human-patient and intelligent virtual agent-patient interaction. Dementia 19, 1173–1188. doi:10.1177/1471301218795238
Wang, S.-J., Liao, K.-K., Fuh, J.-L., Lin, K.-N., Wu, Z.-A., Liu, C.-Y., et al. (1994). Cardiovascular autonomic functions in Alzheimer’s disease. Age Ageing 23, 400–404. doi:10.1093/ageing/23.5.400
Werner, P., Rosenblum, S., Bar-On, G., Heinik, J., and Korczyn, A. (2006). Handwriting process variables discriminating mild Alzheimer’s disease and mild cognitive impairment. J. Gerontol. Ser. B: Psychol. Sci. Soc. Sci. 61, P228–P236. doi:10.1093/geronb/61.4.p228
Wimo, A., Guerchet, M., Ali, G.-C., Wu, Y.-T., Prina, A. M., Winblad, B., et al. (2017). The worldwide costs of dementia 2015 and comparisons with 2010. Alzheimer's Demen. 13, 1–7. doi:10.1016/j.jalz.2016.07.150
World Health Organization and Alzheimer’s Disease International (2012). Dementia: a public health priority. London: World Health Organization.
Yuan, J., Bian, Y., Cai, X., Huang, J., Ye, Z., and Church, K. (2020). Disfluencies and fine-tuning pre-trained language models for detection of Alzheimer’s disease. Proc. Interspeech 12, 2162–2166. doi:10.21437/interspeech.2020-2516
Zhang, Y., Wilcockson, T., Kim, K. I., Crawford, T., Gellersen, H., and Sawyer, P. (2016). Monitoring dementia with automatic eye movements analysis. Intell. Dec. Technol. 11, 299–309. doi:10.1007/978-3-319-39627-9_26
Zhou, Q., Srivastava, N., Goncalves, J., Newn, J., Dingler, T., and Velloso, E. (2019). “Cognitive aid: task assistance based on mental workload estimation,” in ACM HCI Conference on human Factors in computing systems May 2019, Glasgow Scotland UK, (Association for Computing Machinery), 1–6. doi:10.1145/3290607.3313010
Keywords: Alzheimer, mild cognitive impairment, multimodal prediction, speech, gaze, pupil dilation, thermal camera, pen motion
Citation: Jonell P, Moëll B, Håkansson K, Henter GE, Kucherenko T, Mikheeva O, Hagman G, Holleman J, Kivipelto M, Kjellström H, Gustafson J and Beskow J (2021) Multimodal Capture of Patient Behaviour for Improved Detection of Early Dementia: Clinical Feasibility and Preliminary Results. Front. Comput. Sci. 3:642633. doi: 10.3389/fcomp.2021.642633
Received: 16 December 2020; Accepted: 10 February 2021;
Published: 19 April 2021.
Edited by:
Fasih Haider, University of Edinburgh, United KingdomReviewed by:
Kewei Chen, Banner Alzheimer’s Institute, United StatesRubén San-Segundo, Polytechnic University of Madrid, Spain
Copyright © 2021 Jonell, Moëll, Håkansson, Henter, Kucherenko, Mikheeva, Hagman, Holleman, Kivipelto, Kjellström, Gustafson and Beskow. This is an open-access article distributed under the terms of the Creative Commons Attribution License (CC BY). The use, distribution or reproduction in other forums is permitted, provided the original author(s) and the copyright owner(s) are credited and that the original publication in this journal is cited, in accordance with accepted academic practice. No use, distribution or reproduction is permitted which does not comply with these terms.
*Correspondence: Patrik Jonell, cGpqb25lbGxAa3RoLnNl; Birger Moell, Ym1vZWxsQGt0aC5zZQ==
†These authors share first authorship