Abstract
We present a novel system for the automatic video monitoring of honey bee foraging activity at the hive entrance. This monitoring system is built upon convolutional neural networks that perform multiple animal pose estimation without the need for marking. This precise detection of honey bee body parts is a key element of the system to provide detection of entrance and exit events at the entrance of the hive including accurate pollen detection. A detailed evaluation of the quality of the detection and a study of the effect of the parameters are presented. The complete system also integrates identification of barcode marked bees, which enables the monitoring at both aggregate and individual levels. The results obtained on multiple days of video recordings show the applicability of the approach for large-scale deployment. This is an important step forward for the understanding of complex behaviors exhibited by honey bees and the automatic assessment of colony health.
1. Introduction
There is a growing interest in the quantification of behavior in honey bees (Apis Melifera). One of the major concerns is the dramatic yearly decrease in honey bee populations (Neumann and Carreck, 2010; Anderson et al., 2011; Huang and Giray, 2012), which has impacted the agriculture industry in the last few years. Although there are existing hypotheses regarding the usage of pesticides and urban growth, there are still questions unanswered that require precise observations to guide possible actions. Furthermore, honey bee colonies exhibit complex self-regulatory behaviors that are not yet fully understood. This includes how colonies maintain homeostasis or adapt to environmental changes, automatic adjustment of circadian patterns based on thermal cycles (Giannoni-Guzmán et al., 2021), thermo-regulation (Kaspar et al., 2018), or the individual variation in foraging activities in function of the season of the year (Meikle and Holst, 2016). Such studies may benefit greatly from automatic surveillance systems of the hives to detect both individual and collective behavior continuously over days or even seasons to provide crucial insights about biological mechanisms that express themselves over such time frames.
Foraging behavior has traditionally been studied through visual inspection of bees marked with number tags (Wario et al., 2015), which is a very time-consuming and error-prone process, as foraging bees usually spend very little time in the ramp before entering the hive with their payload. The overall count of entrance and exits can currently be estimated using optical or mechanical bee counting sensors that detect the passage and direction of individual bees through gates at the entrance of the hive (Meikle and Holst, 2016). In that setup, only aggregated statistics can be obtained, which led to the development of sensor technology to detect entrance and exits of individuals marked with Radio-Frequency Identification tags (RFID) (de Souza et al., 2018).
A complementary approach is to analyze the behavior through video recordings. The advantage of the video collection at the colony entrance is that in addition to entrance and exit events, a much larger set of information is available: payload (pollen), the identity of bees with markings, morphology and phenotype, social interactions, gait, etc. This technique is minimally invasive since it does not require manipulation of the individuals, except to perform optional marking. One of the main challenges of this approach is the need for algorithmic processing of the videos which is not needed in simpler sensor setups. The application of machine vision to such applications has become in the last decade a very compelling option due to the improvement in computational power and artificial intelligence methods (Branson et al., 2009). The idea is to develop algorithms that can identify and quantify the behaviors of interest with limited human intervention. This enables the design of high throughput systems that can analyze long periods of video recordings automatically.
Ideally, the observation should happen in the most natural setup to avoid interfering with the behavior; however, there is a known trade-off between the complexity of the problem and the conditions of observation (Robie et al., 2017). As the set-up becomes as unobtrusive as possible, the complexity of the task rises, which requires more powerful algorithmic approaches to address it. This is the case at a normal entrance of a colony, where there are natural changes of illumination, changing the number of individuals, and fast moving individuals that make the problem more challenging. In addition, the entrance ramp can be very crowded at certain times of the day, which makes it difficult for traditional background subtraction based algorithms (Campbell et al., 2008) to detect precisely each individual.
In this study, we introduce a new computer vision system that leverages recent advances in deep learning to monitor collective and individual behavior of honey bees at the entrance of their hive with minimal interference. The rest of this study is organized as follows. In Section 2, an overview of related study is presented. The proposed system is presented in Section 3 and evaluated in Section 4. The main findings and future directions are discussed in Section 5.
2. Related Work
We first review related studies about the monitoring of honey bees in the context of foraging analysis, then discuss more general methodologies for detection, tracking, and characterization of individual behavior from video.
2.1. Bee Counters and Forager Traffic Analysis
Bee counting has previously been addressed with the help of optical counters, RFID techology, and Machine Vision Counters. Refer to Meikle and Holst (2016) for a detailed review of existing approaches.
Optical counters consist of small tunnels that force the bees to pass through them one by one where they cross an optical beam that triggers a detection. The only crossing is detected, which limits the information to aggregated counting. Multiple commercial products exist for this task, such as Hive Mind Strength monitor, Arnia Remote Hive Monitoring, or Lowland Electronics's BeeSCAN and ApiSCAN-Plus, as well as open-source projects such as https://github.com/hydronics2/2019-easy-bee-counter.
Radio Frequency Identification (RFID) counters (de Souza et al., 2018) solve the identification problem by using individual lightweight radio frequency tags that are placed on the torso of the bees. Radio frequency detectors detect the entrance or exit of each tag that is associated with a unique ID. Due to the limited range of detection, bees are typically guided into tunnels. Detection is limited to tagged bees and requires the gluing of the tags on each individual to be monitored.
Machine vision based counters have been explored for about a decade now. These counters have a simple setup in terms of data capture (video camera at the entrance) and leave the complexity of the problem to algorithm development. Among the first ones to propose such a system, Campbell et al. (2008) detected bees using background subtraction and modeled the possible motion in subsequent frames to perform tracking. However, as they noted, a more detailed model of the bee orientation is necessary to avoid merging tracks when honey bees interact closely at the entrance. Similar detection and tracking approach was applied to flight trajectories in front of the hive by Magnier et al. (2018). Using stereovision sensors, Chiron et al. (2013) obtained 3D flight trajectories. Recent study explored approximate forager traffic quantization from the detection of motion (Kulyukin and Mukherjee, 2019).
More advanced detectors have incorporated the usage of tags (Chen et al., 2012; Boenisch et al., 2018). These tags contain 2d barcodes that can be detected by computer vision algorithms. Such detection can be used for both the detection of individual entrance/exit and identification. Compared to RFID, such tag design is lower cost and more accessible.
In addition to traffic, payload information provides additional ways to assess the health of the hive, for instance, by having a precise account of the pollen intake (Frias et al., 2016). The study of Babic et al. (2016) used low-resolution images and traditional image processing techniques for detecting pollen. Several convolutional neural network architectures were evaluated by Rodriguez et al. (2018a) on a higher resolution dataset of images of individual honey bees, showing the possibility of accurate automatic pollen detection. This approach was adapted to FPGA by Sledevič (2018) for low-cost real-time implementation. More recently, Marstaller et al. (2019) proposed a CNN architecture that can detect pollen balls on extracted images of individual bees.
2.2. Behavior Quantification From Video
More generally, behavior quantification is an extended field of research that has led to relevant developments for the monitoring of diverse animals from video.
Estimation and tracking of pose (position of the body parts) is a typical first step to classify and characterize actions and behavior. Even though most of the published study has focused on human pose estimation (Cao et al., 2017; Güler et al., 2018), several contributions have targeted animal behavior more specifically (Mathis et al., 2018; Nath et al., 2019).
Reliable long-term tracking is fundamental for the study of behavior. For tracking, Cascaded Pose Regression (Dollár et al., 2010) was applied to track individuals such as Drosophila, mice, and fish (Kabra et al., 2012). This method relied on an initial estimate to be refined progressively using a sequence of regressors. This type of approach is better suited for tracking in setups where individuals are always visible and captured at a high frame rate, as it requires an initialization when a new individual appears in the field of view.
Pose estimation built on top of deep network architectures was demonstrated to detect body part keypoints reliably in various animals (Mathis et al., 2018; Nath et al., 2019; Pereira et al., 2019). These methods however have so far focused on the tracking of a single animal. A recent exception was the detection and pose estimation of the honey bee body inside of the hive using a modified U-net architecture (Bozek et al., 2018). This approach estimated orientation and used a recursive formulation to guide detection in subsequent frames. As most bees were visible for extended periods of time, visual identity models were trained to solve reidentification when tracks crossed each other or an individual became occluded for a short amount of time.
Detailed pose estimation for multiple bees at the entrance of the hive was first shown in Rodriguez et al. (2018b). This last approach will be evaluated in detail and integrated into a complete system in this study.
3. Materials and Methods
In this study, a complete system for foraging characterization of honey bee hives using recordings from the video is proposed. The system consists of the following modules: (1) data collection: recordings of video using camera capture at the colony entrance, (2) detection and tracking of honey bee individuals, (3) activity classification to decide if the bee is leaving, entering, or walking, and recognize the presence of a pollen payload, (4) identification of marked bees, (5) activity analysis through actograms summarizing extended periods of time. The general architecture is shown in Figure 1. The developed software is open-source and made available to the community as detailed in the Data Availability Statement section.
Figure 1
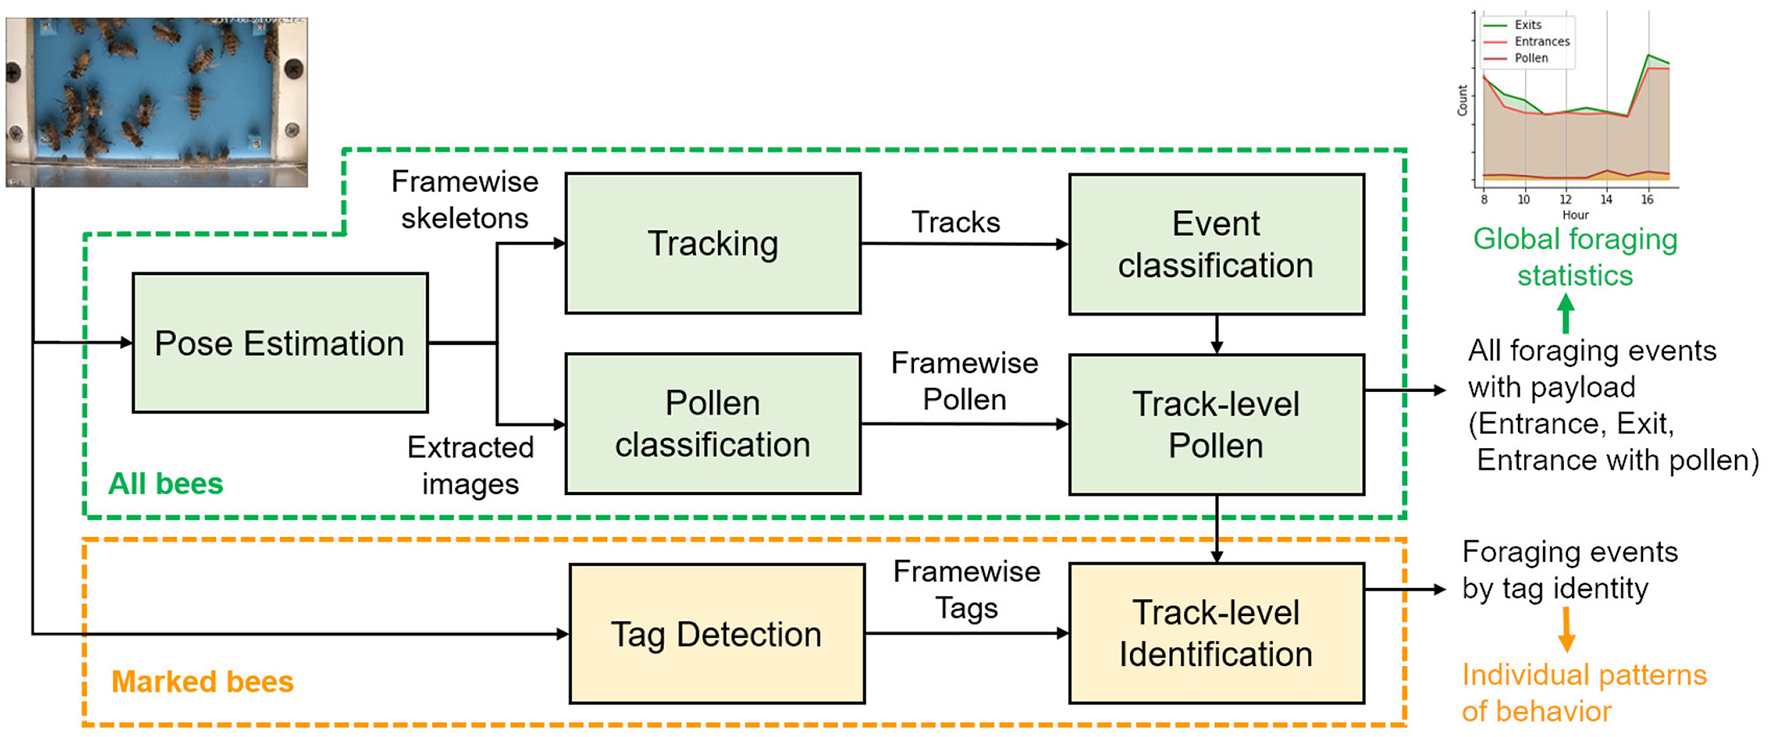
Overview of the video analysis modules. In green, the base system can be applied uniformly to both unmarked and marked bees to detect all foraging events and produce aggregated statistics including global information of pollen intake. In orange, the identification module extends the base system to associate events to tagged bees to produce actograms for detailed analysis of behavior at the individual level.
3.1. Data Collection
The video capture system is designed to observe the ramp through which all foraging bees must pass to exit or enter the colony. Figure 2 shows the system used in this study. We used a 4 Mpixels GESS IP camera connected to a video recorder configured to record continuous H264 video at 8Mbps. A transparent acrylic plastic cover located on top of the ramp forces the bees to remain in the focal plane of the camera. To avoid interfering with the bee biological cycles, only natural light is used. A white plastic diffuses the natural light received, and a black mask is put around the camera to reduce the direct reflections that could be visible on the plastic cover.
Figure 2
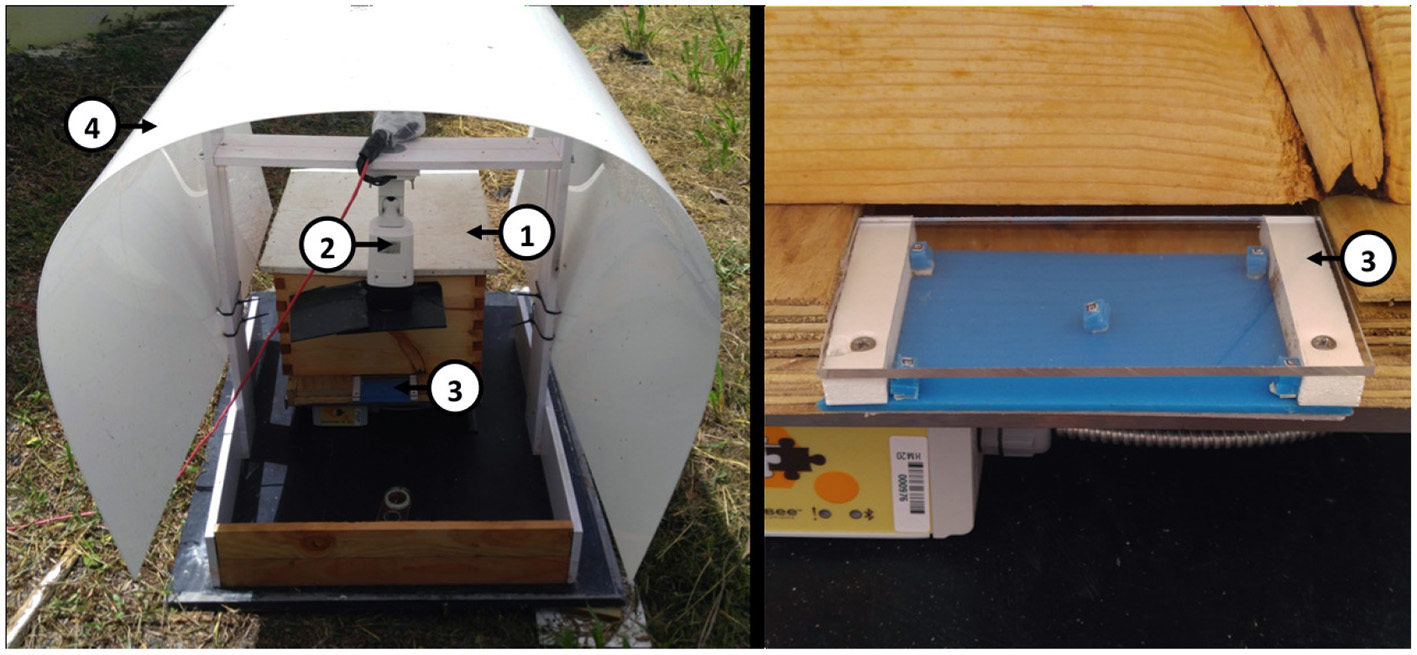
Video capture system used in the field: (left) overview of the system installed at the entrance of the colony and (right) detail on the entrance. (1) Bee-hive, (2) camera, (3) entrance ramp, and (4) protection against direct sunlight.
The majority of videos used in this study were acquired from June 25 to June 30, 2017 at the UPR Agricultural Experimental Station of Gurabo, Puerto Rico, from 8 a.m.–6 p.m. to take into account different lighting setups. Each video is 1 h long.
3.2. Pose Estimation
Body pose is defined as a skeleton model combining a set of body parts with their connections. For honey bees, we considered five parts including Abdomen, Thorax, Head, AntL (left antenna), and AntR (right antenna), as shown in Figure 3. In the evaluation section, we will show an ablation study using simplified models with 3 parts (abdomen, thorax and head), 2 parts (abdomen and head), and 1 part (either thorax, or head). In terms of connections, the 5 parts model considers 5 connections: Head-Abdomen, Thorax-Abdomen, Head-Thorax, Head-AntL, Head-AntR. The simplified models consider the subset of connections that connect the considered parts.
Figure 3
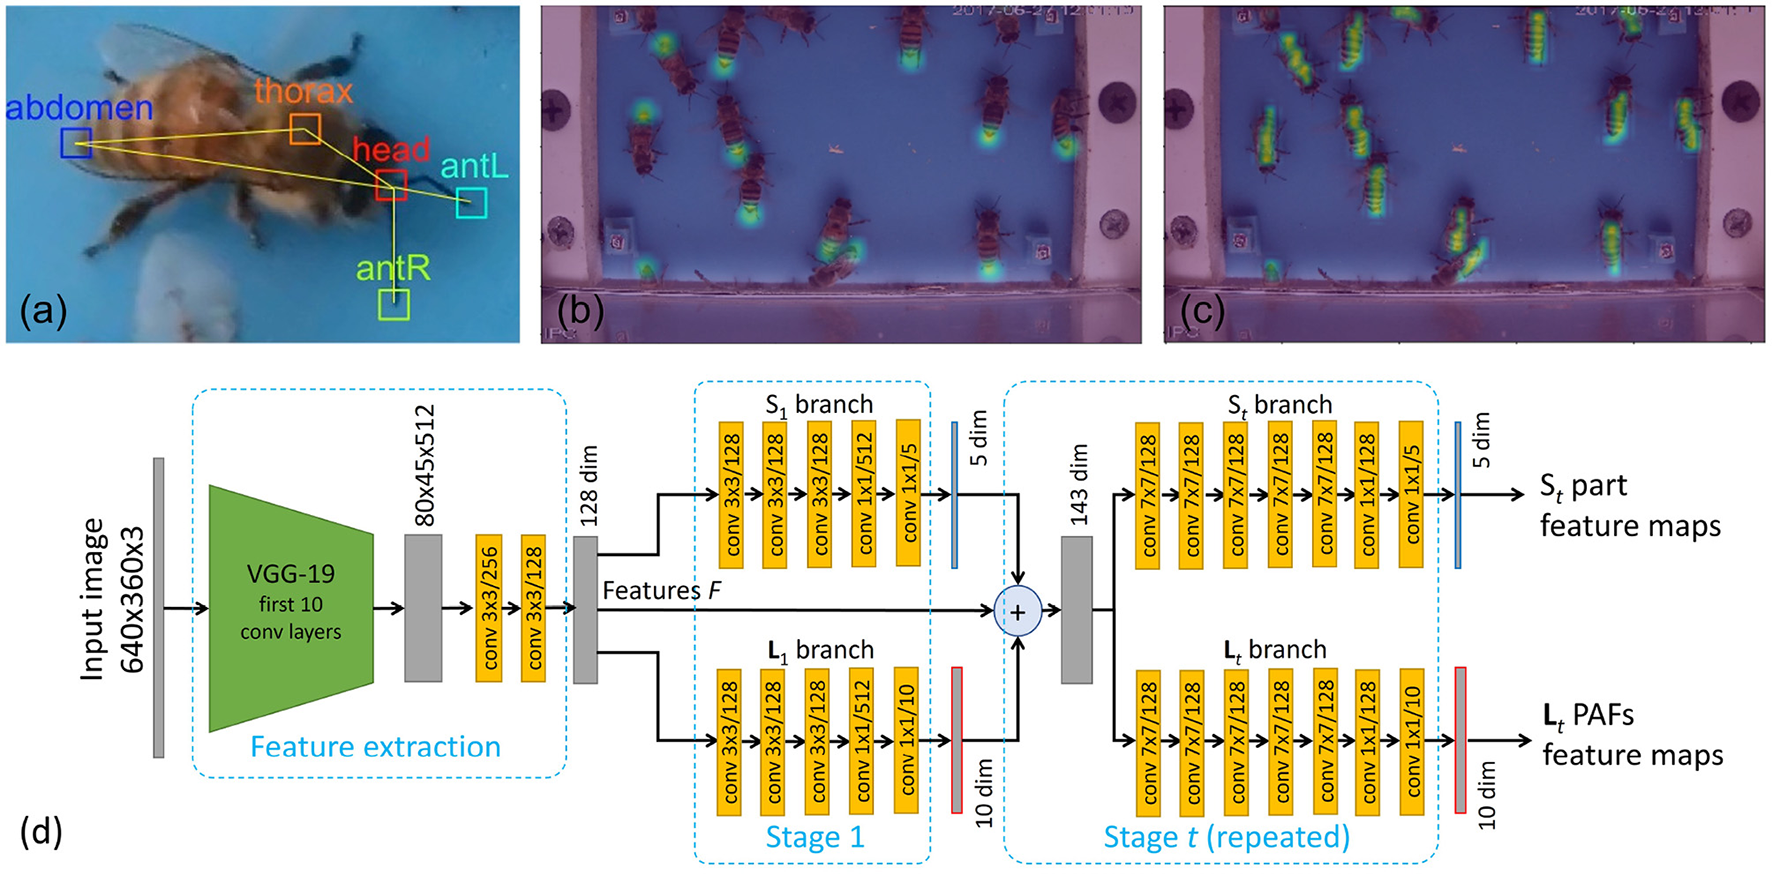
Pose detection model. (a) 5 parts skeleton (Head, Thorax, Abdomen, Left and Right Antenna) and connection used. (b) Confidence map of the abdomen keypoints used to train the (S) branch. (c) The magnitude of the Part Affinity Field (PAF) of the thorax-abdomen connection used to train the (L) branch. (d) Convolutional Neural Network architecture used to predict the body part confidence maps and PAFs organized as a feature extraction backbone followed by the two branches (S) and (L) with iterative refinement stages.
We use a tracking-by-detection approach, where the individuals are first detected in each frame independently and then tracked through time to produce a pose trajectory, which provides for each individual bee the evolution over time of the position of their body part.
3.2.1. Architecture of the Pose Detector
The pose estimation module in each frame follows the Part Affinity Fields (PAF) approach proposed by Cao et al. (2017), with modifications to take into account the specificity of the colony entrance videos. The convolutional neural network is composed of a feature extraction backbone (F) and two pose detection branches (S,L). Refer to Figure 3d for the architecture of the network used in this study.
Let us denote F as the feature map produced by the feature extraction backbone. Following Cao et al. (2017), we used the 10 first convolutional layers of VGG-19 (Simonyan and Zisserman, 2014), pre-trained on ImageNet. The next two layers (conv4_3 and conv4_4) were modified to reduce the dimension from 512 down to 128 while keeping the same 1/8 resolution.
The keypoints branch (S) estimates a set of 2D confidence maps where each pixel belongs to a particular body part keypoint. Each confidence map is used to detect keypoints related to a single type of body part (e.g., head) for all individuals at once. The PAF branch (L) produces Part-Affinity Field vector maps that are used to connect body parts of different types. Each PAF is used to connect a single type of connection (e.g., head-thorax). The output of both branches is used as input of an inference algorithm outside of the network that estimates both the keypoints and their connections, to produce a set of individual body skeletons.
Let us now denote S = (S1, …, Sj, …, SJ) the set of J heatmaps, one per body part, and L = (L1, …, Lc, …, LC) the C vector fields or PAFs, one per connection, considered for the configuration of the pose for each individual. The prediction of S and L is done with multiple stages of refinements producing multiple estimates St and Lt.
After a first stage t = 1 that takes as input the features F, subsequent stages t> 1 refine previous estimates St−1 and Lt−1 iteratively.
3.2.2. Training
Based on the annotated keypoints, the reference confidence map is generated as the combination of a set of gaussian kernels centered on the x, y position of each annotated part of type j. Each channel of the (S) branch will be used for a different part. The reference PAF vector fields are generated by the interpolation between two of the keypoints that belong to a joint. Channels of the (L) branch are organized in pairs of consecutive channels associated with a single connection. The reference skeleton model, confidence maps, and PAF fields are illustrated in Figures 3a–c.
The loss functions at stage t for confidence map j and PAF c are defined as the weighted mean squared errors and , where and correspond to synthetic confidence maps and PAFs generated from the reference keypoints. W(p) is a binary mask defined as 0 for all pixels that do not belong to the bounding box surrounding the keypoints of any annotated bee. The overall loss function is defined as the sum of the losses for all stages during training. Only the output of the last stage is used for inference.
To improve the generalization of the network, we performed data augmentation in the form of random geometrical transformations combining rotation, translation, reflection, and scaling applied to both the input image and associated reference keypoints. In order to maximize the usage of the training dataset, all generated images were centered on an individual, although the size was designed to also include significant contexts, such as other individuals and backgrounds.
3.2.3. Inference Stage
Once the set of confidence maps and PAFs are computed, the greedy inference is performed to (i) detect the body-part keypoints and (ii) group keypoints into skeletons illustrated in Figure 4.
Figure 4
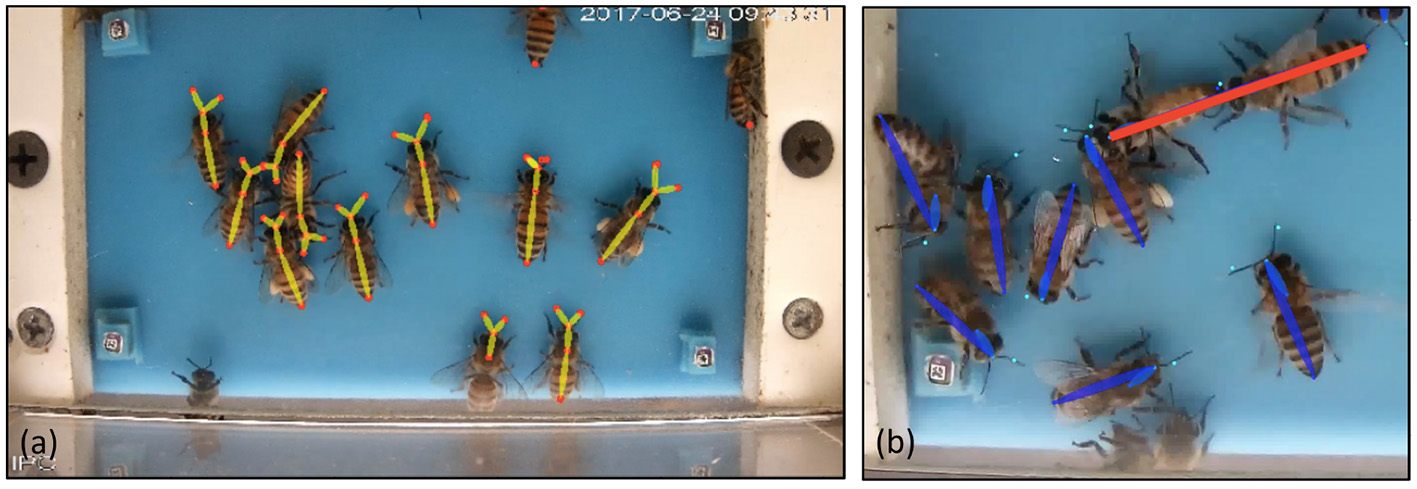
Examples of bee skeletons reconstructed in the inference stage. (a) Because of the bottom-up greedy association, a partial skeleton can be generated even when some keypoints are not visible or detected. The use of our modified PAF score also enables the correct associations in crowded areas by constraining both orientation and length of the connections. (b) Example of incorrect association (in red) between head and abdomen obtained if factor πj1j2 is ignored when two bodies are aligned.
Keypoints are detected by extracting the local maxima from the (S) confidence maps and applying non-maximum suppression with a fixed radius to remove duplicates. The detection threshold is fixed and only parts with a score higher than 0.5 are accepted as a hypothesis.
Grouping uses the PAF from the (L) branch to select the most likely connections by calculating the association score explained later in Equation (6). All the association candidates (j1, j2) with valid part types are sorted in descending score Ej1j2 to perform greedy bottom-up association. If a new association conflict with existing connections with either j1 or j2, it is discarded, else it is added to the connections. The final skeletons are obtained by extracting the connected components of all selected connections.
Given that the honey bees at the entrance may have completely arbitrary orientations, it is common for two or more individuals to be aligned. This is unusual in typical videos with humans, where people do not commonly have connections of the same type (e.g., abdomen-head) aligned with each other. The original approach measured the association between two parts by computing the line integral over the corresponding PAFs or, in other words, by measuring the alignment of the detected body parts. We used the distribution of the distance between points to constrain the connections based on the scale of the honey bees' bodies. The new PAF score associated with the body parts j1 and j2 is expressed as:
where the point p(u) = (1 − u)dj1 + udj2 moves along the linear segment between the two body parts for u ∈ [0, 1]. The probability πj1j2 is defined as the empirical probability that j1 connects with j2 conditioned on their distance ‖dj2 − dj1‖. It follows a gaussian distribution specific to each type of connection, fitted on the training dataset.
The π factor is important in scenarios where PAFs can be aligned since all individuals share the same PAF channels in the network. This particular assumption works well for honey bees, as their body is usually quite rigid, so the variance of the connection length is small. Figure 4b shows an example of alignment that leads to the incorrect association if this factor is omitted.
3.3. Tracking
Once the detections on each frame have been obtained, they are matched temporally on a frame-by-frame basis using the Hungarian algorithm (Kuhn, 1955).
The cost used for the Hungarian assignment algorithm is determined by the distance between detected keypoints in a frame and the predicted positions from the past. We take into account not only point to point distance for the thorax but also antennae and head. Formally, the distance between two bees in consecutive frames is measured in the following way.
where bk,i refers to the set of keypoints for detected bee i in frame k and dk,i,j indicates the keypoint of part j for that bee, and J is the number of body parts considered. Finally, the cost δ(d, d′) between two keypoints:
where δ0 is a fixed misdetection penalty (δ0 = 200 pixels in our experiments) that is close to the typical distance between two bees located along with each other.
Once the assignment is done by the Hungarian method, an unassigned track will be considered a disappeared track and an unassigned detection in frame i + 1 will start a new track.
From that point on, detected bees can be associated with a trajectory index trackId instead of independent indices in each frame. We will denote by the trajectory with trackId i, starting at frame k, and ending at frame k′. Each element Tk,i is associated with a detection dk,i, as well as optional frame levels information such as the presence of pollen or tag.
3.4. Foraging Events Detection and Labeling
3.4.1. Entrance/Exit Detection
We perform the detection of entrance and exit events using the starting and ending points of the tracks using the classification policy illustrated in Figure 5.
Figure 5
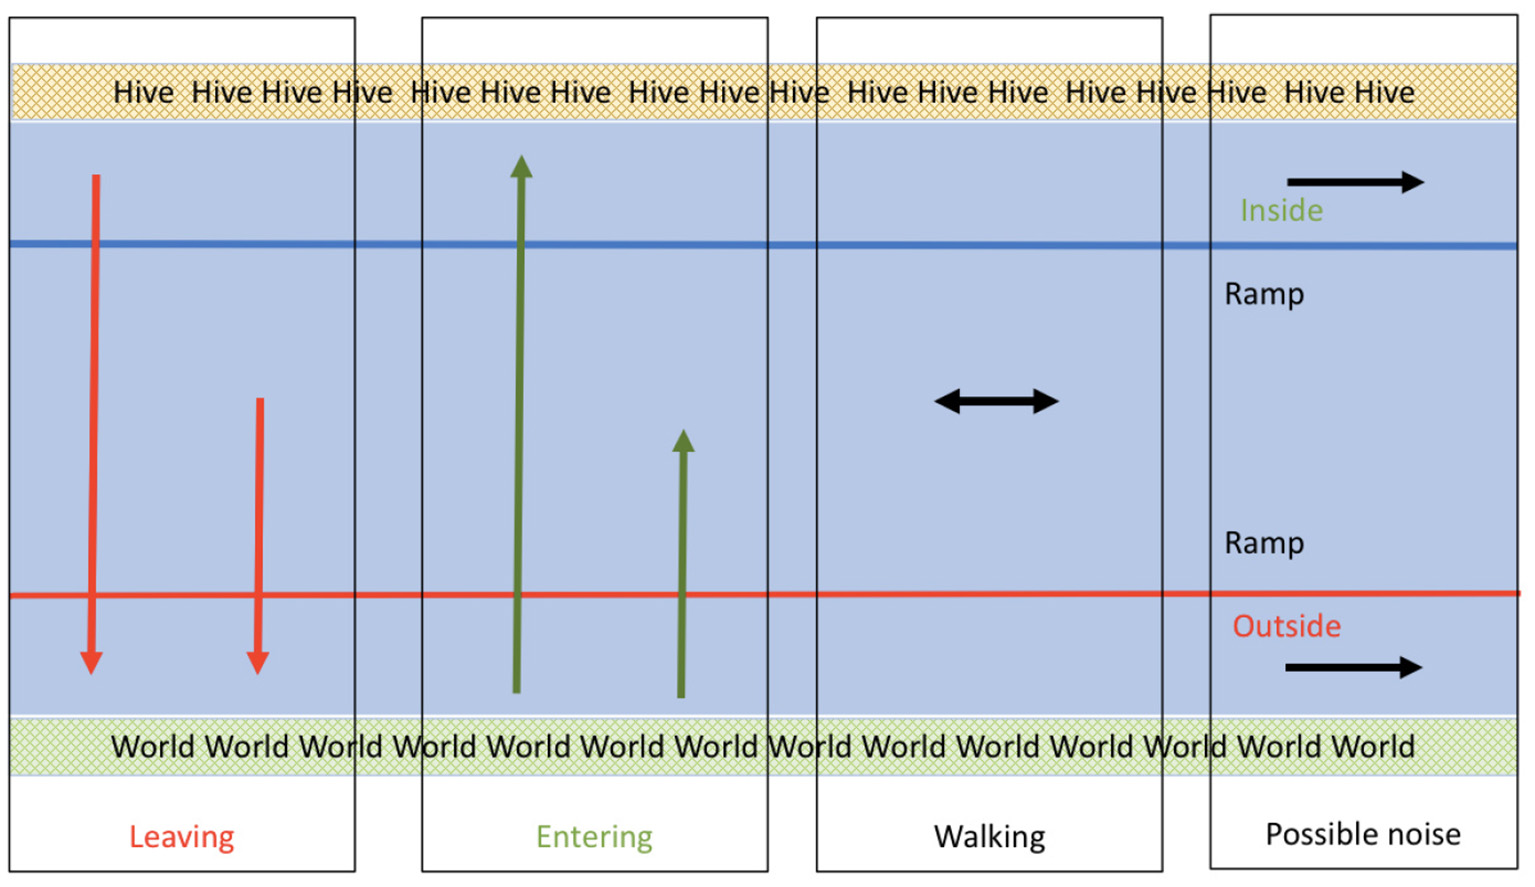
Event classification policy based on trajectory endpoints. The entrance to the hive is at the top and the outside world is at the bottom. Red arrows represent exit events (leaving): these trajectories start inside the ramp and end below the threshold represented by the red line. Green lines represent entrances: these trajectories start at the bottom and end inside the ramp. Black lines represent ignored trajectories that are the result of tracking interruptions or of bees that dwell in a single area but never enter nor exit.
First, tracks shorter than 5 frames are discarded. The leaving and entering behavior is defined by crossing the red line (as shown in Figure 5). The direction of the track would determine if it is leaving or entering. Tracks that both start and end in the middle are considered walking bees. The other two classes of tracks are those that start and end in the bottom (outside) or top (inside). These tracks are among those bees that dwell in the border and enter and exit the field of view of the camera without actually crossing or entering the center of the ramp. Although these tracks could be used in the future to assess the level of crowding of the ramp, they are ignored in this study to focus on the entrance and exits.
3.4.2. Pollen Classification at Frame and Track Levels
Once the pose estimation is performed, the location of the keypoints of the head and the tip of the abdomen are used to precisely crop the image of each individual bee with optional orientation compensation, as shown in Figure 6. The image obtained is then passed to a shallow network with two layers that have previously shown high accuracy in pollen detection classification (Rodriguez et al., 2018a) to predict the decisions for each detection in each frame.
Figure 6
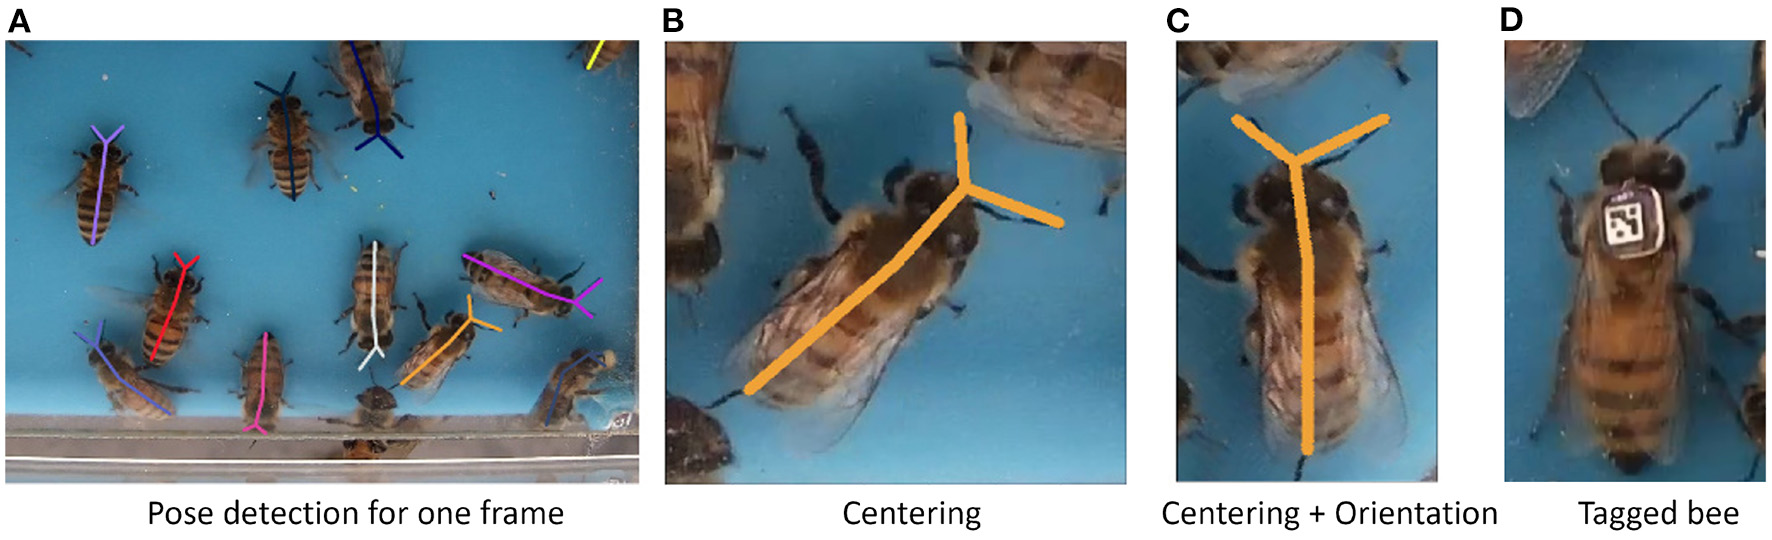
Detail of individual bees. (A) Typical frame with a detected pose. (B) Cropped image with thorax centering. (C) Cropped image with thorax centering and orientation compensation using the head and abdomen axis. (D) Example of bee tagged with a 5 × 5 apriltag barcode of the tag25h5 family.
Track-level pollen classification is performed by aggregating the framewise pollen classification using a majority vote.
3.5. Bee Identification Using Tags
Once all bees have been detected and tracked, the individual identity information can be added to the tracks for those bees that have been marked with a tag.
The tag detection is performed with the help of the open source project April Tags (Wang and Olson, 2016). We have generated the tag25h5 family, which consists of 5 x 5 binary codes with a minimum Hamming distance of 5 between codes, and that code for 3009 unique tags. The tags are printed on waterproof paper using a 1,200 dpi laser printer, cut automatically using a laser cutter, and placed on the torso of the honey bees. The code used to generate the tag sheets for printing and laser cutting is provided in the generatetagsheet package shared in the Data Availability section.
In contrast to existing systems for individual monitoring (Crall et al., 2015) or (Boenisch et al., 2018) that are based primarily on tag detection, we consider tags as an augmentation of the trajectories obtained from whole body detection, thus tracking marked and unmarked bees with the same process. Given that tags are much smaller than the honey bee themselves, they can be more easily occluded, and their high-resolution barcode is more easily impacted by motion blur. For these reasons, we chose to perform whole bee detection as the main input for tracking, even for marked bees. Our system, therefore, relies on the assumption that the framerate is fast enough to track without ambiguity based on geometric proximity alone (we used 20 frames per second in our experiments). In each frame k, each trajectory element T(k, i) is then potentially associated with a tag ID by finding the detected tag whose center is the closest to the thorax keypoint. In case the distance is larger than a threshold d>0, the track is not assigned any tag for this frame. After association, the most frequent tag ID is selected for each track, thus augmenting each trajectory with individual identity when available.
4. Results
The system has been evaluated with respect to two main aspects: (i) pose detection in individual frames, and (ii) foraging event detection and classification (entrance/exit, presence of pollen).
4.1. Performance of Detection and Pose Estimation
4.1.1. Dataset for Pose Estimation of Honey Bees
As part of the contributions of this study, a honey bee pose dataset is released. This dataset consists of 270 frames, chosen from a pool of 10 videos distributed across several days between June 22, 2016 and June 28, 2016, and different times of the day, using the recording setup described in Section 3.1. Each frame was fully labeled using 5 key-body points (Head, Thorax, Abdomen, AntL, and AntR). The dataset contains a total of 1,452 fully labeled bees. The annotations are stored in COCO format (Lin et al., 2014).
4.1.2. Evaluation Methodology
The evaluation of the algorithm was performed using mean Average Precision (mAP) as provided by the pose evaluation package https://github.com/leonid-pishchulin/poseval based on Insafutdinov et al. (2017). The mAP metric relies on the greedy assignment of the body pose predictions to the ground truth (GT) based on the highest PCKh. PCKh-0.5 is the standard metric used for human pose estimation where a keypoint is correctly detected if its residual distance to the ground truth is less than half of the head size (Andriluka et al., 2014). As an equivalent for honey bee pose estimation, we considered that a key-point is correctly detected if its residual is less than half of the distance between thorax and head. We defined a fixed threshold for all the individual detections of 0.5, thus making sure that only high confidence keypoint hypotheses were passed to the inference stage.
The dataset was split into training and validation datasets as follows: 70% of the data was used for training and the remaining 30% for validation. The frames used for validation were extracted from videos captured on a different day and at different times of the day than the training to ensure as much independence as possible between the datasets.
The VGG19 feature extraction backbone was frozen with weights pre-trained on ImageNet. The training was performed on the S and L branches using the Adam optimizer with a learning rate of 1e−4.
Figure 7 shows an overview of the performance for 1, 2, 3, and 5 parts and 2, 3, 4, 5, and 6 stages models. We trained the model for 20,000 epochs, and show the mAP averaged between 19,000 and 20,000 epochs.
Figure 7
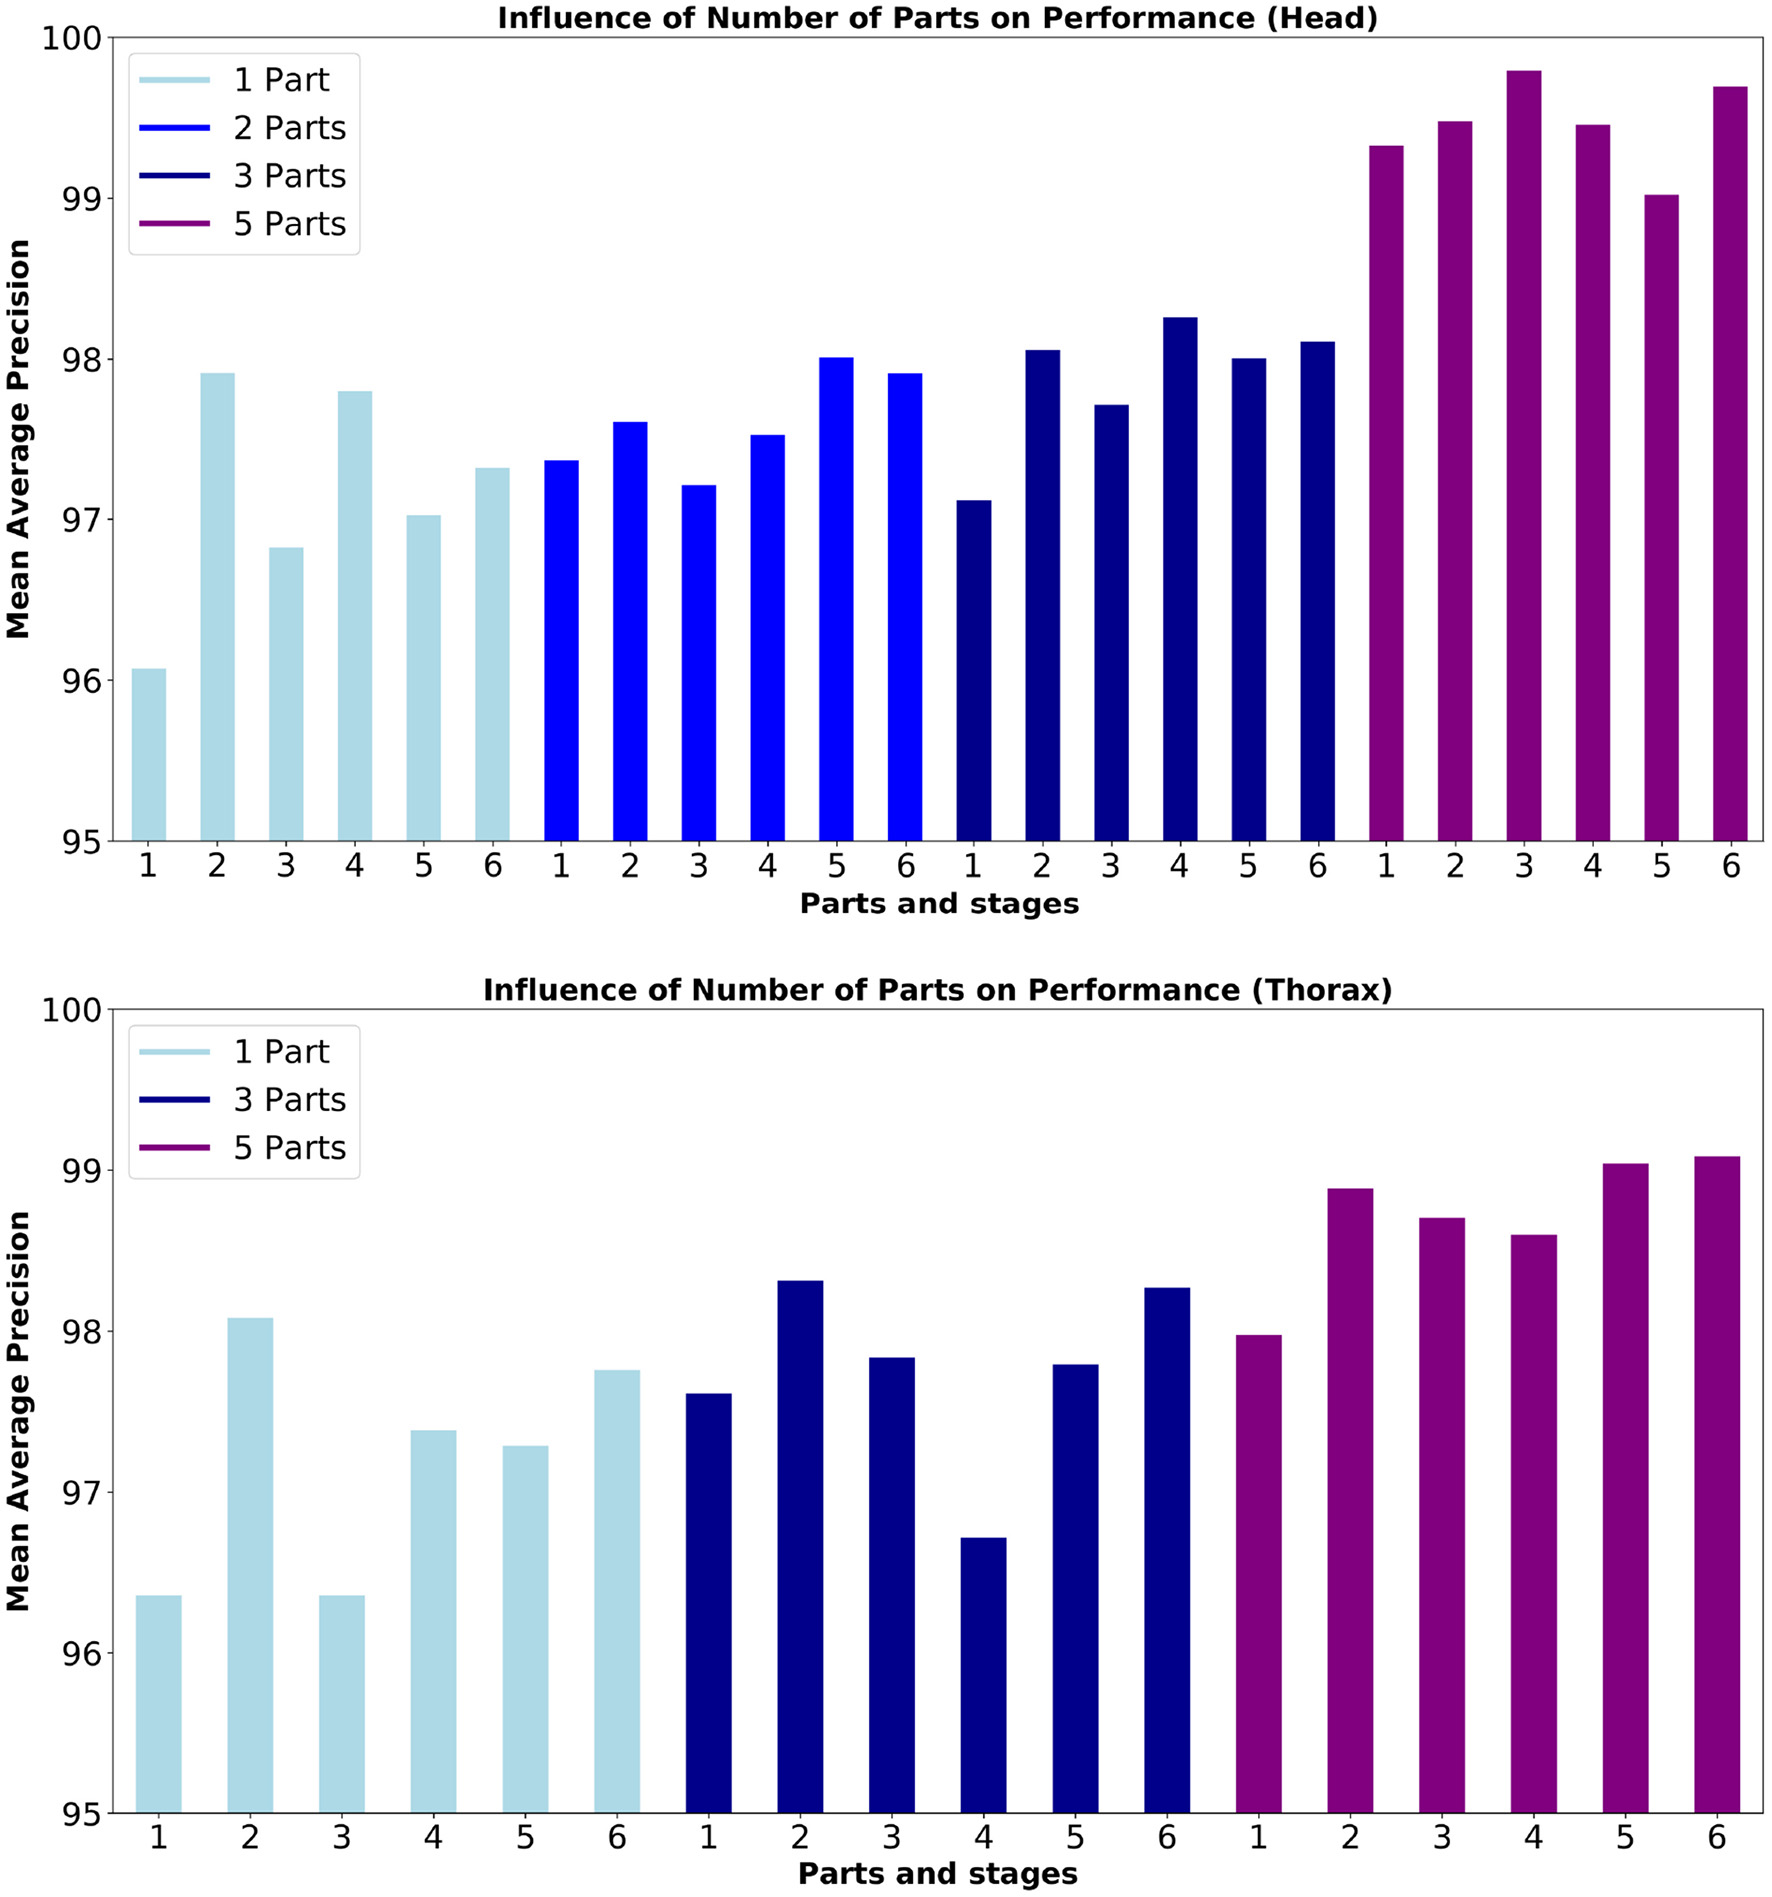
Mean Average Precision (mAP) for the detection of (top) head and (bottom) thorax. The box plot shows performance mean 19,000 epochs of training. From left to right, results for Head show training using 1 part (Head), 2 parts (Head, Abdomen), 3 (Head, Abdomen, Thorax), and 5 parts (3 parts + 2 antennas) results for Thorax show training using 1 part (Thorax), 3 parts (Head, Abdomen, Thorax), and 5 parts (3 parts + 2 antennas). Description of the mAP can be found in Section 4.2.
These results are analyzed in the next subsections.
4.1.3. Effect of the Number of Parts
Figure 7 and Table 1 show that in terms of detection mAP, higher scores are obtained with the 5 parts model than the models with fewer parts. We hypothesize that the higher number of parts may help the network interpolate poorly detected parts by using features learned for the detection of its connected parts. This is supported by the fact that the head part benefits more from the addition of the antennas, to which it is connected in the 5 parts model, compared to the thorax, which is not connected to the antennas in any model.
Table 1
| Yolo(%) | 1 part*(%) | 2 parts(%) | 3 parts(%) | 5 parts(%) | |
|---|---|---|---|---|---|
| Head | – | 96.3 | 98.7 | 96.4 | 99.1 |
| Tip abdomen | – | – | 94.0 | 96.2 | 95.0 |
| Thorax | 79.8 | 97.6 | – | 95.0 | 98.7 |
| Right antenna | – | – | – | – | 94.4 |
| Left antenna | – | – | – | – | 90.4 |
Summary of the best mAP when training on skeletons composed of 1, 2, 3, and 5 parts and YOLO-v3 on Thorax.
Two different models were used for 1 part: one model with the head only, another for thorax only.
We also compared our approach with the popular YoloV3 object detector (Redmon and Farhadi, 2018), trained to detect a bounding box around the thorax. Such a detector could be used in a two-step approach where each individual is first detected approximately, before applying a more precise body parts model on each individual separately. This top-down 2-steps approach is necessary to apply the body parts models designed for one individual such as Mathis et al. (2018), Marstaller et al. (2019), and Pereira et al. (2019). The bounding boxes used for training were centered on the thorax ground-truth with a fixed size of 150 × 100 pixels. The detector was trained until early stopping with standard parameters of 9 anchor boxes, 13 x 13 grid size, and pre-trained weights from Darknet-53. The model used a standard threshold of 0.5 to discard overlapping anchor boxes. For testing, the center of the bounding box was used as the estimate of the thorax location for comparison with keypoint detection. For these comparisons, we used the implementation by Zihao Zhang from https://github.com/zzh8829/yolov3-tf2. In our experiments, Yolo only reaches 79.8 mAP, compared to 97.6 when we train our approach for the detection of only the thorax part. Based on these results, we did not consider approaches based on anchor boxes further for the proposed monitoring system, relying instead on the more precise heatmap based keypoint detection.
4.1.4. Effect of the Refinement Stages
The refinement stages proposed in Cao et al. (2017) are designed to increase the accuracy of pose estimation. A rationale is that due to the difficulty of the task, and the diversity of conditions, scale, background, part detection, and affinity fields may not be estimated properly and/or in a consistent way in the first stage. Recursively refining the part detection and affinity fields was shown to improve the performance in human pose estimation. We now explore the effect of the refinement stages for honey bee detection.
The results from Figure 7 show no clear trend of the performance in terms of the number of stages. This is confirmed in Table 2 where mAP performance for all keypoints is shown in the case of the 5 parts model. In our case, the videos have a single background and all the animals preserve their scale with respect to the camera, which could help in obtaining good performance without the need for extra refinement stages. The two best performing number of stages are 2 and 6, with a small decrease of performance for the intermediate number of stages. Since each additional stage adds 9 extra layers, we, therefore, decided to limit the model to 2 stages in further experiments, which allowed us to allocate more models in parallel inside the GPU and to increase the throughput of the pipeline.
Table 2
| 1 stage AP(%) | 2 stages AP(%) | 3 stages AP(%) | 4 stages AP(%) | 5 stages AP(%) | 6 stages AP(%) | |
|---|---|---|---|---|---|---|
| Head | 97.3 | 98.4 | 96.5 | 97.1 | 96.4 | 98.2 |
| Tip abdomen | 97.6 | 96.1 | 92.6 | 94.6 | 99.0 | 99.1 |
| Thorax | 96.2 | 97.0 | 95.6 | 97.6 | 99.2 | 99.7 |
| Right antenna | 90.3 | 90.7 | 87.6 | 84.4 | 86.1 | 94.4 |
| Left antenna | 86.5 | 87.7 | 88.6 | 85.8 | 88.1 | 90.4 |
Body part detection Performance (mAP) per number of stages.
4.2. Performance of Foraging Events Detection
Foraging events correspond to entrances and exits of honey bees in the ramp with the potential presence of pollen. We evaluated the different aspects of their detection as follows: tracking in Section 4.2.1, entrance/exit detection in Section 4.2.2, and pollen recognition in Section 4.2.3.
4.2.1. Tracking
For the evaluation of tracking, a video segment of 1,200 frames (60 s) was fully annotated manually. During the manual annotation, it was identified the intrinsic difficulty of creating the groundtruth close to the borders of the field of view, where individuals are only partially visible and it is not clear where to stop tracking and how to identity fragmented tracks. For example, a bee partially leaving the field of view may still be visible enough for a human annotator to keep track with a consistent identity but only by using uncertain visual cues. For this reason, all annotations were filtered to keep only detections and track fragments located in the interval y ∈ [200, 1, 000] pixels, which includes the inside and outside thresholds y = 600 and y = 300. A large portion of the excluded data corresponds to static bees remaining close to the entrance, or bees walking near the edge, which are not relevant for entrance/exit detection. The corresponding dataset contains 6,687 detections assigned to 79 tracks.
The tracking algorithm was configured with a maximum matching range of 200 pixels. The evaluation was performed using the package from https://github.com/cheind/py-motmetrics for multiple object tracker metrics. All ground-truth tracks were mostly tracked (tracked for more than 80% of the track length). At the detection level, it was identified 0 false positives and 20 misdetections out of 6,687, which generated 10 track fragmentations. A total of 12 identity switches were found, mostly due to this fragmentation.
In the future, we plan to use visual identity models (Romero-Ferrero et al., 2018) integrated into more complex predictive tracking algorithms to reduce such fragmentation and help with the re-identification of individuals that exit the field of view for a short time.
4.2.2. Entrances and Exits
We used data captured on June 27, 2017 (10 h of video from 8 a.m.–6 p.m.) to evaluate entrance and exit detection performance. Manual annotation was performed on tagged bees to label each tagged bee track as entering or leaving, ignoring walking bees. This approach was used to facilitate human annotation, as the tag could be used by the annotators to make sure they inspected the behavior of each individual for the complete interval in which they were in the field of view without relying on the tracking algorithm itself.
The automatically detected body pose tracks (which does not rely on the presence of a tag) were augmented with the information from the manual annotations. The automatic entrance/exit event classification of these tracks was compared to the corresponding manual annotation. Automatic detection could also produce Noise, which would be a track that does not cross the entrance virtual line.
The confusion matrix in Table 3 shows that overall entrances perform better than exits. There is a low number of Noise for entrances too, which seems to be related to the fact that bees returning to the colony do not typically stay on the ramp, and enter the colony immediately. For exits, there is a much higher number of Noise trajectories. Unlike bees that are entering, exiting bees can spend more time on the ramp, which makes them vulnerable to track interruption due to misdetection on any of these frames. These interruptions would warrant an improvement of the tracking algorithm to reduce interruptions and with additional re-identification of lost tracks in the future.
Table 3
| GT\DT | Entrance | Exit | Noise | Total |
|---|---|---|---|---|
| Entrance | 99 | 3 | 4 | 106 |
| Exits | 3 | 83 | 14 | 102 |
Confusion matrix of entrance and exit detection. Rows represent the manual annotation of each corresponding track (groundtruth).
Each column represents the automatic classification (detection).
4.2.3. Pollen Recognition
We carried out the evaluation of pollen detection at two levels: first, at the image level using a manually annotated image dataset, and second, at the event level using manually labeled entrance events. The image level classifier in both cases follows previous study (Rodriguez et al., 2018a) discussed in the Method section.
4.2.3.1. Evaluation of Pollen Recognition at the Image Level
The image dataset consists of 1,550 annotations of pollen (775) and non-pollen (775) bees from 3 videos, collected at 12 p.m., 1 p.m. and 2 p.m. on the 22, 23, and 24 of June 2017, respectively. Each pollen bearing bee entering was annotated only once, as well as another non-pollen bearing bee in the same frame that served to balance the dataset with a negative sample taken in similar conditions. For training and validation, an 80–20 random split was used. This dataset provides about double the amount of annotation than a previously released dataset (Rodriguez et al., 2018a) and will be shared as well.
We used three different methodologies for extraction of the cropped images of each individual which was fed as input of the pollen classification network. The first approach, Manual centering, consists of the extraction of the images based on the thorax position and creating a box of 450 x 375 pixels around it. The second one, Manual centering and orientation, uses the manually annotated position of the head and abdomen to rotate and center the image so that all extracted 300 x 200 pixels images are aligned vertically and centered on the midpoint between head and abdomen. The last approach, Automatic centering and orientation, was the same as the previous one but used the detected head and abdomen parts instead of the manually annotated ones. The groundtruth of pollen labeling was in this case obtained by matching the manual thorax annotation to the closest automatic thorax detection.
In the results shown in Table 4, we observe a 3% increased performance when using orientation compensated images. Coupled with previous results, which showed that the 5-parts model performed better than simpler models of detection, this supports the use of the proposed detection based on a pose model. which both leverages the annotations of different body parts to improve detection and provides direct information to compensate orientation and facilitate the down-stream analysis such as pollen detection. Pose compensation using automatic pose detection obtained slightly better performance than compensation using manually annotated data. Visual inspection revealed that human annotation was more imprecise when annotating such a large amount of frames, while automatic centering produced slightly more consistent alignment.
Table 4
| Cropping method | Precision(%) | Recall(%) | F 1 |
|---|---|---|---|
| Manual centering only | 94.58 | 94.56 | 0.946 |
| Manual centering + orientation | 96.30 | 96.25 | 0.963 |
| Automatic centering + orientation | 97.26 | 97.28 | 0.973 |
Performance of pollen detection at the image level.
4.2.3.2. Evaluation of Pollen Recognition at the Event Level
We used the same three models for image level classification as in the previous subsection (Manual centering, Manual centering and orientation, and Automatic centering and orientation). Track level classification was performed as explained in the Methods section.
The results are summarized in Table 5. The best performance is obtained by using the model with automatic centering and orientation compensation, followed by manual compensation with a 2% difference. The automatic compensation makes sure all the bodies are aligned, thus, facilitating the pollen classification task. Centering only experienced a higher drop in performance, since the classifier has the harder task to learn invariance to orientation during training, which is not needed if orientation is compensated explicitly. This supports the proposed bottom-up approach where orientation is estimated as part of the detection step.
Table 5
| Precision(%) | Recall(%) | F 1 | |
|---|---|---|---|
| Manual centering | 59.7 | 52.0 | 0.555 |
| Manual centering + orientation | 80.1 | 75.0 | 0.776 |
| Automatic centering + orientation | 81.2 | 78.1 | 0.798 |
Performance of the detection of the event “entrance with pollen.”
The 81.2% precision corresponds to a mere 21 false positives, which impact severely the metrics due to the high imbalance in the dataset (100 positives vs. 1,150 negatives). In terms of recall, a visual inspection of the errors showed that imperfect tracking accounts for most of the 22 false negatives presented. Improving tracking robustness is, therefore, an important aspect for future study to be able to improve the accuracy of the estimates.
4.3. Application to Long-Term Monitoring
As a proof-of-concept of the scalability of the approach, the proposed system was adapted for high-performance computing platforms and applied on multiple days of videos.
4.3.1. Computational Complexity Evaluation
Profiling of the code was done on a node at UPR HPCf with the following specifications: Intel Xeon E5-2630 v4 CPU at 2.20GHz and 128MB RAM equipped with 1 NVIDIA Tesla P100 GPU card with 12MB memory. The analysis was performed on a typical video of the dataset with 72,000 frames (resolution 2,560 x 1,440, 20 fps) resized to 1/4 its original size (640 x 360). The offline processing could be performed at a speed equivalent to ˜13.8 fps, with 88% of the time spent in the detection and 10% in pollen classification, tracking, and other processing adding negligible time.
Based on these results, we expect further optimization of the network architecture (such as replacing the VGG backbone with a more recent lightweight backbone) and its numerical implementation should enable real-time processing on GPU accelerated edge devices to enable deployment directly in the field.
4.3.2. Multi-Day Dataset
The dataset is composed of 8 days of daylight videos acquired from 8 a.m.–5 p.m., representing more than 72 h of video. Three types of events were detected: exit, entrance without pollen, and entrance with pollen. Figure 8 shows several examples of such events for a few tagged bees, in relation to the total timeline that shows the individual behavior.
Figure 8
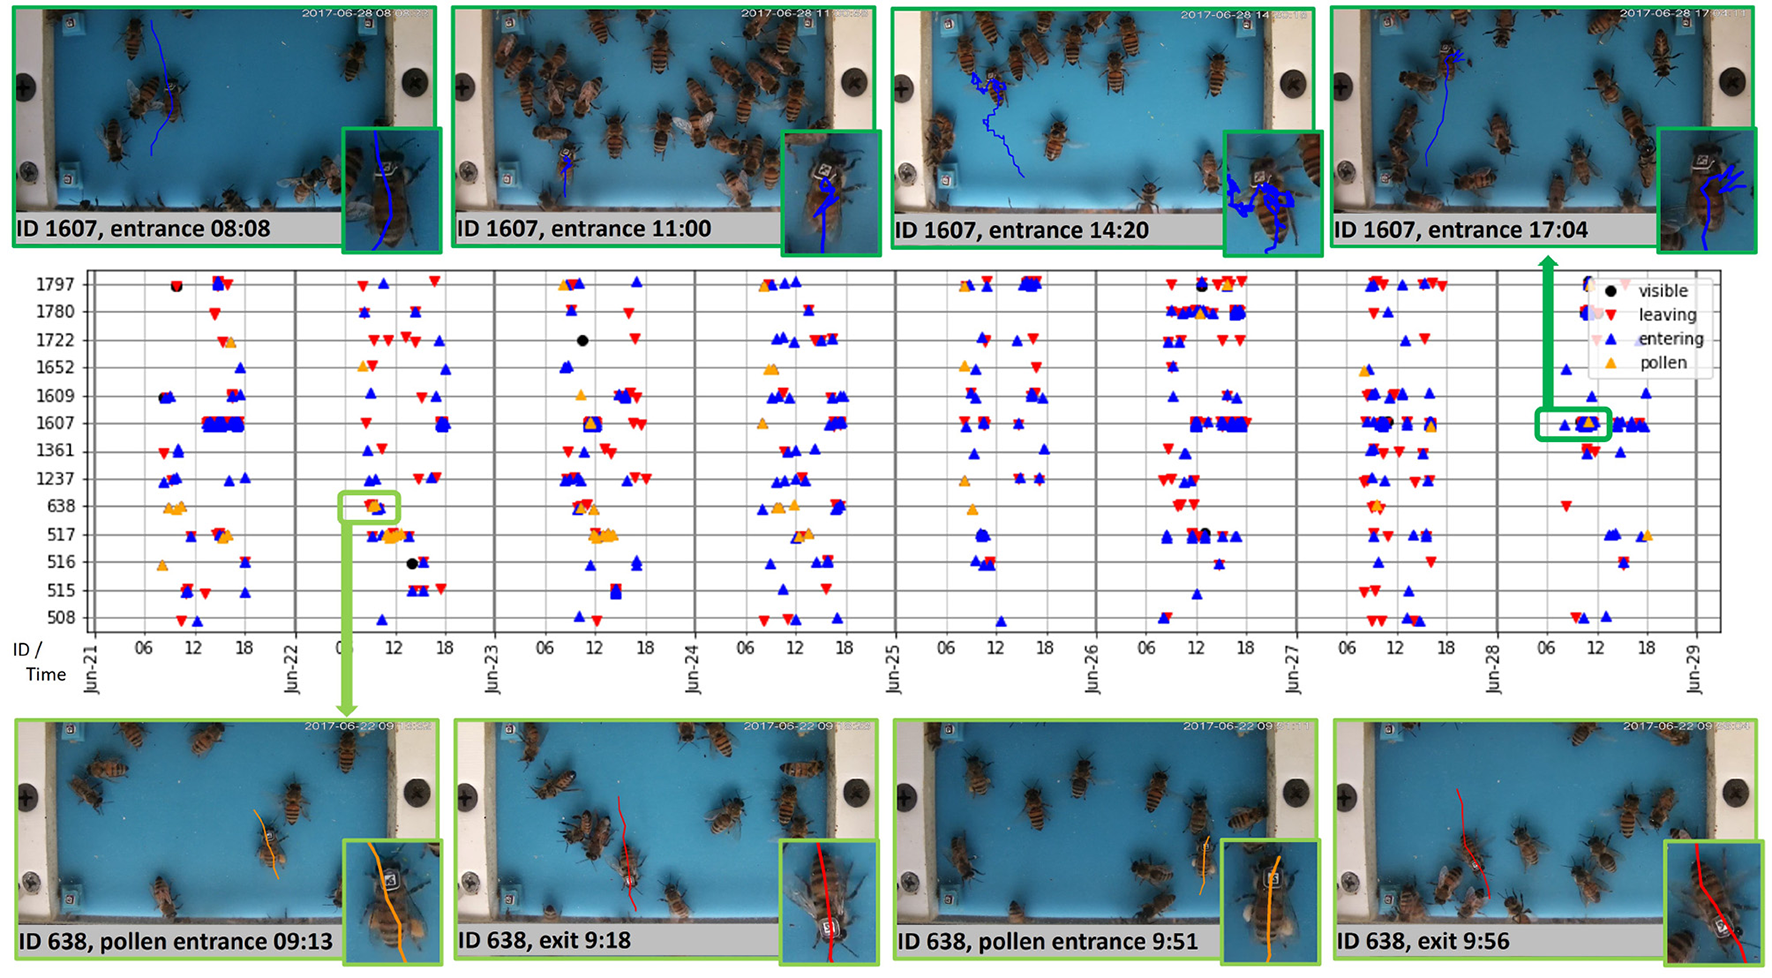
Timeline of foraging events for several tagged bees over the span of 8 days (Middle), with the example of trajectories for bee #1607 (Top) and bee #638 (Bottom). Video analysis was performed from 8:00 to 17:59 each day from June 21 to June 28, 2017. The timeline shows the individual patterns of behavior of each bee over multiple days. The images show a sampling of event types (entrance, entrance with pollen, exit), luminosity conditions (after sunrise, daylight, before sunset), and ramp crowding (8–30 bees). The trajectories shown in these plots are based on the center of the body which may be slightly shifted from the tag position.
In this dataset, we used April Tags (Wang and Olson, 2016) that include error correcting codes. The tags printed from the tag25h5 family (refer to Figure 6D) appeared with a size of around 25 × 25 pixels in the video frames. In these conditions, the identification was relatively unambiguous, as 86% of the tracks had all their associated tags with the same ID, and only 5% of the remaining tracks (0.7% of all tracks) had the majority ID account for less than 90% of the associated tags. In more challenging conditions, the presence of conflicting IDs may be used to monitor identification errors.
Because the system tracked all bees, with or without a tag, the global foraging activity of the colony was also measured. The 3 types of events were counted and aggregated in 1-h intervals to produce the actograms shown in Figure 9. The top panel shows results on the same 8 days as in Figure 8. The bottom panel shows results on three additional days, at different times of the year including pre- and post-hurricane Maria (August 2018 and November 2018, respectively). The automatic detection of foraging patterns aligned with the lower activity at the end of the summer and the scarce sources of food that happened after the flora in the island was impacted by the hurricane. The much higher activity in pollen foraging observed a few weeks later in January 2018 can be explained by the rising food sources availability and the ability of the colony to reproduce, which requires proteins provided by pollen.
Figure 9
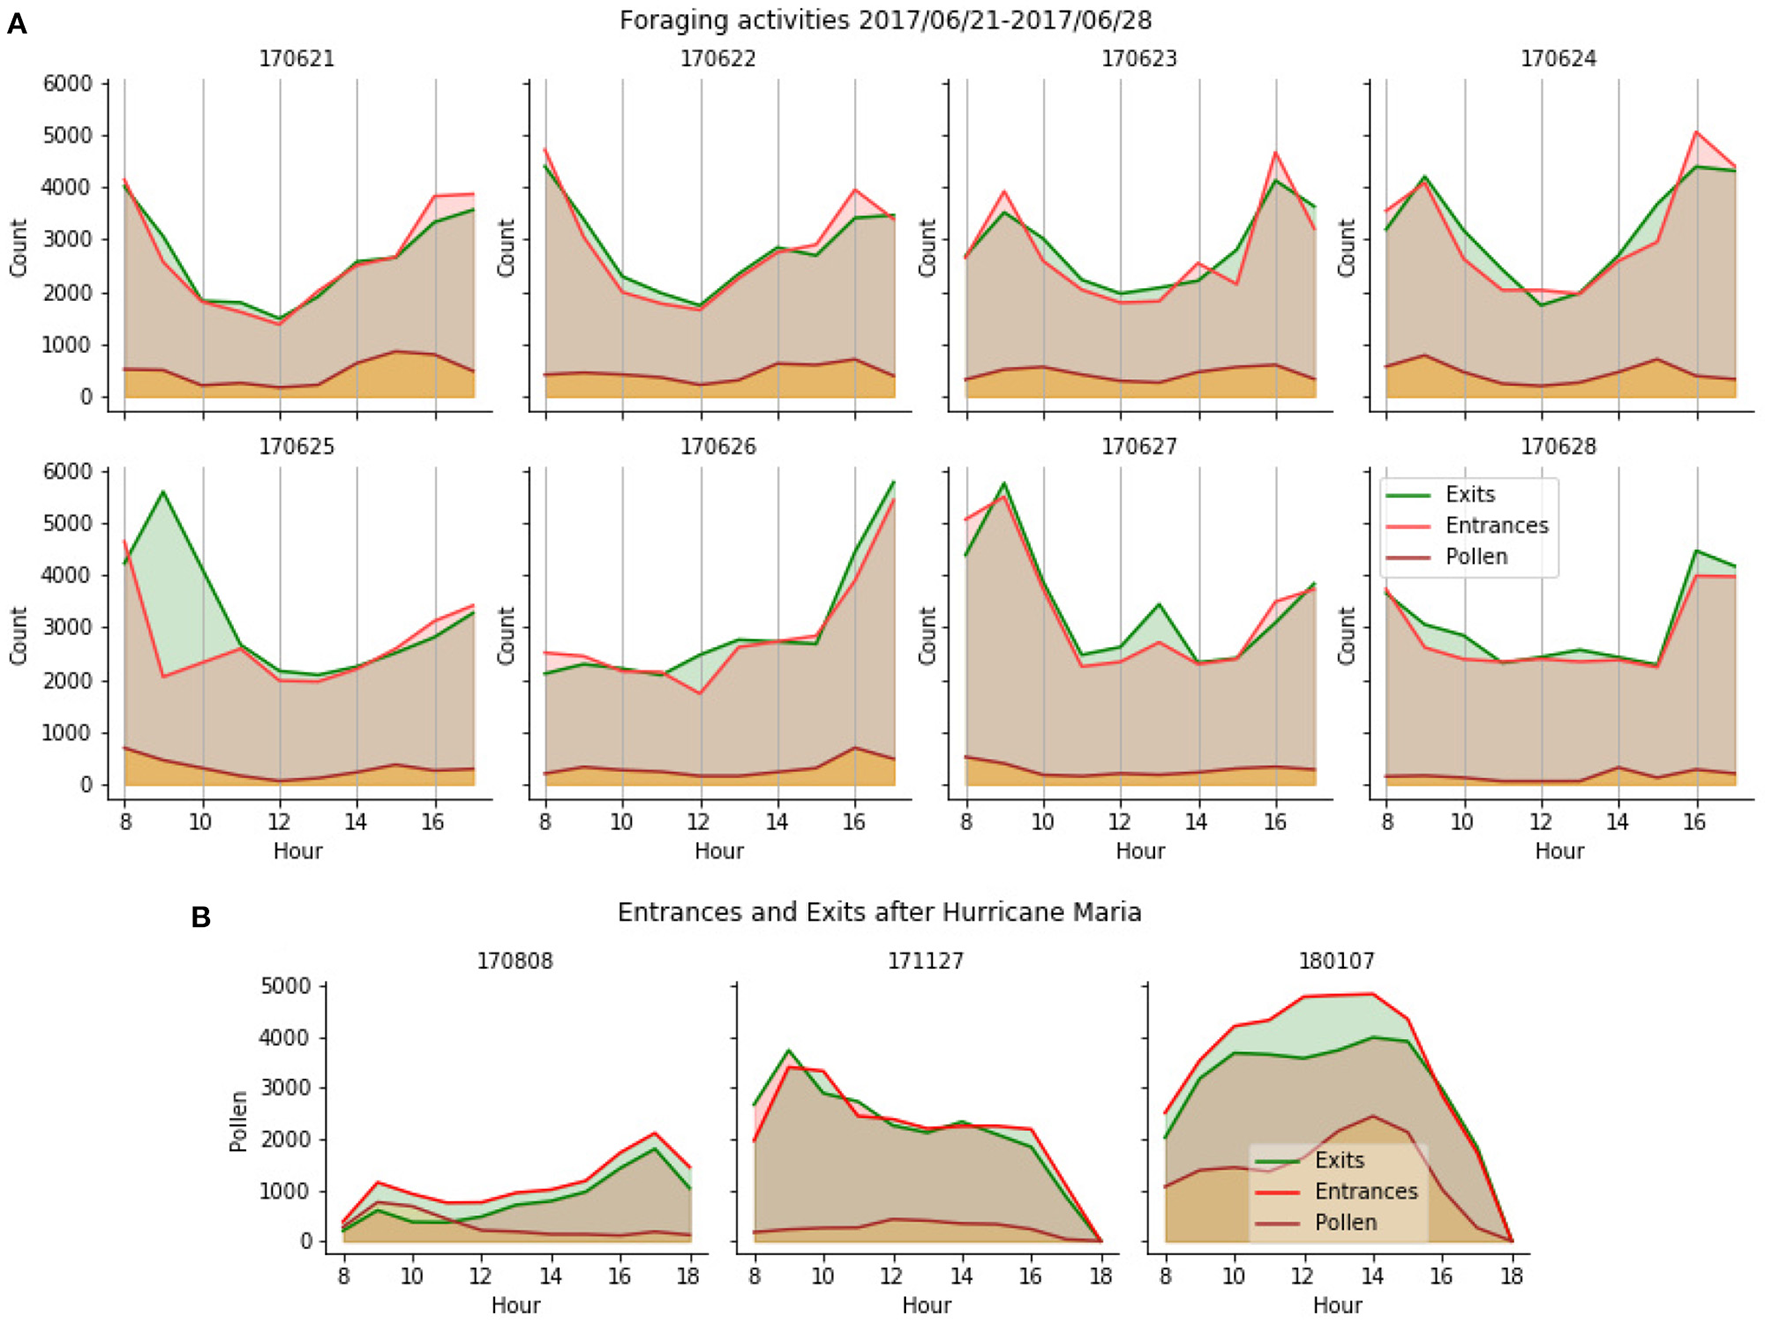
(A) Hourly counts of entrance and exits for 8 consecutive days. Entrances with pollen, overlayed as a separate statistic, appear to not be directly proportional to the total entrances. The peak at 9 a.m. on 2017/06/25 is due to a temporary misalignment of the camera that occurred during maintenance of the colony. (B) Hourly counts before (2017/08/17) and after (2017/11/27, 2018/01/07) hurricane Maria show very diverse foraging patterns (refer to text).
5. Discussion
In this study, we presented a new system for the automatic surveillance of honey bees at the hive entrance using machine learning and computer vision and applied them to implement an end-to-end pipeline that quantifies their foraging behavior.
First, we presented an adaptation of the Part Affinity Fields approach for the detection and tracking of honey bees. Results showed that this tracking-by-detection approach produces high-quality results in presence of multiple individuals and is a promising approach to obtain precise estimates of pose for behavioral studies. We presented an ablation study of this architecture, showing the effect of the number of stages and the number of parts in the quality of the detection.
The precise detection of body parts allowed us to create tracks for all bees, both marked and unmarked while providing the identity of the marked bees when they appeared. This constitutes a multi-resolution view of the activity of the colony as specific behaviors patterns could be assigned to individual marked bees over long periods of time while capturing the global statistics of the behavior of unmarked bees.
We also compared several methods for pollen bearing recognition in honey bees. We concluded that using automatic alignment from the pose estimation and a convolutional neural network for image classification improved the accuracy, supporting the use of a detailed pose model.
These methods were combined to detect and characterize foraging behavior in honey bees. Application to videos capturing multiple days, and covering different times of the day and different parts of the year showed the applicability of the approach for large-scale offline analysis.
This system constitutes the first complete system that accounts for the foraging behavior that includes pollen foraging at global and individual levels. It provides a platform that can be built upon in the future to account for other behaviors such as fanning, paralysis (Bailey, 1965), or the presence of parasites such as varroa-mite (Bjerge et al., 2019). Based on this prototype, we are currently working on the computational and architectural optimization necessary to obtain real-time operation in the field. To scale the approach further, we are also considering extending re-identification beyond tag recognition. This would benefit from the availability of detailed pose information extracted by the system and simplify the logistics of marking a large number of bees to access individual behaviors.
Funding
This material is based upon work supported by the National Science Foundation (NSF) under awards numbers 1707355 and 1633184. JC and MA acknowledge support from the Puerto Rico Louis Stokes Alliance For Minority Participation (PR-LSAMP), a program from the NSF under awards numbers HRD-1906130 and 1400868. TG acknowledges a National Science Foundation (NSF) OISE award (#1545803) and NSF-DEB award (#1826729) that provided for research release after hurricane Maria and NSF-HRD award (#1736019) provided funds for the purchase of bees. IR acknowledges support from HHMI Janelia Research Campus as an invited researcher. This study used the High-Performance Computing facility (HPCf) of the University of Puerto Rico, supported by the National Institute of General Medical Sciences, National Institutes of Health (NIH) award number P20GM103475 and NSF grant nos. EPS-1002410 and EPS-1010094. This study used the Extreme Science and Engineering Discovery Environment (XSEDE), which is supported by NSF grant no. ACI-1548562. Specifically, it used the Bridges and Bridges-2 systems (Towns et al., 2014; Nystrom et al., 2015), which are supported by NSF awards numbers ACI-1445606 and OCI-1928147, at the Pittsburgh Supercomputing Center (PSC).
Publisher's Note
All claims expressed in this article are solely those of the authors and do not necessarily represent those of their affiliated organizations, or those of the publisher, the editors and the reviewers. Any product that may be evaluated in this article, or claim that may be made by its manufacturer, is not guaranteed or endorsed by the publisher.
Statements
Data availability statement
The code and annotated datasets used for this study can be found at https://github.com/piperod/beepose, https://github.com/jachansantiago/plotbee, https://github.com/rmegret/apriltag, and https://github.com/rmegret/generatetagsheet.
Author contributions
IR contributed to the design, implementation, and evaluation of the methods and system. JC contributed to the implementation, scaling, and evaluation of the system. MA contributed to the evaluation of pose estimation. KB contributed to the design of pose estimation. JA-R contributed to the design and coordination of data collection and annotation. TG contributed to the design of data collection. RM contributed to the design and implementation of the system, and coordinated the study. All authors contributed to the article and approved the submitted version.
Conflict of interest
The authors declare that the research was conducted in the absence of any commercial or financial relationships that could be construed as a potential conflict of interest.
References
1
Anderson K. E. Sheehan T. H. Eckholm B. J. Mott B. M. DeGrandi-Hoffman G. (2011). An emerging paradigm of colony health: microbial balance of the honey bee and hive (apis mellifera). Insectes Sociaux 58, 431. 10.1007/s00040-011-0194-6
2
Andriluka M. Pishchulin L. Gehler P. Schiele B. (2014). “2D human pose estimation: New benchmark and state of the art analysis,” in 2014 IEEE Conference on Computer Vision and Pattern Recognition (Columbus, OH: IEEE), 3686–3693.
3
Babic Z. Pilipovic R. Risojevic V. Mirjanic G. (2016). Pollen bearing honey bee detection in hive entrance video recorded by remote embedded system for pollination monitoring. ISPRS Ann. Photogramm. Remote Sens. Spatial Inf. Sci. 7, 51–57. 10.5194/isprsannals-III-7-51-2016
4
Bailey L. (1965). Paralysis of the honey bee, apis mellifera linnaeus. J. Invertebrate Pathol. 7, 132–140. 10.1016/0022-2011(65)90024-8
5
Bjerge K. Frigaard C. E. Mikkelsen P. H. Nielsen T. H. Misbih M. Kryger P. (2019). A computer vision system to monitor the infestation level of varroa destructor in a honeybee colony. Comput. Electron. Agric. 164:104898. 10.1016/j.compag.2019.104898
6
Boenisch F. Rosemann B. Wild B. Dormagen D. Wario F. Landgraf T. (2018). Tracking all members of a honey bee colony over their lifetime using learned models of correspondence. Front. Rob. AI5:35. 10.3389/frobt.2018.00035
7
Bozek K. Hebert L. Mikheyev A. S. Stephens G. J. (2018). “Towards dense object tracking in a 2d honeybee hive,” in 2018 IEEE/CVF Conference on Computer Vision and Pattern Recognition (Salt Lake City, UT: IEEE), 4185–4193.
8
Branson K. Robie A. A. Bender J. Perona P. Dickinson M. H. (2009). High-throughput ethomics in large groups of Drosophila. Nature Methods6, 451–457. 10.1038/nmeth.1328
9
Campbell J. Mummert L. Sukthankar R. (2008). “Video monitoring of honey bee colonies at the hive entrance,” in Workshop Visual Observation and Analysis of Vertebrate and Insect Behavior (VAIB) at International Conference on Pattern Recognition (ICPR) (Tampa, FL), 1–4.
10
Cao Z. Simon T. Wei S. Sheikh Y. (2017). “Realtime multi-person 2d pose estimation using part affinity fields,” in 2017 IEEE Conference on Computer Vision and Pattern Recognition (CVPR) (Honolulu, HI: IEEE), 1302–1310.
11
Chen C. Yang E.-C. Jiang J.-A. Lin T.-T. (2012). An imaging system for monitoring the in-and-out activity of honey bees. Comput. Electron. Agric. 89, 100–109. 10.1016/j.compag.2012.08.006
12
Chiron G. Gomez-Krämer P. Ménard M. (2013). Detecting and tracking honeybees in 3d at the beehive entrance using stereo vision. EURASIP J. Image Video Process. 2013, 59. 10.1186/1687-5281-2013-59
13
Crall J. D. Gravish N. Mountcastle A. M. Combes S. A. (2015). BEEtag: a low-cost, image-based tracking system for the study of animal behavior and locomotion. PLoS ONE10:e0136487. 10.1371/journal.pone.0136487
14
de Souza P. Marendy P. Barbosa K. Budi S. Hirsch P. Nikolic N. et al . (2018). Low-cost electronic tagging system for bee monitoring. Sensors (Basel)18, 2124. 10.3390/s18072124
15
Dollár P. Welinder P. Perona P. (2010). “Cascaded pose regression,” in 2010 IEEE Computer Society Conference on Computer Vision and Pattern Recognition (San Francisco, CA: IEEE), 1078–1085.
16
Frias B. E. D. Barbosa C. D. Lourenço A. P. (2016). Pollen nutrition in honey bees (apis mellifera): impact on adult health. Apidologie47, 15–25. 10.1007/s13592-015-0373-y
17
Giannoni-Guzmán M. A. Rivera-Rodriguez E. J. Aleman-Rios J. Melendez Moreno A. M. Pérez Ramos M. Pérez-Claudio E. et al . (2021). The role of colony temperature in the entrainment of circadian rhythms of honey bee foragers. Ann. Entomol. Soc. Am. 114, 596–605. 10.1093/aesa/saab021
18
Güler R. A. Neverova N. Kokkinos I. (2018). “Densepose: dense human pose estimation in the wild,” in 2018 IEEE/CVF Conference on Computer Vision and Pattern Recognition (Salt Lake City, UT: IEEE), 7297–7306.
19
Huang Z. Y. Giray T. (2012). Factors affecting pollinators and pollination. Psyche2012:e302409. 10.1155/2012/302409
20
Insafutdinov E. Andriluka M. Pishchulin L. Tang S. Levinkov E. Andres B. et al . (2017). “ArtTrack: articulated multi-person tracking in the wild,” in 2017 IEEE Conference on Computer Vision and Pattern Recognition (CVPR) (Honolulu, HI: IEEE), 1293–1301.
21
Kabra M. Robie A. A. Rivera-Alba M. Branson S. Branson K. (2012). JAABA: interactive machine learning for automatic annotation of animal behavior. Nat. Methods10, 64–67. 10.1038/nmeth.2281
22
Kaspar R. E. Cook C. N. Breed M. D. (2018). Experienced individuals influence the thermoregulatory fanning behaviour in honey bee colonies. Animal Behav. 142, 69–76. 10.1016/j.anbehav.2018.06.004
23
Kuhn H. W. (1955). The hungarian method for the assignment problem. Naval Res. Logistics Q. 2, 83–97. 10.1002/nav.3800020109
24
Kulyukin V. Mukherjee S. (2019). On video analysis of omnidirectional bee traffic: counting bee motions with motion detection and image classification. Appl. Sci. 9, 3743. 10.3390/app9183743
25
Lin T.-Y. Maire M. Belongie S. J. Hays J. Perona P. Ramanan D. et al . (2014). “Microsoft COCO: common objects in context,” in European Conference in Computer Vision (Zurich), 740–755.
26
Magnier B. Ekszterowicz G. Lauren J. Rival M. Pfister F. (2018). “Bee hive traffic monitoring by tracking bee flight paths,” in Proceedings of the 13th International Joint Conference on Computer Vision, Imaging and Computer Graphics Theory and Applications, Vol. 5, VISAPP (Funchal: INSTICC; SciTePress), 563–571.
27
Marstaller J. Tausch F. Stock S. (2019). “DeepBees - Building and scaling convolutional neuronal nets for fast and large-scale visual monitoring of bee hives,” in 2019 IEEE/CVF International Conference on Computer Vision Workshop (ICCVW) (Seoul: IEEE), 271–278.
28
Mathis A. Mamidanna P. Cury K. M. Abe T. Murthy V. N. Mathis M. W. et al . (2018). DeepLabCut: markerless pose estimation of user-defined body parts with deep learning. Nat. Neurosci. 21, 1281–1289. 10.1038/s41593-018-0209-y
29
Meikle W. G. Holst N. (2016). Application of continuous monitoring of honeybee colonies. Springer Verlag46, 10–22. 10.1007/s13592-014-0298-x
30
Nath T. Mathis A. Chen A. C. Patel A. Bethge M. Mathis M. W. (2019). Using DeepLabCut for 3D markerless pose estimation across species and behaviors. Nat. Protocols14, 2152–2176. 10.1038/s41596-019-0176-0
31
Neumann P. Carreck N. L. (2010). Honey bee colony losses. J. Apic. Res. 49, 1–6. 10.3896/IBRA.1.49.1.01
32
Nystrom N. A. Levine M. J. Roskies R. Z. Scott J. R. (2015). “Bridges: a uniquely flexible HPC resource for new communities and data analytics,” in Proceedings of the 2015 XSEDE Conference on Scientific Advancements Enabled by Enhanced Cyberinfrastructure - XSEDE '15 (St. Louis, MO: ACM Press), 1–8.
33
Pereira T. D. Aldarondo D. E. Willmore L. Kislin M. Wang S. S. H. Murthy M. et al . (2019). Fast animal pose estimation using deep neural networks. Nat. Methods16, 117–125. 10.1038/s41592-018-0234-5
34
Redmon J. Farhadi A. (2018). YOLOv3: An Incremental Improvement. arXiv e-prints, arXiv:1804.02767.
35
Robie A. A. Seagraves K. M. Egnor S. E. R. Branson K. (2017). Machine vision methods for analyzing social interactions. J. Exp. Biol. 220, 25–34. 10.1242/jeb.142281
36
Rodriguez I. F. Mégret R. Acuña E. Agosto-Rivera J. L. Giray T. (2018a). “Recognition of pollen-bearing bees from video using convolutional neural network,” in IEEE Winter Conference on Applications of Computer Vision (WACV) (Lake Tahoe, NV: IEEE), 314–322.
37
Rodriguez I. F. Mégret R. Egnor R. Branson K. Acuña E. Agosto-Rivera J. L. et al . (2018b). “Multiple animals tracking in video using part affinity fields,” in Workshop Visual observation and analysis of Vertebrate And Insect Behavior (VAIB) at International Conference on Pattern Recognition (ICPR) (Beijing).
38
Romero-Ferrero F. Bergomi M. G. Hinz R. Heras F. J. H. de Polavieja G. G. (2018). idtracker.ai: Tracking all individuals in large collectives of unmarked animals. CoRR, abs/1803.04351. 10.1101/280735
39
Simonyan K. Zisserman A. (2014). Very deep convolutional networks for large-scale image recognition. CoRR, abs/1409.1556.
40
Sledevič T. (2018). “The application of convolutional neural network for pollen bearing bee classification,” in 2018 IEEE 6th Workshop on Advances in Information, Electronic and Electrical Engineering (AIEEE) (Vilnius: IEEE), 1–4.
41
Towns J. Cockerill T. Dahan M. Foster I. Gaither K. Grimshaw A. et al . (2014). XSEDE: accelerating scientific discovery. Comput. Sci. Eng. 16, 62–74. 10.1109/MCSE.2014.80
42
Wang J. Olson E. (2016). “AprilTag 2: efficient and robust fiducial detection,” in 2016 IEEE/RSJ International Conference on Intelligent Robots and Systems (IROS) (Daejeon: IEEE), 4193–4198.
43
Wario F. Wild B. Couvillon M. Rojas R. Landgraf T. (2015). Automatic methods for long-term tracking and the detection and decoding of communication dances in honeybees. Front. Ecol. Evol. 3:103. 10.3389/fevo.2015.00103
Summary
Keywords
honey bee monitoring, bee counting, pollen detection, pose estimation, convolutional neural networks
Citation
Rodriguez IF, Chan J, Alvarez Rios M, Branson K, Agosto-Rivera JL, Giray T and Mégret R (2022) Automated Video Monitoring of Unmarked and Marked Honey Bees at the Hive Entrance. Front. Comput. Sci. 3:769338. doi: 10.3389/fcomp.2021.769338
Received
10 September 2021
Accepted
27 December 2021
Published
04 February 2022
Volume
3 - 2021
Edited by
Florian Levet, UMR5297 Institut Interdisciplinaire de Neurosciences (IINS), France
Reviewed by
Konrad Schindler, ETH Zürich, Switzerland; Varun Kapoor, Institut Curie, France
Updates
Copyright
© 2022 Rodriguez, Chan, Alvarez Rios, Branson, Agosto-Rivera, Giray and Mégret.
This is an open-access article distributed under the terms of the Creative Commons Attribution License (CC BY). The use, distribution or reproduction in other forums is permitted, provided the original author(s) and the copyright owner(s) are credited and that the original publication in this journal is cited, in accordance with accepted academic practice. No use, distribution or reproduction is permitted which does not comply with these terms.
*Correspondence: Rémi Mégret remi.megret@upr.edu
This article was submitted to Computer Vision, a section of the journal Frontiers in Computer Science
Disclaimer
All claims expressed in this article are solely those of the authors and do not necessarily represent those of their affiliated organizations, or those of the publisher, the editors and the reviewers. Any product that may be evaluated in this article or claim that may be made by its manufacturer is not guaranteed or endorsed by the publisher.