 Ram Krishn Mishra
 Siddhaling Urolagin1
 J. Angel Arul Jothi
 Ashwin Sanjay Neogi
- 1Department of Computer Science, BITS Pilani, Dubai Campus, Dubai, United Arab Emirates
- 2Department of Business Management, College of Business Administration, Kingdom University, Ar Rifā, Bahrain
The Covid-19 pandemic has disrupted the world economy and significantly influenced the tourism industry. Millions of people have shared their emotions, views, facts, and circumstances on numerous social media platforms, which has resulted in a massive flow of information. The high-density social media data has drawn many researchers to extract valuable information and understand the user’s emotions during the pandemic time. The research looks at the data collected from the micro-blogging site Twitter for the tourism sector, emphasizing sub-domains hospitality and healthcare. The sentiment of approximately 20,000 tweets have been calculated using Valence Aware Dictionary for Sentiment Reasoning (VADER) model. Furthermore, topic modeling was used to reveal certain hidden themes and determine the narrative and direction of the topics related to tourism healthcare, and hospitality. Topic modeling also helped us to identify inter-cluster similar terms and analyzing the flow of information from a group of a similar opinion. Finally, a cutting-edge deep learning classification model was used with different epoch sizes of the dataset to anticipate and classify the people’s feelings. The deep learning model has been tested with multiple parameters such as training set accuracy, test set accuracy, validation loss, validation accuracy, etc., and resulted in more than a 90% in training set accuracy tourism hospitality and healthcare reported 80.9 and 78.7% respectively on test set accuracy.
Introduction
The tourism sector globally plays a significant role in long-term economic development. A huge movement of tourists from one place to another for leisure, business, family, or friend has connected the globe as a single village. Tourists like to visit the places for their happiness or business. Tourism is held accountable for many factors, such as it increases income, and helps in the development of many other industries (Manzoor et al., 2019). The advantages of travel and tourism extend well beyond their direct effects on GDP and employment; they also include indirect benefits through supply chain links to other industries and create induced effects. As per the report (Poole & Misrahi, 2020), the tourism industry contributed 10.3% to global GDP, and domestic travel accounts for the bulk of worldwide Travel and Tourism spending in 2019, accounting for 71.3% of total spending globally, with foreign tourists accounting for the remaining 28.7%. Many countries focus on foreign tourism because of its cash generation. Domestic tourism may be a vital instrument for generating employment, economic growth, poverty reduction, and infrastructure upgrades.
The Covid-19 has caused the globe to face a significant and complex dilemma (Aburumman, 2020). It has turned out to be a health issue, and it has also ruined the entire corporate process. Travel and tourism have been severely impacted in the corporate world (Alamanda et al., 2019). Due to the total lockdown enforcement by every country, every stakeholder in the tourist sector cannot revive. Tourism is a significant and growing source of revenue in the economy. According to UNCTAD research released on June 30, 2021, a drop in international tourism caused by the coronavirus pandemic may cost the world economy more than $4 trillion in 2020 and 2021 (COVID-19 and Tourism - An Update, 2021). Prior to the Covid-19 pandemic, travel and tourism had grown to be one of the most significant sectors in the global economy, accounting for 10% of global GDP. Only 25 million individuals traveled abroad in 1950, at the dawn of the jet era. By 2019, that figure had risen to 1.5 billion, and the travel and tourism industry had grown to nearly unfathomable dimensions for many nations globally.
Among the G20 nations, the hospitality and travel industries account for 10% of employment and 9.5% of GDP on average, with Italy, Mexico, and Spain accounting for 14% or more of GDP. A 6-month disruption inactivity may directly lower GDP by 2.5–3.5% (IMF F and D.,2021).
The hospitality sector has been put under tremendous strain due to the exponential decline in personal and business travel, resulting in reduced occupancy and revenue per available room. During the lockdown phase, 98% of global international tourists had declined in May 2020 as compared to 2019 which leads to a big loss in hospitality (UNWTO., 2020). This equates to a drop of 300 million tourists and a loss of 320 billion dollars in international tourism revenues, which is more than three times the loss experienced during the global economic crisis of 2009. Oversupply, declining hotel prices, low consumer sentiment, travel restrictions, and the delay of key global events are all causing severe operational and financial difficulties for industry players. As a result, In Malaysia, hotel owners have been compelled to cut expenses by taking actions such as reducing staff numbers and wages, forcing workers to work without pay, and closing hotels entirely (Foo et al., 2020).
Passengers’ behavior has shifted as a result of the Covid-19 problem, travel limitations, and the ensuing economic crisis, resulting in a significant decrease in demand for airline services. As measured by revenue per passenger kilometers, passenger air transport was down 90 percent year on year in april 2020, and it was still down 75 percent in August, according to IATA (IATA, 2021.). The decline in economic activity and trade had an effect on freight, the freight service was almost 30% lower year on year in april and was still around 12% lower in August. To fight against the spread of the coronavirus, travel restrictions have been imposed in all nations. Airport closures, suspension of incoming and outgoing flights, and nationwide lockdowns are just a few of the measures governments are doing to combat the epidemic. Following the pandemic’s spread in the first two quarters of 2020, at least 93 percent of the global population lived in countries with coronavirus-related travel restrictions, with almost three billion people living in governments that imposed entire border bans on foreigners.
According to the research jointly published by UNCTAD, 2021a and the UN World Tourism Organization (UNWTO), international tourism and its closely related industries incurred a 2.4 trillion dollars loss in 2020. The tourism sector may face a similar loss this year, and that the tourist industry’s recovery would be dependent on the global uptake of coronavirus vaccinations (Global Economy Could Lose over $4 Trillion Due to COVID-19 Impact on Tourism | UNCTAD,2021b, n. d.-a). Due to the mounting losses in many countries, Covid-19 vaccines are more prevalent in certain countries than others, tourist losses in most industrialized countries are minimized but aggravated in underdeveloped countries. According to the research, the tourist industry is expected to recover faster in nations with high vaccination rates, including the United Kingdom, the United States, France, Switzerland, and Germany. However, many experts predict that recovery to Pre-Covid international visitor arrival levels would not occur until 2023 or later, according to the UNWTO (“UNWTO World Tourism Barometer and Statistical Annex, December 2020,” 2020).
The study examines the perceptions of Twitter users in the Covid-19 pandemic concerning two tourism sub-domains: hospitality and healthcare. The research was carried out using deep learning algorithms and Natural Language Processing (NLP) methods. The research objectives are to identify the common similar shared terms related to tourism sub-domain healthcare and hospitality using a topic modeling. We find the most significant themes in each sector and reveal hidden semantic patterns inside both sectors. This will aid us in locating and comprehending the most widely discussed issues in the area. This research also looks at the direction of people’s feelings towards tourism healthcare and hospitality during the covid-19 outbreak by calculating the sentiment score and classifying in the different emotional categories. Now that it has been trained on real-world data, this model may be utilized in prediction of user’s emotions on new tweets. Lastly, we will talk about the study’s challenges and issues and the contributions of this research in possible future works. The structure of the research is organized in a systematic flow, section 2 describes the literature review, section 3 methodology, section 4 experimental result, section 5 discussion and at the last conclusion and future scope.
Literature Review
The literature review discusses the domains related to the research study. It also provides a panoramic overview of the theoretical studies done in the tourism subdomain. Some relevant studies which are related to this research study’s methodology have been pondered upon. Along with that, the theoretical studies have been discussed accordingly. It provides a rich source of information. Therefore, an extensive review of literature has been done in the area of social media, sentiment analysis, topic modeling, deep learning, and tourism during the pandemic crisis.
The highly contagious coronavirus continues to wreak havoc on the tourism sector, raising serious questions about its present and long-term survival. The infection has resulted in the loss of millions of jobs. India has a hospitality industry which is one of the largest tourism industries of the world and provides employment to lakhs of people. Ever since the Covid-19 started, India’s hospitality and the airline industry suffered a massive loss in revenue and has resulted in a 30 percent dip in tourists. Being a top tourism destination, Malaysia has suffered a net loss of 5.5 million USD in hotel cancellations alone due to growing concern about the raging virus (Foo et al., 2020). Kuala Lumpur is one of the top tourist destinations for many people around the world. On top of that, the losses incurred are far greater when the government of Malaysia shut its doors by banning international flights. A study was conducted on a cross-regional comparison of the effects of covid-19 on the tourist sector. The authors of the study concluded that the tourist industry is vulnerable to global crises (Uğur & Akbıyık, 2020). With the dissemination of the news, passengers opt to postpone or delay their journeys on the same day. Comments on the benefits of travel insurance and refunds due to trip cancellations were among the issues that further in-depth studies discovered. An algorithm for sentiment analysis and fake news classifications has been proposed in the studies (Hakak et al., 2021). Another study provided a random forest approach for predicting the patient health during Covid-19 (Iwendi et al., 2020) (Khan et al., 2020). The Deep learning approaches provide to deal with sensitive data specifically healthcare such as early detection of diabetic (Gadekallu et al., 2020) where prediction and model accuracy should be more accurate. Once the model is ready, optimization help to find the ideal iteration and finalizing the model with proper perfections (Agrawal et al., 2021).
With regards to social media and then amount of data it generates every day, twitter users are said to create around 15 GB of data each day. It is widely utilized by the general people, who use it to express their opinions (Pandey et al., 2019)on a variety of public topics (Srivastav et al., 2020) and to voice their complaints to businesses and government agencies. Since tourism is one of the biggest industries in terms of generating revenue towards a country’s economy and at the same time most of the data is generated from various social media websites. A study (Alaei et al., 2017) has employed various sentiment analysis techniques in tourism, which are examined and evaluated in terms of datasets used and performance on key assessment measures. Facebook has been witnessed to be used by the Korean government for the promotion and growth of tourism (Hoon et al., 2016). Due to the Coronavirus pandemic, a huge transformation towards online usage has been witnessed along with a sudden increase in Twitter usage. Social media is a rich source of information for tourists planning for any travel strategy. Machine learning and deep learning have played an important role in the field of medical image processing where machine learning algorithms have been used to classify Covid-19 affected individuals (Bhattacharya et al., 2021) and classifying the severity of Covid-19 diagnosed patient using neuro fuzzy techniques (Ayoub et al., 2021; Iwendi et al., 2021). Another study on how deep learning is being used for healthcare delivery in low and middle income countries has been done where the authors have explained how pneumonia detection using state-of-the-art deep learning algorithms can be utilized to help those countries with limited facilities and resources (Williams et al., 2021).
A study in (Kaushal & Srivastava, 2021) has taken a rather interesting approach to study the impact of Covid-19 on the tourism industry by taking on the interviews with 15 participants in senior positions in the hospitality industry. The study takes a qualitative approach to research, with email interviews serving as the primary method of data gathering. Email interviews are becoming more frequent in qualitative research, and given the present climate of social distance, it is deemed most suited for the current inquiry. Email interviews are also considered to be less expensive than telephonic or face-to-face interviews, yet they can generate detailed information from participants. We all are aware of the fact that the coronavirus indeed emerged in the sprawling capital of Central China’s Hubei province–Wuhan. The study aimed to assess the impact of coronavirus outbreaks on the Chinese tourism sector (Yang et al., 2020). Global visitors have abandoned their plans to visit China, while Chinese tourists are barred from visiting other countries. The fast spread of the Coronavirus in China has put a halt to people’s daily lives. This concern has influenced the country’s tourism sector both locally and abroad. According to the conclusions of the study, because of the danger from the virus, outsiders are afraid to interact with the Chinese population.
Countless individuals have lost their jobs as a result of the epidemic. Businesses are facing difficulties in returning to pre-covid levels, and they are looking for new revenue-generating techniques. While looking for new methods, it is critical to pay attention to the conversations taking place on social media to grasp the emotion. This may give suggestions for the development of new revenue-generating initiatives for firms. In a study (Jeong et al., 2019) on the topic modeling and sentiment analysis of social media data, the authors of this paper presented an opportunity mining technique for identifying product possibilities. An opportunity algorithm based on the significance and satisfaction of product subjects identifies the opportunity value and improvement direction of each product topic from a customer-centered perspective. We must be ready to adapt to new conditions in these unusual times when a whole country’s economy has stalled due to a lack of tourism revenue. Businesses, too, should adapt by adopting the aforementioned strategy to develop new ways and items to market for increasing their revenue stream and attracting tourists.
Methodology
Many techniques were utilized in the research to delve deeper and gain a better understanding of the Covid-19 epidemic’s impact on high-level tourist firms, including topic modeling, sentiment analysis, and deep learning classification. The authors have divided the tourist data into four categories: hospitality and healthcare. Figure 1 illustrates a high-level overview of the many techniques taken by the authors to understand the impact of the tourist industry.
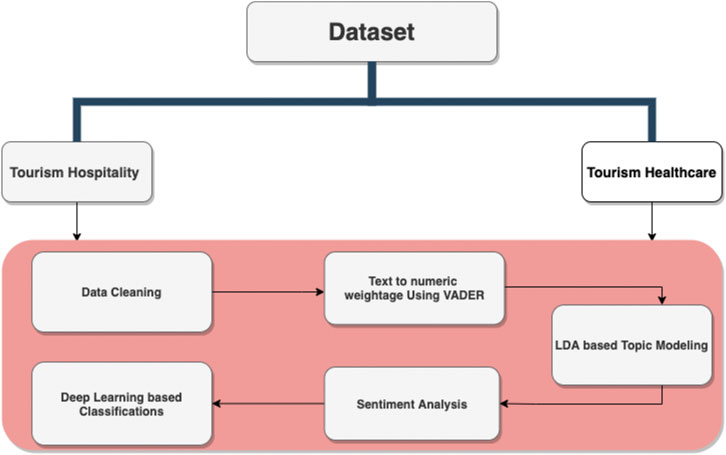
FIGURE 1. Processing structure.
The datasets for each sector have been saved in a CSV format with four attributes: datetime, tweet id, text, and username.
Data Collection
Over the course of 8 months, we have gathered a total of 20,761 tweets pertaining to tourism, healthcare and hospitality. The data was gathered with the help of the Tweepy library, an open-source Python program that connects to the Twitter database. The timeline of the tweets was between april 2020 and December 2020, when the Covid-19 virus began to spread all around the world, forcing governments to seal their borders and ensure travel restrictions. Figure 2 depicts the data collecting strategy. Since the main purpose is to understand how the tourism sector has been affected by the coronavirus, it has been segmented into two parts.
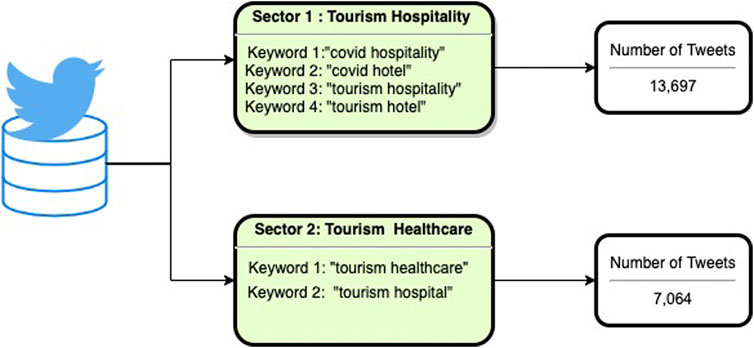
FIGURE 2. Data collection.
The tourism hospitality business is the first segment, with 13,697 tweets. The tourism healthcare services is the second segment that is helping the people during pandemic time. We found 7,064 tweets about healthcare using the keywords’ tourism healthcare’, and “tourism hospitals”. We focused on collecting these two sectors to identify the interdependencies between the similar kinds of topics shared in twitter.
Data Preprocessing
One of the most important aspects of data analysis is ensuring that the acquired data is machine-readable. Words, photos, and videos are incomprehensible to machines; they can only understand 1 and 0s. To be able to give an input of 1 and 0s, we must go through many phases. The data must be pre-processed, which demands the use of a method known as data cleaning, which entails transforming raw data into a machine-readable format. We need to clean the big text dataset, which is made up of tweets, to remove any discrepancies and avoid having inconsistent data. The study’s approach to data cleansing is straightforward. The study made use of Excel’s inbuilt duplicate data removal feature and removed all complete tweet duplicates. Duplicate data can have little to adverse effects on the machine learning model. When duplicate data was observed, the training data might have the same instances again and again. i.e. there will be multiple same values of dependent and independent variable combinations. Hence, when the proposed model learns from this data, the study will get very high accuracy on in-sample testing but out of sample testing will be much lesser, i.e., the study will have an over-fitted model.
Furthermore, we moved ahead to clean the data in much more detail by using python’s open-source package called Regex which is nothing but regular expressions. The research study created a custom python script that takes in the tweets as a whole and by using regular expression (ThompsonKen, 1968). Then it started with removing special characters, while converting all the tweets to lowercase mainly because machine learning models might treat a word which is at the beginning of a tweet with a capital letter different from the same word which appears later in the same tweet but without any capital letter. This might lead to a decline in accuracy. So, therefore lowering the words would be a better trade-off. Punctuation along with leading and trailing white spaces in the tweets were also removed.
There are data cleaning steps that should be done specifically in Twitter such as removing user mention '\text [at]', removing HTTP links, removing emotions, the ‘rt’ character which displays when a user retweets a tweet.
NLP Techniques for Data Cleaning
As mentioned earlier, machine learning models struggle in understanding the raw text, and this is why there are a couple of natural language processing sub-techniques that we incorporated:
Tokenization
The basic components of natural language processing are tokens. Tokenization is the process pf breaking down a large chunk of text into smaller tokens. Tokens can be words, characters, or sub words.
The most frequent technique of processing raw text is at the token level, because tokens are the building blocks of Natural Language. RNN, GRU, and LSTM, among the most common deep learning architectures for NLP, analyze raw text at the token level as well. Unstructured data and natural language text are broken down into bits of information that may be regarded distinct parts using a tokenizer. The token occurrences in a document can be utilized to create a vector that represents the document. An unstructured string (text document) is instantly transformed into a numerical data structure appropriate for machine learning.
In tokenization, the authors needed to identify the words that constitute a string of characters, and it is the most basic step to proceed in processing textual data. This is important because the meaning of the text could easily be interpreted by analyzing the words present in the text (Webster & Kit, 1992). The study performed tokenization before removing stop words.
Removal of Stop Words
Stopwords are the most common words in any natural language. For the purpose of analyzing text data and building NLP models, these stopwords might not add much value to the meaning of the document. On removing stopwords, dataset size decreases and the time to train the model also decreases. A python list was created which contained all the words that fall under the category of stopwords for removing them. Removing stop words can potentially help improve the performance as there are fewer and only meaningful tokens left. Thus, it could increase classification accuracy.
Topic Modelling Process
The goal of the analytics industry is to extract “Information” from data. It’s challenging to get relevant and needed information with the rising volume of data in recent years, much of which is unstructured. However, technology has created some effective ways for mining through data and retrieving the information that were needed.
Topic Modelling is one such text mining approach. As the name implies, a technique for automatically identifying themes contained in a text item and deriving hidden patterns displayed by a text corpus. As a result, wiser decisions may be made.
Topic modeling is distinct from rule-based text mining techniques that rely on regular expressions or dictionary-based keyword searches. It’s an unsupervised method for spotting and tracking a group of words in huge groups of texts. Using a probabilistic model, topic modeling finds abstract themes that recur in a corpus of documents. It’s commonly used as a text mining technique to uncover semantic patterns in large amounts of material. The Latent Dirichlet Allocation (LDA) statistical model was used to find themes in a collection of documents (in our example, a corpus of tweets).
Latent Semantic Structures
Latent semantic analysis (LSA) is a statistical model of word usage that allows for semantic similarity comparisons across bits of textual information. LSA’s basic premise is that there is some underlying, or “latent,” structure in the pattern of word usage across texts and that statistical approaches may be used to estimate this latent structure. In this scenario, documents may be regarded as contexts in which words appear, as well as smaller text pieces such as individual paragraphs or phrases.
On the basis of massive corpus studies, Latent Semantic Analysis (LSA) creates a high-dimensional vector representation. However, LSA analyzes co-occurrence across the corpus using a defined window of context (e.g., the paragraph level). The co-occurrence matrix is then subjected to a factor analytic approach (singular value decomposition) to produce a smaller set of dimensions. Words that are used in comparable contexts, even if they are not used in the same context, have similar vectors as a result of the dimension reduction. Nonetheless, their vector representations in LSA would be comparable (Landauer et al., 2009). This foundation makes it possible to compare larger chunks of text, such as the meaning of phrases, paragraphs, or whole texts.
As a theoretical model and a technique, LSA has been used to characterize the semantic relatedness of linguistic units. Its results on conventional vocabulary and subject matter exams overlap those of humans, it replicates human word sorting and category judgments, it simulates word-word and passage-word lexical priming data, and it adequately evaluates textual coherence and learnability of texts. Our methodology incorporates Latent Dirichlet Allocation (LDA), which employs the latent semantic structure for textual similarity comparison as previously mentioned.
LDA Based Topic Modelling
In this research, the authors have used the LDA model to perform topic discoveries from the existing tweets. Latent Dirichlet Allocation (LDA) is a statistical generative model using Dirichlet distributions (Jelodar et al., 2017).
The authors begin with a corpus of D documents and decide how many X topics we want to uncover from it. The topic model and D documents, represented as a mixture of the X topics, will be the outputs. LDA finds the weight of connections between documents and topics and between topics and words. The advantage of LDA is that it leverages feature information to construct a new axis, reducing variance and increasing class distance between the variables.
LDA focuses primarily on projecting the features in higher dimension space to lower dimensions. The three steps for achieving this are:
1) To begin, we must determine the separability between classes, which is defined as the distance between the mean of two or more classes. The between-class variance is the term for this is given in Equation (1).
2) Second, we must compute the distance between each class’s mean and sample. Within-class variance is another name for it which is shown in Equation (2).
Where:
Sb = Seperability between the classes.
Sw = Distance between each class’s mean and sample.
N = Number of instances.
x̄ = Mean of the input data points.3) Finally, a lower-dimensional space must be created that increases variation across classes while minimizing variance within classes. P, commonly known as Fisher’s criteria, is a lower-dimensional space projection.
We utilized the pyLDAvis package for our research, which is an open-source Python framework for interactive topic model visualization.
Sentiment Calculation Using VADER
Lexicon and Rule-Based Sentiment Calculation
For this work, Valence Aware Dictionary and Sentiment Reasoner (VADER) based sentiment calculation were used. VADER is a vocabulary and rule-based sentiment analysis tool that is tuned in to social media sentiments. It is an open-source utility that is completely free (Bonta et al., 2019). Word order and degree modifiers are taken into account by VADER as well. It is a text sentiment analysis model that’s sensitive to both emotion polarity (positive/negative) and intensity (strong). It is included in the NLTK package, and the biggest advantage about it is that it can be used on unlabeled text data right away. The model automatically gives us a dictionary which contains the scores of each sentiment i. e negative, neutral and positive. These scores are calculated based on a metric called polarity. The range of polarity is [−1,1], with -1 indicating a negative feeling and one indicating a positive sentiment. The intensity of a word affects whether it has any effect on the next word. Adverbs are utilized as modifiers in English, such as “very good,” which employs a lexicon-based method. In certain situations, the values are precisely equal to zero. A sentiment score will be assigned based on the polarity value, and the computation will be done in such a way that if the score is less than 0, the sentiment will be reported as negative. Positive sentiment is returned if the polarity is greater than 0. The score will be 0 in all other situations, and the sentiment will be neutral. There is another score returned by VADER and that is the compound score. Compound score is simply the sum of all the sentiment scores and it ranges from [-1,+1] where -1 indicates extremely negative score and on the other hand +1 indicates extremely positive score. We have used this metric primarily to understand the sentiments of the users (Hutto & Gilbert, 2014).
The main advantage of utilizing a lexicon-based approach is that it is much easier to understand and update by people. Using this method, the semantic orientation may be gathered and classified as neutral, positive, or negative. Sentiment analysis is a technique for extracting subjectivity and polarity from text, whereas semantic orientation assesses the content’s polarity and strength. This approach uses adjectives and adverbs to indicate the text’s semantic direction (in our case it is a tweet). The sentiment orientation value is then calculated by mixing adverbs and adjectives. Furthermore, the entire value is derived from a single source. Finally, a pooling technique is used to assess the sentiment of the tweets, which takes the average of all sentiments.
Classification of Sentiments Using LSTM RNN Algorithm
Long Short-Term Memory Networks (LSTMs) are a kind of RNN that can learn long-term dependencies. They work tremendously well on a large variety of problems and are now widely used. Neural Networks are a strong technology that may be used for image identification and a variety of other tasks. One of the model’s limitations is that it has no memory connected with it. This is a difficulty while dealing with sequential data such as text or time series. RNN solves this problem by incorporating a feedback glance that acts as a memory. As a result, the model’s previous inputs leave a trace. LSTM expands on this concept by including a short-term and long-term memory component (Sherstinsky, 2018).
All recurrent neural networks are made up of a series of repeated neural network modules. This repeating module in conventional RNNs will have a relatively basic structure, such as a single tanh layer. LSTMs are specifically intended to prevent the problem of long-term reliance. They do not have to work hard to remember knowledge for lengthy periods of time; it’s virtually second nature to them. The entire architectural explanation of LSTM Network having different input and output layers and dealing with sequential information it combines forget gate, input gate, and output gate (Yu et al., 2019).
In the case of RNN, the input is divided into two sections, and it must process multiple inputs while only performing one forward computation (Sherstinsky, 2018). This does not occur in the BP network. One of the two segregated inputs is the calculation’s output, while the other is the variable present in the trained sample. RNN manages continuous data, specifically lists and sequences. This is what the characteristics mean. As a result, RNN and LSTM are particularly well-suited to dealing with the aforementioned data. However, there are a few questions to consider when using RNN. The gradients are exploding and disappearing, which is a big concern. Since the RNN is made up of several BPNNs, the calculation requires a variety of activation functions, such as sigmoid. These activation functions change the value in a certain set, such as [0, 1], and so on. Furthermore, these functions limit the spectrum of their derivatives.
LSTM has many uses and is used in many types of research, including forecasting stock markets, sentiment analysis, music generation, forecasting tourism demand, time series prediction, controlling robots, speech recognition, handwriting recognition, semantic parsing, and much more.
In some cases, we will have to examine recent data in order to complete the work at hand. Consider a vocabulary model that predicts the next word based on the ones that came before it. Recurrent Neural Network (RNN) can learn to utilize prior experience in situations when the period between historical information and the area where they’re needed is brief. Because the RNN has a long-term dependency, the LSTM was included to help with this. The LSTM architecture is a kind of RNN that is capable of learning long-term relationships as well as solving the vanishing/exploding gradient problem. When working with huge volumes of data, LSTM can model and extract valuable information from social media data extremely effectively. Hence, we decided to use the LSTM RNN model since it had approximately 20,000 tweets.
Many attempts have been made to address the problem of vanishing gradients by modifying vanilla RNNs such that gradients do not expire as sequences become longer. The most popular and effective of these projects has been the long, short-term memory network, or LSTM. LSTMs have virtually supplanted regular RNNs in terms of popularity. LSTMs are also widely used to analyze social media data.
Experimental Results and Analysis
This section discussed about the experimental results and analysis of the research study.
Depiction of Topic Modeling for Tourism Hospitality
Hovering over the first subject in Figure 3 is the pyLDAvis interactive topic modeling visualization for the tourist hospitality industry. This figure reveals that there are 5 cluster themes connected with the sector, and the red bar represents the most common terms in each subject. The blue bar represents the overall phrase frequency of that specific word across all themes combined. Another thing to keep in mind is that if any of the clusters overlap or are physically adjacent to another cluster, it suggests that the topics contain comparable terminology.
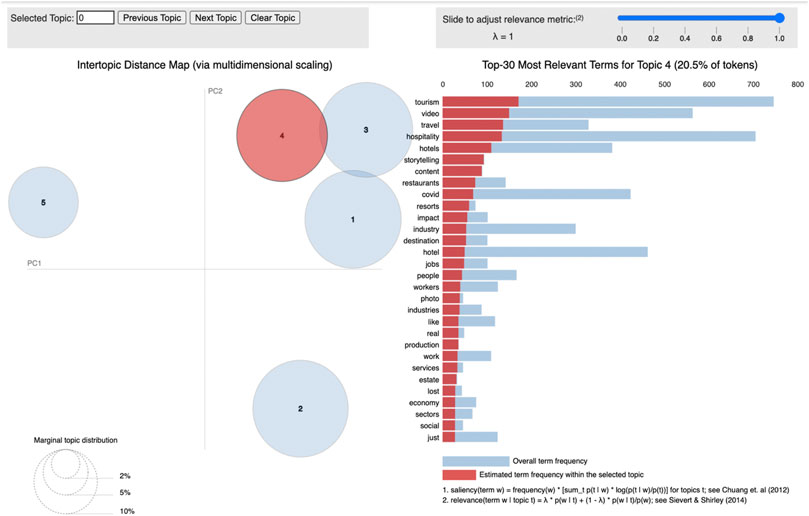
FIGURE 3. Interactive topic modeling visualization for tourism hospitality sector.
The key themes in the first topic cluster include terms like Covid, hospitality, hotels, and industry. This implies that the Covid-19 epidemic has caused the hospitality industry to close its doors, resulting in billions of dollars in lost revenue (Global Economy Could Lose over $4 Trillion Due to COVID-19 Impact on Tourism | UNCTAD.,2021c, n. d.-b). It was observed that restaurants, hotels, and resorts have been the most negatively impacted businesses owing to a variety of factors including.
1) Lack of visitors due to Covid - 19,
2) Loss of consumers (tourists) from other regions of the nation due to the pandemic.
We also discovered that employees and workers in the restaurants, hotels, and other sub-sectors were laid off in large numbers as a result of management choices made due to a shortage of finances. Another finding from the second subject cluster was that the same management implemented new methods to keep their company afloat by integrating new survival marketing tactics.
Depiction of Topic Modeling for Tourism Healthcare
Figure 4 depicts the tourism healthcare industry as an interactive graphic. The medical tourism industry was also impacted by the outbreak. By completing topic modeling, it was observed that the third topic cluster led us to Thailand, where it was learned that Thailand had made gradual steps to reopen for medical tourism, allowing restricted numbers of patients to visit the nation for treatment from the end of July 2020 (Tatum, 2020). Medical tourists and up to three others who can accompany them must follow strict standards, which include confirmation of negative Covid-19 testing granted no more than 72 h before departure, repeated tests while in-country, a 14-days hospital quarantine, and other anti-infection measures. The government is responding to the changing climate by leveraging digital technology to extend and improve telemedicine services, fostering a more hospitable business environment to encourage medical investment and innovation, and advancing its sophisticated healthcare infrastructure.
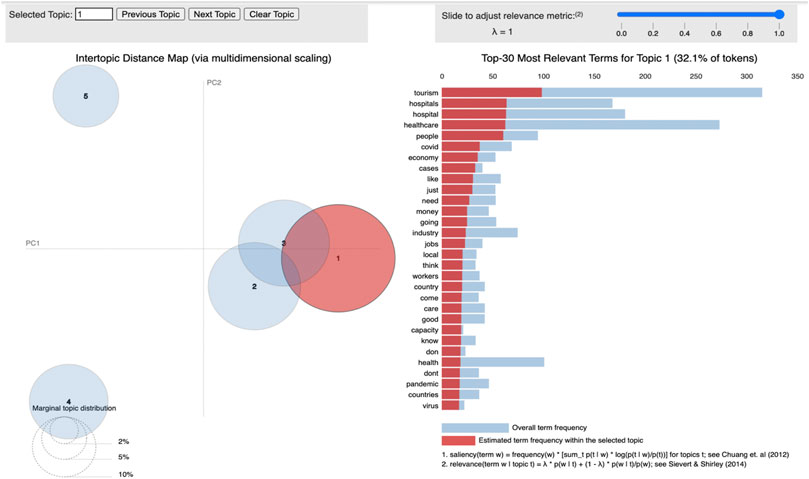
FIGURE 4. Interactive topic modeling visualization for tourism healthcare sector.
Histogram of Sentiment Compound Score for Each Sector
Figure 5 explains the compound range of sentiments. As per depiction, the compound range varies between -1 and +1. Figure 5A shows tourism hospitality’s sentiments where positive rates are higher than negative. Tourism healthcare in Figure 5B has more positive ranges and the highest frequency is between 0.5 and 0.7 and most of the tweets belong to the positive side.
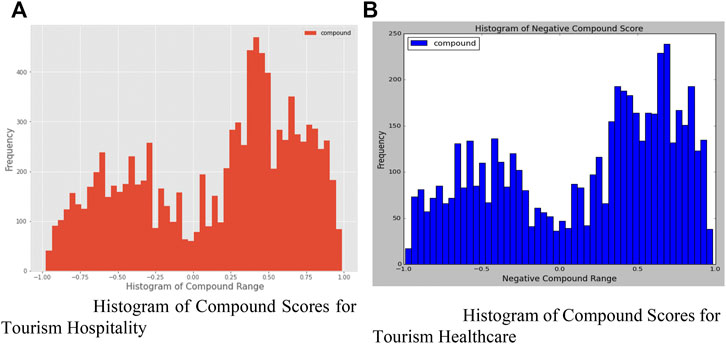
FIGURE 5. (A) Histogram of compound scores for tourism hospitality (B) Histogram of compound scores for tourism healthcare.
Sentiment bar Plot for Each Sector
Figure 6 is a bar plot depicting the number of feelings expressed in the various sectors of the industry taken into the study. The bulk of the feelings are positive, as seen in the graph. In the instance of the tourism hospitality sector in Figure 6A, VADER sentiment analysis revealed that about 6,300 + emotions were positive. One of the reasons for the increase in positive tweets is that when covid-19 hit the globe, there was an inflow of tweets praising the hospitality sector, particularly the hotel industry, collaborating with the government for a win-win situation. Passengers had to go through obligatory institutional quarantine, and the government was having trouble accommodating all of the quarantine passengers. The hotel sector offered the government a feasible alternative for directing travelers to quarantine themselves in hotel rooms, therefore increasing their revenue.
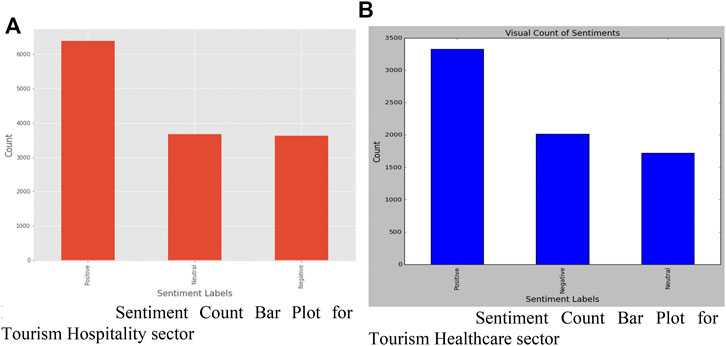
FIGURE 6. (A) Sentiment Count Bar Plot for Tourism Hospitality sector (B) Sentiment Count Bar Plot for Tourism Healthcare sector.
The ideal situation can be seen in the healthcare sector bar plot Figure 6B, where a country’s GDP drop, which led to substantial system reorganization, can be linked back to a huge number of positive tweets. The negative tweets may be linked back to numerous industry owners whose businesses were harmed as a result of the lockdown, adversely impacting the country’s economy. Another reason is that prominent influencers and celebrities, notably in India, began tweeting about the country’s economy tanking and the prime minister being held accountable.
A country like India, which is developing and has a lot of promise, may also be the reason why individuals began to tweet that shutting the country’s borders at an early stage would have saved a lot of lives and prevented further spread of the virus.
Violin Plot of Compound Score for Each Sector
The violin plot of all the sectors is shown in Figure 7. A typical observation is that the violin plot of all positive sentiments has a higher degree of fluctuation, particularly in the hospitality sector. This means that the compound score from the range of 0.2–0.5 is higher, indicating that there are more tweets in that area. In these plots, the straight line denotes that the class belongs to neutral sentiment, which has a compound score of 0. If the violin plot has a wider region, as it does in the instance of negative emotions in the tourism economic sector, it indicates that the composite score of all negative sentiments follows a consistent range.
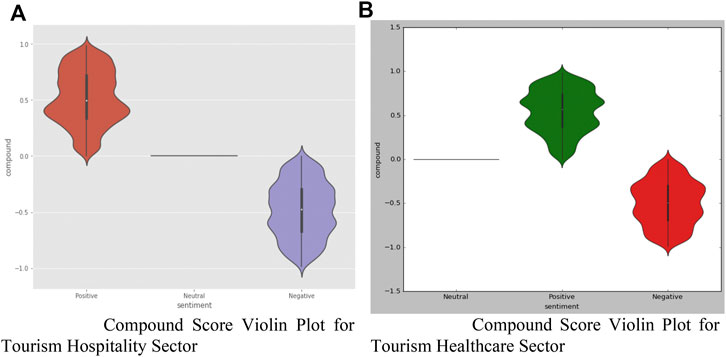
FIGURE 7. (A) Compound score violin plot for tourism hospitality sector (B) Compound score violin plot for tourism healthcare sector.
LSTM RNN Model Results
The input/output of the model with 85% of total data for training and 15% have been kept for testing purpose shown in Figure 8. Table 1 summarizes the full experimental findings and comparisons of the LSTM RNN deep learning model for three epoch sizes: 5, 10, 15, and 20 for each tourism sector. To begin, an epoch size of 15 obtained the maximum accuracy of 80.9 percent and a loss of 0.011 in the tourist hospitality sector. Secondly, the model performed well in the tourism economy sector, with an accuracy of 75% and a loss of 0.043, which is 5% less than the preceding sector’s performance. Furthermore, in the fifth and 10th epochs, the final sector which is healthcare obtained an accuracy of 76.1 percent. Lastly, with the increase in the epoch size of 20, we saw that the model started overfitting the dataset. Hence, we went for the optimal epoch size of 15 which indicates the robustness of the model.
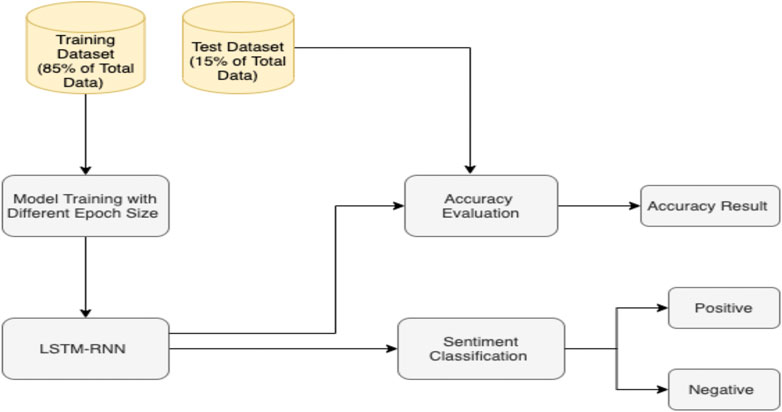
FIGURE 8. Architecture of LSTM result.
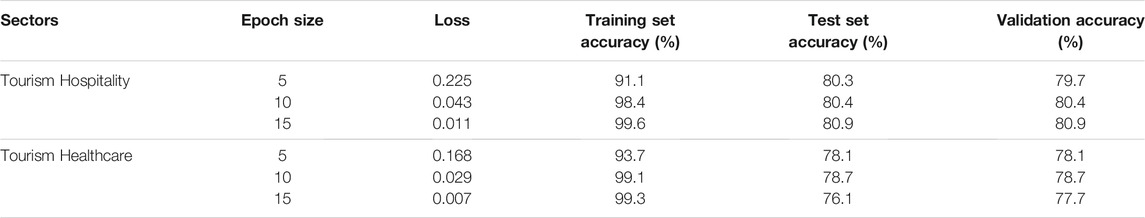
TABLE 1. Comparison of LSTM RNN Model Based on Epoch size.
Overall, the deep learning model performed admirably and accurately categorized most of the sentiments, suggesting that we could depend on the model for future sentiment classification predictions.
Table 2 compares the random forest and support vector classifier, two common machine learning algorithms. When we examine the findings of Table 1 and Table 2, especially the test set accuracy, it is apparent that the deep learning algorithm performs well in the hospitality industry. The SVC algorithm, on the other hand, does have a little higher accuracy in the healthcare sector. Another thing to remember is that the test set accuracy refers to the tweets on which the model has not been trained. The LSTM RNN algorithm was chosen primarily because neural networks are a very powerful technique for text and image classification. One of the model’s shortcomings is that it has no memory, which is an issue for sequential data such as text or time series. RNN solves this problem by introducing a feedback glance that acts as a memory. As a result, the model’s previous inputs leave a trace. LSTM expands on this concept by including a short-term and long-term memory component. As a result, LSTM is an excellent tool for anything involving a sequence. Because the meaning of a word is determined by the words that came before it. Because of this, we chose the LSTM RNN algorithm and took advantage of its memory feature. Both approaches have a test accuracy that goes hand in hand, as we observed before when comparing the results acquired by machine learning and deep learning (Tables 1, 2). This is primarily due to the size of our dataset. Because we were constrained by the Twitter API’s request limits, LSTM RNN, a deep learning algorithm, requires a large amount of data to reach its full potential.
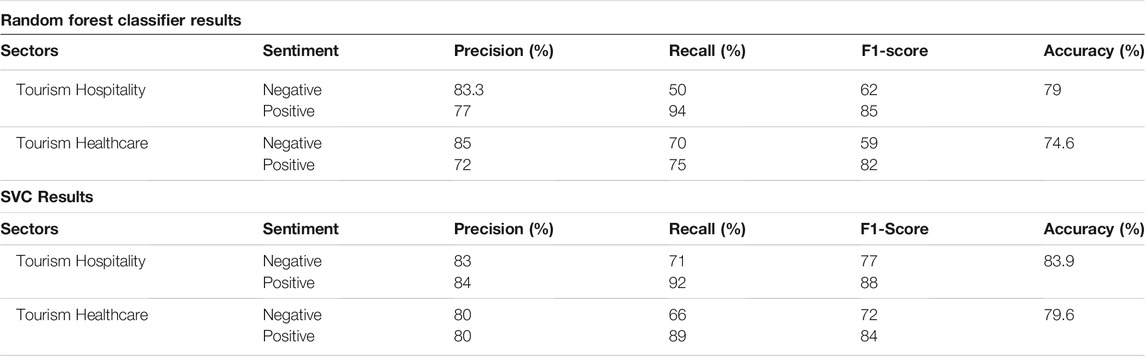
TABLE 2. Comparison of machine learning models.
Cluster Inter-dependency Between Healthcare and Hospitality
In topic modeling, the study retrieved the information of common terms which are widely used during the Covid time. Firstly, the clusters of top tweets in healthcare and hospitality were extracted with the help of the LDA approach. It can be observed in Table 3 that top similar terms used during pandemic times are “covid” and “tourism” and even other words such as hospitals and hospitality have been used maximum times by social media users. It can be seen in Figures 3, 4 that the clusters were five in numbers namely - Cluster 1, 2, 3, 4, and 5. The top six tweet terms were taken from both the keywords-based topic namely - healthcare and hospitality. The Inter Topic Distance Map was done with the help of multidimensional scaling. The table provides a panoramic view of similar terms in both sectors. This provides the food for thought of cluster interdependency calculation. Six out of the top 30 salient terms were selected in the table. The priority was given based on the maximum percentage of the salient terms.
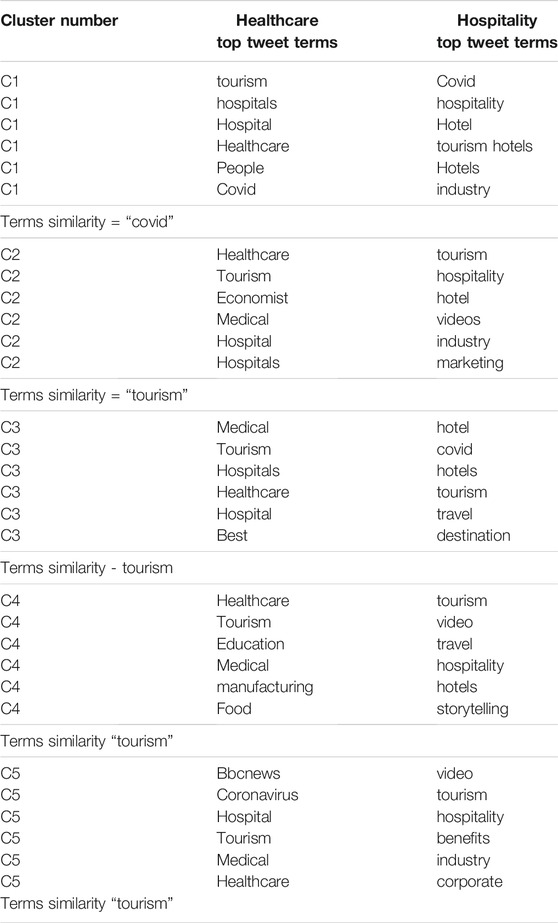
TABLE 3. Similar terms and inter cluster dependency.
Our approach for this research have been proposed with three aspect, first topic modeling which shows that what kind phrases are being used during the pandemic, and this approach will helps to find the trending issues related to tourism healthcare and hospitality. Second, we used a deep learning technique based on the LSTM RNN algorithm to classify twitter users’ emotions. In the hospitality and healthcare sectors, one may utilize our model, which was trained on real-world data, to assess public opinion and identify any problems that may emerge in any hot zones of a country where the government can assist, be it with medical supplies or tending to stuck tourists. Lastly, we tried to find the similar terms interdependency in the cluster which acts as an extra advantage to analyse what kind of words are maximally being used between the two sectors.
Discussion
This research work aims to extract and analyze tweets about coivd-19 from tourism sub-domains healthcare and hospitality from all around the world. The Covid-19 has had the greatest influence on the tourism domain, and visitors who had planned a vacation to another nation away from their regular surroundings have been trapped inside their homes.
The authors began by performing sentiment analysis with a very distinctive approach called VADER, which has the largest benefit of requiring very little data cleansing since it recognizes the magnitude of the words. After the analysis, it is found that the positive sentiments were the highest in all of the sectors which briefly means that In the next few years, it will have a substantial and beneficial influence on worldwide tourism. It also offers the possibility of transforming our affected planet into a greener one. Furthermore, we used topic modeling to discover patterns such as word frequency and distance between words. A topic model clusters comparable feedback as well as phrases and expressions that appear frequently. With this knowledge, it is possible to immediately infer what each group of texts is discussing. Each document in the LDA model is seen as a conglomeration of themes from the corpus. According to the model, each word in the text is related to one of the document’s subjects. Lastly, implementation of the state-of-the-art deep learning algorithm and testing the model with different epoch sizes helped in providing a robust sentiment prediction model.
Hospitality
The hospitality industry has taken huge hits in terms of revenue, and massive layoffs occurred because of Covid-19. By implementing topic modelling, it is seen that the restaurants, hotels, and resorts are among the highest sectors facing difficulty. The proposed deep learning model has achieved the highest values of test set accuracy of 80.9 percent, which is the maximum among the epoch sizes between 5 and 10. Apart from test accuracy, the authors captured the loss and training set accuracy of 0.011 and 99.6 percent, respectively. The hospitality sector has contributed to providing shelters for tourists with the alliance of government agencies during lockdown phase. Many hotels came forwards to facilitate the best services for covid victims during the quarantine phase. This has resulted in sharing of positive narrative by tourists when they are isolated during lockdown periods.
Healthcare
Healthcare to tourists is a critical component in which the best medical treatment is provided to foreign tourists and visitors. The tweets for tourist healthcare were collected from visitors who were trapped in various nations and how they handled and shared their experiences on social media data. On an epoch size of 10, the created deep learning model for the tourism sector can produce the best results. The study provided various implications for practice. The Twitter analysis can be done to check the impact of various other crises on tourism domains. The sentiment analysis using VADER can be a boon for many researchers. The tourism economy has witnessed a huge halt due to travel restrictions. The study has provided a panoramic view of the analysis during the coronavirus crisis which can help in paving the foundation for the implementation of efficient remedial measures to sustain after the covid-19 pandemic. The social media analysis helps the healthcare admirative agencies to analyze the tourist sentiments and prioritize the urgency patients due to covid complications.
Conclusion and Future Scope
Social media platforms are a medium for sharing opinions and thoughts. Analysis of these thoughts may help to get ready for upcoming travelers once the Covid-19 situations will normalize. The study has a future scope of research. A post-crisis study can also be done after the Covid-19 pandemic is over. This can help provide a birds-eye view of the overall impact of the coronavirus on tourism domains.
In view of the Covid-19 pandemic, Twitter data of tourism two sub-domains: hospitality and healthcare were selected and extracted accordingly. Analysis is done through sentiment visualization and deep learning algorithms. Sentiment visualization is presented with the help of bar and violin plots. This study provides a strategic practical framework to sustain during the Covid- 19 pandemic which revolves around the deep learning analysis of social media. Finally, the LSTM RNN model prediction has a number of applications, one of which is allowing government officials to monitor social media sites such as Twitter in order to better understand their citizens’ sentiments so that they can make choices and act in the best interests of the country and people.
One of the paper’s future scopes is to see whether the topic modeling suggestion can be expanded to other sectors like airline and economy to see what kinds of comparable words are impacting and influencing the healthcare and hospitality industries. We were limited in the quantity of data we could collect because of the Twitter API’s request restriction, which was one of the study’s constraints. The LSTM RNN approach would be considerably more robust with a much larger dataset.
Data Availability Statement
The raw data supporting the conclusions of this article will be made available by the authors, without undue reservation.
Author Contributions
Conceptualization, RKM; methodology, RKM; validation, RKM, SU and JJ; formal analysis, RKM; investigation, RKM, SU, JJ, AN and NN; writing original draft preparation, RKM, SU, JJ, AN and NN; supervision, SU and JJ.
Conflict of Interest
The authors declare that the research was conducted in the absence of any commercial or financial relationships that could be construed as a potential conflict of interest.
Publisher’s Note
All claims expressed in this article are solely those of the authors and do not necessarily represent those of their affiliated organizations, or those of the publisher, the editors and the reviewers. Any product that may be evaluated in this article, or claim that may be made by its manufacturer, is not guaranteed or endorsed by the publisher.
References
Aburumman, A. A. (2020). COVID-19 Impact and Survival Strategy in Business Tourism Market: the Example of the UAE MICE Industry. Humanit Soc. Sci. Commun. 7 (1), 1–11. doi:10.1057/s41599-020-00630-8
Agrawal, S., Sarkar, S., Srivastava, G., Reddy Maddikunta, P. K., and Gadekallu, T. R. (2021). Genetically Optimized Prediction of Remaining Useful Life. Sust. Comput. Inform. Syst. 31, 100565. doi:10.1016/J.SUSCOM.2021.100565
Alaei, A. R., Becken, S., and Stantic, B. (2017). Sentiment Analysis in Tourism: Capitalizing on Big Data. J. Trav. Res. 58 (2), 175–191. doi:10.1177/0047287517747753
Alamanda, D. T., Ramdhani, A., Kania, I., Susilawati, W., and Hadi, E. S. (2019). Sentiment Analysis Using Text Mining of Indonesia Tourism Reviews via Social Media. Int. J. Humanit. Arts Soc. Sci. 5 (2), 72–82. doi:10.20469/ijhss.5.10004-2
Ayoub, A., Mahboob, K., Rehman Javed, A., Rizwan, M., Reddy Gadekallu, T., Haider Abidi, M., et al. (2021). Classification and Categorization of COVID-19 Outbreak in Pakistan. Comput. Mater. Continua 69 (1), 1253–1269. doi:10.32604/CMC.2021.015655
Bhattacharya, S., Reddy Maddikunta, P. K., Pham, Q.-V., Gadekallu, T. R., Krishnan S, S. R., Chowdhary, C. L., et al. (2021). Deep Learning and Medical Image Processing for Coronavirus (COVID-19) Pandemic: A Survey. Sust. Cities Soc. 65, 102589. doi:10.1016/J.SCS.2020.102589
Bonta, V., Kumaresh, N., and Janardhan, N. (2019). A Comprehensive Study on Lexicon Based Approaches for Sentiment Analysis. Ajcst 8 (S2), 1–6. doi:10.51983/AJCST-2019.8.S2.2037
Foo, L.-P., Chin, M.-Y., Tan, K.-L., and Phuah, K.-T. (2020). The Impact of COVID-19 on Tourism Industry in Malaysia. Curr. Issues Tourism, 1–5. doi:10.1080/13683500.2020.177795110.1080/13683500.2020.1777951
Gadekallu, T. R., Khare, N., Bhattacharya, S., Singh, S., Maddikunta, P. K. R., Ra, I.-H., et al. (20202020). Early Detection of Diabetic Retinopathy Using PCA-Firefly Based Deep Learning Model. Electronics 9 (2), 274. doi:10.3390/ELECTRONICS9020274
Hakak, S., Alazab, M., Khan, S., Gadekallu, T. R., Maddikunta, P. K. R., and Khan, W. Z. (2021). An Ensemble Machine Learning Approach through Effective Feature Extraction to Classify Fake News. Future Generation Comp. Syst. 117, 47–58. doi:10.1016/J.FUTURE.2020.11.022
Hutto, C., and Gilbert, E. (2014). VADER: A Parsimonious Rule-Based Model for Sentiment Analysis of Social Media Text. Proceedings of the International AAAI Conference on Web and Social Media, Washington, USA, April 30, 2008, 8, 1, 216–225. Available at: https://ojs.aaai.org/index.php/ICWSM/article/view/14550.
IATA, 2021. IATA COVID-19 Survey. (n.d.). Retrieved September 10, 2021, from, Available at: https://www.iata.org/en/publications/store/covid-passenger-survey/.
Impact of the Pandemic on Tourism – IMF F and D. (n.d.), 2021. Retrieved September 10, 2021, Available at: https://www.imf.org/external/pubs/ft/fandd/2020/12/impact-of-the-pandemic-on-tourism-behsudi.htm.
Iwendi, C., Bashir, A. K., Peshkar, A., Sujatha, R., Chatterjee, J. M., Pasupuleti, S., et al. (2020). COVID-19 Patient Health Prediction Using Boosted Random Forest Algorithm. Front. Public Health 8, 357. doi:10.3389/FPUBH.2020.00357
Iwendi, C., Mahboob, K., Khalid, Z., Javed, A. R., Rizwan, M., and Ghosh, U. (2021). Classification of COVID-19 Individuals Using Adaptive Neuro-Fuzzy Inference System. Multimedia Syst., 1–15. doi:10.1007/S00530-021-00774-W
Jelodar, H., Wang, Y., Yuan, C., Feng, X., Jiang, X., Li, Y., et al. (2017). Latent Dirichlet Allocation (LDA) and Topic Modeling: Models, Applications, a Survey. Multimedia Tools Appl. 78 (11), 15169–15211. Available at: https://arxiv.org/abs/1711.04305v2. doi:10.1007/s11042-018-6894-4
Jeong, B., Yoon, J., and Lee, J.-M. (2019). Social media Mining for Product Planning: A Product Opportunity Mining Approach Based on Topic Modeling and Sentiment Analysis. Int. J. Inf. Manage. 48, 280–290. doi:10.1016/J.IJINFOMGT.2017.09.009
Kaushal, V., and Srivastava, S. (2021). Hospitality and Tourism Industry amid COVID-19 Pandemic: Perspectives on Challenges and Learnings from India. Int. J. Hospitality Manage. 92, 102707. doi:10.1016/J.IJHM.2020.102707
Khan, H., Srivastav, A., and Mishra, A. K. (2020). Use of Classification Algorithms in Health Care. Big Data Analytics and Intelligence: A Perspective for Health Care, Bingley, Emerald Publishing Limited, 31–54. doi:10.1108/978-1-83909-099-820201007
Landauer, T. K., Foltz, P. W., and Laham, D. (1998). An Introduction to Latent Semantic Analysis. Discourse Process. 25 (2–3), 259–284. doi:10.1080/01638539809545028
Manzoor, F., Wei, L., Asif, M., Haq, M. Z. u., and Rehman, H. u. (2019). The Contribution of Sustainable Tourism to Economic Growth and Employment in Pakistan. Ijerph 16 (19), 3785. doi:10.3390/ijerph16193785
Pandey, H., Mishra, A. K., and Kumar, D. N. (2019). Various Aspects of Sentiment Analysis: A Review. Proceedings of 2nd International Conference on Advanced Computing and Software Engineering (ICACSE) 2019, KNIT Sultanpur, June 2020, SSRN J, doi:10.2139/SSRN.3349011
Park, J. H., Lee, C., Yoo, C., and Nam, Y. (2016). An Analysis of the Utilization of Facebook by Local Korean Governments for Tourism Development and the Network of Smart Tourism Ecosystem. Int. J. Inf. Manage. 36 (6), 1320–1327. doi:10.1016/J.IJINFOMGT.2016.05.027
Poole, J., and Misrahi, T. (2020). Travel & Tourism.Global Economic Impact Trends 2020. London, UK, World Travel & Tourism Council. June, 1–20, Available at: https://wttc.org/Portals/0/Documents/Reports/2020/Global Economic Impact Trends 2020.pdf?ver=2021-02-25-183118-360.
Sherstinsky, A. (2020). Fundamentals of Recurrent Neural Network (RNN) and Long Short-Term Memory (LSTM) Network. Physica D: Nonlinear Phenomena 404, 132306. doi:10.1016/j.physd.2019.132306
Srivastav, A., Khan, H., and Mishra, A. K. (2020, Advances in Computational Linguistics and Text Processing Frameworks. Ad, in Comp. Elec. Engineer. 217–244. doi:10.4018/978-1-7998-2772-6.CH012
Thompson, K. (1968). Programming Techniques: Regular Expression Search Algorithm. Commun. ACM 11 (6), 419–422. doi:10.1145/363347.363387
Uğur, N. G., and Akbıyık, A. (2020). Impacts of COVID-19 on Global Tourism Industry: A Cross-Regional Comparison. Tourism Manage. Perspect. 36, 100744. doi:10.1016/J.TMP.2020.100744
UNCTAD (2021a). COVID-19 and Tourism - an Update. United Nations Conference on Trade and Development, Geneva, Switzerland, June 30 2021.
UNCTAD 2021b. Global Economy Could Lose over $4 Trillion Due to COVID-19 Impact on Tourism, Available at: https://unctad.org/news/global-economy-could-lose-over-4-trillion-due-covid-19-impact-tourism. Accessed on September 10, 2021.
UNCTAD. 2021c, Global Economy Could Lose over $4 Trillion Due to COVID-19 Impact on Tourism. Available at: https://unctad.org/news/global-economy-could-lose-over-4-trillion-due-covid-19-impact-tourism. Accessed on October 4, 2021.
UNWTO (2020). UNWTO World Tourism Barometer and Statistical Annex, August/September 2020. UNWTO World Tourism Barometer 18 (5), 1–36. doi:10.18111/WTOBAROMETERENG.2020.18.1.5
UNWTO World Tourism Barometer and Statistical Annex (2020). Eighth Asia & Oceania Congress of Endocrinology. November 30-December 4, 1986, Bangkok, Thailand. Abstracts 2020. J. Med. Assoc. Thai 69 (7), 1–100. doi:10.18111/WTOBAROMETERENG.2020.18.1.7
Webster, J. J., and Kit, C. (1992), Tokenization as the Initial Phase in NLP. Proceedings of the 14th conference on Computational linguistics, Nantes, France, August 23-August 28, 1992, 1106. doi:10.3115/992424.992434
Williams, D., Hornung, H., Nadimpalli, A., and Peery, A. (2021). Deep Learning and its Application for Healthcare Delivery in Low and Middle Income Countries. Front. Artif. Intell. 4, 30. doi:10.3389/FRAI.2021.553987
Yang, J., Zheng, Y., Gou, X., Pu, K., Chen, Z., Guo, Q., et al. (2020). Journal Pre-proof Prevalence of Comorbidities in the Novel Wuhan Coronavirus (COVID-19) Infection: a Systematic Review and Meta-Analysis. Int. J. Infect. Dis. 94, 91–95. doi:10.1016/j.ijid.2020.03.017
Keywords: social media tourism, text analysis, deep learning, topic modeling, sentiment analysis
Citation: Mishra RK, Urolagin S, Jothi JAA, Neogi AS and Nawaz N (2021) Deep Learning-based Sentiment Analysis and Topic Modeling on Tourism During Covid-19 Pandemic. Front. Comput. Sci. 3:775368. doi: 10.3389/fcomp.2021.775368
Received: 13 September 2021; Accepted: 19 October 2021;
Published: 05 November 2021.
Edited by:
Thippa Reddy Gadekallu, VIT University, IndiaReviewed by:
Usman Mohammed, King Khalid University, Saudi ArabiaAmir Ahmad, United Arab Emirates University, United Arab Emirates
Amit Kumar Mishra, DIT University, India
Copyright © 2021 Mishra, Urolagin, Jothi, Neogi and Nawaz. This is an open-access article distributed under the terms of the Creative Commons Attribution License (CC BY). The use, distribution or reproduction in other forums is permitted, provided the original author(s) and the copyright owner(s) are credited and that the original publication in this journal is cited, in accordance with accepted academic practice. No use, distribution or reproduction is permitted which does not comply with these terms.
*Correspondence: Ram Krishn Mishra, cmttaXNocmFAZHViYWkuYml0cy1waWxhbmkuYWMuaW4=