 Hongtu Xie
 Xinqiao Jiang1
- 1School of Electronics and Communication Engineering, Shenzhen Campus of Sun Yat-sen University, Shezhen, China
- 2School of Electronics and Communication Engineering, Sun Yat-sen University, Guangzhou, China
- 3The Fifth Affiliated Hospital, Guangzhou Medical University, Guangzhou, China
Ship detection using synthetic aperture radar (SAR) images has important applications in military and civilian fields, but the different sizes of the ship downgrade the detection accuracy of multiscale ships. Aiming at the problem of the poor accuracy and low efficiency of multiscale ship detection in complex scenes, this paper proposes a lightweight and anchor-free frame detection strategy for multiscale ships in SAR images. First, to deal with the problems of limited training samples, different sizes, attitudes, and angles of the ships in SAR images, a data augmentation strategy suitable for SAR images is adopted to expand the training space, followed by multiscale training to enhance the model generalization ability for multiscale ship detection. Second, a lightweight and anchor-free ship detection model based on the improved CenterNet is proposed, which abandons the dense anchor frame generation and extracts the key point of the ships for detection and positioning. Compared with the anchor frame-based detection method, this proposed detection model does not need to use the post-processing method to remove redundant anchor frames, and can accurately locate the center point of the ships with a better detection performance. Third, to reduce the model size and simplify the model parameters, a more lightweight network design is adopted in combination with the characteristics of SAR images. Hence, a residual network (ResNet) with fewer convolutional layers is constructed as the backbone network, and the cross-stage partial network (CSPNet) and spatial pyramid pooling (SPP) network are designed as the bottleneck network. The shallow ResNet can fully extract the SAR image features and reduce the training overfitting, and CSPNet and SPP can effectively combine the low-level image features to obtain the high-level features, reducing the model computation while at the same time enhancing the feature extraction ability. Finally, the evaluation index of the common objects in the context dataset is introduced, which can provide higher-quality evaluation results for ship detection accuracy and provide comprehensive evaluation indicators for multiscale ship detection. Experimental results show that the proposed strategy has the advantages of high detection efficiency, strong detection ability, and good generalization performance, which can achieve real-time and high-precision detection of the multiscale ship in complex SAR images.
Introduction
With the rapid development of high-resolution synthetic aperture radar (SAR) imaging technology (Xie et al., 2016, 2017, 2020, 2022), more SAR satellites have been launched, and along with it, the amount of SAR image data has grown rapidly. Subsequently, a large number of studies on target detection using SAR images have emerged (Chen et al., 2022; Tang et al., 2022; Xu et al., 2022), especially in the application of ocean monitoring (Cui et al., 2022; Kahar et al., 2022; Song et al., 2022). Generally, ship detection using SAR images can be divided into far-sea ship detection, near-sea (coastal) ship detection, and nearshore (port) ship detection (Li et al., 2022). Ship SAR images are mainly composed of the ocean background, ship targets, and land areas (Wang and Chen, 2017). In far-sea detection, since there is no land interference, the image's grayscale changes uniformly and slowly, and the SAR image is mainly affected by the sea clutter, so ship detection is relatively easy. In near-sea detection, the number of ships gradually increases, and their type becomes abundant, which may be accompanied by smaller islands or reefs, thus making ship detection gradually and increasingly difficult. In nearshore detection, the SAR images become more complex, since they are in the sea-land segmentation area, which is easily affected by land images. Especially in the port area, the grayscale of the land image changes drastically, there are numerous and complex edges, which greatly increases the difficulty of ship detection. In addition, the ship size varies by its type in the SAR image, which may degrade the accuracy of the multiscale ship detection (Li et al., 2019).
Currently, the traditional detection method (like the constant false alarm rate) is usually used for ship detection in SAR images (Ai et al., 2020). This method mainly relies on the manual design to extract the image features, which may be susceptible to complex background interferences, resulting in low detection accuracy, poor recognition efficiency, and weak generalization ability (Karvonen et al., 2022). The deep learning-based detection method, on the other hand, gets rid of the dependence on artificially designed features and modeling since it can automatically learn the parameters and extract the features (Ai et al., 2022). Compared with the traditional detection method, the deep learning-based detection method has the advantages of high detection accuracy and strong anti-interference, which has great development potential in the ship detection task given the different ship attitudes in complex and changeable SAR scenes (Yang et al., 2022).
The deep learning-based detection method is mainly divided into single-stage algorithms (such as you only look once (YOLO) (Redmon et al., 2016), single-shot multi-box detector [Souaidi and Ansari, 2022), and RetinaNet (Miao et al., 2022)], and two-stage algorithms [including the region convolutional neural network (R-CNN) (Wu et al., 2021), Fast R-CNN (Girshick, 2015), and Faster R-CNN (Ren et al., 2017)]. It is known that the single-stage algorithms can focus more on the fusion and prediction of the target features at different scales, which can be extended to the multiscale ship detection in the SAR images. Redmon and Farhadi (2018) proposed the YOLOv3 by adapting an over-residual network to extract the features and drawing on the feature pyramid network (FPN) idea, which could then extract the features from three scales and predict them to promote the precision of the target detection. Because there are some differences in the imaging mechanism between the optical image and SAR image (Liu et al., 2020), the YOLOv3 could not be directly applied for ship detection using SAR images. Hu et al. (2019) proposed a ship detection model based on an improved YOLOv3 by designing the network structure of the underlying residual unit and the FPN. Wang et al. (2019) proposed a ship detection model based on the RetinaNet using the Gaofen-3 SAR image, while Yang et al. (2020) came up with a convolutional neural network (CNN) detection model based on the deep multiscale feature fusion. Cui et al. (2021) suggested another ship detection method based on the CenterNet and large-scale SAR images, which could realize ship detection in large-scale SAR images via the spatial shuffle-group to enhance attention. Zhang et al. (2020) proposed a ship detection network by fusing the salient and CNN features, which could improve the accuracy of ship detection in the SAR image by using the multiscale salient and convolutional features. Jiao et al. (2018) suggested a SAR ship detection network densely connecting the feature maps from the top to bottom and generating the prediction from each fused feature map; however, this algorithm neglected the connections between the individual feature channels. Cui et al. (2019) proposed a two-stage detector called the dense attention pyramid network, which could refine the feature maps, suppress environmental interference, and improve the precision of the multiscale ship detection in the SAR images. Shi et al. (2018) combined the low and high-level features using the deep CNN, and then the combined features were further fed into the support vector machine (SVM). Guo et al. (2021) proposed a more effective and stable single-stage detector, which could achieve high-precision ship detection in SAR images with a negligible increase in the time cost.
Although the deep learning-based ship detection method has made great progress in processing accuracy, detection efficiency, and automation degree in SAR images, there are still a few issues that need to be addressed urgently. First, parameters redundancy. Most of the existing algorithms directly draw on the target detection model in the optical images and then use a relatively complex backbone network to extract the SAR image features. However, unlike optical images, SAR images do not contain rich feature information. The complex network does not assist refine the SAR image detection but instead leads to large and redundant model parameters. Second, additional post-processing requirements. Although the detection accuracy is greatly improved compared to the traditional detection method, the existing deep-learning method is based on the idea of dense anchor frame generation for target detection. It is not suitable for sparse ships and extremely unbalanced positive and negative samples in the SAR images, which further require expensive computational resources post-processing to remove the overlapping candidate frames and many anchor frames that drain the memory resources while running the algorithm. Third, training samples are single and scarce. Deep learning-based algorithms usually require many complicated and diverse training samples. The public dataset usually used in ship detection [like the AIR-SARShip (Sun et al., 2019)] have just single backgrounds or lacks training samples. Thus the generalization capability of the trained model is poor, making it difficult to apply in more complicated scenes.
To solve these problems, this paper built a multiscale ship detection framework in the SAR image based on the improved center point detection network (CenterNet) (Zhou et al., 2020) for the optical images, called CenterSAR which is lightweight, has high precision, and strong generalization capability. To meet the requirements of real-time and high-precision ship detection in the SAR images, a lightweight and anchor-free frame ship detection method based on the improved CenterNet has been proposed. This method has realized the rapid and accurate positioning and detection of multiscale ships in SAR images by predicting the information of key points of the ship and the relevant attributes of the detection frame. To address the scarcity of ship samples in the SAR image, a series of data augmentation methods suitable for SAR images have been used to expand training samples, after which multiscale training has been introduced to enhance the generalization performance of the model.
In the following sections, the data augmentation strategy suitable for SAR images is discussed along with multiscale training. A lightweight and anchor-free frame ship detection model is proposed. The fully convolutional network includes a backbone network for feature extraction, a bottleneck network for feature fusion, and a deconvolutional network for feature sampling. The target detection network consists of the center prediction and width-height regression and offsets correction, which can extract the detection frame information from low-resolution feature maps to locate the ships. In the sections thereafter, the proposed method is tested and validated through a public dataset of ship SAR images. Section “Conclusion” provides a conclusion.
Data augmentation for SAR images
Synthetic aperture radar imaging is quite different from optical imaging and includes phenomena such as unintuitive characterization, uneven background clutter, and strong speckle noise. Moreover, the targets in the SAR image may have different sizes, and the same target may show differences in the SAR images with different resolutions or different observation angles, which is not conducive to the training of the detection model. In addition, the deep-learning-based method requires a large number of training data to ensure model performance, but it is difficult and expensive to obtain enough training samples of the SAR image, thus the lack of sample capacity can easily lead to serious overfitting of the training model. Therefore, when the detection method in the optical image is directly applied to target detection in the SAR image, it is easy to cause a large offset of the detection frame and low recognition accuracy. Thus, it is necessary to carry out the relevant preprocessing according to the characteristics of the SAR images.
The data augmentation is mainly aimed at addressing the root cause of the model overfitting problem, that is, the problem of insufficient training samples. It aims to extract more effective information from the limited data and generate the value equivalent to the more abundant data. The data augmentation consists of a series of methods used to generate new training samples. By applying a series of transformations to the original training data to expand the model training space, the robustness and generalization of the model are increased, while alleviating the problem of model overfitting (Feng, 2021). In general, the distance of the SAR imaging is long, which leads to a small-size image of the ship target in the SAR image, and the same target has obvious differences in SAR images with different resolutions and different observation angles. The data augmentation processing can effectively suppress the SAR image noise, highlight the important information of interest in the SAR image, and help the model to identify the targets more accurately.
In this paper, a series of data augmentation techniques suitable for SAR images are used to enrich the training samples. The proposed data augmentation strategy mainly includes random multiscale scaling, flipping, small-angle rotating, and filling, which are shown in Figure 1. Random multiscale scaling mainly includes image scaling within a certain range. Since the ships in the SAR images are generally small, the proper magnification of the SAR image can extract the features more effectively. The random flip mainly includes the random horizontal flip and random vertical flip. The random small-angle rotation mainly includes the random rotation transformation within five degrees counterclockwise, because the scattering characteristics of the SAR image can remain approximately unchanged within five degrees, which improves the diversity of the training samples (Wang et al., 2017). The transformed SAR image size may change, and a padding layer is added at the end to ensure that all input images have a fixed size and help the model train at the multiscale. Besides, this paper makes the enhanced data more diverse by introducing random factors. Lastly, the final padding layer enables all input images to be scaled at any scale and ensures that the image size of the final input model is consistent, thereby improving the generalization capability of the model.

Figure 1. Data augmentation strategy.
Lightweight and anchor-free ship detection model
The CenterNet (Zhou et al., 2020) does not need to design anchor frames of various sizes for the different types of targets in advance to extract the target features, which can reduce the complexity of the network and decrease the unnecessary parameters. In this paper, the CenterNet used for the target detection in the optical images is extended and improved into the target detection in SAR images, thus a lightweight and anchor-free ship detection model based on an improved CenterNet is proposed for the multiscale ship detection in SAR images. The proposed model adopts an end-to-end design, and its structure is shown in Figure 2. It mainly includes a fully convolutional network and a target detection network. The fully convolutional network consists of a backbone network for feature extraction, a bottleneck network for feature fusion, and a deconvolutional network for feature sampling. Consistent with CenterNet, the proposed target detection network consists of center prediction, width-height regression, and offset correction, which is used to extract the detection frame information from the low-resolution feature maps to locate the ships.
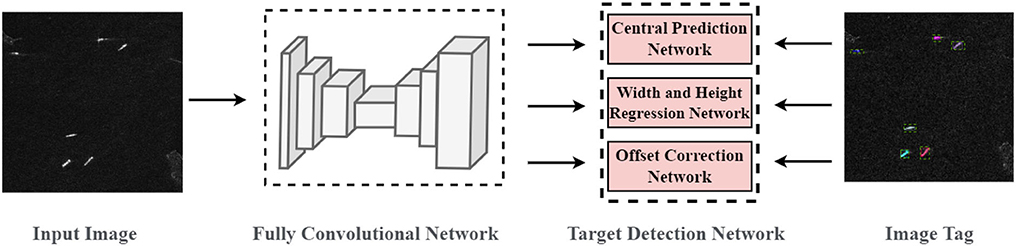
Figure 2. Structure diagram of the proposed model.
Provided that the input SAR image is I ∈ RW×H×1, the predicted output of the model is the heat map . W is the image width, H is the image height, R is the down-sampling step size, and C is the number of the target category. If Ŷx, y, c = 1, it means that there is a target center point of the category C at the coordinates (x, y), while if Ŷx, y, c = 0, it means the background.
Fully convolutional network
This paper designed a fully convolutional network with an encoder-bottleneck-decoder structure. The encoder uses the residual network (ResNet) (He et al., 2016) as the backbone network to extract the image features. The cross-stage partial network (CSPNet) (Wang et al., 2020) and spatial pyramid pooling (SPP) (He et al., 2015) networks are designed as the bottleneck network to enhance the feature extraction ability of the model, and the decoder is composed of a stack of deconvolution networks. Given a sampling step size R, the proposed network can extract the high-order features of the SAR images and then down-sample to obtain the low-resolution feature maps.
Feature extraction backbone network
The feature extraction mainly uses the deep network to extract the shallow position information and high-level semantic information in the SAR image and then processes the extracted features according to target characteristics. The main purpose of the feature extraction is to enhance the utilization of the hidden information in the SAR images and decrease the influence of the interference in the SAR images, thereby improving the detection accuracy of the ships. The quality of the extracted image features will greatly affect ship detection performance, thus the structural design of the backbone network for the feature extraction is particularly important.
The design of the backbone network needs to be composed of the stack of the CNN with a certain depth. However, the CNN has degradation problems such as gradient disappearance and weight decay when the network depth increases. The ResNet can effectively solve the problems caused by network depth, which is suitable as a backbone network for extracting the image features, thus it is widely used in many tasks. However, different from optical images, SAR images do not contain rich feature information as the network is too deep to be of advantage in target detection in SAR images, and it increases the number of extra parameters causing overfitting problems. Given the characteristics of SAR images, this paper designed a shallow residual network (like ResNet-18) as the SAR image feature extraction network.
The structure of the ResNet-18 network is shown in Figure 3. The curves between the convolutional layers are the residual connection of the skip layer. The solid line is the identity residual connection that is used between the convolutional layers with the same number of channels. The dotted line is the transformation residual connection that is used between the convolutional layers with a different number of channels, and additional convolutional layers need to be introduced for the transformation. The ResNet is designed as four cascaded sub-networks, and each sub-network is composed of a certain number of residual blocks. The residual block contains two 3 × 3 convolutional layers with the same number of output channels, which is followed by a batch normalization layer and a linear rectification function (ReLU) activation layer. The design of the residual block requires that the input and output of the convolutional layer have the same shape and number of channels. If the number of channels needs to change, an additional 1 × 1 convolutional layer needs to be introduced, which can transform the input into the same number of channels before the residual connection. In Figure 3, the input is added to the activated output through the residual connection across the layers, so that the input can propagate forward faster and accelerate the convergence of the model training.

Figure 3. ResNet-18 network structure.
Feature fusion bottleneck network
The bottleneck network is a key part of the target detection network. It performs reprocessing applications after the fusion of important features extracted by the backbone network, which is beneficial to the next step of network task learning. As shown in Figure 4, the designed bottleneck network consists of the CSPNet and SPP modules.
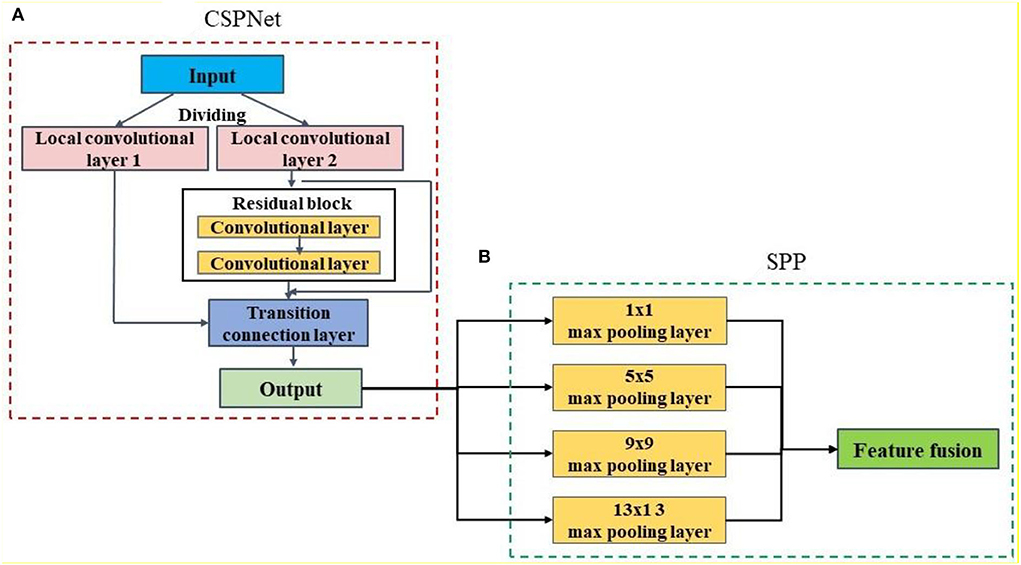
Figure 4. Bottleneck network structure. (A) CSPNet module; (B) SPP module.
For the lightweight feature extraction network, the CSPNet mainly solves the problems of the heavy computation and high parameters of the CNN models from the perspective of the network structure design. The CSPNet first divides the feature map of the input layer into two parts which respectively go through a series of local convolutional layers, and then one part of the feature is extracted through the designed hidden layer network (such as the residual block). Finally, the two parts of the output are connected and merged across the stage through the transition connection layer. Compared to directly inputting the feature map into the hidden layer network for the calculation, the CSPNet only inputs a part of the feature map, which can significantly reduce the amount of computation and memory consumption, and thus the staged convolution and merging operations can enhance the learning capability of the network.
The SPP is an FPN that uses four pooling methods to extract the feature maps of different scales (1 × 1 max pooling, 5 × 5 max pooling, 9 × 9 max pooling, and 13 × 13 max pooling), and then the different step sizes and filling methods are used for the four pooling methods to ensure that the extracted feature maps are of the same size. Finally, the extracted feature maps of different scales are subjected to feature fusion operations. Because the SPP only has a simple pooling operation, it does not contain trainable weight parameters. Thus, the SPP module does not affect the complexity of the detection model, but it can enhance the feature extraction capability of the network.
Feature sampling network
After the feature extraction and feature fusion of the bottleneck network, a small-size and low-resolution feature map is obtained. To further use the feature map of the input image for learning the target detection task, it is necessary to design a decoder to expand the size of the extracted feature map, which can realize the process of mapping the image from low-resolution to high-resolution, i.e., the up-sampling operation.
There are three up-sampling methods, namely, the bilinear interpolation up-sampling, de-pooling, and deconvolution. The first two methods do not include trainable parameters, and cannot be adapted when the network is trained; therefore, deconvolution is the usually used up-sampling network. Deconvolution (Zeiler et al., 2011) is not the reverse operation of the standard forward convolution, but a special kind of forward convolution. It adds the zero pixels to the edge of the feature map to expand the size according to a certain proportion, then rotates the convolution kernel, and finally the forward convolution. Through deconvolution, the part with a feature value of zero is filled as the learned feature, which can suppress the image noise, strengthen the image representation ability, and restore the detailed structure of the image to the maximum extent. The designed decoder mainly contains three deconvolution modules, each of which is sequentially composed of a deformable convolution layer, a batch normalization layer, a ReLU activation layer, a deconvolution layer, a batch normalization layer, and a ReLU activation layer. The function of adding the forward convolution layer is to further extract the features learned from the edge pixels by the deconvolution and to ensure the robustness of the network to the image noise. If there are large differences between regions (such as the ocean and land), due to the inherent symmetric geometry of the standard convolution operations, it will be difficult for the convolution operations to learn the spatial dependency of the image for ships with a large-scale and unknown shape, which leads to the feature representation learned by this layer to become weak. Thus, the deformable convolution (Dai et al., 2017; Zhu et al., 2019) is chosen to replace the standard convolution operation. The basic idea is to additionally introduce a learnable bias that can perform the feature extraction on the irregular regions, so the convolution kernel focuses on the region of interest or the target rather than the fixed position sampling. Applying the deformable convolution to the ship's detection in SAR images can better extract the features from different types of areas in complex scenes and then obtain the ship areas.
Although the deformable convolution can adaptively extract the image feature information, it adds extra computation due to the introduction of a parallel network for calculating the bias of the convolution operation. If the deformable convolution design is used too much, the model parameters will increase sharply, model inference speed will become slow, and overfitting problems will be caused during the training process. Therefore, the sampling network as a decoder contains three deconvolution networks, each of which includes a standard deconvolution layer and a deformable convolution layer, and then a batch normalization layer is used to enhance the network generalization ability. According to the presented sampling step R, the network up-samples the feature map extracted by the bottleneck network as inputs and outputs the feature map with 1/R time of the original image resolution for subsequent detection and recognition tasks.
Target detection network
The designed target detection network mainly includes the center prediction network, offset correction network, and width-height regression network.
Center prediction network
The function of the center prediction network is to locate the center point of the target, and it includes two layers of the CNN and one layer of the ReLU activation layer. The network takes the sampled feature map obtained by the fully convolutional network as the input and then undergoes a layer of sigmoid activation function transformation to make the output of the network a feature map , which can indicate whether there is a target center point at a certain coordinate. The role of the ReLU activation function is to increase the non-linearity of the network and effectively reduce the gradient disappearance problem, and the role of the Sigmoid function is to map the output of the network to the interval [0,1]. The sampled image is a low-resolution feature map, provided that the key point coordinates corresponding to the original image target are , so the key point coordinates by the down-sampling are . To combine the image annotation information for training and for a certain category c in each ground truth map, it is necessary to use the detection frame annotation information to construct the feature map of the real image . A Gaussian feature map is constructed using the Gaussian kernel, which is given by:
where, is the scale adaptive variance of the i category target which is used to control the value of the feature map according to the size of each target. If two Gaussian distributions of a category overlap, the maximum value between them is taken. Except for the Gaussian kernel function corresponding to each target in the heat map, the other position elements are zero. Before network training, it is essential to use the annotation information to construct the real value of the heat map corresponding to each sample, and thus the output of the central prediction network can approximate the real value through training. In the inference stage, the center prediction network will output a heat map. If the value of an element in the heat map is greater than the value of the surrounding eight elements, this point is a candidate center point, and the element value of this point is used as the confidence of the prediction target. In subsequent processing, the candidate center points whose confidence reaches the threshold are used as the center point of the prediction target, and then the output of the width-height regression network and offset correction network is combined after which the prediction frame can be generated and obtained.
Offset correction network
The resolution of the input image becomes 1/R time of the original resolution after down-sampling, however, the target detection is based on the original image. Considering the discreteness of the coordinates, mapping the key points of the feature map to the original image will introduce precision errors, so an additional offset correction network is required to predict a local deviation for each center point of the targets. The structure of this network is similar to the central prediction network, except that there are differences in network dimensions. Its output is , which is used to compensate the offset of each key point at the coordinates , reducing the mapping error between the feature map and the original image. The different categories of center points share the same offset correction network, which can reduce the number of model parameters.
Width-height regression network
The target detection task aims to locate all the regions in the input image where the targets exist, so the model also needs a network for outputting the predicted detection frame size, which can be used to determine the size of the target region. Therefore, the structure of this network also is like the central prediction network, except that there are differences in the dimensions. Its output is , which is used to indicate the width and height of the prediction frame corresponding to the key points in the heat map, in order to provide a basis for the target detection.
Loss function
The above three sub-networks mainly play the role of classification, offset correction, and prediction frame regression, thus it is necessary to design three different losses to train the model. Given the pre-labeled N target key points p0, p1, …pN in the SAR image, the classification loss Lk of the target key points adopts the focal loss (Lin et al., 2020), which is determined by
where, α and β are the hyperparameters of the focal loss, which are set as α = 2 and β= 4 in this paper. Since key points are very sensitive to position, to obtain more accurate results, an offset loss Loff is added to correct the position of the key point, and L1 distance is used as the loss function, i.e.,
For the detection frame size predicted by the width and height regression network, the L1 distance is also used as the loss function to regress the width and height of the detection frame, which is given by:
where, is the width and height of the real detection frame. Therefore, the final loss of the model is the weighted sum of the above three loss functions, which is given by:
where, λoff and λsizeare both the hyperparameters that can be used to control the weight of the corresponding loss. λoff and λsize are set to 0.5 in this paper.
Experiment and discussion
Experimental setting
Experimental dataset
To verify the ship detection performance of the proposed detection strategy, the High-Resolution SAR Images Dataset (HRSID) (Wei et al., 2020) constructed by the University of Electronic Science and Technology of China in 2020 is used for the experimental comparison between the proposed detection strategy and the traditional detection methods. HRSID borrows the construction process of the common objects in context (COCO) dataset (Lin et al., 2014). At an overlap rate of 25%, 136 panoramic SAR images with resolutions ranging from 1 to 5 m were cropped into the SAR image of 800 × 800 pixels. HRSID contains a total of 5,604 ship SAR images of different resolutions, polarizations, sea areas, and coastal ports and 16,951 ship instances, which includes a training set of 3,642 SAR images and a test set of 1,962 SAR images.
Experimental procedure
The traditional detection methods for comparison mainly include two-stage target detection networks based on the detection frame generation [like the Faster R-CNN (Ren et al., 2017), Mask R-CNN (He et al., 2017), and Cascade Mask R-CNN (Cai and Vasconcelos, 2021)], the single-stage target detection network based on detection frame position regression [like the RetinaNet (Lin et al., 2020)], and the single-stage target detection network based on the pixel-by-pixel regression of the detection frame [like the fully convolutional one-stage (FCOS) (Tian et al., 2019)]. According to the experimental setting in the literature (Wei et al., 2020), this paper used the residual network with different layers combined with FPN (ResNet-FPN) (Lin et al., 2017) as the backbone network of the comparison model; the residual network had 50 layers (ResNet-50) and 101 layers (ResNet-101).
The experimental hardware included a computer with a CPU of Intel i9-9900X, installed with NVIDIA RTX 2080 Ti GPU, Ubuntu18.04 operating system, and PyTorch software framework (Paszke et al., 2019). The compute unified device architecture (CUDA) 10.1 was used to accelerate all models in the training and testing phases. Before the training and testing, the traditional and proposed detection methods used the random data augmentation operation proposed in this paper, and the size of the input image was adjusted to 1,000 × 1,000 pixels during training. For the traditional detection method, the training optimizer used the stochastic gradient descent (SGD) method, the momentum and learning rates were set to 0.9 and 0.0025, respectively, and the weight decay factor was set at 0.0001. There was a total of 12 rounds of training. For the proposed detection method, Adam was used as the optimizer, the initial learning rate was set to 0.0001, and the ResNet-18 and ResNet-34 were used as the backbone networks to extract the image features. The rest of the parameters were consistent with the model in the traditional detection method used for the comparison.
During the initial training, the models in the traditional and proposed methods learned with a lower learning rate to prevent exploding the gradients, and they were subsequently trained with a normal learning rate. To ensure that the model had good converges, the learning rate of each method was periodically decayed using a cosine periodic function. In the test stage, the threshold of the intersection over union (IoU) used by anchor frame-based methods (like the RetinaNet, Faster R-CNN, Mask R-CNN, and Cascade Mask R-CNN) was set to 0.7, and the anchor-free frame detection algorithm FCOS took a confidence greater than 0.6 according to the predicted detection frame. As a prediction result, the model of the proposed detection method first generated 100 candidate center points for the area where targets may have been during the test, and then filtered them according to the confidence of each center point corresponding to the existence of the target, and removed the prediction results corresponding to the center point with a confidence degree lower than 0.5. Finally, it retained the detection frame corresponding to the final center point with a higher confidence degree.
Evaluation indicators
In the target detection tasks, to quantitatively and comprehensively evaluate the performance of the detection models, the IoU detection precision and recall rate are commonly used as evaluation indicators. The target detection task aims to find the target and area of interest, and thus the overlap rate can be used to measure the correlation between the predicted result area and the real target area. The higher the degree of overlap rate, the better the correlation, and the better the prediction accuracy. The overlap rate can be quantitatively represented by the IoU of the predicted detection frame (Bfrapd) and the real detection frame (Bfragt), which can be calculated by
According to the size of the IoU calculated by the predicted detection frame and real detection frame, the background and target can be distinguished, thus the detection precision and recall rate can be:
where, TP represents the number of positive samples that are correctly classified, FP represents the number of negative samples that are misclassified as positive samples, and F represents the number of positive samples that are misclassified as negative samples. According to precision and recall, the average precision (AP) can be defined. In the Cartesian coordinate system, if the horizontal coordinate is recall and the vertical coordinate is precision, the area under the recall-precision curve is the AP value, which is given by
where, P is the precision and R is the recall rate. The larger the value of the AP indicator, the better the detection performance of the model.
Most of the existing research uses the AP indicator based on the Pascal visual object classes (VOC) challenge competition (Everingham et al., 2014) as the evaluation criterion, which takes IoU = 0.5 as the threshold. However, it is difficult for a single indicator to accurately and quantitatively reflect the detection performance of the model in various scenarios. In contrast, the COCO dataset adopts a more objective and comprehensive evaluation indicator, which not only includes a series of evaluation indicators (AP, AP50, and AP75) with different IoU thresholds but also considers the multiscale target detection ability of the model, where the detection results of large, medium, and small targets are also included in the evaluation metrics (APl, APm, and APs). Therefore, this paper adopted the qualitatively higher COCO criteria to evaluate the performance of the detection models. As defined by the COCO evaluation criteria, AP is the average precision at 10 IoU thresholds (0.50:0.05:0.95), and AP75 and AP50 represent the results at the IoU thresholds at 0.75 and 0.50, respectively. APl, APm, and APs respectively define the detection results of small, medium, and large ship targets. Here, the area < 32 × 32 pixels is defined as a small ship target, the area larger than 96 × 96 pixels is defined as a large ship target, and the area between them (from 32 × 32 pixels to 96 × 96 pixels) is defined as a medium ship target.
Experimental results and analysis
Data augmentation results
As shown in Figure 1, in the proposed data augmentation method, all the training samples were first randomly scaled in the range of {800 × 800, 900 × 900, 1,000 × 1,000, and 1,100 × 1,100 pixels} and then flipped horizontally or vertically and rotated at a small angle within . Finally, the transformed image was filled to keep the size of the input image consistent. In this way, by increasing the number of model training iterations, the training samples could be greatly expanded. At the same time, due to the existence of the last filling layer, the model could accept input images of any scale for training, which improves the generalization capability of the model for multiscale SAR images. To illustrate the effect of the proposed data augmentation method, this paper conducted the experiments on the proposed ship detection model using different data augmentation methods, and then comprehensively used four augmentation methods for comparison. Since the input image size in the SAR image dataset may be inconsistent, to ensure the model can accept the multiscale input, the data augmentation methods used a padding operation at the end. The data augmentation results are shown in Table 1, and ResNet-18 was used as the backbone network. Experimental results with the best performance are shown in bold in Tables 1–3.
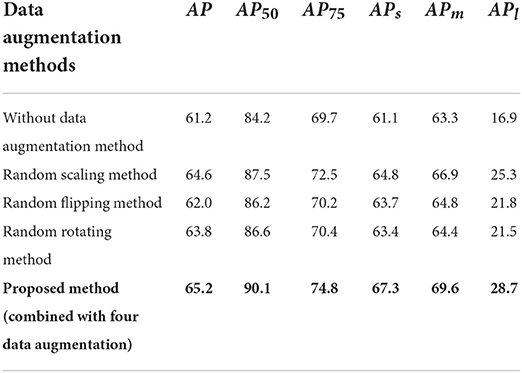
Table 1. Comparison of the data augmentation results.
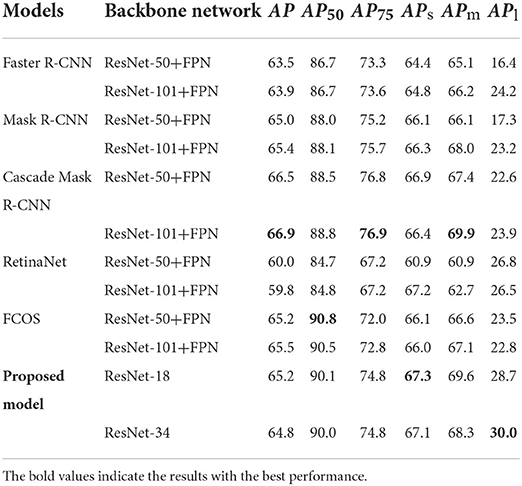
Table 2. Comparison of the ship detection results.
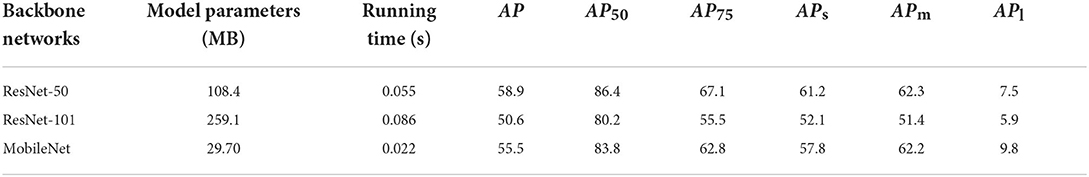
Table 3. Comparison of the proposed method based on different backbone networks.
The experimental results show that when the data augmentation method is not used, the detection accuracy of the proposed ship detection model is low, and the value of AP is only 61.2%. The analysis shows that different data augmentation methods can greatly improve the detection accuracy of the proposed ship detection model, and the random scaling method has the most obvious improvement in the model performance. From the results of the value of APl, APm, and APs, it is found that the random scaling method significantly improves the detection accuracy of the model for ships with various scales. In addition, the random flip and random rotation methods also improve the model detection effect to varying degrees, and then the various indicators exceed the model detection effect without the data augmentation method. As the model is combined with four data augmentation methods (proposed ship detection method in this paper), the highest detection accuracy of AP50 can reach 90.1%, which is better than the performance of any data augmentation method alone, thereby verifying the validity of the proposed data augmentation method.
Ship detection results
Table 2 shows the ship detection results using different target detection methods based on deep learning on the HRSID dataset. In Table 2, it can be seen that the performance of the model based on ResNet-18 and ResNet-34 in the proposed target detection method is better than most of the compared models in the traditional target detection method, reaching a detection accuracy of 90.1 and 90.0% on the AP50, respectively, which is only lower than that of the FCOS models with ResNet-50+FPN and ResNet-101+FPN as backbone networks. In addition, according to the results of APl and APm, the model of the proposed target detection method achieved the best performance with a detection accuracy of 67.3 and 30.0%, respectively, and is only slightly lower than the best detection model of the Cascade Mask R-CNN in the results of APs. This establishes that the model of the proposed target detection method can effectively extract the center point of the ships, and the proposed model has a better detection accuracy for multiscale ships. However, the performance of RetinaNet and Faster R-CNN is relatively poor, whose value of the AP50 based on the backbone network of ResNet-50+FPN is only 84.7 and 86.7%, respectively. Compared to the model of other target detection methods, there is a large gap in detection accuracy, indicating that these two models are not suitable for ship detection in SAR images.
In addition, it can be observed that when the IoU threshold is small (i.e., AP50), the anchor-free frame detection methods such as FCOS and proposed models have better detection performance. When the IoU threshold is increased, the detection indicators are more stringent (i.e., AP75), and anchor frame-based detection algorithms (the Faster R-CNN and its variants of the Mask R-CNN and Cascade Mask R-CNN) have better performance. The reason is that the anchor frame-based detection algorithm can generate many candidate detection frames, thus the quality of the detection frame after the non-maximum suppression processing is higher. While, the anchor-free frame detection method can directly generate the position of the detection frame regression, thus the position accuracy of the detection frame is not as good as the anchor frame-based algorithm.
Finally, it is found that using a deeper backbone network does not bring much improvement to all target detection models, and even leads to a decrease in the detection performance in some cases. This also explains the difference between SAR images and optical images, since SAR images do not contain rich feature information. Using a certain network depth can fully extract the features of SAR images. A deeper network will bring negative benefits and reduce the efficiency of the model operation. Therefore, in SAR image interpretation, the network structure must be designed more reasonably to achieve a better trade-off between detection accuracy and efficiency.
Figure 5 shows the ship detection results of various target detection methods based on different models in simple far-sea and near-sea scenes. The green frame represents the real detection frame of the ships in the dataset, and the red frame represents the predicted detection frame of the ships using different methods. In the far-sea scene (the SAR images on the left in Figure 5), due to the relatively pure background, although it is interfered with by sea surface clutter, the ships are more obvious. Therefore, all detection methods can detect the ships well, and there is basically no missed detection phenomenon. In the near-sea scene (the SAR images on the right in Figure 5), in the anchor frame-based detection methods, gradually different degrees of false alarms of ship detection appeared in the SAR images, and coastal reefs have been detected as ships. On the contrary, the anchor-free frame detection methods (the FCOS method and proposed method in this paper) are not affected by coastal reefs and can still accurately detect ships without false alarms.
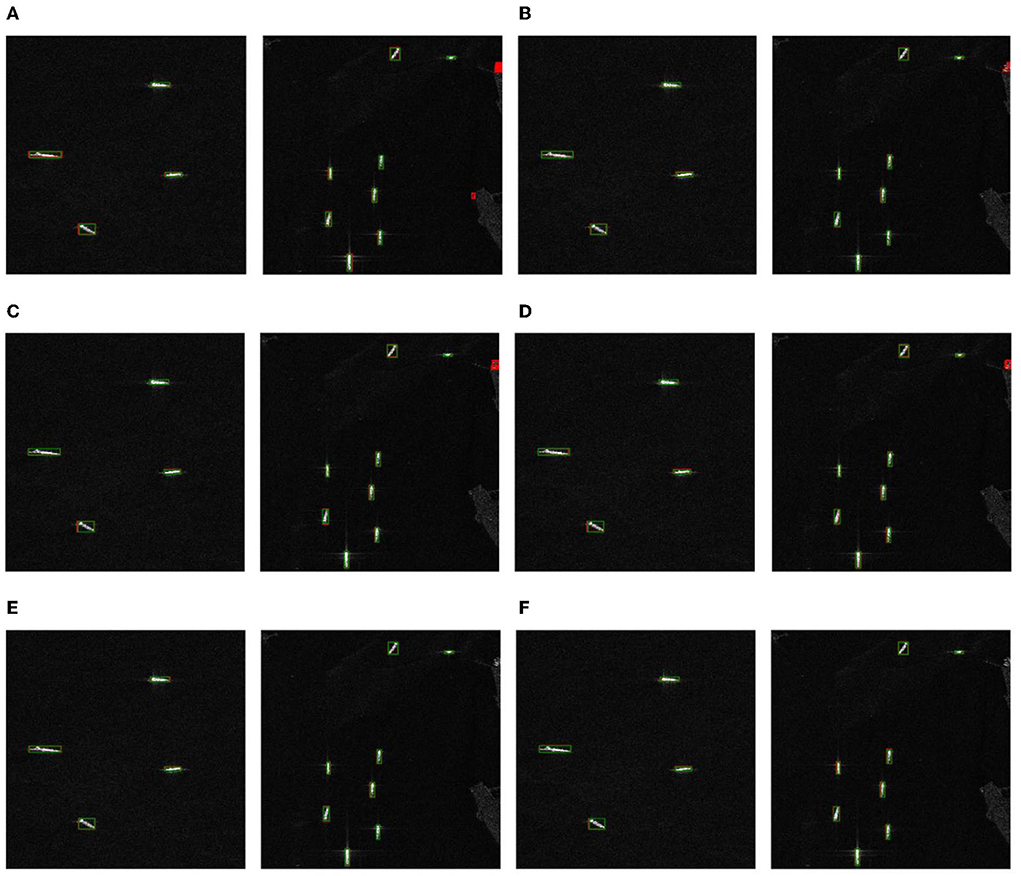
Figure 5. Ship detection results of the target detection methods based on different models in simple far-sea and near-sea scenarios. The SAR images on the left are the far-sea scene, and the SAR images on the right are the near-sea scene. (A) Fast R-CNN. (B) Mask-RCNN. (C) Cascade Mask R-CNN. (D) RetinaNet. (E) FCOS. (F) Proposed model.
Figure 6 shows the ship detection results of the target detection methods based on different models in complex scenarios, including the coastal and port scenarios. In Figure 6A, it is seen that the anchor frame-based Faster R-CNN method is affected by land surface, resulting in poor detection performance; it not only seriously missed detection (the SAR image on the left), but also registered false alarms during the process of small multi-ship detection (the SAR image on the right). In Figures 6B,C, although the Mask R-CNN and Cascade Mask R-CNN methods have better detection performance than that of the Faster R-CNN method, there are fewer missed detections and more false alarms. In Figure 6D, the detection performance of the anchor frame-based RetinaNet method is equally poor with seriously missed detections in complex scenes. In Figures 6E,F, the anchor-free frame FCOS method and the proposed detection method in this paper have better detection performance and fewer false alarms than the anchor-based frame detection algorithms. Notably, the detection performance of the proposed detection method in this paper is better than that of the FCOS method, and more ships could be detected in complex multi-ship scenes (the SAR image on the right).
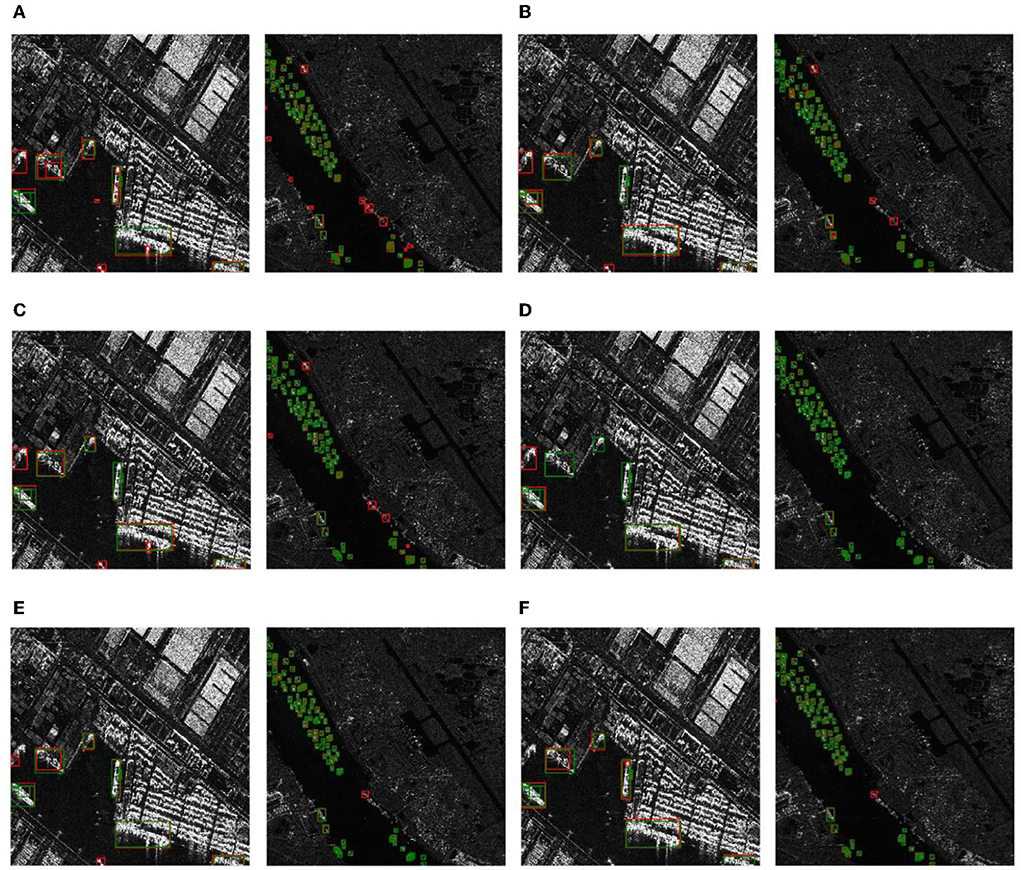
Figure 6. Ship detection results of the target detection methods based on different models in complex scenarios. The SAR images on the left are scenes including the coast, and SAR images on the right are scenes including the port. (A) Fast R-CNN. (B) Mask-RCNN. (C) Cascade Mask R-CNN. (D) RetinaNet. (E) FCOS. (F) Proposed model.
The above experimental results show that the anchor frame-based detection methods are prone to generate many overlapping detection frames. Although the ships can be positioned in the SAR image, they are prone to many false alarms. In contrast, the detection algorithm proposed in this paper can accurately detect ships in various scenarios, and only a small number of false alarms and missed ships occurred, which demonstrates the superiority of the proposed detection method for multiscale ship detection in complex SAR images.
Model size and running speed
Figure 7 shows the model size and running speed of the different detection methods, where the model size is the number of parameters depending on the training, and the running speed is the time required to detect the ship in a single SAR image. For the running speed, two-stage detection methods such as Faster R-CNN, Mask R-CNN, and Cascade Mask R-CNN extract the candidate frame from the SAR image, and then make the secondary correction based on the candidate regions to obtain the prediction result. Although the detection accuracy is higher, it takes a longer time. On the other hand, single-stage detection methods such as RetinaNet and the proposed method directly calculate the input image to generate detection results, so they have faster detection speed. The proposed method is a single-stage detection method based on the key points of the targets, and it does not require additional post-processing steps to remove many repeated anchor frames. Therefore, its detection speed is much higher than that of all comparable detection methods including RetinaNet, which takes only 0.024 s to detect ships in a single SAR image.
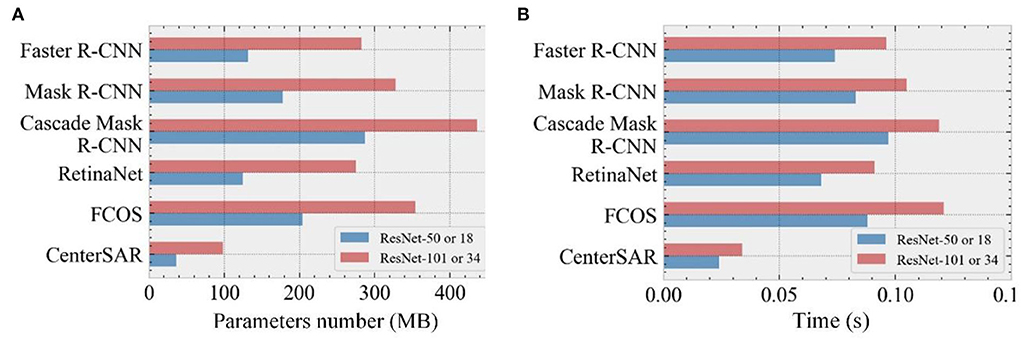
Figure 7. Comparison of different model parameters and running time. (A) Model parameters. (B) Running time.
For the model size, existing detection methods rely on complex backbone networks to extract the image features and incorporate the FPN to enhance the images with multiscale changes for better detection of small ships. However, this not only involves a great amount of computation but also greatly increases the number of model parameters. Since the proposed method uses a more lightweight design, and when ResNet-18 is used as the backbone network, the model size is only 36.3 MB with a detection time of just 0.024 s. This is an improvement in detection efficiency and detection accuracy. As the number of layers in the backbone network is increased, even when the ResNet-34 is used, the detection accuracy of the proposed method is slightly improved, but detection efficiency is compromised, and the amount of the model parameters is increased. Thus, considering the requirements for optimum performance, it is a better choice to use the ResNet-18 as the backbone network in the proposed detection method.
Applicability discussion
Comparison of backbone networks
The ResNet is a commonly used backbone network in target detection task, which can effectively extract the image features for target detection. Since the SAR images are different from the optical images with rich feature information, the model of the proposed detection method is mainly based on the shallower ResNet-18 and ResNet-34 for experimental comparisons. To further explore the impact of different backbone networks on the performance of the proposed detection method, this paper used the ResNet-50 and ResNet-101 with deeper layers and the more lightweight MobileNet (Howard et al., 2017) as the backbone network of the proposed detection method, and then conducted the experimental comparison on the HRSID dataset.
Table 3 shows the comparison results of the proposed method using different backbone networks, including model parameters, running speed, and detection accuracy. From Table 3, it can be seen that when deeper ResNets (such as ResNet50 and ResNet-101) are used in the proposed detection method, the detection performance has a sharp decline, and the AP is reduced by 6.3% compared to that of ResNet-18. The use of deeper backbone networks significantly affected the detection performance of the proposed detection method for ships of various scales, especially for the detection of large-scale ships (the APl was reduced by 14.6%). Thus, using a deeper network does not bring any advantage for the extraction of image features but leads to reduced model performance. In addition, a more complex network structure will significantly increase the model parameters and running time. The parameters of the proposed detection method using ResNet-101 as the backbone network reach 259.1 MB with a running time of 0.086 s, which makes the proposed detection method in this paper gradually lose its advantage in model size and running speed.
The MobileNet uses a depth-wise separable convolutional structure to build a more lightweight deep CNN, which can reduce the model size and improve the model speed while maintaining the model performance. From Table 3, it is seen that using the MobileNet as the backbone network has the advantage of being lightweight, the size of the model parameters is only 29.7 MB, and the running speed is 0.022 s, which is more lightweight and faster than the proposed detection method using the ResNet-18. However, for the detection performance, the value of the AP of the proposed detection method using the MobileNet as the backbone network is only 55.5%, and it is inferior to the results of using the ResNet-18 as the backbone network in the various detection indicators. The experimental results show that although the MobileNet is a lightweight and efficient CNN, it is not suitable as a backbone network for extracting the ship features in the SAR images.
From the results presented in Table 3, it is reasonable and effective to choose ResNet-18 and ResNet-34 as the backbone network of the proposed detection method, which not only has good detection performance but also achieves a good balance in terms of the model size and running speed, which is suitable for complex scenes that require a lightweight model with high efficiency.
Generalization capability analysis
In section “Experimental results and analysis”, the HRSID dataset was used as test SAR images to verify and analyze the performance of the proposed detection method in this paper for ship detection using SAR images. Then, in section “Comparison of backbone networks”, the impact of using different backbone networks on the performance of the proposed detection model was analyzed and it was found that using the simpler ResNet-18 and ResNet-34 had the best performance in ship detection in the SAR images. To further analyze the generalization capability of the proposed detection method, the SAR Ship Detection Dataset (SSDD) was additionally selected to test the proposed detection method. Since the source of the SAR image in the SSDD dataset was similar to the HRSID dataset, the model of the proposed detection method that was trained on the HRSID dataset was directly used to test on the SSDD dataset. The test results are shown in Figure 8.
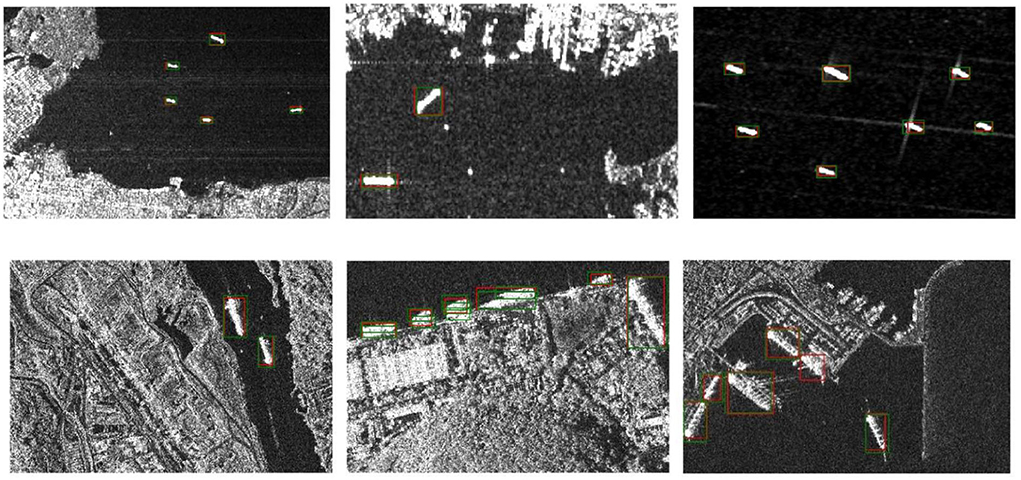
Figure 8. Ship detection results in different scenes based on the SSDD dataset. The green frame is the real detection frame of the ships, and the red frame is the predicted detection frame of the ships.
From Figure 8, the following conclusions can be obtained. First, most ships have been detected correctly, and the predicted detection frames (red) and real detection frames (green) have a high degree of coincidence in the nearshore and near-sea scenes, which indicates the reliability and practicability of the proposed detection method. Second, for the detection scene, including small-scale ships, the proposed detection method can accurately detect every ship, confirming that the model is equally effective and robust for small-scale ship detection. Finally, for the complex nearshore scene, especially in the port area where ships are densely arranged and have a high coincidence and the interference with the land area has a greater impact, the proposed detection method can still achieve a good detection performance. In addition, the phenomenon of missed detection and false alarm may occur only for individual ships, which establishes that the proposed detection method has a good anti-interference performance.
Therefore, the proposed model, trained on the HRSID dataset, can be directly transferred to the SSDD dataset for ship detection and does not require additional training on the SSDD dataset, which demonstrates that the proposed method has good robustness and generalization in complex SAR images.
Conclusion
This paper proposed a lightweight and anchor-free frame ship detection strategy using SAR images. It focused on solving the problem of multiscale ship detection in complex scenes, thereby improving ship detection precision and efficiency. This method obtains the size and position of the ship by predicting the key point information of the target and the attributes of the detection frame (width, height, center point position, and offset), abandoning the conventional idea of generating dense anchor frames. The proposed model, therefore, has the advantages of being lightweight and having high efficiency. The data augmentation method was adopted for the first time in ship SAR images to expand the training samples, and multiscale training was introduced to enhance the generalization of the model.
The experimental results on the HRSID dataset show that the proposed detection method has a good detection ability for small ships and can accurately identify ships of different scales. In addition, the SSDD dataset was used to test the proposed detection method, and the experimental results show the proposed detection model trained based on the HRSID dataset can be directly transferred to the SSDD dataset without additional training. Thus it has a good generalization capability and can detect ships more accurately. The proposed detection method is a single-stage detection method based on the target key points and compared to anchor frame-based detection methods, it is more suitable for ship detection in SAR images with sparse targets, especially in complex scenes (such as the coast and port) with good robustness. The proposed detection method adopts a lightweight structure design and does not require any post-processing procedures during the detection process. It, therefore, has the advantages of having a fast detection speed and fewer model parameters which provide better detection performance and has an important role in terminal application scenarios with high real-time requirements.
Data availability statement
The original contributions presented in the study are included in the article/supplementary material, further inquiries can be directed to the corresponding authors.
Author contributions
HX: experiments, research methods, data processing, writing the original draft, and funding acquisition. GW: writing the original draft, resources, supervision, project administration, and funding acquisition. KX and XJ: guiding experiments. JZ and JC: writing-reviewing. All authors have contributed to the paper and approved the submitted version.
Funding
This work was co-supported by the Guangdong Basic and Applied Basic Research Foundation (No. 2021A1515010768), the Shenzhen Stability Support Program for Universities (No. 2022A08), the National Natural Science Foundation of China (No. 62203465), the Science and Technology Talents Foundation Project of Air Force Early Warning Academy (No. 2021KJY11), and the Guangdong Natural Science Foundation (No. 202214050002344).
Acknowledgments
All authors would like to thank the handling editors and reviewers for their very competent comments and constructive suggestions to improve this paper.
Conflict of interest
The authors declare that the research was conducted in the absence of any commercial or financial relationships that could be construed as a potential conflict of interest.
Publisher's note
All claims expressed in this article are solely those of the authors and do not necessarily represent those of their affiliated organizations, or those of the publisher, the editors and the reviewers. Any product that may be evaluated in this article, or claim that may be made by its manufacturer, is not guaranteed or endorsed by the publisher.
References
Ai, J. Q., Huang, M., Wang, F. F., Yang, X. M., and Wu, Y. L. (2022). Completed local binary patterns feature integrated convolutional neural network-based terrain classification algorithm in polarimetric synthetic aperture radar images. J. Appl. Remote Sens. 16, 014525. doi: 10.1117/1.JRS.16.014525
Ai, J. Q., Luo, Q. W., Yang, X. Z., Yin, Z. P., and Xu, H. (2020). Outliers-robust CFAR detector of gaussian clutter based on the truncated-maximum-likelihood-estimator in SAR imagery. IEEE Trans. Intell. Transp. Syst., 21, 2039–2049. doi: 10.1109/TITS.2019.2911692
Cai, Z. W., and Vasconcelos, N. (2021). Cascade R-CNN: high quality object detection and instance segmentation. IEEE Trans. Pattern Anal. Mach. Intell. 43, 1483–1498. doi: 10.1109/TPAMI.2019.2956516
Chen, L. F., Luo, R., Xing, J., Li, Z. H., Yuan, Z. H., and Cai, X.M. (2022). Geospatial transformer is what you need for aircraft detection in SAR imagery. IEEE Trans. Geosci. Remote Sens. 60, 1–15. doi: 10.1109/TGRS.2022.3162235
Cui, J. Y., Jia, H. C., Wang, H. P., and Xu, F. (2022). A fast threshold neural network for ship detection in large-scene SAR images. IEEE J. Sel. Topics Appl. Earth Observ. Remote Sens. 15, 6016–6032. doi: 10.1109/JSTARS.2022.3192455
Cui, Z. Y., Li, Q., Cao, Z. J., and Liu, N.Y. (2019), Dense attention pyramid networks for multi-scale ship detection in SAR images. IEEE Trans. Geosci. Remote Sens. 57, 8983–8997. doi: 10.1109/TGRS.2019.2923988
Cui, Z. Y., Wang, X. Y., Liu, N. Y., Cao, Z. J., and Yang, J.Y. (2021). Ship detection in large-scale SAR images via spatial shuffle-group enhance attention. IEEE Trans. Geosci. Remote Sens. 59, 379–391. doi: 10.1109/TGRS.2020.2997200
Dai, J. F., Qi, H. Z., Xiong, Y. W., Li, Y., Zhang, G. D., Hu, H., et al. (2017). “Deformable convolutional networks,” in Proceedings of the IEEE International Conference on Computer Vision (ICCV) (Venice: IEEE), 764–773. doi: 10.1109/ICCV.2017.89
Everingham, M., Eslami, S. M. A., Van Gool, L., Williams, C. K. I., Winn, J., and Zisserman, A. (2014). The pascal visual object classes challenge: a retrospective. Int. J. Comput. Vision 111, 98–136. doi: 10.1007/s11263-014-0733-5
Feng, X. S. (2021). A survey on the development of image data augmentation. Comput. Sci. Appl. 11, 370–382. doi: 10.12677/CSA.2021.112037
Girshick, R. (2015). “Fast R-CNN,” in Proceedings of the IEEE International Conference on Computer Vision (ICCV) (Santiago, CA: IEEE), 1440–1448. doi: 10.1109/ICCV.2015.169
Guo, H. Y., Yang, X., Wang, N. N., and Gao, X.B. (2021). A CenterNet++ Model for ship detection in SAR images. Pattern Recognit. 112, 107787. doi: 10.1016/j.patcog.2020.107787
He, K. M., Gkioxari, G., Dollár, P., and Girshick, R. (2017). “Mask R-CNN,” in Proceedings of the IEEE International Conference on Computer Vision (ICCV) (Venice: IEEE), p. 2980–2988, doi: 10.1109/ICCV.2017.322
He, K. M., Zhang, X. Y., Ren, S. Q., and Sun, J. (2015). Spatial pyramid pooling in deep convolutional networks for visual recognition. IEEE Trans. Pattern Anal. Mach. Intell. 37, 1904–1916. doi: 10.1109/TPAMI.2015.2389824
He, K. M., Zhang, X. Y., Ren, S. Q., and Sun, J. (2016). “Deep residual learning for image recognition,” in Proceedings of the IEEE Conference on Computer Vision and Pattern Recognition (CVPR) (Las Vegas, NV: IEEE), 770–778. doi: 10.1109/CVPR.2016.90
Howard, A. G., Zhu, M. L., Chen, B., Kalenichenko, D., Wang, W. J., Weyand, T., et al. (2017). MobileNets: efficient convolutional neural networks for mobile vision applications. CoRR. doi: 10.48550/arXiv.1704.04861
Hu, C. H., Chen, C., He, C., Pei, H., and Zhang, J. X. (2019). SAR detection for small target ship based on deep convolutional neural network. J. Chin. Inertial Techn. 27, 397–405. doi: 10.13695/j.cnki.12-1222/o3.2019.03.018
Jiao, J., Zhang, Y., Sun, Hao., Yang, X., Gao, X., Hong, W., Fu, K., and Sun, X. (2018). A densely connected end-to-end neural network for multiscale and multiscene SAR ship detection. IEEE Access 6, 20881–20892. doi: 10.1109/ACCESS.2018.2825376
Kahar, S., Hu, F. M., and Xu, F. (2022). Ship detection in complex environment using SAR time series. IEEE J. Sel. Topics Appl. Earth Observ. Remote Sens. 15, 3552–3563. doi: 10.1109/JSTARS.2022.3170361
Karvonen, J., Gegiuc, A., Niskanen, T., Montonen, A., Buus-Hinkler, J., and Rinne, E. (2022). Iceberg detection in dual-polarized C-band SAR imagery by segmentation and nonparametric CFAR (SnP-CFAR). IEEE Trans. Geosci. Remote Sens. 60, 1–12. doi: 10.1109/TGRS.2021.3070312
Li, Q., Min, R., Cui, Z. Y., Pi, Y. M., and Xu, Z.W. (2019). “Multiscale ship detection based on dense attention pyramid network in sar images,” in Proceedings of the IEEE International Geoscience and Remote Sensing Symposium (IGARSS), 5-8 (Yokohama: IEEE). doi: 10.1109/IGARSS.2019.8899062
Li, T., Peng, D. L., and Shi, S.N. (2022). Outlier-robust superpixel-level CFAR detector with truncated clutter for single look complex SAR images. IEEE J. Sel. Topics Appl. Earth Observ. Remote Sens. 15, 5261–5274. doi: 10.1109/JSTARS.2022.3187516
Lin, T.-Y., Dollár, P., Girshick, R., He, K. M., Hariharan, B., and Belongie, S. (2017). “Feature pyramid networks for object detection,” in Proceedings of the IEEE/CVF Conference on Computer Vision and Pattern Recognition (CVPR) (Honolulu: IEEE), 936–944, doi: 10.1109/CVPR.2017.106
Lin, T.-Y., Goyal, P., Girshick, R., He, K. M., and Dollár, P. (2020). Focal loss for dense object detection. IEEE Trans. Pattern Anal. Mach. Intell. 42, 318–327. doi: 10.1109/TPAMI.2018.2858826
Lin, T. Y., Maire, M., Belongie, S., Hays, J., Perona, P., Ramanan, D., et al. (2014). “Microsoft COCO: common objects in context,” in Proceedings of the European Conference on Computer Vision (ECCV) (Zurich: Springer), 740–755. doi: 10.1007/978-3-319-10602-1_48
Liu, L., Ouyang, W., Wang, X. G., Fieguth, P., Chen, J., Liu, X. W., et al. (2020). Deep learning for generic object detection: a survey. Int. J. Comput. Vis. 128, 261–318. doi: 10.1007/s11263-019-01247-4
Miao, T., Zeng, H. C., Yang, W., Chu, B., Zou, F., Ren, W. J., et al. (2022). An improved lightweight retinanet for ship detection in SAR images. IEEE J. Sel. Topics Appl. Earth Observ. Remote Sens. 15, 4667–4679. doi: 10.1109/JSTARS.2022.3180159
Paszke, A., Gross, S., Massa, F., Lerer, A., Bradbury, J., Chanan, G., et al. (2019). “Pytorch: an imperative style, high-performance deep learning library,” in Proceedings of the Annual Conference on Neural Information Processing Systems (NeurIPS) (Vancouver: NeurIPS), 8024–8035.
Redmon, J., Divvala, S., Girshick, R., and Farhadi, A. (2016). “You only look once: unified, real-time object detection,” in Proceedings of the IEEE Conference on Computer Vision and Pattern Recognition (CVPR) (Las Vegas, NV: IEEE), 779–788, doi: 10.1109/CVPR.2016.91
Redmon, J., and Farhadi, A. (2018). YOLOv3: an incremental improvement. CoRR. doi: 10.48550/arXiv.1804.02767
Ren, S. Q., He, K. M., Girshick, R., and Sun, J. (2017). Faster R-CNN: towards real-time object detection with region proposal networks. IEEE Trans. Pattern Anal. Mach. Intell. 39, 1137–1149. doi: 10.1109/TPAMI.2016.2577031
Shi, Q. Q., Li, W., Zhang, F., Hu, W., Sun, X., and Gao, L.R. (2018). Deep CNN with multi-scale rotation invariance features for ship classification. IEEE Access 6, 38656–38668. doi: 10.1109/ACCESS.2018.2853620
Song, T., Kim, S., and Sohn, K. (2022). Shape-robust SAR ship detection via context-preserving augmentation and deep contrastive roi learning. IEEE Geosci. Remote Sens. Lett. 19, 1–5. doi: 10.1109/LGRS.2022.3190855
Souaidi, M., and Ansari, M.E. (2022). A new automated polyp detection network MP-FSSD in WCE and colonoscopy images based fusion single shot multibox detector and transfer learning. IEEE Access 10, 47124–47140. doi: 10.1109/ACCESS.2022.3171238
Sun, X., Wang, Z. R., Sun, Y. R., Diao, W. H., Zhang, Y., and Fu, K. (2019). Air-sarship-1.0: high-resolution SAR ship detection dataset. J.Radars 8, 852–862. doi: 10.12000/JR19097
Tang, J. X., Cheng, J. D., Xiang, D. L., and Hu, C.B. (2022). Large-difference-scale target detection using a revised bhattacharyya distance in SAR images. IEEE Geosci. Remote Sens. Lett. 19, 1–5. doi: 10.1109/LGRS.2022.3161931
Tian, Z., Shen, C. H., Chen, H., and He, T. (2019). “FCOS: fully convolutional one-stage object detection,” in Proceedings of the IEEE/CVF International Conference on Computer Vision (ICCV) (Seoul: IEEE), 9626–9635. doi: 10.1109/ICCV.2019.00972
Wang, C.-Y., Mark Liao, H.-Y., Wu, Y.-H., Chen, P.-Y., Hsieh, J.-W., and Yeh, I.-H. (2020). “CSPNet: a new backbone that can enhance learning capability of CNN,” in Proceedings of the IEEE/CVF Conference on Computer Vision and Pattern Recognition Workshops (CVPRW) (Seattle: IEEE), 1571–1580, doi: 10.1109/CVPRW50498.2020.00203
Wang, S. Y., Gao, X., Sun, H., Zheng, X. W., and Sun, X. (2017). An aircraft detection method based on convolutional neural networks in high-resolution SAR. images. J. Radars 6, 195–203. doi: 10.12000/JR17009
Wang, X. L., and Chen, C.X. (2017). Ship detection for complex background SAR images based on a multiscale variance weighted image entropy method. IEEE Geosci. Remote Sens. Lett. 14, 184–187. doi: 10.1109/LGRS.2016.2633548
Wang, Y. Y., Wang, C., Zhang, H., Dong, Y. B., and Wei, S. S. (2019). Automatic ship detection based on retinanet using multi-resolution gaofen-3 imagery. Remote Sens. 11, 531. doi: 10.3390/rs11050531
Wei, S. J., Zeng, X. F., Qu, Q. Z., Wang, M., Su, H., and Shi, J. (2020). HRSID: a high-resolution SAR images dataset for ship detection and instance segmentation. IEEE Access 8, 120234–120254. doi: 10.1109/ACCESS.2020.3005861
Wu, X., Zhang, Z. J., Zhang, W. C., Yi, Y. N., Zhang, C. R., Xu, Q., et al. (2021). A convolutional neural network based on grouping structure for scene classification. Remote Sens. 13, 2457. doi: 10.3390/rs13132457
Xie, H. T., An, D. X., Huang, X. T., and Zhou, Z.M. (2016). Efficient raw signal generation based on equivalent scatterer and subaperture processing for one-stationary bistatic SAR including motion errors. IEEE Trans. Geosci. Remote Sens. 54, 3360–3377. doi: 10.1109/TGRS.2016.2516046
Xie, H. T., Hu, J., Duan, K. Q., and Wang, G.Q. (2020). High-efficiency and high-precision reconstruction strategy for P-Band ultra-wideband bistatic synthetic aperture radar raw data including motion errors. IEEE Access 8, 31143–31158. doi: 10.1109/ACCESS.2020.2971660
Xie, H. T., Jiang, X. Q., Hu, X., Wu, Z. T., Wang, G. Q., and Xie, K. (2022). High-efficiency and low-energy ship recognition strategy based on spiking neural network in SAR images. Front. Neurorobot. 970832, 1–16. doi: 10.3389/fnbot.2022.970832
Xie, H. T., Shi, S. Y., An, D. X., Wang, G. X., Wang, G. Q., Xiao, H., et al. (2017). Fast factorized backprojection algorithm for one-stationary bistatic spotlight circular SAR image formation. IEEE J. Sel. Topics Appl. Earth Observ. Remote Sens. 10, 1494–1510. doi: 10.1109/JSTARS.2016.2639580
Xu, C., He, Z. S., and Liu, H. C. (2022). An effective method for small targets detection in synthetic aperture radar images under complex background. IEEE Access 10, 44224–44230. doi: 10.1109/ACCESS.2022.3169501
Yang, G., Lei, J., Xie, W. Y., Fang, Z. M., Li, Y. S., Wang, J. X., et al. (2022). Algorithm/hardware codesign for real-time on-satellite CNN-based ship detection in SAR imagery. IEEE Trans. Geosci. Remote Sens. 60, 1–18. doi: 10.1109/TGRS.2022.3208616
Yang, L., Su, J., Huang, H., and Li, X. (2020). SAR ship detection based on convolutional neural network with deep multiscale feature fusion. Acta Opt. Sin. 40, 132–140. doi: 10.3788/AOS202040.0215002
Zeiler, M. D., Taylor, G. W., and Fergus, R. (2011). “Adaptive deconvolutional networks for mid and high level feature learning,” in Proceedings of the IEEE International Conference on Computer Vision (ICCV) (Barcelona: IEEE), 2018–2025. doi: 10.1109/ICCV.2011.6126474
Zhang, G., Li, Z., Li, X. W., Yin, C. B., and Shi, Z.K. (2020). A novel salient feature fusion method for ship detection in synthetic aperture radar images. IEEE Access 8, 215904–215914. doi: 10.1109/ACCESS.2020.3041372
Zhou, X. Y., Wang, D. Q., and Krähenbühl, P. (2020). “CenterNet: objects as points,” in Proceedings of the European Conference on Computer Vision (ECCV) (Zurich: Springer), 474–490. doi: 10.1007/978-3-030-58548-8_28
Keywords: multiscale ship detection, synthetic aperture radar (SAR), SAR image, improved CenterNet, lightweight, anchor-free frame
Citation: Xie H, Jiang X, Zhang J, Chen J, Wang G and Xie K (2022) Lightweight and anchor-free frame detection strategy based on improved CenterNet for multiscale ships in SAR images. Front. Comput. Sci. 4:1012755. doi: 10.3389/fcomp.2022.1012755
Received: 05 August 2022; Accepted: 01 September 2022;
Published: 03 November 2022.
Edited by:
Long Wang, University of Science and Technology Beijing, ChinaReviewed by:
Lepintg Chen, National University of Defense Technology, ChinaWu Wang, China Aerodynamics Research and Development Center, China
Copyright © 2022 Xie, Jiang, Zhang, Chen, Wang and Xie. This is an open-access article distributed under the terms of the Creative Commons Attribution License (CC BY). The use, distribution or reproduction in other forums is permitted, provided the original author(s) and the copyright owner(s) are credited and that the original publication in this journal is cited, in accordance with accepted academic practice. No use, distribution or reproduction is permitted which does not comply with these terms.
*Correspondence: Kai Xie, eGllazhAbWFpbC5zeXN1LmVkdS5jbg==; Guoqian Wang, MzAxMzQ1MzdAcXEuY29t
†These authors have contributed equally to this work and share first authorship