 Kimberly Tam
 Barbara Chang
 Rory Hopcraft
 Kemedi Moara-Nkwe3
- 1Maritime Cyber Threats Research Group, University of Plymouth, Plymouth, United Kingdom
- 2Verisk EES (AIR Worldwide), San Francisco, CA, United States
- 3Warwash Solent University, Southampton, United Kingdom
Modern Cyber-Physical Systems (CPS) show increasing levels of automation, intelligence, and optimization capabilities. Both creators and adopters of these technologies emphasize the benefits: safety, cost-savings, and efficiencies. Existing literature under-represents the potential risks associated with the adoption of individually complex systems and interconnected Systems-of-Systems (SoS). Research primarily focuses on the potential benefits, and many recent deployments of new technology have received little rigorous scrutiny. The studies that do explore issues, such as cyber-attacks on CPS, often lack an analysis of the potential impact based on the way cyber-physical risks are communicated. Due to high levels of interaction and inter dependencies in CPS, disruptions in one sector can propagate to other sectors. The initial economic impacts may start locally but will often lead to global effects if response mechanisms prove insufficient. This case study aims to address a research gap in modeling, and quantifies how a cyber-attack, with physical consequences, can affect local and global trade if a single maritime port is affected. Additionally, to further understanding of the public's perception of risk about cyber-attacks and its emergent threat to global supply chains, members of the public were asked to react to the potential econometric losses. This study produced the five-part CyPEM (Cyber Physical Econometric Model) that has the capability to translate a cyber-attack to an econometric loss. Each framework part may also be swapped out to analyze different CPS. With this, we discovered a gap in the perceptions of cyber-physical risk regarding maritime transport.
1. Introduction
Emerging technologies, such as the Internet of Things (IoT), digital twins, 5G, and Artificial Intelligence (AI), are becoming increasingly common across all industries. The maritime sector is no exception, adopting new technologies across offices, ships, seaports, offshore structures, and more. As Boyson (2014) states, supply chains are also using more Information Technology (IT), which introduces digital vulnerabilities. The convergence and digitization of IT and Operational Technology (OT) drive transformation into digital supply routes and maritime operations, which expand cyber-threat surfaces. Nation-state actors and organized crime also have the resources and motivation to trigger a cyber-attack on Critical National Infrastructure (CNI), i.e., large scale Cyber-Physical Systems.
1.1. Maritime cyber-security
Events from 2019 to 2023 have highlighted to the public how shipping disruptions can affect global supply chains. For example, in 2020, the Suez canal incident demonstrated how critical shipping is to the movement of goods and fuel (Ramos et al., 2021). Global demand has increased marine traffic, and COVID-19 lock-downs (Doumbia-Henry, 2020) have further stressed supply chains and led to congestion (e.g., Los Angeles backlogs reported by Royster, 2022). Larger ships with more capacity continue to be built, but these ships face challenges maneuvering in existing channels and seaports, which lowers safety margins during cyber-incidences. Today's ships are also more heavily instrumented, which again increases the threat surface for cyber-attacks. In United States Coast Guard (2022) reported a 68% increase in marine cyber-incidents.
While lower carbon emissions and improved safety can be achieved with new and developing technology, the concern is that technological advances could result in new digital vulnerabilities. Such vulnerabilities could be introduced through increased connectivity, the addition of third party devices, and/or software, and remain a valid concern across all critical national infrastructure (Lewis, 2019). Future shipping currently highlights the increased use of and technological dependency of autonomous ports and ships. Not only is there a concern with full autonomy, but allowing remote operation introduces vulnerabilities. Remote operation/access is currently an intermediate solution when the aim is autonomous CPS but full autonomy cannot be supported (Yağdereli et al., 2015; Höyhtyä et al., 2017). Studies have demonstrated that the digitization in shipping includes productivity gains (Poulis et al., 2020), physical safety (Plaza-Hernández et al., 2021), lower carbon footprints (Larrazabal and Peñas, 2016; Peng et al., 2020), higher efficiency at all levels, lower costs, and flexibility. However, other research shows that there are vulnerabilities in large CPS sensor networks (El-Rewini et al., 2020) and communication systems (e.g., satellite Manulis et al., 2021).
Recent studies by Larsen and Lund (2021a) and Tam and Jones (2019b) show that the cyber risks within marine and maritime technology are present and growing as new solutions are adopted. For example, Murray (2022) reported that, in 2019, the US Coast Guard detected a cyber intrusion on a large container ship heading to New York. Global Navigation Satellite Systems (GNSS), and other types of spoofing, have also been reported globally, with noticeable activity in the Black Sea, off the coast of Russia, and in Asia (Jacobs, 2021). Glover (2022) reported that the Port of London Authority was hit by a possibly politically motivated cyber-attack. These incidences illustrate that the integration of digital technologies into critical operations can introduce significant cyber-physical vulnerabilities that could lead to larger global disruptions. Cyber-physical disruptions are a growing global issue that affect critical assets, with a number of threat actors that have an interest in maritime transportation and Naval warfare (Jacobs, 2021). With the maritime sector's place in the global shipping chain and its acceleration into digitization, there are new potential impacts that need to be understood and quantified.
We are interested in understanding the awareness of those working in this sector. According to a survey targeting mariners within (Wingrove, 2021), asking “When do you believe the first port will experience significant physical damage caused by a cyber security incident,” around 64% of respondents thought it had already happened, while 27% said between 1 and 5 years, only 6% said more than 5 years, and only 3% thought ports would never be significantly damaged by a cyber security incident. Respondents were asked a similar question pertaining to ships. Of the participants, 56% thought a merchant vessel had already experienced significant physical damage caused by a cyber security incident, 34% thought it would happen in 1–5 years, 7% in more than 5 years, and just 3% thought it would never happen.
1.2. Cyber-physical threat to supply chains
Considering the existing maritime cyber-security threat and the importance of shipping to modern transportation, it is critical to understand how threats in the maritime sector can affect other areas. With the rate of technological growth, there is a real possibility that a similar increase in disruptive events purposely triggered by a malicious cyber-attack will occur. This likelihood is supported by the recent (United States Coast Guard, 2022) report and academic research. It is important to understand the potential scale of these types of disruptions, to understand the scale of threat.
Economic and insured losses, stemming from supply chain disruptions, are some of the top emerging risks for global corporations and insurers (3plcentral, 2022). While there are only a few studies that have studied the effects of a cyber-attack on ports, it is possible to infer consequences from related events. Major natural catastrophes, such as the Tohoku earthquake and Thailand floods in 2011, resulted in a large number of business interruption insurance claims, with the majority of these claims coming from areas outside of the directly affected regions (Mukherjee and Hastak, 2018).
As current cyber defense capabilities are unlikely to prevent all cyber-physical catastrophes, it is crucial to quantify and understand the effect of such events. While detecting and mitigating cyber-threats is also a critical topic, that subject is outside the scope of this paper. To understand the extent of cyber-physical threats, this paper focuses on how major supply chain disruptions affect the target of the attack and the rest of the associated supply chain. This is presented in classical graph format of “nodes,” representing assets and “edges,” which connect nodes. When considering a cyber-physical incident, a node can have physical, econometric, and digital properties.
A physical node, which in this study represents the Port of Valencia (Spain), is geographically adjacent to other countries connected by rail/car. However, as shown Section 3, because of industrial supply chains, it is possible that countries physically distant from Spain may suffer a heavier econometric impact than those that are geographically close. A node can also have digital properties, since a port or a ship may have a direct satellite connection to another system that is not directly geographically or supply chain related. In this paper, when discussing networks, supply chains, and nodes, the nomenclature differentiates between geographical nodes and industry/supplier nodes.
This paper highlights the level of inter-dependencies that exists in today's global supply chains. The econometric model (EM) presented in this paper is one of the first of its kind, as it allows organizations to transition from a qualitative assessment to a more robust quantitative treatment of supply chain risk. Integrating the EM with MaCRA's dynamic cyber-physical risk model (published in Tam and Jones, 2019a), the combined model allows a user to derive quantitative modeled losses to improve understanding of the global supply chain's cyber-physical risks. This knowledge can lead to increased cyber-resilience and system trustworthiness.
The world's manufacturing supply networks are susceptible to disruption by cyber-attack and impact can propagate through the network. The disruption at one node of a complex supply chain can physically and economically affect adjacent, preceding, and succeeding nodes with negative impacts. Cyber-attacks using IT/OT networks and computing systems can cause short-term losses, Denial of Service (DoS), long-term equipment damage, loss of customer's trust, delays in shipment, and loss of strategic advantages due to leaks and compromised sensitive information (Zhong and Nof, 2019). Reyes Levalle and Nof (2015) and Levalle and Nof (2017) show that a digital cyber-attack can have real physical consequences of unfulfilled demands in supply transportation and manufacturing.
1.3. Aim of this study
This study considers cyber-attacks as an external disruption to the supply chain, with attacks executed either by a third party or potentially executed by insider threats. The cyber-triggered disruptions can interrupt the production of raw materials or intermediate products depending on how and which system is compromised. Lost production may occur when infrastructure components, or the wider SoS (Boardman and Sauser, 2006), are damaged or destroyed. This can negatively impact transportation, manufacturing, and the final end-product. Both Day (2014) and Gong et al. (2014) give realistic examples of this type of disruption. When considering the reach and impact of maritime transportation and sector, the econometric impact of both short and long-term cyber-triggered disruptions can be extensive.
In addition, this paper seeks to understand the disruption in the global supply network caused by a cyber-physical event by using a maritime-based case study with real data. This study looks past the physical node where the attack originated (i.e., seaport) and then analyzes the resulting shortage disruptions downstream regarding raw materials and intermediate components. We show how a single cyber-attack could disrupt activities downstream, similar to the study in Seok et al. (2016), and illustrate the resulting econometric effects on revenues across different countries, similar to the study in Nguyen and Nof (2019a).
The intended audience for this approach are stakeholders interested in assessing regional and/or global exposure for contingent business interruption losses and (re)insurance companies. The approach is illustrated using a specific scenario based on the Port of Valencia and maritime transportation but generalizes. Any CPS can be defined using this framework. One audience for the framework's outputs is the general public, to raise awareness of cyber-attack and its physical and economic impacts, to engender discussion and solutions.
It is possible to engage the public and the broader sector to recognize the amount of resource that should be invested to protect against cyber-related disruptions, which are not only at the level of “data theft,” but foreshadow large-scale economic impacts on global supply chains. Section 2 covers the necessary background to discuss all parts of the maritime-cyber econometric model in Section 3. This section then discusses the possible effects and the public's perception of the findings. Due to the specificity of the multiple subject matters, a table of key abbreviations is listed in Table 1.
Table 1. Key abbreviations in order of appearance.
2. Background
Using a realistic cyber-attack chain (Tam et al., 2022), this case study is based on a European seaport in Spain and a class of container ship that routinely docks at the same port. Both port and ship are modeled from real-world data, from their physical attributes (e.g., dimensions) to their digital attributes (e.g., individual IT/OT systems). The case study focuses on the effect of an attack on a single seaport, although the framework could be used for any node in the supply chain, if the data and models exist, as Section 3 explains.
Historically, seaports have been vital economic engines that support the growth of economies locally and internationally. In this case study, the Port of Valencia generates nearly 51% of Spain's Gross Domestic Product (GDP) and is a significant player in European and global supply chains that connect Asia and the Americas. Any disruption to this port would result in a direct economic loss to Spain, but additionally, the framework will show how the impact can ripple through different physical nodes (e.g., countries) and value chains. The purpose of the framework is to quantify the effect of this cyber-physical attack at the node of origin (Spain) and its indirect economic loss to other countries' economies.
Existing literature on Supply Chain Risk Management (SCRM) provides numerous frameworks and models for types and sources of risks as well as mitigation strategies. Nevertheless, as demonstrated in Hahn (2020), little is known about supply chain cyber-risks in an Industry 4.0 technology landscape. CPS typically consist of multiple components and subsystems that can be classified as both physical (i.e., interacts with the physical world) and cyber (i.e., interacts with the digital world). With interconnected relationships between these layers and subsystems, CPS are often modeled as complex networks of connected components represented as nodes and their relationships represented as connecting edges. An example of this can be seen in Figure 1 and is explored further in later sections.
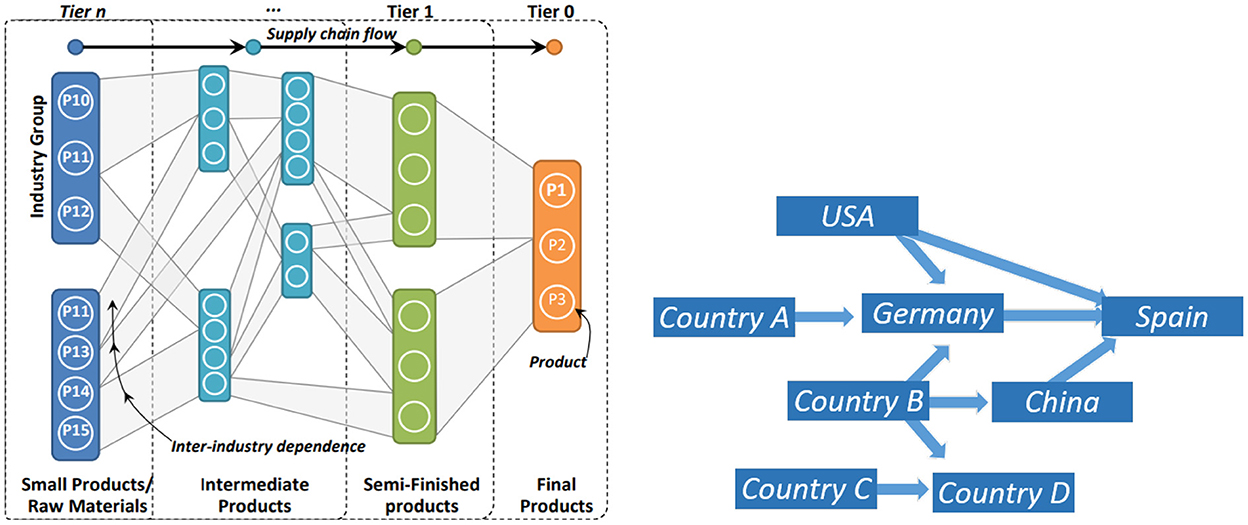
Figure 1. Examples of product dependencies [(A) on left] and trade networks [(B) on the right] which are combined for the CyPEM hybrid network.
The next paragraphs discuss related areas of work to establish the state-of-the-art for cyber-physical risk and how the proposed Econometric Model (EM) (Lloyd's of London and Verisk EES, 2019) as applied differs from previous work. This review is not exhaustive since many extensive and well-established subjects are discussed, and it is only intended to provide an overview of works relevant to cyber-physical disruptions with respect to the maritime nodes of a supply chain.
In Nguyen and Nof (2019b), the authors define disruptions in a cyber-physical CPS as “any unexpected, and often negative” change to any entity within the CPS network, “including but not limited to: the nodes, attributes of the nodes, edges, and attributes of the edges.” While this case study considers a purely digital-attack that causes physical delay, there are similar studies about the propagation of disruption, instead of the trigger. For example, Zhang et al. (2014) researches road traffic networks, with disruptions caused by traffic density. Others, such as Zhong and Nof (2015), focus on the normal or failure status of a CPS's nodes and edges. This focus is useful for understanding some cyber-physical risks, but not all, as an outcome could be more than “working” or “failure.”
It is important to model the nodes and edges affected by any kind of disruption and propagate those disruptions to its neighboring node(s) and edge(s). With the escalation of cyber threats and progressive globalization of supply chains, it is expected that a noticeable increase in cyber-related port disruption economic losses will occur. Many organizations do not have full visibility into their supply chain networks, which results in partially mapped networks that do not accurately represent the end-to-end life cycle of a product. Using a partially mapped network for econometric modeling would dangerously underestimate their vulnerability to supply chain risk; therefore, CyPEM uses a fully quantitative model with comprehensive nodal network mapping.
The CyPEM approach uses acyclic graphs to model networks, which is a common practice when modeling supply chains (e.g., Magnanti et al., 2006; Ghadimi et al., 2020). An acyclic model uses the nodes to represent stages of the production and/or assembly operations of its components. The arcs within this network of nodes specifies the flow of components, the source nodes correspond to supplies from suppliers, and the sink nodes correspond to finished goods. More importantly, the authors are interested in the edges connecting nodes that correspond to transportation to/from and within a seaport. These are the edges that will be disrupted as part of a cyber-physical attack to determine the overall effects on the affected arcs and the wider global supply chain network.
Other studies have also used spanning tree approaches (e.g., Syarif et al., 2002; Lam and Ip, 2012; Ghadimi et al., 2020). The spanning tree method is generally used to optimize existing supply chains. However, the focus of CyPEM is to calculate the econometric impact of an existing supply chain network. For impacts of a few days, a static graph is sufficient. However, if future work (see Section 5) aims to make supply chains more robust against cyber-physical disruptions, a spanning tree model could be used. Another modeling method includes a circular supply chain (i.e., using a cyclic network). A cyclic network may be more appropriate in the future since there may be more incentives for industries to be sustainable and re-use materials. In a cyclic network, instead of having set source and sink nodes as described in an acyclic network, sinks can also be sources by reusing materials, which create circles within the graphs, as demonstrated in Geissdoerfer et al. (2018).
Disruptions within a CPS, like maritime transportation, can propagate between the physical layers (e.g., hardware, machinery, people) as well as the cyber layer (e.g., software, data sharing, communication). The propagation of disruptions through various connected CPS layers occur because of high interconnections and inter-dependency. Much of this has also been promoted through maritime IT and OT convergence, as discussed in Meland et al. (2021). In addition to IT and OT, the human element on-ship and at port has an effect on cyber-physical risks (Tam and Jones, 2019b). Because of this, risk factors range from physical to cyber and also static to dynamic.
Previous work on risk from Ritchie and Marshall (1993), Kersten et al. (2007), and Christopher and Peck (2004) propose three groups of risk factors: environmental, internal, and organizational. However, since these three groups are becoming increasingly digitized, cyber risks can arise from all three. The approach in this paper's framework uses a more dynamic cyber-physical approach to risk using Tam and Jones (2019a). To better understand the potential econometric loss from a cyber-physical attack causing delay, CyPEM is a dynamic framework that allows the user to look at a range of potential delays and corresponding economic losses.
Lastly, despite studies on perceived risks for cyber-triggered delays to supply chains, there is currently little to no work on comparing perceived risk to the actual risk (Freudenburg, 1988). This paper is one of the few studies to actually use an econometric model, CyPEM, to present quantified results to the public and measure the change in their understanding of cyber-risk regarding global supply chains.
3. Framework
This study uses a novel five-step framework (see Figure 2), where each step can be exchanged to provide analytics for different supply chain arcs or sectors. To communicate quantifiable cyber-physical risk to a wide audience, the seaport scenario presented must be believable and comprehensible. By analyzing the Port of Valencia and modeling its surrounding supply chain network, CyPEM produced quantified results and graphics for econometric losses due to a cyber-physical incident. In this scenario, nodes represent a nexus of linkages for countries' manufacturers, and edges represent the paths of those goods (raw materials to intermediate and final products). In the CyPEM CPS network, nodes can represent countries, ports, factories, storage facilities, and edges are implicitly modeled as the transportation paths between countries or products.
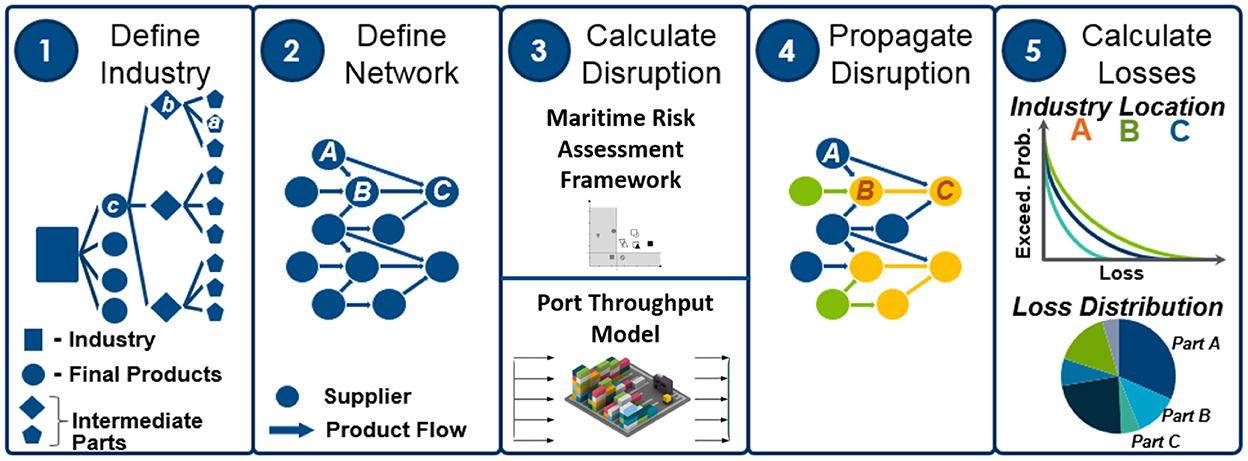
Figure 2. Five stages of the framework overview with inputs and outputs (1) Define Industry, intermediate parts, and final products (2) Define Network where nodes are suppliers and edges are product/part flows (3) Calculate Disruption using cyber-physical risk assessment and a port throughput model (4) Propagate Disruption in the wider network from part 2 and (5) Calculate the industry loss and loss distributions.
To address challenges inherit with real-world data and supply chains, the framework uses a “hybrid” modeling method that takes partially mapped supply chains and uses predictive analytics to infill the missing parts. Even when working directly with the Port of Valencia, there is missing data due to the complexity of supply chains. The approach avoids the underestimation of risk by capturing hidden vulnerabilities and correlations stemming from the unseen or unknown parts of a given supply chain. This supply chain risk model is the first of its kind, as it is a quantitative model that incorporates:
1. Global trade patterns and supply networks (United Nations Commodity Trade statistic data)
2. Product flow mapping (United Nations Commodity Trade statistic data and EM framework)
3. Correlation across different product groups and industries (e.g., automotive, consumer electronics)
The combined CyPEM stages give public and private organizations the ability to stress test their supply chain resiliency by estimating the cost and time to recover after different cyber-attack scenarios. Stages of CyPEM include quantitative risk models that emulate major components of global supply chains, and their uncertainties, to estimate time delays and economic losses resulting from contingent business interruption (CBI). Downtime is measured on the order of days or hours caused by cyber-physical disruptions to a given supply chain node. In this paper, CyPEM is used to assess potential economic impacts across different value chains due to various cyber-physical attacks on a ship entering the Port of Valencia. Together, with a dynamic cyber-physical risk model (see Figure 2), this framework is a step forward with respect to traditional qualitative supply chain risk assessment methods.
Although some stages are pre-calculated and cannot be run in real time, (for example, the hybrid network in Figure 3), this framework has been designed to provide some dynamic automation when calculating cyber-physical econometric losses. If some stages were to be substituted for other models (e.g., change acyclic network to cyclic, or switch maritime cyber risk model for an aviation cyber risk model), some of the built in automation may not be available depending on the CPS models.
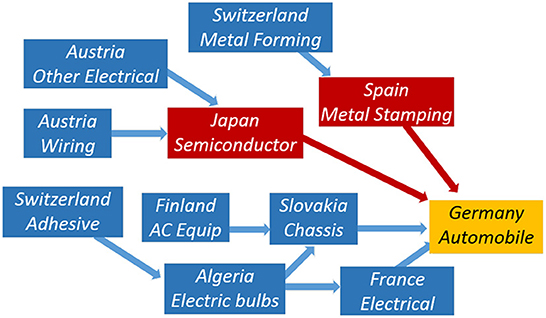
Figure 3. Hybrid network merging product dependency and UN commodity Trade statistic data and disruption from Figure 1.
To enable CyPEM to be more dynamic and useful for understanding the complexities of the cyber-physical issues in supply chains, some of the cyber-attack scenario variables can be altered “live” during various stages to explore a range of econometric outcomes. As shown in the results section, the Port of Valencia cyber-physical attack scenario is used to compute a range of econometric losses, based on the severity of the attack and the duration of the delay (i.e., 3, 5, and 7 days). This tool allows users to proactively manage supply chain risks by anticipating inter-dependencies and correlations in supply chains and the effects by cyber-triggered disruptive events before they can occur. The quantified results are also critical for measuring gaps in perceived vs. actual risk as understood by experts and lay people. While industry experts can use this tool to ascertain this themselves, this study is also interested in the opinions of the public who are less likely to seek this understanding.
3.1. Product dependency
Stages one and two of CyPEM are based on acyclic network graphs using United Nations (UN) Commodity Trade Statistics and EM product flows. To demonstrate product dependencies built from basic and intermediate products (i.e., Tiern - Tier1) to final product (i.e., Tier0), the authors present a simple example in Figure 1A. A larger schematic, more representative of the actual network used to calculate the econometric losses of a cyber-physical attack on the Port of Valencia, is shown in Figure 4. Once the product dependencies are established in an acyclic network, the next step is to create a network to include the trade data using the trade statistics from the UN Commodity Trade Statistics. This method implicitly includes storage and transportation nodes, in addition to the supply chain flow of components based on inter- and intra-industry dependencies.
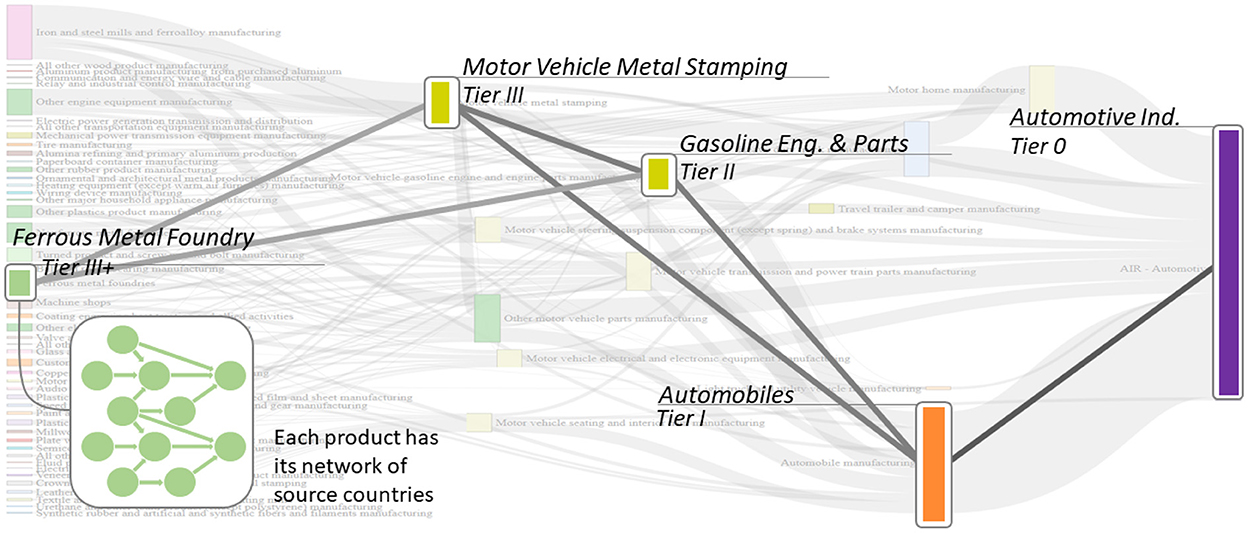
Figure 4. More populated product dependency overview from EM framework for Port of Valencia with inputs and outputs using Figure 1A.
3.2. Network definition
This stage looks beyond product dependencies and brings in a country's manufacturing and transportation to determine product flows and arcs. While the model uses an acyclic network to represent the flow of products without creating feedback loops, future modeling at this stage can be exchanged for another type of network depending on the end use of the entire framework. Data used to define and create future networks could include the period of data, the flow (i.e., import/export), commodity codes, trade values, net weights, quantity, and statistics from the reporter (i.e., Port of Valencia). In this case study, the reporter is the origin of the cyber-physical supply-chain interruption. Moreover, while data on material quantities may not always be available, other available data such as total annual revenue and market share can be incorporated in the loss results to enhance findings.
The proposed network is a hybrid one, which merges together the product dependency graph (or tree) from stage one and relevant trade data from stage two. This step ensures that the econometric model can account for movements of trade across country and sector boundaries within product categories. These two separate networks are shown in Figure 1, and the hybrid network produced in Figure 3. The resulting hybrid network is key to determining the econometric losses from a cyber-physical disruption in the later stages of the CyPEM framework. This framework is used to accurately model CPS and its mechanisms. However, one limitation of this method is that the hybrid network is pre-defined. Although pre-definition has fewer negative effects for measuring short term loss, the longer-term effects could mean fundamental changes to the underlying trade models. In future work, adapting the hybrid network or sub-components of the network for cyber-physical disruptions could be done to mimic the way real-world supply networks would adapt, reroute etc.
Since all the subsequent stages (i.e., stages 3–5) rely on the accuracy and depth of detail in the earlier stages, this is also where predictive analytics can improve the product dependency graphs. As shown, CyPEM collects data from numerous sources and legacy systems to provide a complete view of the supply chain. Subsequent analyses are conducted on this respective data by inspecting, cleaning, transforming, and modeling, with the goal to uncover useful information and achieve the aimed boosted intelligence. Prescriptive analytics are used to automate complex decisions and exploit them to proactively and dynamically update recommendations based on changing events to take advantage of these predictions and provide added value to the project classification tools. This study uses these networks to pre-define many of the market and dependency attributes, and how they affect the rest of the network, while keeping the actual disruption events (and all their individual pieces) more dynamic.
3.3. Disruption input
Stage three of the framework is comprised of two models. The first model is a maritime cyber-risk assessment model developed within (Tam and Jones, 2019a). The maritime cyber-risk assessment model takes a cyber-physical attack chain to show a range of potential risks and outcomes, depending on the success of each segment of an attack chain. The attack chain used in this model has been verified with actual data and testbed experiments, which have been cross-referenced with legitimate system vulnerabilities on ships known to enter the Port of Valencia and with the port authorities in previous Cyber-MAR paper outputs from Tam et al. (2022) and Tam et al. (2021).
As the attack chain unfolds, the technical aspects are less important in this paper than the resulting disruption, since different actions result in different downtimes from Tam and Jones (2019a). This is reflected in the framework, as a user can, in real-time, adjust this part of the model to vary the disruption input to the next stage to obtain different econometric losses in the final stage. However, this study is limited to a few specific built-in scenarios. Both models in stage three are capable of scaling in the future, and have been constructed so that if the necessary information is provided, analysis is possible.
The second part of calculating disruptions is to take the cyber-physical risks and their outcomes, and to predict the overall disruption effect to the Port of Valencia. To do this, a cyber-physical model of the Port of Valencia's throughput was developed. This process is very similar to stages one and two, but built for the internal workings of a single port instead of an entire global network. One way to calculate CPS disruption is to remove node(s) and/or edge(s) from the network, as shown in Barabási and Albert (1999) and Albert et al. (2000). These node and/or edge removal disruptions are closely related to graph and network theories (e.g., degree, distribution) where the removal of a node or edge can only have a binary outcome. In this case, the framework looks at the change in throughput: from 100% (node is there) to 0% (node is removed), and every percent in-between. This method allows the model to be more highly detailed, even modeling the individual ships and terminal cranes (including their type) to accurately determine port downtimes in terms of hours and also in percentages (e.g., 10 h of the port being at 80% capacity).
In order for the throughput model to simulate port operations for the Port of Valencia, certain parameters that describe traffic and flow within the port must be considered. This includes information characterizing the following: (i) arrival process, (ii) average quantity of containers per port call (in Twenty-foot Equivalent Units, or TEUs), (iii) service time distribution per vessel, (iv) proportion of containers destined to be transshipped, and (v) the mean container dwell time. The analysis can be simulated multiple times to output a range of realistic downtime values that correspond to different attack chains and cyber-physical attack outcomes. While the exact layout and configuration of the port's CPS are obfuscated for security reasons, a high level schematic of the simulation can be shown in Figure 5; a more detailed schematic of the model is published in Moara-Nkwe et al. (2022).
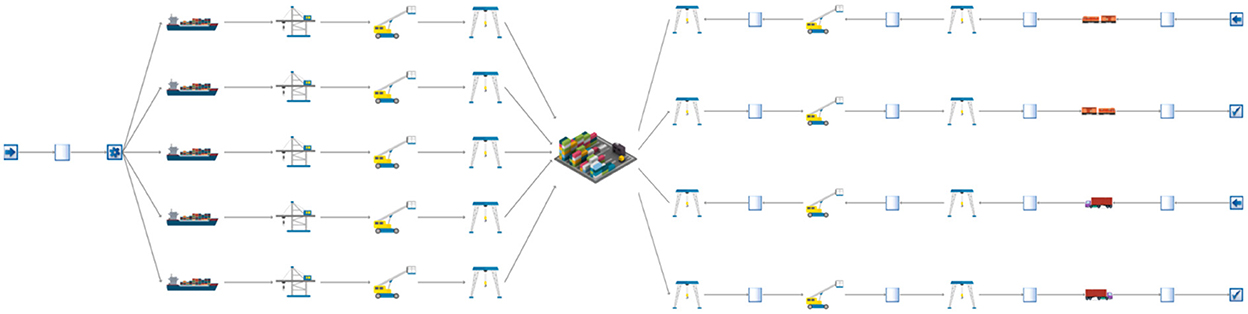
Figure 5. Overview of Port of Valencia throughput simulation for incoming/outgoing container processing.
3.4. Propagation disruption
Disruption can propagate from one node of the network to the next node. As an example, from the output of stages one to three, it can be seen that a disruption at Port of Valencia can affect Spain's metal stamping, resulting in disruption to Germany's Automotive manufacturing. This impact demonstrates why calculating the econometric loss of a cyber-physical attack in a supply chain must be transmitted beyond the node or edge directly affected by the cyber-attack. While the framework can look at the effect of one disruption on one product or one location, the flexibility of the tool allows a user to select any subset of the available products and countries (see Figure 6). In this study, however, the overall econometric losses are of interest, so the following discussion only considers total losses, which is shown to the public in Section 4.
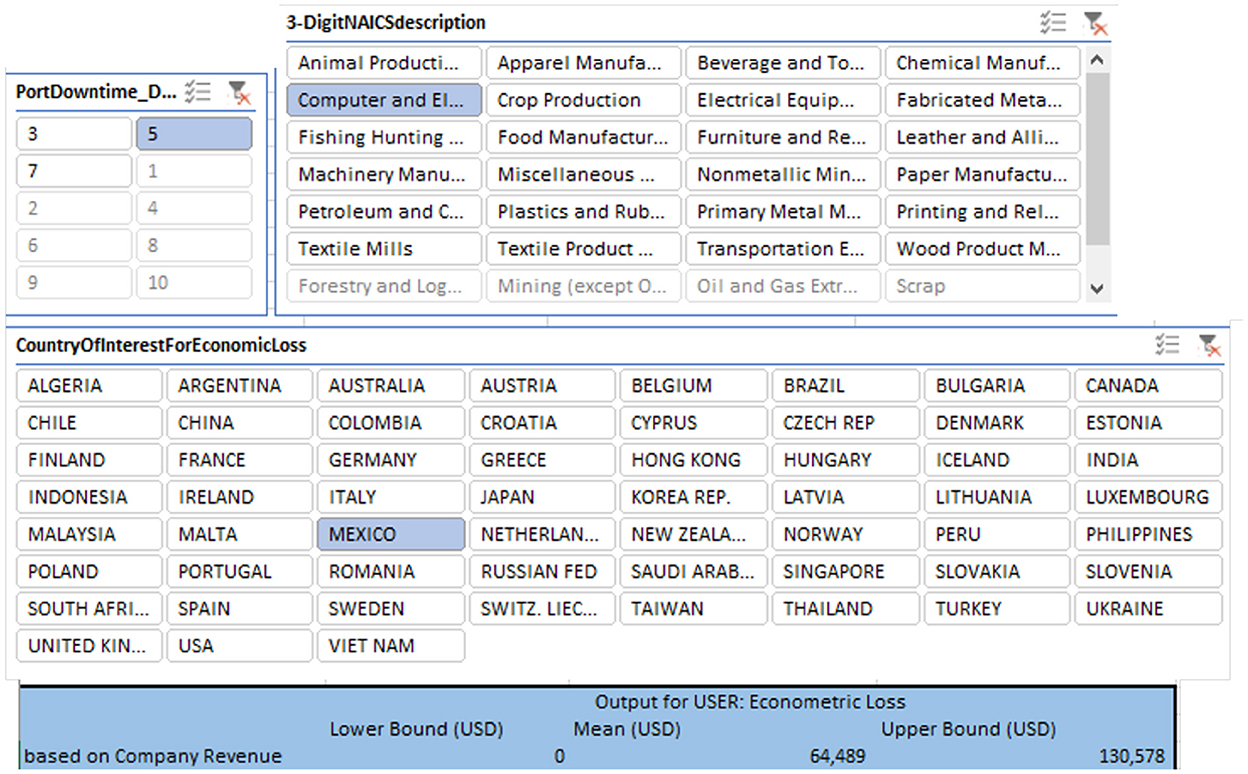
Figure 6. Snapshot of several CyPEM (Cyber Physical Econometric Model) interface windows.
The cyber-attack triggered disruption is observed to decrease the production/transportation capability of nodes and have a ripple effect to successor nodes. Again, in an acyclic network, effects progress downstream in a one way direction. However, if circular supply chains are integrated into the framework as a future next step, disruption patterns and results could be very different. In this instance of CyPEM, cyber-triggered disruptions are propagated through the network in a similar manner to other types of disruptions (e.g., Levalle and Nof, 2017). A global cyber-attack can differ from other natural disaster disruptions, which can be localized geographically, while cyber-attacks tend to occur where the targeted systems are located. Therefore, a single digital threat, such as WannaCry and NotPetya (Branquinho, 2018), could trigger cyber incidences in multiple geographic regions or reach across several sectors (e.g., health, manufacturing) if similar underlying technology is used.
3.5. Output
A schematic of the CyPEM tool can be found in Figure 6. This is not a complete view of available capabilities, but demonstrates what interface a user could use to choose a set of products and affected countries to dynamically calculate losses from a database of modeled scenario results. The EM analysis assumes a worst case scenario with a zero inventory case; no mitigation measures are implemented. For this study, loss results from the EM analysis were post processed in terms of NAICS (North American Industry Classification System) for quantifying the scenario's mean losses with an upper and lower bound of μ±2σ. By using a 2σ range for upper and lower bound losses, it is expected that the loss results are able to encompass 95% of probable losses that could occur for the scenario. For the European Union (EU) region, these loss results, in terms of percentages, are shown in Figures 7–9. For each pie chart, the percentages sum to 100%, since only the EU region is considered in the following survey.
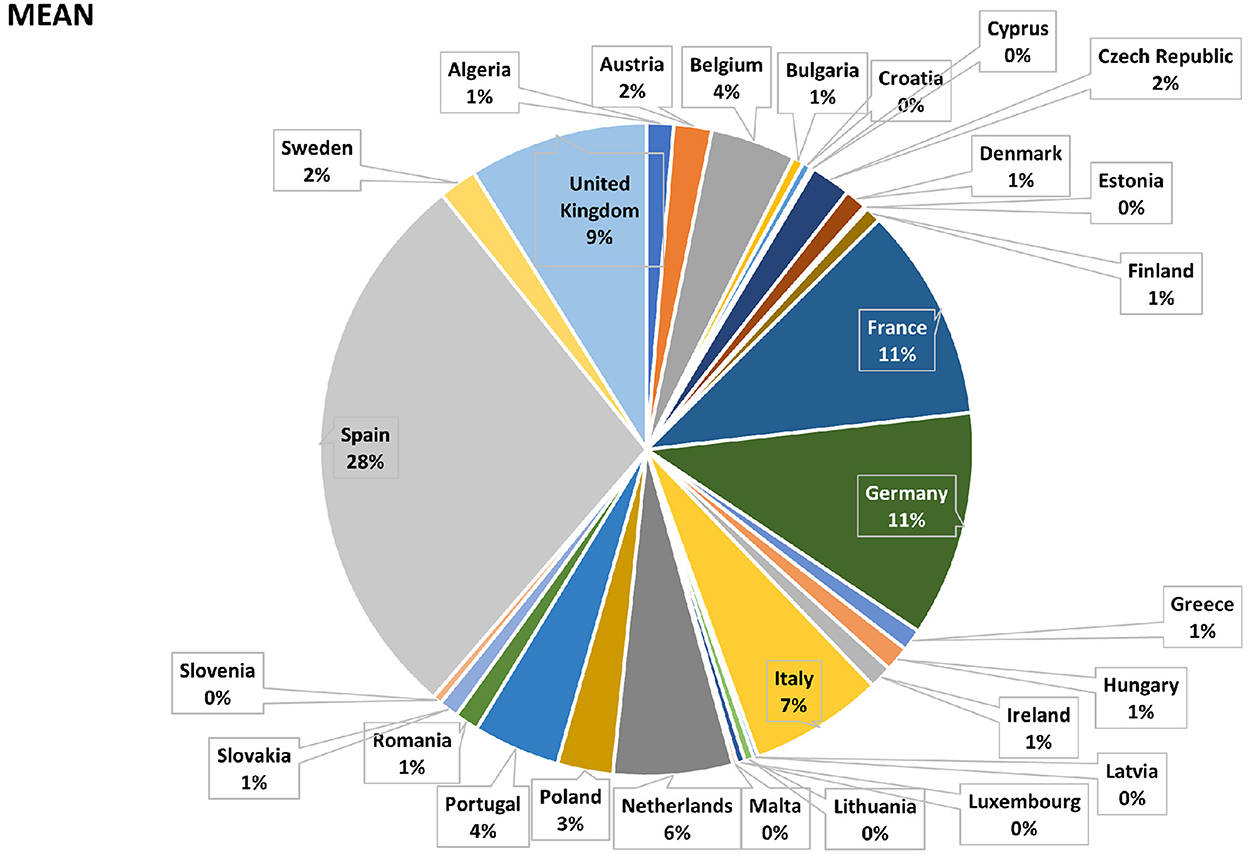
Figure 7. Percentages of mean losses for 3 days of delay caused by a cyber-physical attack.
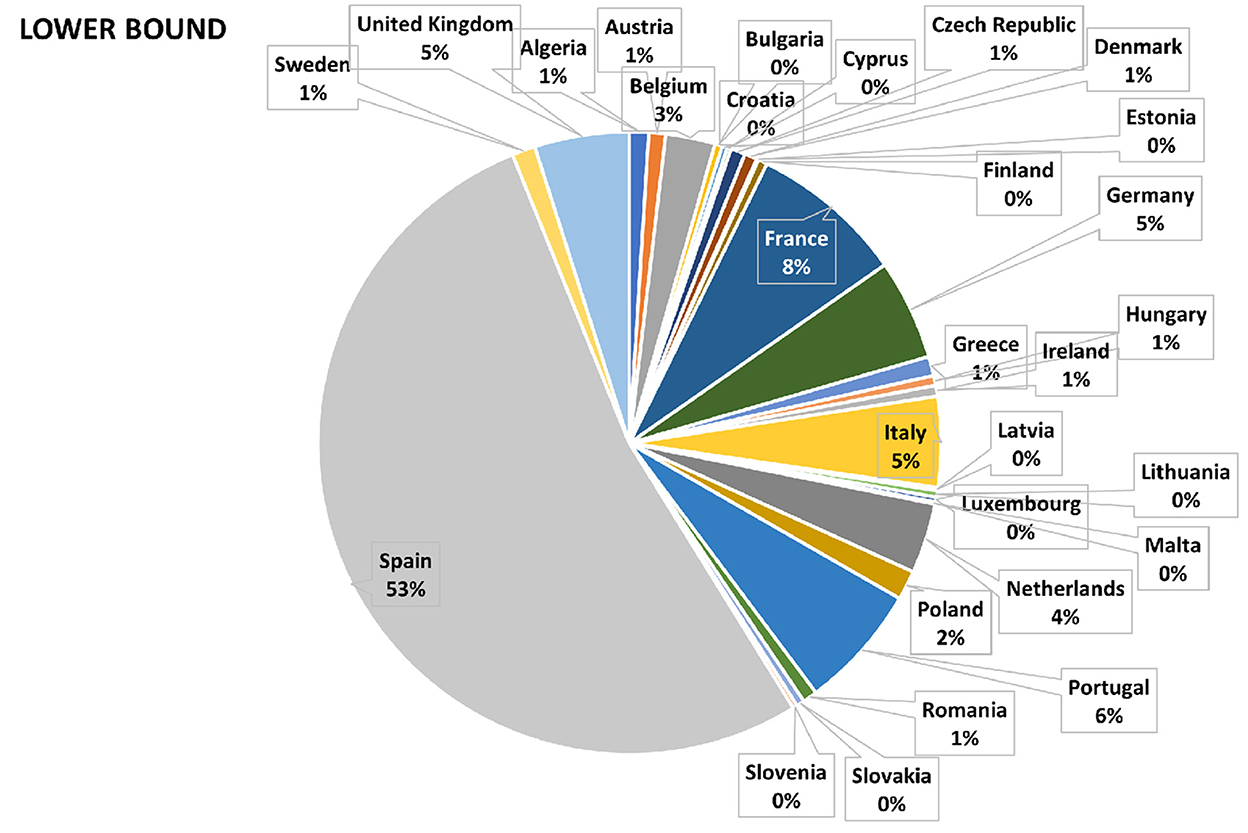
Figure 8. Percentages of lower bound losses for 3 days of delay caused by a cyber-physical attack.
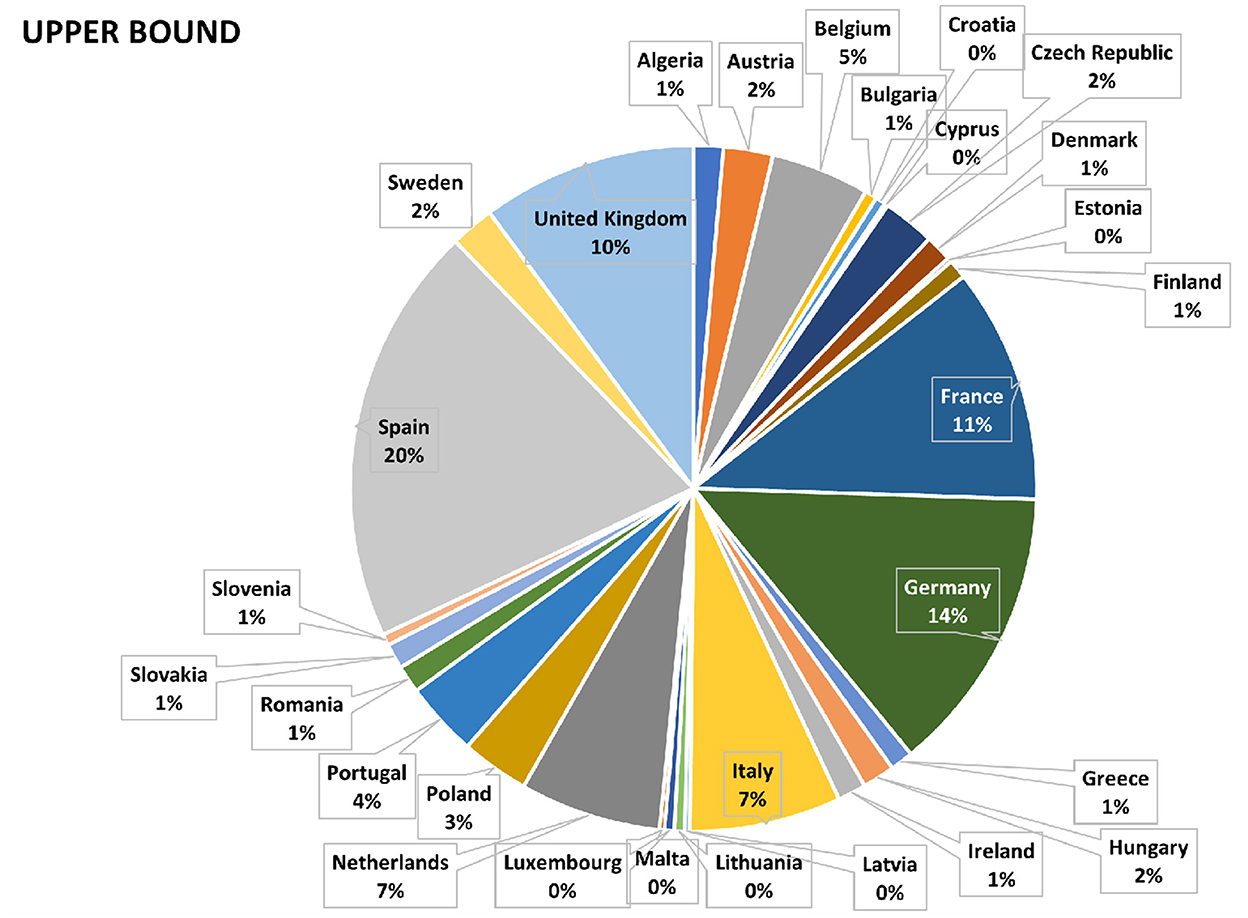
Figure 9. Percentages of upper bound losses for 3 days of delay caused by a cyber-physical attack.
As expected, for the vast majority of possible loss calculations in this case study, Spain has the highest impact, being the node where the disruption originated. However, as can be seen from Figures 7–10, many other countries were also subjected to substantial losses. Following Spain, purely by amount of econometric loss, the top affected countries were Germany, France, United Kingdom (UK), Italy, and then the Netherlands. These figures show output in terms of market share and by possible company revenue (users need to input additional information to obtain company revenue). As the heat maps are more intuitive than numerical tables and easier for viewers to identify their country of birth or residence, these maps were used in the actual vs. perceived risk survey.
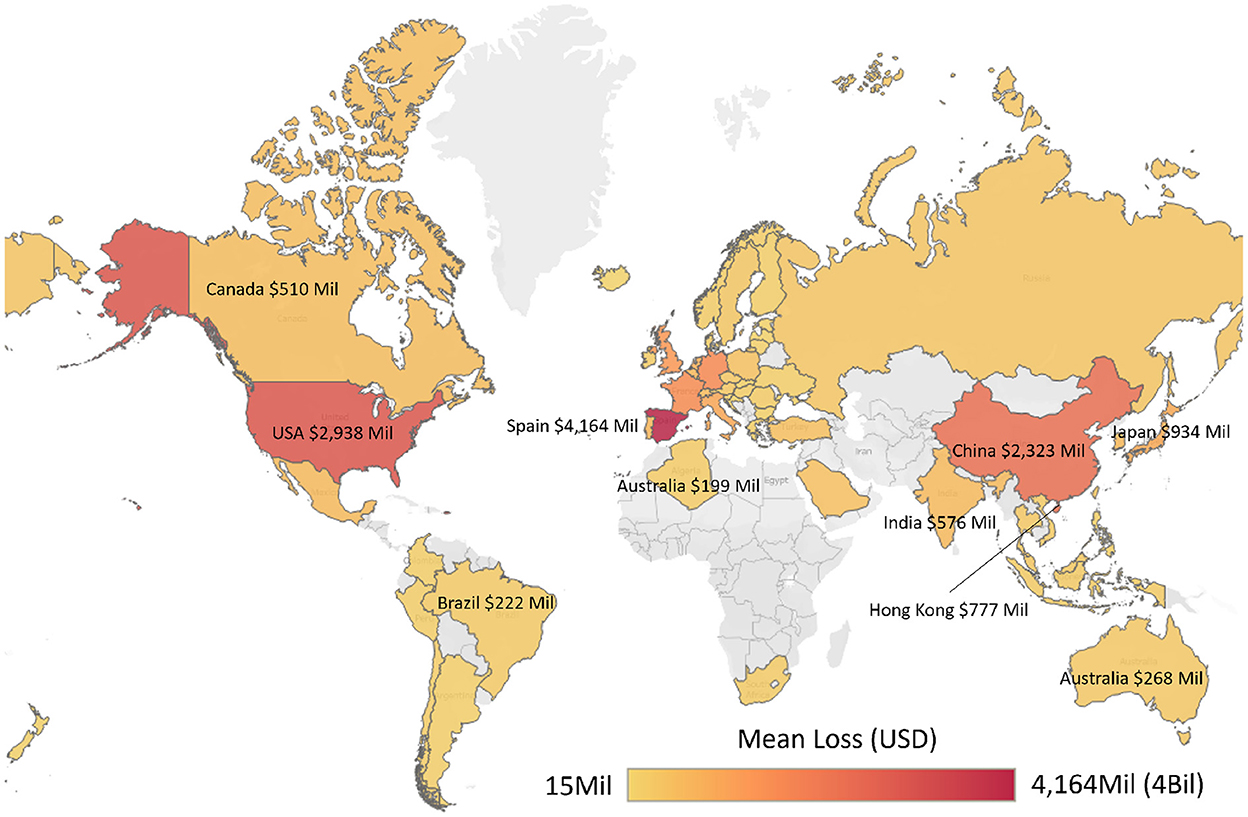
Figure 10. Global heat map for loss in USD (to easily show members of public).
4. Public perception vs. actual risk
The CyPEM tool calculated the mean, as well as lower/upper bounds, of econometric losses for a number of cyber-physical disruption scenarios (e.g., severity of disruption in terms of port throughput percentage and days of delay). While the tool is available for use, it does require some expertise knowledge to use and understand the results. Therefore, to engage the interest of the general public, a survey was created and focused on CyPEM loss outputs (see both heat maps in Figures 10, 11). Heatmaps are more intuitive to understand for a wider audience. The gradients of color on these maps correspond to the amount of loss a country could potentially suffer after 5 days of downtime at the Port of Valencia. As a visual aid, to differentiate countries that share a very similar shade of color, applicable losses in USD are displayed on or near these countries directly on the maps. As supply chains are global, the survey to the public has a global heat map (see Figure 10) but also shows a closer look specifically for the EU (see Figure 11). This is necessary for the Cyber-MAR project, as it is an EU Horizon 2020 project, with much of the focus centering around the effects on Europe.
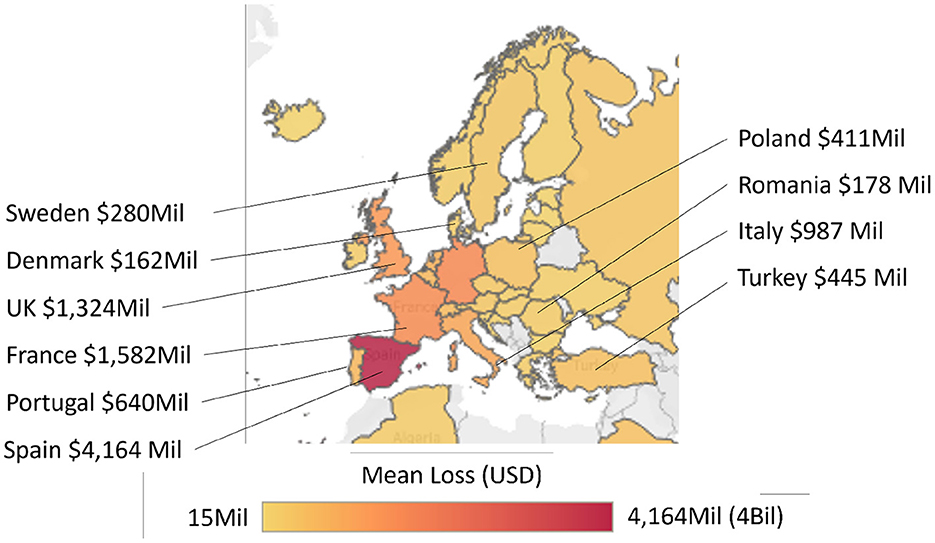
Figure 11. EU heat map for loss, to easily show members of public.
There were four key parts to the survey, with two additional sections that held information for the user about the survey, funding, and data protection. Participants were made aware that by continuing with the survey, they agreed that their anonymized results could be shared. In the first section, survey participants were asked (1) what is your country of birth and (2) what country do you reside in currently. They are asked to choose one (i.e., country of birth or residency) to use for the remainder of the survey. This allowed participants to pick the country which they may have the most awareness of or most interest in. Next, they are asked to state how much (on a scale of 1–10) cyber-security or maritime-logistics knowledge they believed they had. Both sets of these qualitative information are then used to analyze the following answers on their perception of cyber-physical risk and how much it changes after viewing the provided figures.
Of the 23 participants, the majority were born in the UK (just under 50%), but there were also representatives from India, Morocco, Norway, Israel, Panama, Spain, Turkey, USA, and Ukraine. About 62% of participants currently reside in the UK. See Table 2 for all anonymized responses. In the same section, participants were also asked how much cyber-security knowledge and how much marine logistics knowledge they were conversant with. In general, participants with less maritime-related knowledge were more surprised at the econometric outcome of the scenario, regardless of their cyber-security knowledge.
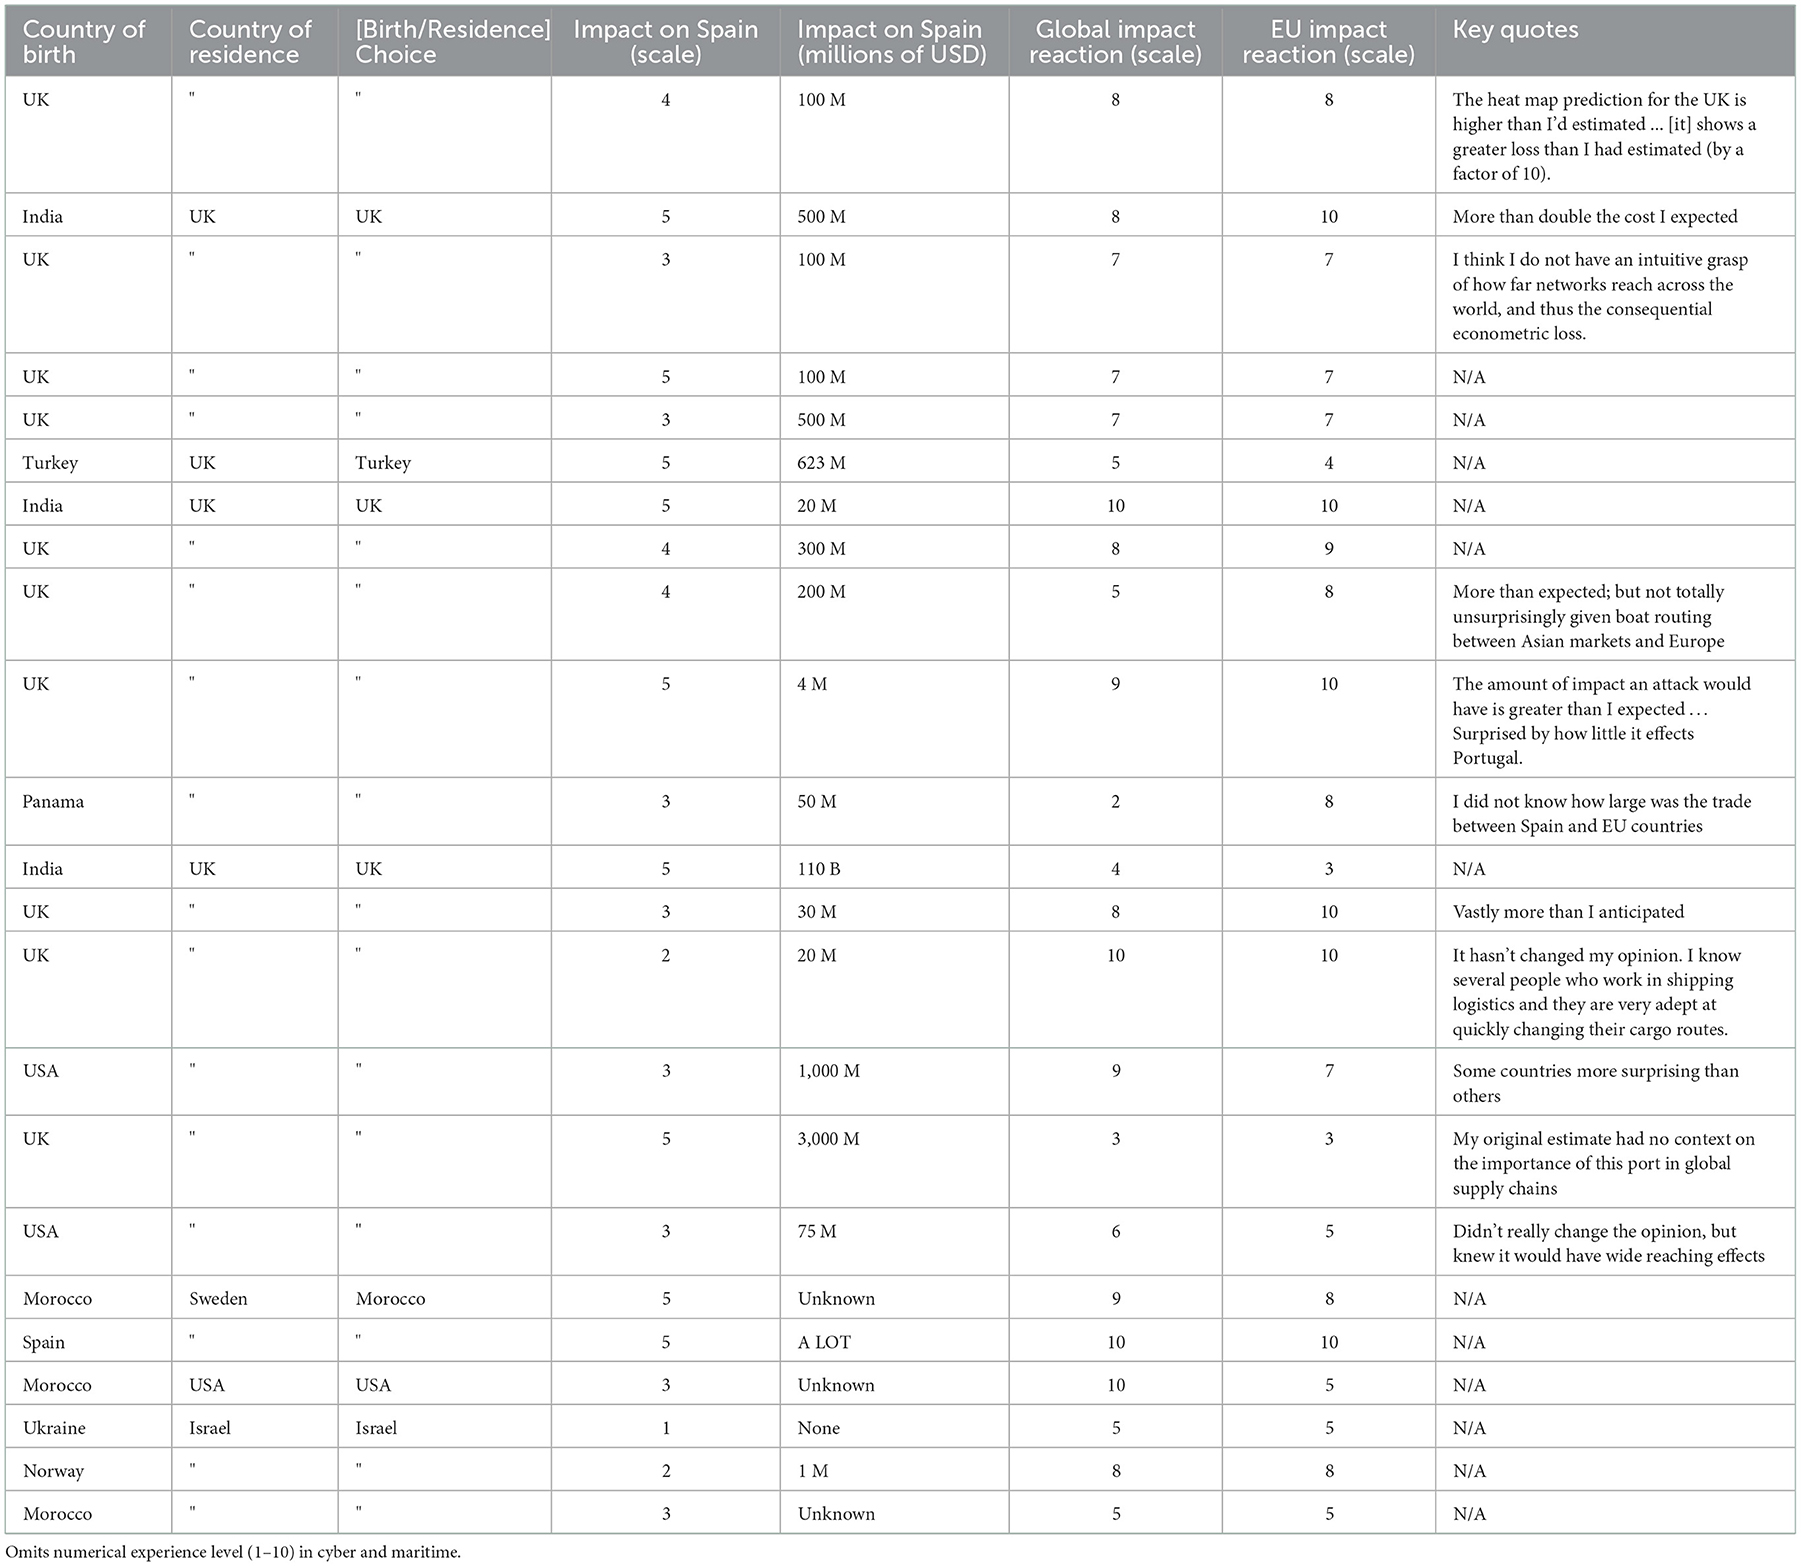
Table 2. Simplified replies to survey.
In the next set of questions, the first econometric loss question asked participants how much effect they thought a cyber-attack on a port in Spain could have on the country they chose. On a scale of 1 to 5, 39% choose the maximum effect of 5. Thirteen percent choose 4, 34% chose 3, and just under 12% of participants were evenly split between 2 and 1. Among those respondents that chose the maximum effect of 5, in general participants were still surprised when presented with the actual loss numbers. When asked if the global or EU heat maps changed their opinion, the selection was from 1 to 10, where five meant no change in opinion, 1–4 meant the actual numbers were less than expected, and any number from 6 to 10 indicated that the realistic losses were more than what they believed. On average, those participants who still expected a high impact still rated the heat maps at 7.5, meaning that the CyPEM results were still higher than expected.
A few quotes from those who were surprised and had little maritime knowledge are “the heat map shows a greater loss than I had estimated (by a factor of 10),” “more than double the cost I expected,” and “vastly more than I anticipated.” A few were surprised at how some countries were more affected than others, for example one said “some countries more surprising than others,” and another stated they were “surprised by how little it effects Portugal.” In comparison, participants who had maritime knowledge were more critical, but still occasionally a little surprised at the figures. For example, one participant said “more than expected; but not totally unsurprisingly given boat routing between Asian markets and Europe“, while another stated “it hasn't changed my opinion. I know several people who work in shipping logistics and they are very adept at quickly changing their cargo routes.”
In summary, the econometric losses, which examine a realistic cyber-physical attack on a Spanish seaport and its trade-routes with other countries, are higher than participants realized. Specifically, those who have little knowledge in these areas were the most surprised, which demonstrates a gap between perceived risk and actual risks associated with cyber-physical threats in shipping. Important quotes when asked why their opinions changed said “my original estimate had no context on the importance of this port in global supply chains” and “I think I do not have an intuitive grasp of how far networks reach across the world, and thus the consequential econometric loss.” See Table 2 for more detailed participant responses. The participant responses also showed that this study did increase awareness; and when asked to consider the issue of cyber-physical threats, many realized why their initial assumptions were off. Additionally, even those with some experience in maritime operations and/or cyber-security were on average still slightly surprised to see the heat-maps provided. In general, participants were also more surprised at the European figures (see Figures 12, 13), however that may be due to the fact that the majority of participants are from and/or live in the EU or in the UK. A larger US or Asia audience could provide a different set of findings.
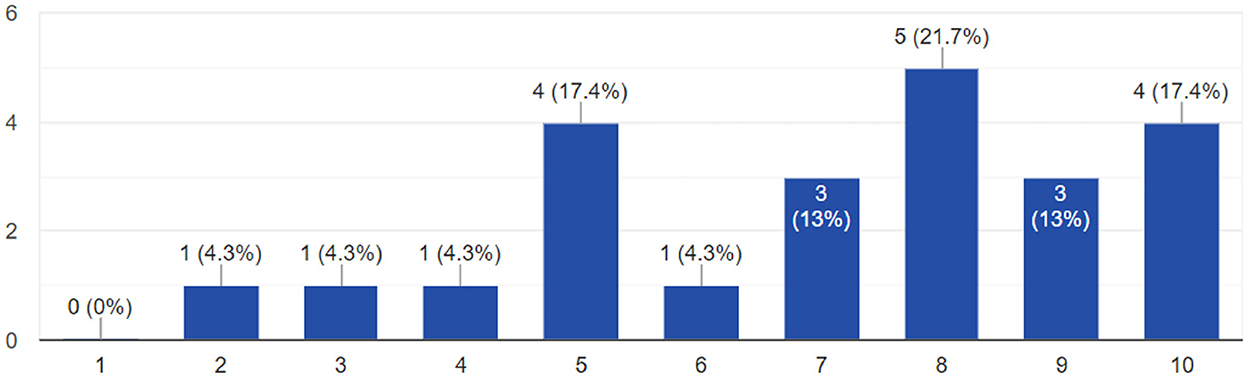
Figure 12. Public reaction to global econometric loss (1 is less than expected, 10 is more).
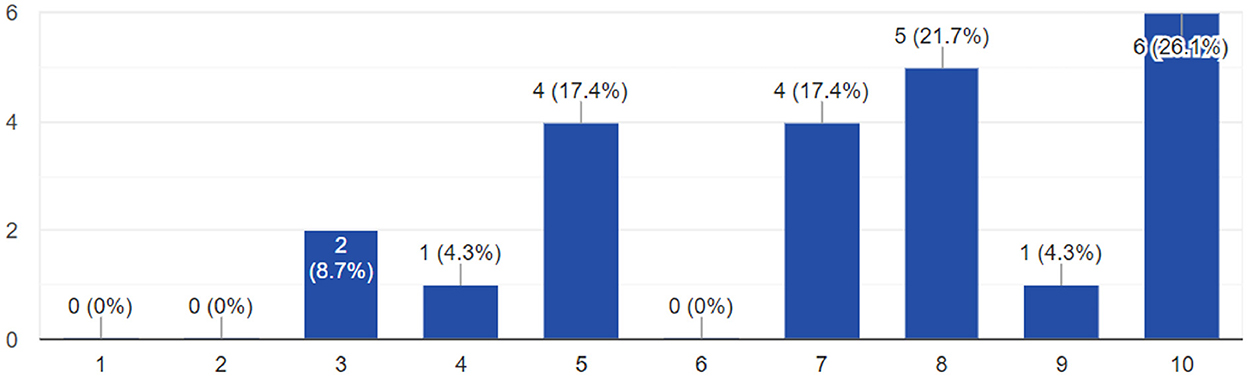
Figure 13. Public reaction to EU econometric loss (1 is less than expected, 10 is more).
5. Discussions
The proposed framework is useful for quantifying econometric losses resulting from a cyber-physical event. In this case study, the Port of Valencia was chosen as a demonstration. With the econometric outputs of a cyber-physical attack on that port, it was possible to compare the actual risk for cyber-security to the public's perceived risk concerning maritime cyber-threats and how it affects them.
Moving forward, in addition to educating the public, stakeholders who are interested in more detailed economic impacts of port disruptions and their propagation through regional and global supply chains can use this tool to better quantify and understand their specific cyber-physical risks. Insurance-related corporations with regional and/or global exposure to contingent business interruption losses may be interested in the comparatively newer threat of cyber-triggered supply chain disruptions. Organizations, whose industrial activity is exposed to global supply chains, may also become better prepared by using the tool outputs. Moreover, the ability to exchange individual framework steps allows one to model other sectors besides marine and maritime scenarios, and consider cyber-physical interruptions at different nodes (e.g., rail).
Given the scale of these potential disruptions and the potential parties (e.g., attackers) involved, other entities that may be interested are governmental organizations, port authorities, freight transport and logistic actors, and trade associations. Through wider engagement with the proposed framework, policymakers can gain a greater understanding of their risk landscape to identify particular weaknesses or dependencies that, if exploited, could have a significant impact on the national economy. Moreover, compliance with international governance frameworks requires the identification of essential services providers, as stipulated by the European Union's National Intelligence Service (NIS) Directive. NIS is officially the Directive (EU) 2016/1148 of the European Parliament and of the Council of 6 July 2016 and concerns measures for a high common level of security of network and information systems across the Union. Engagement at a government level with this framework allows policymakers to consider various scenarios, and their interconnections, to determine which services are essential.
The main limitation of Section 4 and the results of the survey was the number of participants. In addition, while it was useful to hear comments from those who proclaimed to have knowledge in maritime and cyber domains, it meant that not all the replies were from the average public with only general knowledge. Future work could push this survey to a wider audience. While the heat maps were useful for public engagement, a more interactive live tool may also have been more engaging.
Future work could employ cyclic networks when modeling supply chains or examine other CNI. Different cyber-physical risk assessments or throughput simulations may also be used to calculate the EM of other sectors or locations. Also, as a cyber-attack can attack the same system but in divergent geographic “nodes,” modeling and assessing the EM loss could provide novel results. Although physical disruptions tend to be geographically close to each other (e.g., earthquake affecting all CNI in a region), a cyber-triggered disruption could affect similar systems on opposite sides of the world near simultaneously. Widespread malware such as WannaCry is a good examples of this.
The next aim of this research could be to better automate the framework. In addition, further work could be done to refine the perceived risk vs. actual risk among the public by assessing the gap in understanding among people who understand the CPS (e.g., crew driving ships). This could be of interest to evaluate if the level of training the crew receives is adequate when considering cyber-physical threats. Other studies on crew perception of cyber-risk can be found in Larsen and Lund (2021b) and Misas et al. (2022).
To build up resilience of the maritime sector and other CPS, appropriate preparations for cyber-triggered response resources are critical as these SoS become more digitized and interconnected. Having cyber-defense and recovery responses could both remove disruptions and mitigate the potential disruption propagation showcased in this case study and studies similar to Nguyen and Nof (2019a). Similarly, in cyber-security, a supply chain is only as strong as its weakest link. While shipping may not be the “weakest” link, current circumstances, including nation tensions, have placed concerning strain on the supply chain. Timely and effective responses to disruptions is critical to ensure supply chain resilience. Effective communication is critical as well, especially as some of the potential cyber-security risks and threats may be new to CPS workers and employees. However, critical responsiveness is considered difficult to achieve in general because the exact location and timing of cyber disruptions are difficult to predict, given that the speed of a cyber-attack and their stealthy nature can exacerbate the issue. While this is true of accidental attacks, understanding the existing threats can give those in the sector more early warning if their cyber situational awareness is sufficient and combat the unpredictability from cyber-attacks.
6. Conclusions
Complex systems-of-systems (SoS) and critical national infrastructure (CNI) are becoming increasingly complex cyber-physical systems, where a cyber-attack can result in significant physical damage and/or delays in operations. Creators and adopters of new technologies promote more complex systems by demonstrating the new capabilities they bring; however, the potential risks are often underrepresented. To address this lack, this study created a framework for a cyber-physical econometric model to quantify the econometric losses of a large-scale cyber-physical attack. In this case, a specific port was used to calculate global and European losses. Since only promoting the benefits of technology can skew the public's perception of risk, the authors took loss outputs of CyPEM and presented them to the general public to determine if there is a significant gap between the real quantified risk and the perceived risk. This gap was proven to be true with a small subset of participants but also illustrated that presenting quantified econometric reports are critical in reducing the gap in people's understanding of cyber-physical risk. This is particularly true in the maritime sector.
Data availability statement
The original contributions presented in the study are included in the article/supplementary material, further inquiries can be directed to the corresponding author.
Ethics statement
The studies involving human participants were reviewed and approved by University of Plymouth Ethics Committee. The patients/participants provided their written informed consent to participate in this study.
Author contributions
Paper primarily written by KT. BC, RH, and KJ all helped discuss and read/edit content. BC helped write sections related to the EM part. RH helped conduct the survey and with the discussion paragraph. KM-N was involved with the section on the throughout model (port). All authors were involved in discussions and in draft edits of other sections. All authors contributed to the article and approved the submitted version.
Funding
This paper was a funded by the research efforts under Cyber-MAR (https://www.cyber-mar.eu/). Cyber-MAR project has received funding from the European Union's Horizon 2020 research and innovation program under grant agreement no. 833389. Content reflects only the authors' view and European Commission is not responsible for any use that may be made of the information it contains.
Acknowledgments
The authors would like to thank all those who participated in the survey, shared the survey, and agreed to have their replies published.
Conflict of interest
BC was employed by Verisk EES (AIR Worldwide).
The remaining authors declare that the research was conducted in the absence of any commercial or financial relationships that could be construed as a potential conflict of interest.
Publisher's note
All claims expressed in this article are solely those of the authors and do not necessarily represent those of their affiliated organizations, or those of the publisher, the editors and the reviewers. Any product that may be evaluated in this article, or claim that may be made by its manufacturer, is not guaranteed or endorsed by the publisher.
References
3plcentral. (2022). 2022 State of the Third-Party Logistics Industry Report. Available online at: https://www.gminsights.com/industry-analysis/third-party-logistics-3pl-market-size?gclid=EAIaIQobChMI-PbhuKPB_AIVgYjCCh1qOwIWEAAYASAAEgILA_D_BwE (accessed January 2023).
Albert, R., Jeong, H., and Barabási, A.-L. (2000). Error and attack tolerance of complex networks. Nature 406, 378–382. doi: 10.1038/35019019
Barabási, A.-L., and Albert, R. (1999). Emergence of scaling in random networks. Science 286, 509–512. doi: 10.1126/science.286.5439.509
Boardman, J., and Sauser, B. (2006). “System of systems-the meaning of of,” in 2006 IEEE/SMC International Conference on System of Systems Engineering (Los Angeles, CA: IEEE), 6.
Boyson, S. (2014). Cyber supply chain risk management: Revolutionizing the strategic control of critical it systems. Technovation 34, 342–353. doi: 10.1016/j.technovation.2014.02.001
Branquinho, M. A. (2018). Ransomware in industrial control systems. what comes after wannacry and petya global attacks? WIT Trans. Built Environ. 174, 329–334. doi: 10.2495/SAFE170301
Christopher, M., and Peck, H. (2004). Building the resilient supply chain. Int. J. Logist. Manag. 15, 1–14. doi: 10.1108/09574090410700275
Day, J. M. (2014). Fostering emergent resilience: the complex adaptive supply network of disaster relief. Int. J. Product. Res. 52, 1970–1988. doi: 10.1080/00207543.2013.787496
Doumbia-Henry, C. (2020). Shipping and COVID-19: protecting seafarers as frontline workers. WMU J. Maritime Affairs 19, 279–293. doi: 10.1007/s13437-020-00217-9
El-Rewini, Z., Sadatsharan, K., Selvaraj, D. F., Plathottam, S. J., and Ranganathan, P. (2020). Cybersecurity challenges in vehicular communications. Vehicular Commun. 23, 100214. doi: 10.1016/j.vehcom.2019.100214
Freudenburg, W. R. (1988). Perceived risk, real risk: social science and the art of probabilistic risk assessment. Science 242, 44–49. doi: 10.1126/science.3175635
Geissdoerfer, M., Morioka, S. N., de Carvalho, M. M., and Evans, S. (2018). Business models and supply chains for the circular economy. J. Clean Prod. 190, 712–721. doi: 10.1016/j.jclepro.2018.04.159
Ghadimi, F., Aouam, T., and Vanhoucke, M. (2020). Optimizing production capacity and safety stocks in general acyclic supply chains. Comput. Operat. Res. 120, 104938. doi: 10.1016/j.cor.2020.104938
Glover, C. (2022). Port of London Authority Hit by ‘Politically Motivated' Cyberattack. Available online at: https://techmonitor.ai/technology/cybersecurity/port-of-london-authority-cyberattack (accessed December 2022).
Gong, J., Mitchell, J. E., Krishnamurthy, A., and Wallace, W. A. (2014). An interdependent layered network model for a resilient supply chain. Omega 46, 104–116. doi: 10.1016/j.omega.2013.08.002
Hahn, G. J. (2020). Industry 4.0: a supply chain innovation perspective. Int. J. Product. Res. 58, 1425–1441. doi: 10.1080/00207543.2019.1641642
Höyhtyä, M., Huusko, J., Kiviranta, M., Solberg, K., and Rokka, J. (2017). “Connectivity for autonomous ships: Architecture, use cases, and research challenges,” in 2017 International Conference on Information and Communication Technology Convergence (Jeju: ICTC), 345–350.
Jacobs, F. (2021). Mystery Unsolved: Ghost Ships Circling Off California. Available online at: https://bigthink.com/strange-maps/circle-spoofing/ (accessed December 2022).
Kersten, W., Hohrath, P., and Böger, M. (2007). “An empirical approach to supply chain risk management: development of a strategic framework,” in Proceeding POMS2007 Conference, Vol. 5 (Dallas, TX).
Lam, C. Y., and Ip, W. H. (2012). An improved spanning tree approach for the reliability analysis of supply chain collaborative network. Enterprise Inf . Syst. 6, 405–418. doi: 10.1080/17517575.2012.673236
Larrazabal, J. M., and Peñas, M. S. (2016). Intelligent rudder control of an unmanned surface vessel. Expert. Syst. Appl. 55, 106–117. doi: 10.1016/j.eswa.2016.01.057
Larsen, M. H., and Lund, M. S. (2021a). Cyber risk perception in the maritime domain: a systematic literature review. IEEE Access 9, 144895–144905. doi: 10.1109/ACCESS.2021.3122433
Larsen, M. H., and Lund, M. S. (2021b). A maritime perspective on cyber risk perception: a systematic literature review. IEEE Access 9, 2021.
Levalle, R. R., and Nof, S. Y. (2017). Resilience in supply networks: Definition, dimensions, and levels. Annu. Rev. Control. 43, 224–236. doi: 10.1016/j.arcontrol.2017.02.003
Lewis, T. G. (2019). Critical Infrastructure Protection in Homeland Security: Defending a Networked Nation. Tokyo: John Wiley & Sons.
Lloyd's of London and Verisk EES (2019). Hidden Vulnerabilities in Supply Chain Risk: A Quantitative Risk Modelling Framework. Lloyd's of London. Available online at: https://www.lloyds.com/hiddenvulnerabilities (accessed December 2022).
Magnanti, T. L., Max Shen, Z.-J., Shu, J., Simchi-Levi, D., and Teo, C.-P. (2006). Inventory placement in acyclic supply chain networks. Operat. Res. Lett. 34, 228–238. doi: 10.1016/j.orl.2005.04.004
Manulis, M., Bridges, C. P., Harrison, R., Sekar, V., and Davis, A. (2021). Cyber security in new space. Int. J. Inf. Security 20, 287–311. doi: 10.1007/s10207-020-00503-w
Meland, P., Bernsmed, K., Wille, E., Rødseth, Ø., and Nesheim, D. (2021). “A retrospective analysis of maritime cyber security incidents,” in TransNav: International Journal on Marine Navigation and Safety of Sea Transportation (Warsaw: Akademia Morska w Gdyni), 15.
Misas, J. D. P., Hopcraft, R., and Tam, K. (2022). “Future of maritime autonomy: cybersecurity trust and mariner's situational awareness,” in IMarEST International Ship Control Systems Symposium (Amsterdam).
Moara-Nkwe, K., Tam, K., and Jones, K. (2022). Simulation Modelling of Maritime Port Operations: Analysing the Impacts of Disruptions on Ports. Technical Paper.
Mukherjee, S., and Hastak, M. (2018). A novel methodological approach to estimate the impact of natural hazard-induced disasters on country/region-level economic growth. Int. J. Disaster Risk Sci. 9, 74–85. doi: 10.1007/s13753-017-0156-3
Murray, B. (2022). Cyber Pirates Prowling Ship Controls Threaten Another Big Shock. Available online at: https://www.bloomberg.com/news/articles/2022-06-28/cyber-pirates-prowling-ship-controls-threaten-another-big-shock (accessed December 2022).
Nguyen, W. P., and Nof, S. Y. (2019a). Collaborative response to disruption propagation (crdp) in cyber-physical systems and complex networks. Decis Support Syst. 117, 1–13. doi: 10.1016/j.dss.2018.11.005
Nguyen, W. P., and Nof, S. Y. (2019b). Collaborative response to disruption propagation with established lines of collaboration (crdp/esloc) in cyber-physical systems: informatics for decision support. Procedia Manufact. 39, 429–438. doi: 10.1016/j.promfg.2020.01.387
Peng, Y., Liu, H., Li, X., Huang, J., and Wang, W. (2020). Machine learning method for energy consumption prediction of ships in port considering green ports. J. Clean Prod. 264, 121564. doi: 10.1016/j.jclepro.2020.121564
Plaza-Hernández, M., Gil-González, A. B., Rodríguez-González, S., Prieto-Tejedor, J., and Corchado-Rodríguez, J. M. (2021). “Integration of iot technologies in the maritime industry,” in Distributed Computing and Artificial Intelligence, Special Sessions, 17th International Conference, eds S. Rodríguez González, A. González-Briones, A. Gola, G. Katranas, M. Ricca, R. Loukanova, and J. Prieto (Cham: Springer International Publishing), 107–115.
Poulis, K., Galanakis, G. C., Triantafillou, G. T., and Poulis, E. (2020). Value migration: digitalization of shipping as a mechanism of industry dethronement. J. Shipping Trade 5, 9. doi: 10.1186/s41072-020-00064-0
Ramos, K., Rocha, I., Cedeño, T., Dos Santos Costa, A., Ahmad, S., Essar, M., et al. (2021). “Suez canal blockage and its global impact on healthcare amidst the COVID-19 pandemic,” in International Maritime Health (Warsaw), 145–146.
Reyes Levalle, R., and Nof, S. Y. (2015). A resilience by teaming framework for collaborative supply networks. Comput. Ind. Eng. 90, 67–85. doi: 10.1016/j.cie.2015.08.017
Royster, K. (2022). What is the L.A. Port's Shipping Backlog Doing to Southern California's Environment? Available online at: https://dornsife.usc.edu/news/stories/3636/la-shipping-backlog/ (accessed December 2022).
Seok, H., Kim, K., and Nof, S. Y. (2016). Intelligent contingent multi-sourcing model for resilient supply networks. Expert. Syst. Appl. 51, 107–119. doi: 10.1016/j.eswa.2015.12.026
Syarif, A., Yun, Y., and Gen, M. (2002). Study on multi-stage logistic chain network: a spanning tree-based genetic algorithm approach. Comput. Ind. Eng. 43, 299–314. doi: 10.1016/S0360-8352(02)00076-1
Tam, K., Hopcraft, R., Moara-Nkwe, K., Misas, J. D. P., Andrews, W., Harish, A. V., et al. (2022). Case study of a cyber-physical attack affecting port and ship operational safety. J. Transport. Technol. 12, 1–27. doi: 10.4236/jtts.2022.121001
Tam, K., and Jones, K. (2019a). Macra: a model-based framework for maritime cyber-risk assessment. J. Maritime Affairs. 18, 129–163. doi: 10.1007/s13437-019-00162-2
Tam, K., and Jones, K. (2019b). “Situational awareness: examining factors that affect cyber-risks in the maritime sector,” in International Journal on Cyber Situational Awareness, Vol 4 (Oxford: IEEE).
Tam, K., Moara-Nkwe, K., and Jones, K. (2021). “A conceptual cyber-risk assessment of port infrastructure,” in World of Shipping Portugal. An International Research Conference on Maritime Affairs (Portugal), 1–23.
United States Coast Guard. (2022). 2021 Cyber Trends and Insights in the Marine Environment. Available online at: https://www.dco.uscg.mil/Portals/9/2021CyberTrendsInsightsMarineEnvironmentReport.pdf (accessed December 2022).
Wingrove, M. (2021). Port Cyber Security is Maritime's Zero-Day Exploit. Available online at: https://www.rivieramm.com/news-content-hub/news-content-hub/port-facilities-are-vulnerable-to-cyber-threats-64367 (accessed December 2022).
Yağdereli, E., Gemci, C., and Aktaş, A. Z. (2015). A study on cyber-security of autonomous and unmanned vehicles. J. Defense Model. Simulat. 12, 369–381. doi: 10.1177/1548512915575803
Zhang, L., De Gier, J., and Garoni, T. M. (2014). Traffic disruption and recovery in road networks. Physica A 401, 82–102. doi: 10.1016/j.physa.2014.01.034
Zhong, H., and Nof, S. Y. (2015). The dynamic lines of collaboration model: Collaborative disruption response in cyber-physical systems. Comput. Ind. Eng. 87, 370–382. doi: 10.1016/j.cie.2015.05.019
Keywords: econometric (EC) model, cyber-physical, maritime, cyber-security, critical national infrastructure
Citation: Tam K, Chang B, Hopcraft R, Moara-Nkwe K and Jones K (2023) Quantifying the econometric loss of a cyber-physical attack on a seaport. Front. Comput. Sci. 4:1057507. doi: 10.3389/fcomp.2022.1057507
Received: 29 September 2022; Accepted: 13 December 2022;
Published: 23 January 2023.
Edited by:
Stephen McCombie, NHL Stenden University of Applied Sciences, NetherlandsReviewed by:
Laura Belli, University of Parma, ItalyRadhya Sahal, Independent Researcher, Cork, Ireland
Copyright © 2023 Tam, Chang, Hopcraft, Moara-Nkwe and Jones. This is an open-access article distributed under the terms of the Creative Commons Attribution License (CC BY). The use, distribution or reproduction in other forums is permitted, provided the original author(s) and the copyright owner(s) are credited and that the original publication in this journal is cited, in accordance with accepted academic practice. No use, distribution or reproduction is permitted which does not comply with these terms.
*Correspondence: Kimberly Tam,  a2ltYmVybHkudGFtQHBseW1vdXRoLmFjLnVr