 Vithya Yogarajan1*
 Gillian Dobbie1
 Sharon Leitch2Te Taka Keegan3
 Joshua Bensemann1Michael Witbrock1Varsha Asrani4David Reith5
- 1School of Computer Science, Waipapa Taumata Rau, University of Auckland, Auckland, New Zealand
- 2General Practice and Rural Health, Otago Medical School, University of Otago, Dunedin, New Zealand
- 3School of Computing and Mathematical Sciences, University of Waikato, Hamilton, New Zealand
- 4Department of Surgery, Faculty of Medical and Health Sciences, School of Medicine, Surgical and Translational Research (STaR) Centre, University of Auckland, Auckland, New Zealand
- 5Office of the Dean, Otago Medical School, University of Otago, Dunedin, New Zealand
Introduction: Developments in Artificial Intelligence (AI) are adopted widely in healthcare. However, the introduction and use of AI may come with biases and disparities, resulting in concerns about healthcare access and outcomes for underrepresented indigenous populations. In New Zealand, Māori experience significant inequities in health compared to the non-Indigenous population. This research explores equity concepts and fairness measures concerning AI for healthcare in New Zealand.
Methods: This research considers data and model bias in NZ-based electronic health records (EHRs). Two very distinct NZ datasets are used in this research, one obtained from one hospital and another from multiple GP practices, where clinicians obtain both datasets. To ensure research equality and fair inclusion of Māori, we combine expertise in Artificial Intelligence (AI), New Zealand clinical context, and te ao Māori. The mitigation of inequity needs to be addressed in data collection, model development, and model deployment. In this paper, we analyze data and algorithmic bias concerning data collection and model development, training and testing using health data collected by experts. We use fairness measures such as disparate impact scores, equal opportunities and equalized odds to analyze tabular data. Furthermore, token frequencies, statistical significance testing and fairness measures for word embeddings, such as WEAT and WEFE frameworks, are used to analyze bias in free-form medical text. The AI model predictions are also explained using SHAP and LIME.
Results: This research analyzed fairness metrics for NZ EHRs while considering data and algorithmic bias. We show evidence of bias due to the changes made in algorithmic design. Furthermore, we observe unintentional bias due to the underlying pre-trained models used to represent text data. This research addresses some vital issues while opening up the need and opportunity for future research.
Discussions: This research takes early steps toward developing a model of socially responsible and fair AI for New Zealand's population. We provided an overview of reproducible concepts that can be adopted toward any NZ population data. Furthermore, we discuss the gaps and future research avenues that will enable more focused development of fairness measures suitable for the New Zealand population's needs and social structure. One of the primary focuses of this research was ensuring fair inclusions. As such, we combine expertise in AI, clinical knowledge, and the representation of indigenous populations. This inclusion of experts will be vital moving forward, proving a stepping stone toward the integration of AI for better outcomes in healthcare.
1. Introduction
There are abundant examples around the world where indigenous and underrepresented populations experience inequities in their exposure to the determinants of health. This includes access to and through healthcare and receipt of high-quality healthcare (Webster et al., 2022). In New Zealand, Māori experience significant inequities in health compared to the non-Indigenous population (Curtis et al., 2019; Webster et al., 2022; Wilson et al., 2022). Although Māori experience a high level of health care need, they receive less access to the full spectrum of health care services and poorer care throughout, from preventative to tertiary care (Curtis et al., 2019; Webster et al., 2022). The need to address such health equity is reinforced by the United Nations Declaration on the Rights of Indigenous Peoples and Te Tiriti o Waitangi (The Treaty of Waitangi, 18401) in New Zealand.
Developments in Artificial Intelligence (AI) and data-driven technology are used to make clinical diagnoses, decisions, and treatment protocols. Although health inequalities can directly reflect human biases, the introduction of and use of AI in healthcare comes with its own biases and disparities. AI is prone to reinforcing bias (Parikh et al., 2019; Feuerriegel et al., 2020; Norori et al., 2021), triggering a need for legislative improvements, including data governance, and reflected by the recent modifications of the US HIPPA regulations and GDPR in Europe. In New Zealand, the ongoing health system reforms and the inclusion of a new Māori health authority are expected to provide the opportunities and platform for health equity (McCall, 2022). Furthermore, ongoing developments of frameworks such as the IEEE Standards on Algorithmic Bias Considerations (P7003) (Koene et al., 2018; Smith et al., 2018) are examples of global initiatives to assist organizations in understand and eliminate unintentional algorithmic bias. Moreover, governments have introduced anti-discrimination laws prohibiting unfair treatment based on sensitive attributes.
This research takes early steps toward developing a fair and unbiased AI in healthcare for New Zealand's population. Ensuring equity requires identifying and mitigating fairness problems in data collection, data storage, data availability, model development, and model deployment (Mehrabi et al., 2021; Paleyes et al., 2022). In this paper, we analyze data and algorithmic bias concerning data collection and model development, training and testing using health data collected by experts. We consider the existing fairness measures in both the data and algorithmic development stages. We also analyze the use of fairness measures developed predominantly for the US population in New Zealand settings (Mehrabi et al., 2021). We use health data collected from New Zealand's population while working closely with healthcare experts to analyze fairness measures. This research provides a pathway to reproducible concepts that can be adopted with respect to any NZ population data, not just electronic health records (EHRs). We use data collected by health experts and analyze unintended data bias. We consider algorithmic bias at two stages. The first is analyzing the effects of using machine learning models for a given classification task, and the second is at algorithmic design (i.e., the design of a specific task or research question). In this paper we use machine learning models such as logistic regression and XGBoost. The choice of the machine learning algorithms, including the above mentioned, is made based on examples in the literature of other similar studies, such as Hotzy et al. (2018), Tong et al. (2020), Yao et al. (2020), Peng et al. (2021), Wu et al. (2022), Barak-Corren et al. (2021), Luo et al. (2019), and Snider et al. (2021). The protected groups chosen for this study are “Gender” and “Ethnicity,” where the male population is considered privileged over the female population and NZ Europeans are considered privileged over Māori and Pacific populations. The analysis of fairness measures for tabular and text data from the NZ population is presented, representing text data as bag-of-words or embeddings.
This paper includes the following sections. Section 2 provides an overview of the concepts addressed in this paper, including references to the literature where required. This is followed by Section 3 where an outline of data and experimental metrics, methodology and setup is provided. Section 4 provides details of the results and analysis. Finally, conclusions and future work are presented in Section 5.
2. Background
2.1. AI model development and deployment
There are two significant stages for integrating AI into any task, development and deployment. Figure 1 shows the general process, including the various sub-tasks required for each step. The first and arguably most crucial step is obtaining the relevant data for the project. The data can drive the entire development cycle as factors such as the type and quantity of data will determine which machine learning models are appropriate for the task. Data quality is also is important, although that is a much larger topic (Gudivada et al., 2017). The data is typically partitioned into two, with one part used for training the chosen AI model to perform the desired task. The rest of the data is used to test the trained model to see how effective the model is when exposed to new data. There may be some cycling between training and testing the model, with different iterations of the model selection occurring based on the test results.
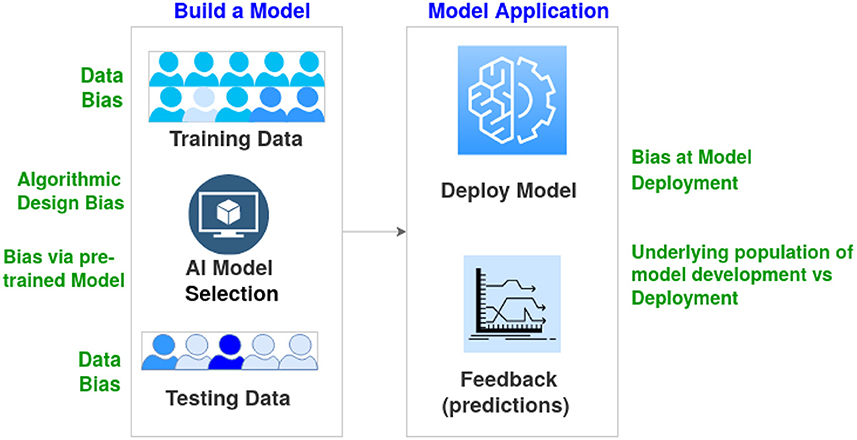
Figure 1. Overview describing the basic stages of AI model development and deployment. Examples of bias at various stages are outlined.
Once development is completed, the model is deployed for real-world use. This stage generally consists of waiting and observing the model's performance (i.e., accuracy) in its intended tasks. A well-developed model with appropriate training data will generalize to real-world tasks, resulting in an adequate performance for the intended task. In this case, appropriate training data comes from a distribution that is the same or at least highly similar to the real-world task distribution. Even if the model generalizes well, there is still a need to periodically monitor the model's performance as the real-world distribution changes. These distribution changes are known as “concept drift” (Widmer and Kubat, 1996). In healthcare, concept drift could occur gradually due to factors such as shifts in the population's demographic composition or suddenly due to factors such as a global pandemic. The impact of concept drift can be moderated using multiple methods (Žliobaitė et al., 2016). A simple method is to treat the entire development and deployment process as iterative, with feedback from deployment being used as training data for a new development stage.
2.2. Bias
Bias in AI can occur at all stages, from data collection to algorithmic development and deployment (see Figure 1). Such bias is far more problematic with underrepresented populations. For instance, models fed relatively homogeneous data during training suffer from a lack of diversity in terms of underlying patient populations. They can severely limit the generalizability of results and yield biased AI-based decisions (Celi et al., 2022). Obermeyer et al. (2019) provided an example of data bias where the algorithm showed Black patients to be healthier than they actually were, as the design of the algorithm used the cost of health as a proxy for the needs of patients. Algorithmic designs also result in biased algorithmic decisions. Another aspect of bias is the data distribution encountered in the training and validation of a model being site-specific (or country/region-specific). In this case, the data distribution of the deployment environment is significantly different (Howard et al., 2021). In addition to changes in the population's ethnicity, changes in medical equipment, such as image capture and biometrics, can also lead to bias.
2.3. Fairness
Uses of AI in real-world applications, including healthcare, can produce unfair outcomes across demographic groups (Fletcher et al., 2021; Forde et al., 2021; Leslie et al., 2021); hence, there is need for quantitative assessments of fairness in decision making. The fairness of a machine learning model is usually judged against a set of legal or ethical principles. It can vary depending on the local government and culture (Fletcher et al., 2021); in this regard, the cultural and social requirements of Aotearoa/New Zealand are also unique.
There is a need to mitigate equity problems in data collection, model development, and model deployment to ensure that AI can be used to improve healthcare outcomes of underrepresented and indigenous populations. Choosing the appropriate fairness measurement based on the scenario can also help mitigate bias. It is vital to point out that the emphasize of equality, although appropriate in some situations, may not necessarily reflect health equity. To achieve equity of health outcomes some categories of patients will require substantially more resources. As defined by NZ Ministry of Health2, based on the World Health Organization, equality refers to treating people in the same way, while equity refers to treating people fairly, i.e., equity is about adapting to the needs of populations to help people achieve the same outcomes. Fairness policies related to healthcare can be grouped into those based on equal performance and those based on equal allocation (Rajkomar et al., 2018). Equal performance means that a model is guaranteed to be equally accurate for patients from various population groups. An excellent example of equal allocation is the issue of vaccine distribution. When a machine learning model considers only the overall optimal prevention strategy, its allocation strategy can be detrimental to an underrepresented group.
2.4. Explainability and interpretability
Ever since AI models have been applied to real-world problems, there have been concerns about the models' explainability and interpretability (Goebel et al., 2018). Explainability refers to understanding how a model came to its decision. In contrast, interpretability is being able to understand the models' output. Many of these models are black boxes by nature; we know that data is input and decisions are output. Most of what happens between input and output is not well understood. It can be challenging to determine how the models came to their decision. This can be particularly concerning when the models are making decisions that directly affect the lives of individuals. Why was Person X approved for something that Person Y was denied for? These decisions could be based on sound reasoning or model biases, as discussed above. These problems are such a concern that the European Union has recently introduced regulations to enhance the explainability of such models in their jurisdiction (Hamon et al., 2020). Research also shows that users' acceptance of AI models is significantly impacted by their explainability (Shin, 2021).
Interpretability is often also an issue for non-black-box models. In regression models, it takes some statistical knowledge to correctly interpret what the coefficients mean and how to understand complex situations such as variable interactions, polynomial terms and log axes (Nathans et al., 2012). On the other hand, it is also important to point out the potential trade off between interpretability, efficacy and equity (Rüping, 2006; Carvalho et al., 2019). Interpretability is a very subjective concept, and depending on the domain and context the extend of model interpretability varies and hence is hard to formalize (Rüping, 2006; Rudin, 2018; Carvalho et al., 2019).
2.5. Incorporating socially responsible AI
A fundamental requirement for being socially responsible is a trustworthy system. Understanding bias in data and model developments, and the ability to reduce bias in developing and deploying technologically advanced systems, are steps toward being socially responsible. This includes not blindly trusting the results generated by AI. To ensure safety, security and fairness, AI systems need to be verified and validated in alignment with the objectives for which the system was designed (Korteling et al., 2021).
In New Zealand, given the long history of racism toward Māori, the design and development of AI systems should feature a high degree of control by Māori (Wilson et al., 2022). This allows implementations to be fair and relevant to Māori, and serves Māori aspirations. Understanding data and algorithmic bias can further ensure AI models for healthcare (and other fields) can perform well for Māori with the hope of at least an equivalent capacity to benefit them.
Tackling algorithmic bias will require working with health professionals, clinicians, representatives from underrepresented populations and active participation in developing these algorithms. This ensures a deep understanding of the clinical context is incorporated while improving modeling, acknowledging an acceptable tradeoff between the performance of the algorithm and bias (Panch et al., 2019). Furthermore, incorporating representatives from indigenous and minority populations needs to go beyond just hearing Māori and minority voices to ensure that society's needs are met (McCall, 2022). There is a need to ensure that health algorithms do not worsen health equity and indeed improve health outcomes for those populations. As such, co-authors of this research include clinical experts, machine learning experts, data scientists, and researchers of New Zealand's indigenous Māori population.
It is vital to understand that all patients are stakeholders as their data are being used. Stakeholder engagement can improve research appropriateness, acceptability, rigor, feasibility, delivery, and dissemination (Maurer et al., 2022). Māori and other minority groups are important stakeholders, so it is crucial to handle such data with care (Hudson and Russell, 2009; Esmail et al., 2015; Kalkman et al., 2022). We strongly believe that any outcome of this research, either direct or indirect, should be created for good of Māori and other minority groups. Moreover, gender-diverse groups are central in this work as they are also at risk of bias.
Furthermore, it is important to consider patient privacy laws and the ethics of using patient data. Privacy laws in many jurisdictions require accurate de-identification of medical documents before they can be shared outside their originating institutions or used in research. The ethics committee has approved the data used for this research and it is de-identified to protect patient privacy.
3. Methodology
This research aims to take initial steps toward addressing the need to develop socially responsible and fair AI in healthcare for the New Zealand (NZ) population. As such, we focus on using NZ data collected by clinicians to analyze the data bias and model development bias using established techniques and fairness metrics. Figure 2 provides an overview of various aspects of this research.
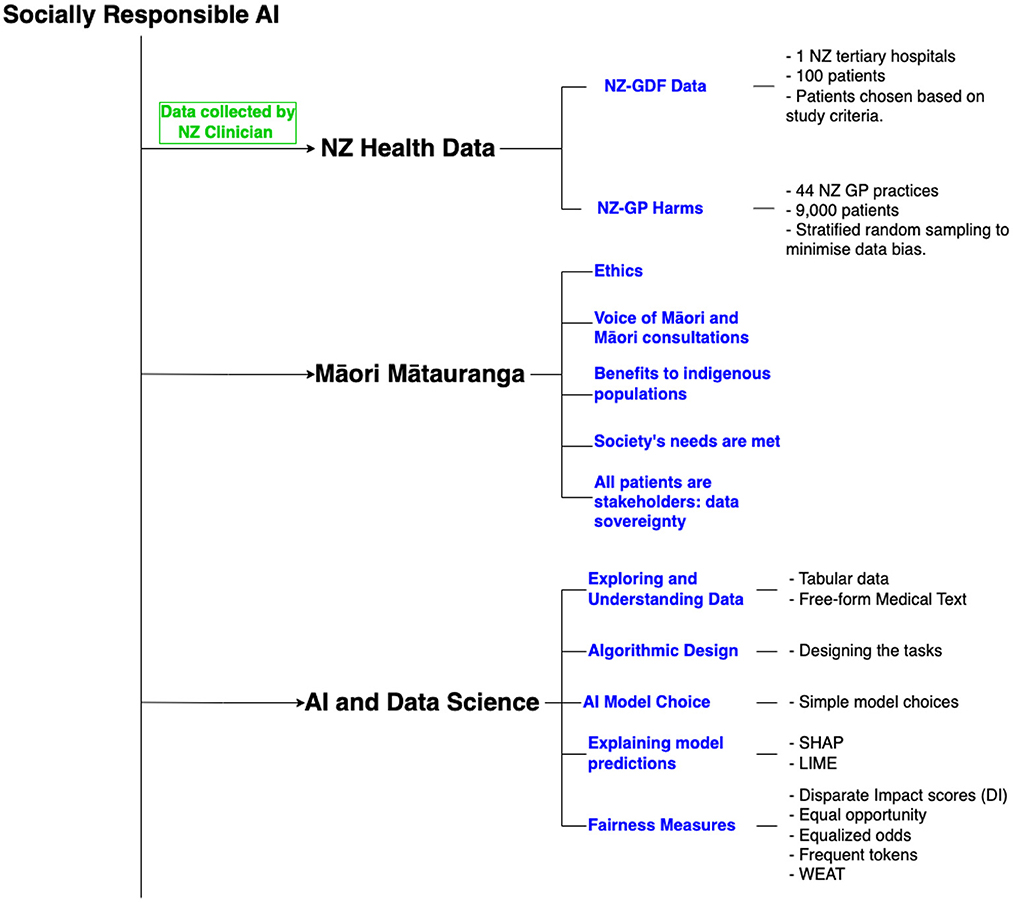
Figure 2. Overview of research components.
This section presents an overview of the data, target questions for algorithmic developments, an overview of fairness metrics, and an outline of the experimental setup.
3.1. Data
For this research, we use two New Zealand data sources collected by clinicians for various studies. The NZ-GP Harms Dataset (Leitch et al., 2021) is a collection of electronic health records (EHRs), in both tabular and text form, from New Zealand General Practices (NZ-GP) with manual annotations of experts identifying healthcare patient harms and whether the identified harm is preventable. The NZ-GDF Dataset (Asrani et al., 2021) is a collection of data, in tabular form, of patients admitted to intensive care units (ICU) in New Zealand hospitals for developing new scoring systems for gastrointestinal dysfunction/failure (GDF).
3.1.1. The NZ-GP harms dataset
For experiments and development of AI models, New Zealand General Practice (GP) EHRs data (referred to as NZ-GP Harms data) from Leitch et al. (2021) is used. This data includes 3 years' worth of medical records from 44 different GP practices across NZ, collected using a stratified random sampling method to minimize data collection bias. It includes data for over 9,000 patients of various ages, gender, ethnicity, and deprivation (i.e., economic) status. The GP practices were further categorized by the size of the practice (i.e., small/medium/large) and if the location of the practice is urban or rural. The data were manually processed, annotated and verified by eight GP researchers. The definition of “Patient Harm” used in this data is:
Physical or emotional negative consequences to patients directly arising from health care, beyond the usual consequences of care and not attributable ONLY to the patient's health condition. Includes: treatment delays, inconvenience and additional financial costs.
The data includes various categories of free-text data, including consultation notes, medical warnings, specialist care, nutrition and other referral details, outcome summaries, and immunisations. The presence and availability of data for each category vary from patient to patient. This research considers the category “Consults” as the free-text EHRs for experiments. The free-form EHRs “Consults” includes notes from classifications, patient history and consultation summaries. Figure 3 provides an overview of the number of tokens in the free-form medical text for NZ-GP data.
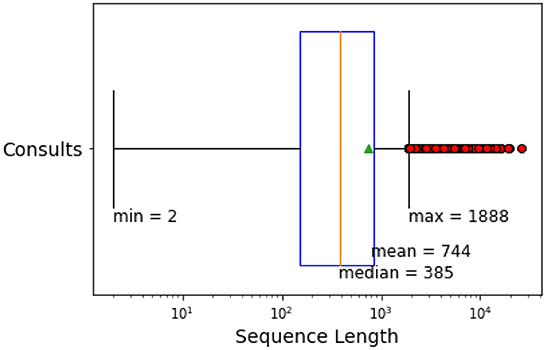
Figure 3. Sequence length (number of tokens) of free-form EHRs in NZ-GP Harms data for the category “Consults.”
We use the NZ-GP Harms dataset for two tasks: prediction of harm and prediction of preventable harm. The study incorporates data in both tabular and free-form EHRs for 9,076 patients, where 1,505 patients experienced some level of harm. From the 1,505 patients who experienced harm, experts identified 362 patients with preventable harm. Table 1 provides summary statistics of selected features of the NZ-GP Harms data for both tasks.
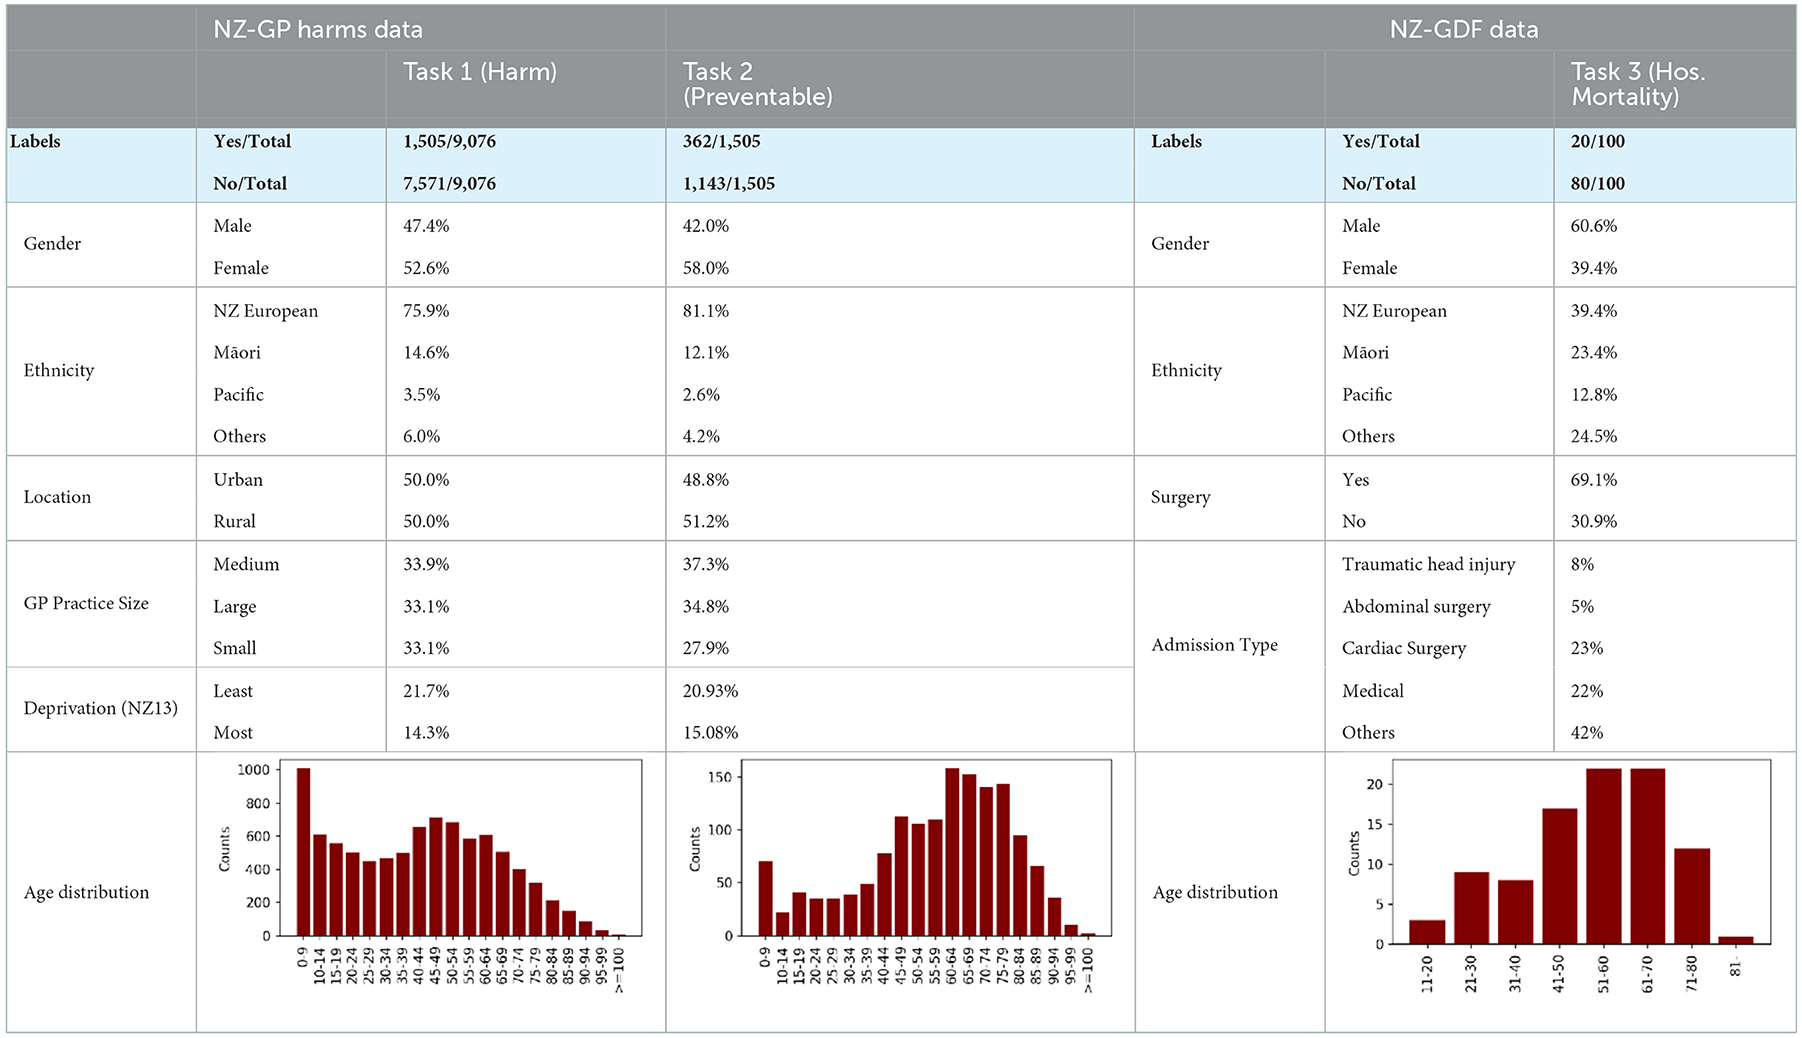
Table 1. Summary of NZ-GP Harms Data for Task 1 predicting patient harm; Task 2 predicting preventable harm among patients where harm is identified; and Summary of NZ-GDF Data for Task 3 predicting hospital mortality.
3.1.2. The NZ-GDF dataset
The NZ-GDF Dataset consists of a collection of data, in tabular form, for developing new scoring systems for Gastrointestinal dysfunction/failure (GDF). The GDF study was designed and conducted by healthcare experts at one of the tertiary hospitals in New Zealand with a mixed surgical-medical intensive care unit (ICU). Due to the specific eligibility criteria of patients, this study includes data across several days for only a hundred patients.
All consecutive patients in the period 2019 to 2020 admitted to intensive care units were screened and recruited for the study if they met the eligibility criteria. Inclusion criteria included:
• The patient's age (> 18 years)
• Receiving enteral and parenteral nutrition
• The ability to screen within the first 24 h of admission to ICU
• The likelihood of a stay in ICU for more than 72 h
Data were prospectively collected from the day of admission to ICU (Day 0) until “the day of discharge” or “after 90 days,” whichever occurred first. Patients were evaluated based on data extracted from clinical notes, daily 24-h ICU observation charts and nursing care plans. Patients were allocated with a non-identifiable study number, and all collected data variables were entered into a password-protected secure file for data coding and statistical analysis.
Data extraction included baseline characteristics and demographic data, ICU treatment data, gut dysfunction and gastrointestinal scoring, and ICU and hospital outcome data. Where variables were within the normal range, the variable closest to the time of data collection was recorded. The variables collected at multiple time points were calculated for an overall mean or median value. For laboratory variables, the most abnormal value was taken for each day. The gastrointestinal scoring categories were evaluated individually and in a binary fashion for a smaller sample size. Table 1 provides summary statistics of selected features from this detailed study. For this paper, we focus on predicting hospital mortality.
3.2. Classification tasks
The design of a task for which an AI model is developed can also influence the introduction of bias. This research aims to build AI models for the following tasks:
Task 1: Predicting patient harm from tabular and text data
Task 2: Predicting preventable harm from tabular and text data
Task 3: Predicting hospital mortality from tabular data
Task 1: Total number of patients with EHRs is 9,076, and the experts identified harm in 1,505 patients. Task 2: Total number of patients with identified harm is 1,505, where the experts identified preventable harm in 362 patients. Task 3: Total number of patients used for this study is 100, where patients with hospital mortality outcomes are 20.
Table 1 provides a summary of a selection of variables for each tasks. Tasks 1 and 2 use the same NZ-GP Harms data, with different algorithmic designs where the number of patients will be 9,076 and 1,505, respectively. Task 3 uses the NZ-GDF dataset with a much smaller instance of 100 patients.
3.3. Fairness measures
Many countries worldwide have anti-discrimination laws that prohibit unfair treatment of people based on specific attributes, also called sensitive attributes, such as gender or race (Zafar et al., 2017). These laws evaluate the fairness of a decision-making process by disparate treatment and disparate impact. The process suffers from disparate treatment if a decision is based on sensitive attributes. Automated decision-making systems, such as AI-based systems, are often trained on historical data. Hence, if a group with a specific sensitive attribute value was unfairly treated in the past, this unfairness may persist in future predictions through indirect discrimination, leading to disparate impact (Feldman et al., 2015; Zafar et al., 2017).
Fairness measurements can help identify and mitigate the biases (Rajkomar et al., 2018). In this research, we focus on group fairness instead of individual fairness, where both privileged and unprivileged groups are defined based on sensitive attributes. In general, the unprivileged group are defined based on the evidence of historical injustice in the past and is the group that will most likely face unfair decisions from a biased model. As such, for our research, we define “NZ Europeans” as the privileged group and “Māori” as the unprivileged group. For evaluating gender bias, we consider “Females” as the unprivileged group as defined by other literature (Zafar et al., 2017).
3.3.1. Disparate impact scores
Disparate impact (DI), a notion introduced in the US legislation in 19713, is simply the ratio of rates at which the outcomes occur for one group of patients over the rest (Feldman et al., 2015; Zafar et al., 2017; Besse et al., 2022). The defined tasks in this research (see Section 3.2) are binary classification problems with sensitive attributes defined for gender and race. We use the notations as per Besse (Besse et al., 2022) where:
• The predicted variable is Y, where Y = 1 is a positive/true outcome (i.e., patient experience harm) and Y = 0 is a negative/false outcome.
• g(X) = Ŷ is the algorithmic prediction.
• S is considered the sensitive variable that should not influence the decisions but could lead to discriminatory decisions. S = 0 indicates minority could be discriminated against, and S = 1 represents the majority.
Data bias is measured using:
Algorithmic bias is measured using:
The US legislation introduced a rule where the threshold for DI(g, X, S)>τ was set at τ = 0.8. The acceptable range for DI ratio is generally between 0.8 and 1.25.
Although we use DI for data bias and algorithmic bias measures in our research, it is essential to point out that the DI metric shows disparities in outcomes without accounting for any other factors. This assumes that we should strive for equality in the distribution of outcomes, given that all people are “created equal,” which may involve looking outside the scope of a given healthcare system alone.
3.3.2. Equal opportunity
In the binary case, if we consider Y= 1 as the “advantaged” outcome, the equal opportunity requires non-discrimination only within the “advantaged” outcome group (Hardt et al., 2016).
Equal opportunity or true positive rate (TPR) is defined as:
where TP refers to true positives and FN refers to false negatives.
Equal opportunity considers a model to be fair if the TPRs of the privileged and unprivileged groups are equal. However, this approach does not consider the needs of each population and hence may not result in equitable outcomes. Some leeway for statistical uncertainty is given in practice, where the difference is less than a specific cutoff. Determinations of such cutoff come down to governments and policies.
3.3.3. Equalized odds
Equalized odds is a fairness metric that checks if, for any particular label and attribute, a classifier's predictions are equal for all values of that attribute (Hardt et al., 2016). Compared to equal opportunities, equalized odds are a stricter definition of fairness. Like with equal opportunity, this definition requires that the TPRs are equal. However, equalized odds also require that the FPRs are equal. A false positive rate (FPR) is defined as:
where FP refers to false positives and TN refers to true negatives.
3.4. Understanding bias in text data
The fairness metrics introduced above focus predominantly on tabular data. However, the free-form medical text can also be a source of bias. Other sources of bias include, but are not limited to, bias associated with the patient's ability to access healthcare and the biases of the clinician writing in the medical record. In this research, data bias refers only to the bias in tabular and textual data.
Medical text in free-form includes acronyms and abbreviations. Hence even simple changes, such as converting uppercase letters to lowercase or omitting full stops, can result in a different meaning. In this paper, the free-form text data was pre-processed by removing tokens that contain non-alphabetic characters, including all special characters and tokens that appear in fewer than three training documents (Yogarajan, 2022).
The free-form medical text in the NZ-GP Harms dataset is predominantly written in English, but includes some te reo Māori. Automatic language detection in code-switched English-Māori text is an area of ongoing current research (James et al., 2022; Trye et al., 2022). For the purpose of this research, Māori language was identified manually.
We consider the most frequent tokens that can incorporate bias to form a preliminary understanding of the bias in text data. In classification tasks, the frequency of tokens is used in Bag-of-words (BOW) representations of text. The BOW approach is a simple, yet effective method (Goldberg, 2017; Joulin et al., 2017), for representing text.
Furthermore, we also explore the option of using popular word embeddings to represent text (Goodfellow et al., 2016; Goldberg, 2017). However, there is evidence that indicates the pre-trained embeddings exhibit biases (Caliskan et al., 2017; Badilla et al., 2020). Word Embedding Association Test (WEAT) (Caliskan et al., 2017) and Relative Norm Distance (RND) (Garg et al., 2018) are examples of fairness metrics designed to quantify bias in embeddings. Word Embedding Fairness Evaluation (WEFE) (Badilla et al., 2020) is a framework designed to measure fairness in word embeddings using metrics such as WEAT and RND.
This paper makes use of WEFE's implementations of WEAT to analyze selected popular word embeddings, namely, Google's Word2Vec model (word2vec-google-news-300)4, FaceBook's fastText model (fasttext-wiki-news-subwords-300)5 and GloVe model (glove-wiki-gigaword-300)6.
WEFE and WEAT use similar notations where two sets of target words T1 and T2 and two sets of attribute words A1 and A2 are expected to be defined such that the query (Q) is formed.
Given that the word embedding w and cos(w, x) is the cosine similarity of the word embedding vectors, WEAT first defines the measure as:
Resulting in WEAT fairness metric:
If the output of FWEAT is positive then the target T1 will be related to attribute A1 and target T2 to attribute A2. However, if FWEAT is negative target T1 will be related to attribute A2 and target T2 to attribute A1. FWEAT values are usually between ±0.5 and ±2, and the ideal score is 0.
3.5. Experimental setup
For this research, we use machine learning models such as logistic regression (Bisong, 2019), XGBoost (Wang et al., 2020), and EasyEnsemble. XGBoost -Extreme Gradient Boosting- is a scalable supervised machine learning algorithm built upon decision trees, ensemble learning, and gradient boosting. EasyEnsamble (Liu et al., 2009) is an ensemble of AdaBoost learners trained on different balanced bootstrap samples, where random under-sampling is used to achieve balancing. We use sklearn7 implementations for these classifiers with 10-fold cross-validations.
This research aims to address the need for socially responsible, fair, trustworthy AI for healthcare for NZ populations. As such, we focus more on assessing fairness measures and not on improving prediction model accuracy. The choice of the above algorithms is based on the extent of available examples in the literature that support these algorithms for healthcare applications (Hotzy et al., 2018; Luo et al., 2019; Tong et al., 2020; Yao et al., 2020; Barak-Corren et al., 2021; Peng et al., 2021; Snider et al., 2021; Wu et al., 2022). However, it is vital to point out, in this paper we avoid complicated “black-box” algorithms such as neural networks. A black box model, in this context, can be defined as a machine learning based algorithm such as sophisticated neural networks which receives data input and produces outputs/predictions using thousands of parameters while the explanation for that prediction remains unknowable and untraceable (Guidotti et al., 2018). Deep-learning models and other sophisticated models will be considered in future research.
We use tools such as SHAP (Shapley Additive exPlanations) (Lundberg and Lee, 2017) and LIME (Local Interpretable Model-agnostic Explanations) (Ribeiro et al., 2016) to interpret and explain model outputs. SHAP force plots are used to understand the model outputs of a given patient (referred to as local interpretability of model output). SHAP Summary plots are used to understand the overall model output (i.e., global interpretability of model output). LIME is used for free-form text data.
Chi-squared (χ2) test of independence is used to test if there is a significant relationship between the two classes “Harm” and “no Harm” given a token. The null hypothesis is that there is no relationship between the token in class “Harm” and class “no Harm.”
4. Experimental results and analysis
This section presents an analysis of the fairness measures and bias indicators for the three tasks using the New Zealand data for both data and algorithmic bias. In this research, we treat tabular data separate from text data. However, we acknowledge that both data types can be combined in a multi-modal setting to address the tasks. Multi-modal AI models are out of the scope of this research and will be addressed in future research.
4.1. Data bias
4.1.1. Tabular data
Tables 2, 3 present DI scores for NZ-GP Harms data and NZ-GDF data for sensitive gender and ethnicity groups. For ethnicity, “NZ European” is considered the privileged group and Māori (and Pacific) are considered unprivileged groups. Table 2 indicates no bias for sensitive group gender across all three cases, where the DI scores are perfect “1.” NZ-GDF data indicates no bias toward or against Māori and Pacific populations. NZ-GP data was used for two tasks, predicting harm and predicting preventable harm. The main reason for this is to check how an algorithmic design (i.e., research task design) results in bias as indicated by Obermeyer et al. (2019). NZ-GP data was collected with extensive care by health professionals to ensure the inclusion of the NZ population (Leitch et al., 2021). This is reflected in the DI scores of task 1, where no data bias is indicated toward the Māori population. However, for task 2, where only a subset of data is used, there are clear bias indicators for both Māori and Pacific groups.
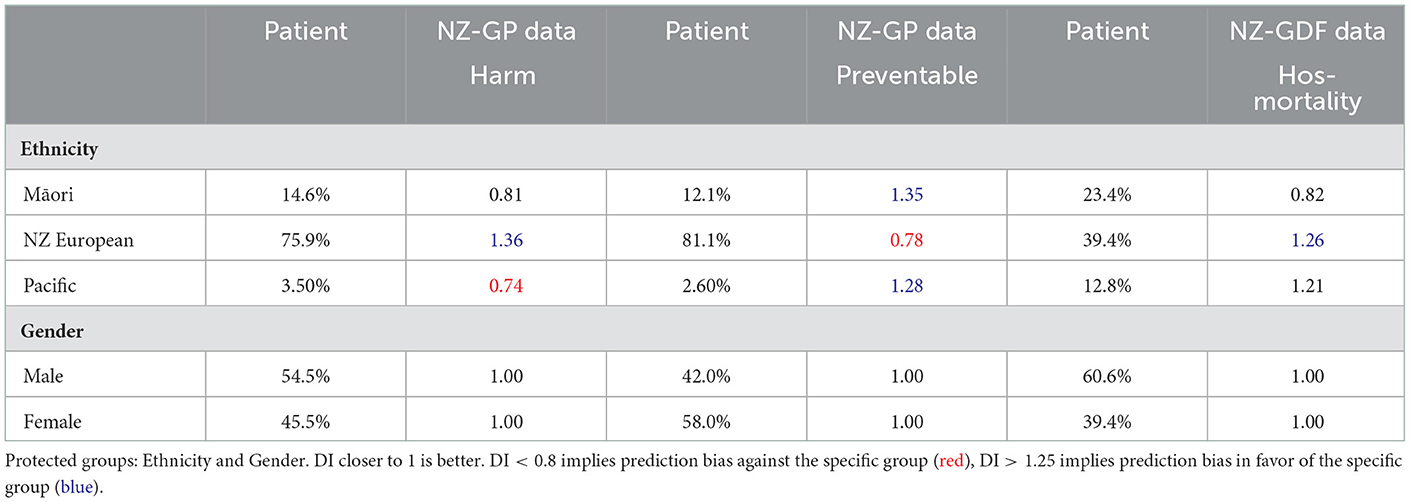
Table 2. Disparate Impact (DI) values of NZ-GP Harms data with targets: Harm Status and Preventable Harm Status, and NZ-GDF Data with targets: Hospital mortality.
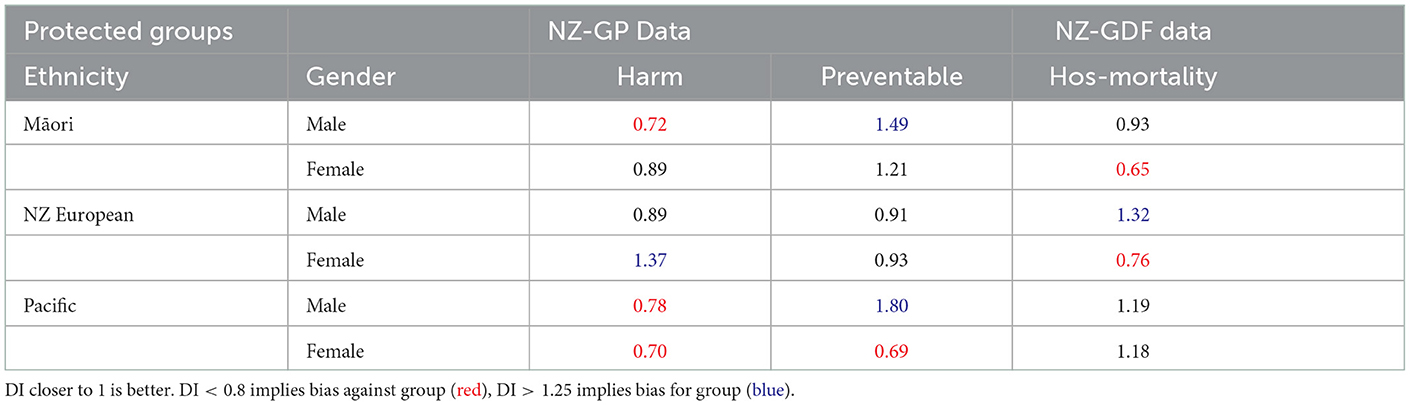
Table 3. Disparate Impact (DI) values of NZ-GP Harms data with targets: Harm Status and Preventable Harm Status, and NZ-GDF Data with targets: Hospital mortality. Protected groups' ethnicity and gender are combined.
Table 3 presents DI scores where both sensitive groups are combined. In this case, there is a noticeable difference in DI scores across all three tasks and definite indicators of bias. This is an observation which requires further investigation in the future. It will require a larger range of NZ health data to verify if there is a clear pattern.
4.1.2. Free-text data
This section will only consider NZ-GP Harms data for task 1 to understand the impact text data has over bias. NZ-GDF data does not include free-form medical text, hence is not included.
To analyze the free-form text, we examined the most frequent tokens, and a subset of tokens with possible gender or Māori reference was selected. Figure 4 provides the frequency of such tokens, which can be considered biased due to gender or ethnicity references.
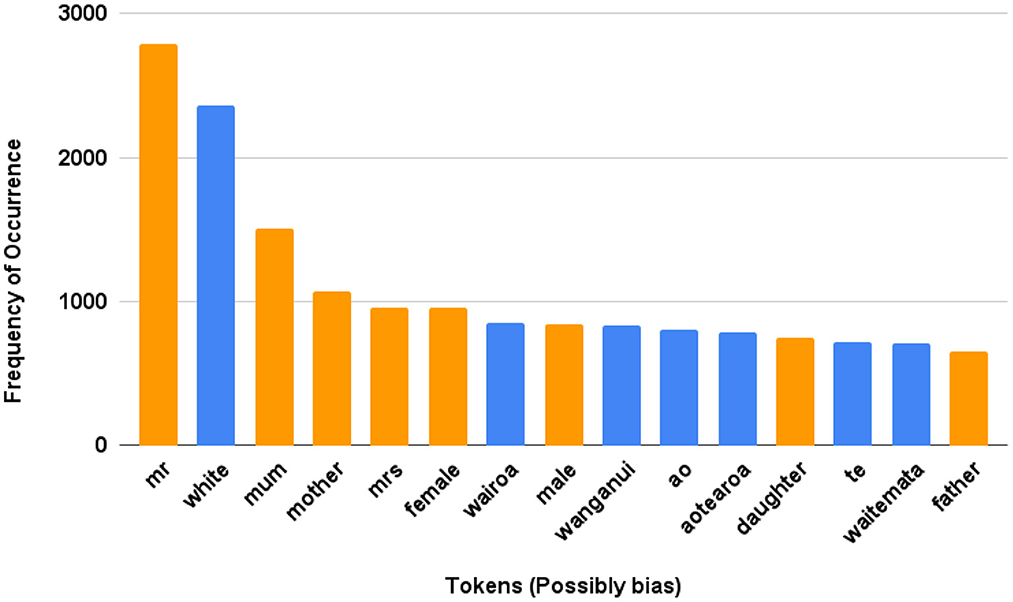
Figure 4. NZ-GP Harms Data (Task 1). Examples of possible tokens among the most frequent tokens where possible bias due to references and tokens are presented. Māori tokens: “wairoa” means long water, “Wairoa” is also a district name; “Wanganui” is a district, city and river name; “ao” means world; “aotearoa” is the Māori name for New Zealand which can be directly translated as the land of the long white cloud; “te” means the; “waitemata” is a name of a district and habour, and it means obsidian waters.
Furthermore, we use WEAT to analyze the bias in selected embeddings for a given query. Table 4 provides FWEAT scores for embeddings with selected targets and attributes from Table 5. The scores are mostly not close to ‘0', indicating some bias in the embeddings for given targets and attributes. For example, the negative values in T1 and T2 with respect to A2 and A3 across all three embeddings indicate the target T1 “Ethnicity” is related to attribute A3 “exercise” and T2 “Gender” to “health” with the most negative value being from GloVe embeddings. These relationships provide some understanding among a set of target words and attributes. However, there is a need to investigate domain-specific embeddings further and handle OOV words to ensure the bias, if present, toward Māori can be addressed at the embedding level before developing an AI model such as a neural network.
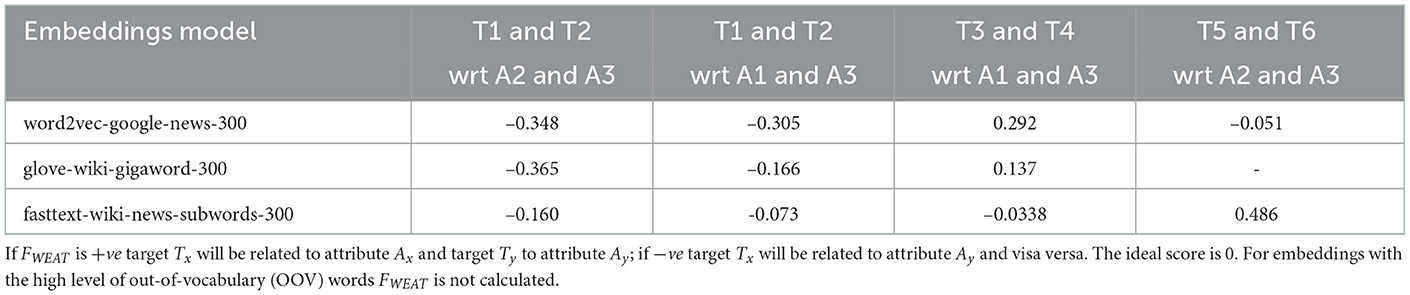
Table 4. FWEAT scores for embeddings with selected targets and attributes from Table 5.
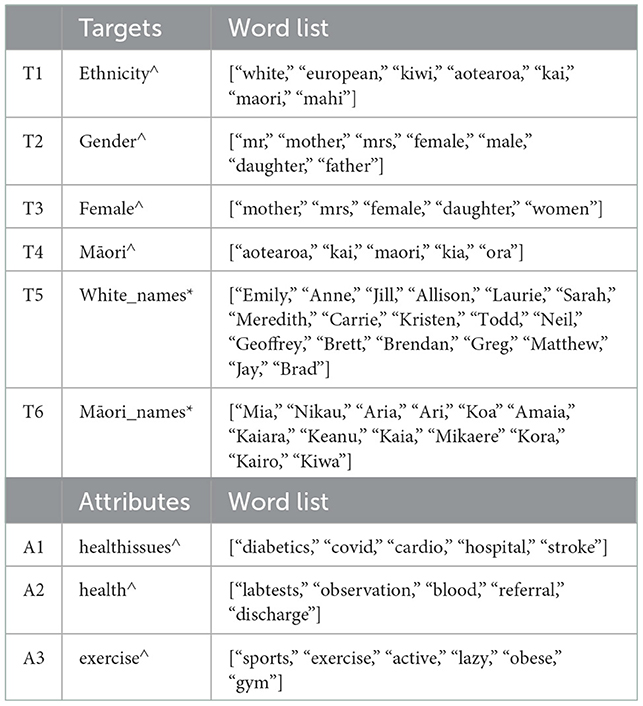
Table 5. Collection of target and attribute word lists used. ∧ word lists created by us. * common/popular names obtained from google search.
4.1.3. In summary
In a nutshell, in this section, we have considered data bias in both NZ-based EHRs, and both tabular and free-form text data. We use two very distinct NZ datasets, one obtained from one hospital and another from multiple GP practices, where clinicians obtain both datasets. The NZ-GP Harms data were carefully collected to limit bias. However, this does not include the bias associated with the patient's ability to access healthcare and the biases of the clinician writing in the medical record.
The DI scores across the two datasets and three tasks for the protected groups provided an analysis of the tabular data. Considering the Māori patient data, when the algorithmic design included the complete datasets, there was no data bias in both datasets. However, for task 2, where only a subset of data was used, there was clear evidence of data bias. Although, in general, gender groups showed no evidence of bias, when both protected groups were combined, the observations were more interesting. Being a Māori male indicated bias scores for NZ-GP data for both tasks while being Māori female indicated bias DI scores for NZ-GDF data.
Furthermore, to analyze text data, we consider the two popular methods of representing text in natural language processing tasks—BOW and word embeddings. Given that BOW is formed using the frequency of tokens, we examine the most frequent tokens to identify tokens that reference some bias indicators. These tokens analyze the algorithmic bias when BOW with logistic regression is used for predictions. We also measured FWEAT scores for the most commonly used embeddings using the WEFE framework when a selection of target tokens and attributes were used. The FWEAT scores indicated relationships among targets and attributes. The relationships among targets and attributes are a clear example of unintentional bias, and as such, it is vital to recognize such possibilities and work toward mitigating them.
4.2. Algorithmic bias
4.2.1. Tabular data
We use machine learning algorithms such as logistic regression, XGBoost, and EasyEnsemble to analyze algorithmic bias across all three tasks. Although we do not emphasize or explore techniques to improve the prediction accuracy of such algorithmic models, Supplementary Table S1 presents sensitivity and specificity scores for reference.
Figures 5, 6 present DI scores across three tasks with classifiers, where 10-fold cross-validation is used. DI scores are calculated at each fold for the data and the classifiers, and the box plots provide the range of DI scores. Lines are used to indicate 0.8 < DI < 1.25 for reference. Using an algorithm introduces bias to data, even in cases where the data displays no signs of bias.
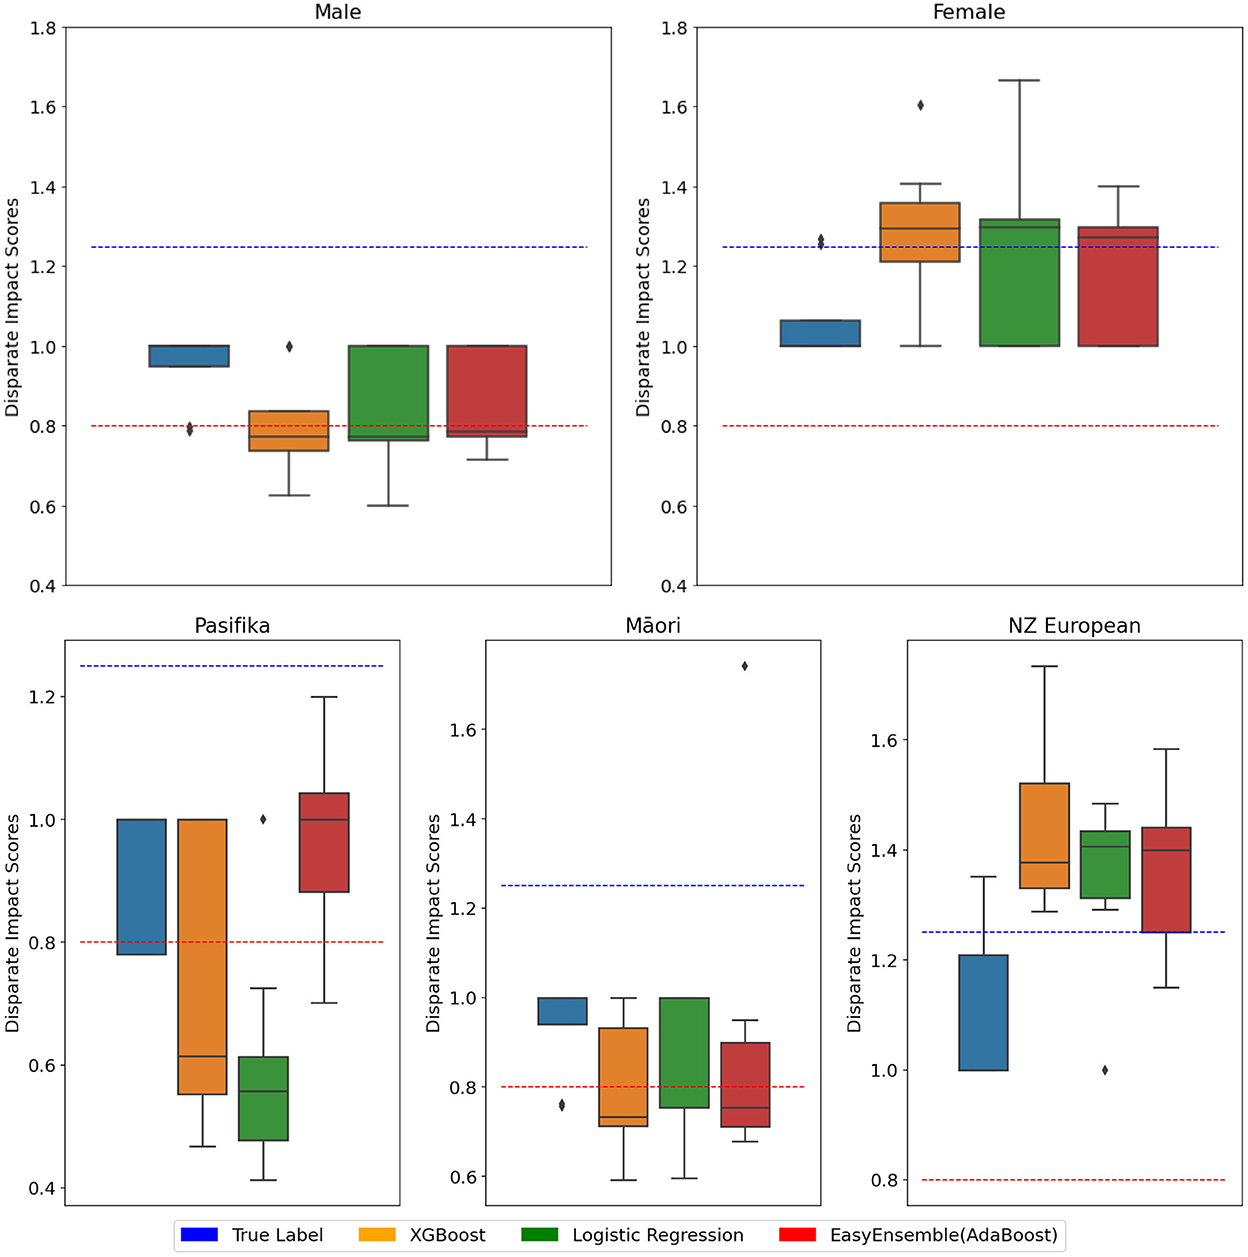
Figure 5. NZ-GP Harms data with the target as patient Harm Status. Protected group: Gender (Top), ethnicity (Bottom). 10-cross-validation is performed using three classifiers, and the DI score is calculated at each fold. DI values of true values are also included. Each box plot ranges from minimum to maximum values of DI scores calculated at each fold. DI scores closer to 1 are better. DI < 0.8 implies bias against group (indicated by ), DI > 1.25 implies bias for group (indicated by ).
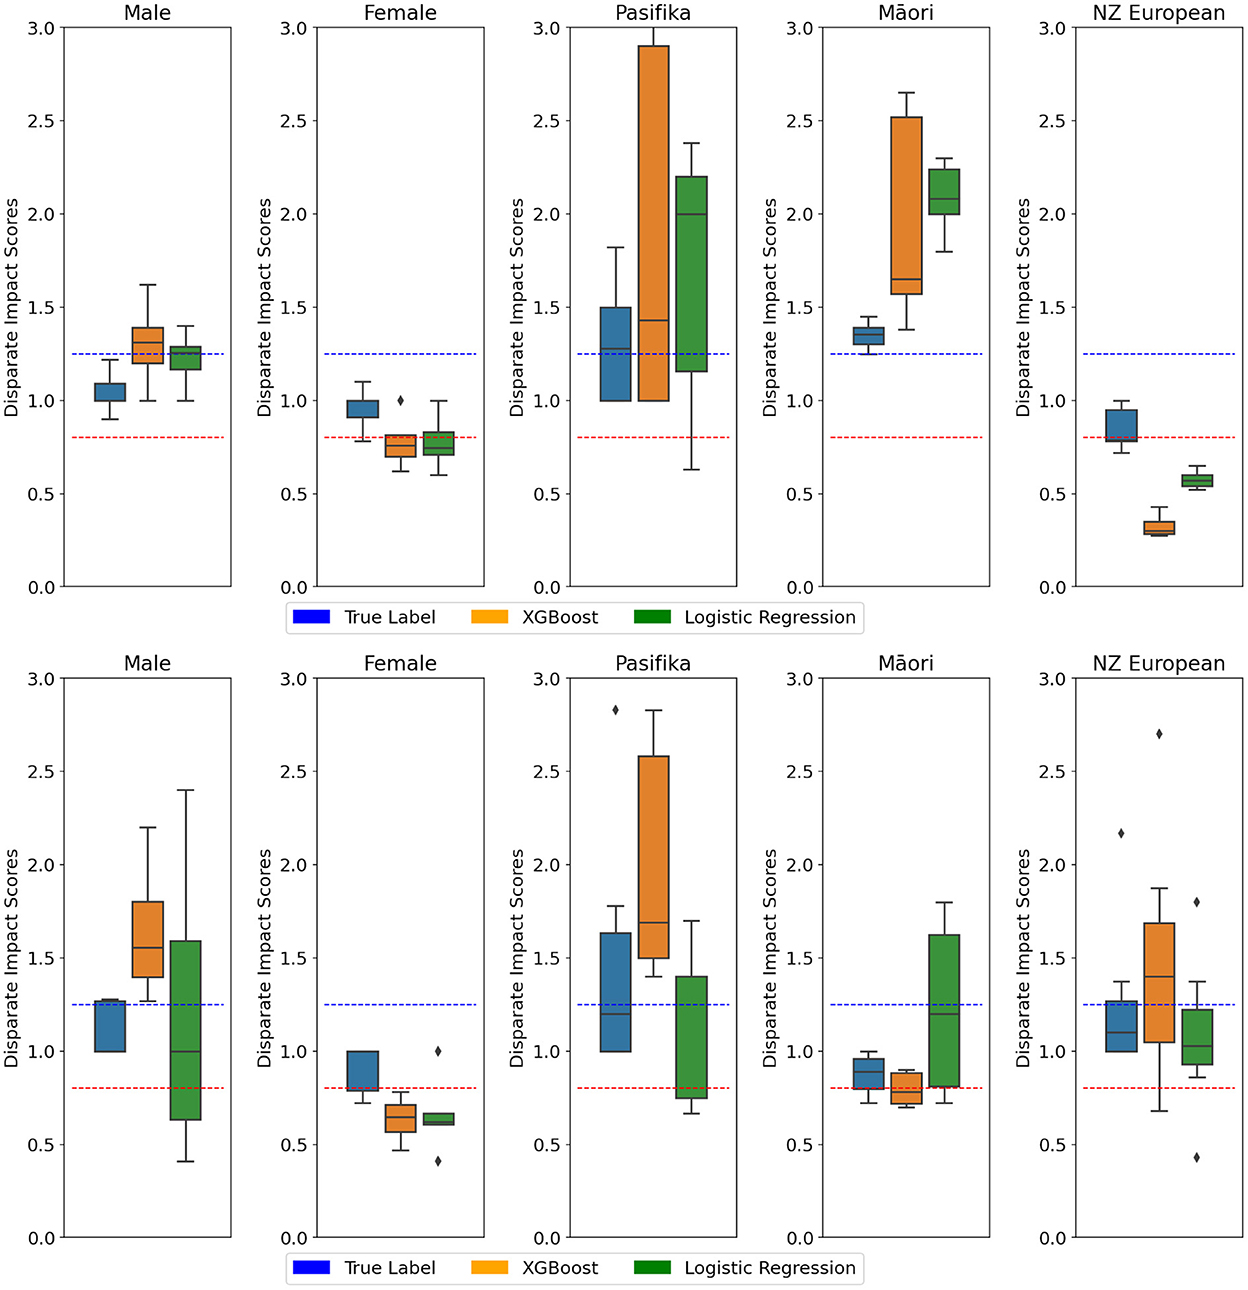
Figure 6. (Top) NZ-GP Harms data with the target as preventable Harm. (Bottom) NZ-GDF hospital mortality prediction. Protected group: Gender and Ethnicity. Ten cross-validations are performed using two classifiers, and the DI score is calculated at each fold. DI values of true values are also included. Each box plot ranges from minimum to maximum values of DI scores calculated at each fold. DI scores closer to 1 are better. DI < 0.8 implies bias against group (indicated by ), DI > 1.25 implies bias for group (indicated by ).
Table 6 provides equal opportunity and false positive rates for privileged groups. Equalized odds are when equal opportunity and FPR are expected to be the same across all groups. This means the ratio needs to be as close to “1” as possible in TPRs and FPRs. Equal opportunities are closer to “1” across all three classifiers for gender and ethnicity, while the same observation is not evident with FPRs and consequently equalized odds. For ethnicity, where the privileged group is “NZ European,” XGBoost presents the best ratio for both equal opportunity and equalized odds. In the case of gender, where the privileged group is “Male,” equal opportunity ratio across all three classifiers are approximately “1,” however FPR across all three classifiers are high with logistic regression being the worst of the three.
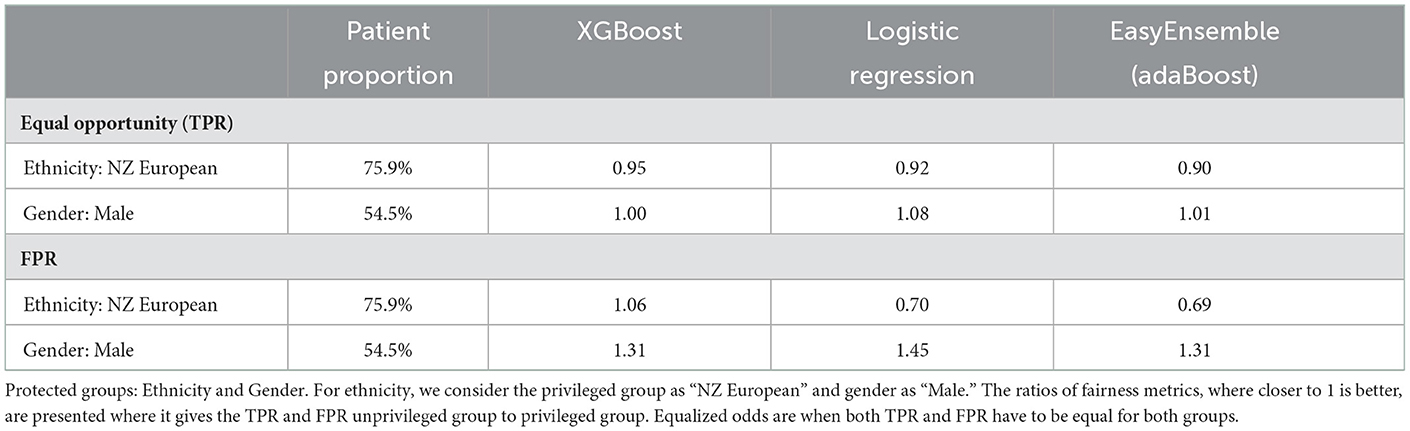
Table 6. NZ-GP Harms data.
To further understand the model outputs, we use SHAP visualization tools. Figure 7 provides examples of two patient outputs from XGBoost and Logistic regression. Forces of Shapley values in blue represent the features that increase the probability of default (in this case, “Harm”). In contrast, red values represent the features incrementing the probability of prediction. Furthermore, a summary plots of XGBoost and LR is also presented as Supplementary Figure S1. The SHAP summary plot allows us to understand the model by ranking the features from the most relevant to the least important ones, where the data points represent a different patient. High values of this feature impact the output of the model (i.e., the probability of predicting harm increases).
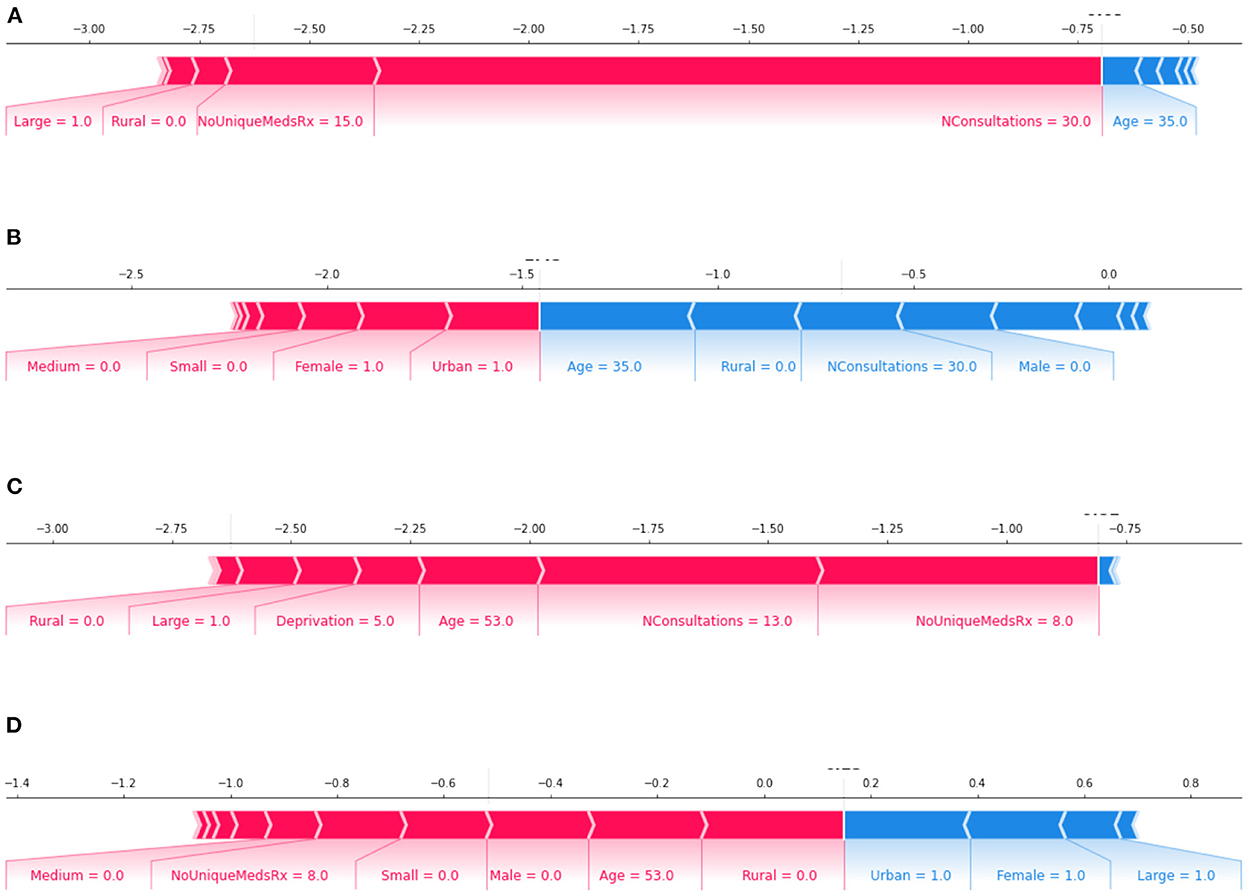
Figure 7. features: increase the prediction of true label; features: decrease the prediction of true label of the model. Plots (A, B): Output of a 35-year-old Māori female patient; where plot (A) XGBoost correctly classifying as “no Harm” and plot (B) logistic regression wrongly classifying as “Harm.” Plots (C, D): Output of a 53-year-old NZ European female patient; where plot (C) XGBoost wrongly classified as “no Harm” and plot (D) logistic regression correctly classified as “Harm.”
In both Figures 7 and Supplementary Figure S1, the influence of “Gender” on final model predictions is evident. However, despite the DI score indicating algorithmic bias, features of “ethnicity” are far lower in the features that impact the outcome. One possible reason for this difference is that the sensitivity of chosen models for the tasks is not high (i.e., the models are being too cautious in finding a positive result).
4.2.2. Free-text data
For Task 1, we experiment using BOW to represent free-form text with a dictionary size of 1,000 and 10,000 with logistic regression as a classifier. The sensitivity and specificity scores of BOW with logistic regression for task 1 using dictionary size 1,000 is 0.74 and 0.69 and using dictionary size 10,000 is 0.60 and 0.68, respectively.
To understand the data and check if the frequency of words/tokens is significantly different between the labels, we use the chi-squared test. Using the selected tokens presented in Figure 4, the output of chi-squared test is presented in Supplementary Table S2. The p-value for gender-related tokens is 0.076 and ethnicity-related tokens is 0.51. Given both are >0.05, the null hypothesis at 95% level of confidence is not rejected. The null hypothesis was that gender or ethnicity related tokens and the harm labels are independent.
Furthermore, we use both LIME and SHAP for task 1 with BOW text representations with LR using NZ-GP Harms data to understand individual predictions. Supplementary Figure S2 presents two patient output examples, where selected features that influence the outcomes and the influential features from a collection of Bias tokens (see Figure 4 for the complete list) are included.
Figure 8 provides examples of LIME outputs for two patients indicating the features that influenced the algorithmic decisions on “Harm” or “no Harm.” Gender indicating the token “Mother” is visible in the example as a feature that influenced against true label (i.e., “Harm” for this example). While these examples do not display ethnic references, in the top 10 features, there is no clear indication that this may not be the case for overall predictions.
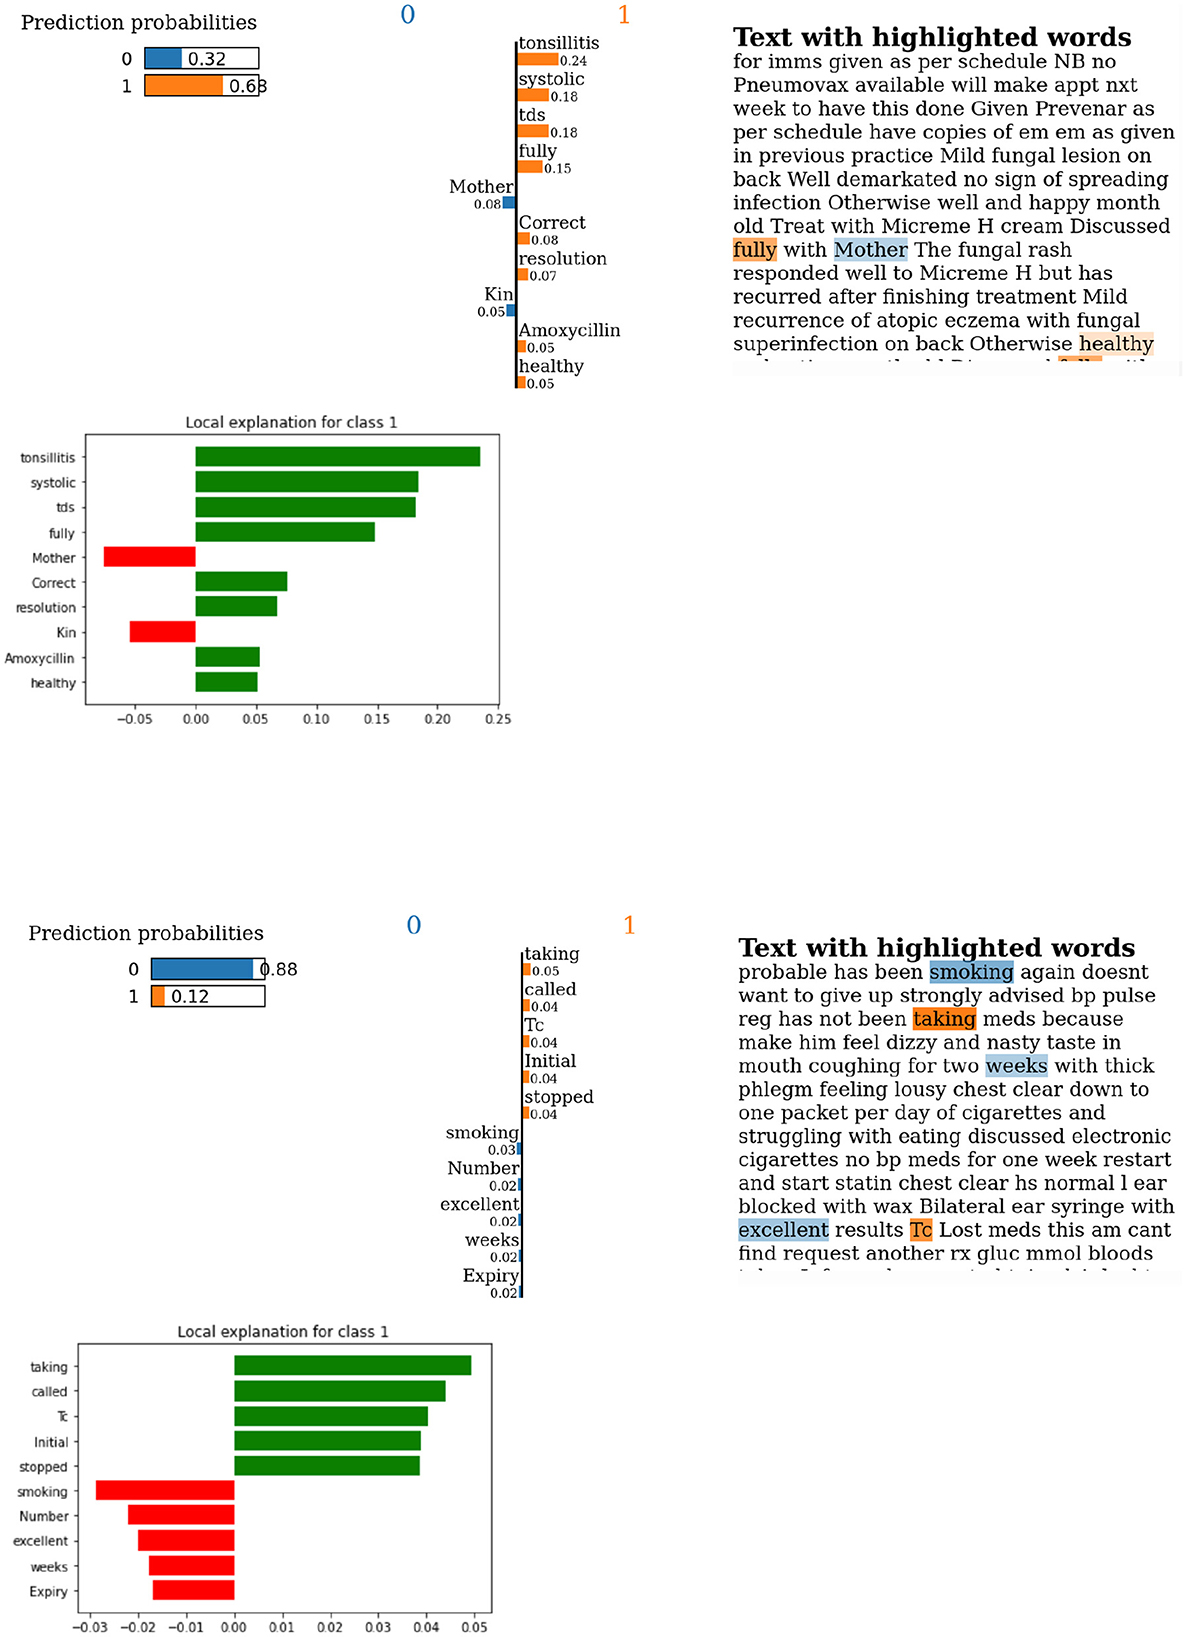
Figure 8. Lime output for examples of predictions using BOW with LR using NZ-GP Harms data. (Top) True label and prediction label are both indicating “Harm.” (Bottom) True label is “Harm,” but predicted is “no Harm.” Label 1 is “Harm,” and label 0 is “no Harm.”
4.2.3. In summary
We use simple machine learning algorithms –logistic regression, XGBoost, and EasyEnsemble– to model the three prediction tasks. The DI scores were used to observe the algorithmic bias, and the results show algorithmic bias even for cases with no data bias. Equal opportunity and equalized odds ratios for privileged groups indicate that XGBoost is the best model for ethnicity. For gender, although equal opportunity ratios for all three classifiers are approximately “1,” equalized odds ratios are not.
For text data, there was evidence of the selected possible bias tokens from frequent tokens that showed a significant difference between the labels “Harm” and “no Harm” for BOW with logistic regression.
Furthermore, SHAP and LIME were used to explain individual instances and predictions. For tabular data, while there are clear indications of algorithmic bias for ethnicity and gender, SHAP outputs only show evidence of gender-related features. Likewise, for text data, LIME outputs also show evidence of gender-related features. These observations can result from many factors, including the model choices. However, there is a need for future research to reach a conclusive decision.
5. Discussions
The general results of this research show that bias was detected within the machine learning methods employed in this study. As expected, there were two sources of bias, the data and the algorithms used to predict preventable harm. Within the tabular data, DI scores indicated biases surrounding different ethnic groups. However, the favored groups changed depending on the target measure (Tables 2, 3). There were no biases detected for gender groups collected in these samples. There may also be bias indicated by the frequency of terms used in free text data, although the implications are currently unclear (Figure 4). Algorithmic bias is harder to summarize as there was an apparent effect on the subset of the data the model was trained on Figures 5, 6. The DI scores produced by training on one subset indicated bias in favor of the target group, and those from training with another subset indicated bias against that same group. With these results, it can be suggested that the data itself can heavily influence algorithmic bias. A more extensive research question is how data and algorithms interact with product bias.
Furthermore, the outputs of DI scores for prediction models and the explainable AI techniques of model predictions do not provide similar observations. While this may be due to the selection and accuracy of algorithmic models, there is a need to explore other factors. What if the need for techniques to analyze bias or equity measures is also subjective to the variation in populations (i.e., NZ vs. the USA)?
5.1. Possible introduction of bias
Using real-world datasets introduces challenges such as missing data and smaller datasets. Standard practices dealing with missing data include leaving out the data with missing variables and imputing missing values. Removal of data with missing values results in information loss and can also create unfair/biased data (Farhangfar et al., 2007; Madhu and Rajinikanth, 2012; Madhu et al., 2019; Ipsen et al., 2022). The magnitude of potential data biases will be subject to the percentage of removed data concerning the complete data and the distribution changes in protected groups concerning the privileged group. Imputation of missing values is generally based on the correlation of other features, and the resulting dataset can include biases (Madhu et al., 2019; Ipsen et al., 2022). The NZ-GP Harms dataset includes a small subset of missing data and is dealt with by the removal of the data. Future work using this dataset will attempt to quantify any possible introduction of biases.
The NZ-GDF dataset did not include any missing data. However, the sample size is small (100 patients). The main challenge in small data is over-fitting which can potentially cause data and algorithmic biases. This paper uses simple machine learning models and 10-fold cross-validations to minimize over-fitting. Data augmentation is one of the most common approaches to dealing with small datasets. There are examples in the literature which show data augmentation techniques can help reduce data bias (Jaipuria et al., 2020; Sharma et al., 2020). Exploring possible data augmentation techniques to deal with small datasets while possibly minimizing data and model bias is a future research avenue.
5.2. Implications for New Zealand healthcare
This research used NZ EHRs to analyze data and algorithmic bias. We considered two tasks for NZ-GP Harms data. The algorithmic design was such that predicting harm used all available data while predicting preventable harm used a subset of data. Despite the efforts toward unbiased data collection, we notice bias in predicting preventable harm. This emphasizes the need to consider the potential ways in which the data will be used to ensure unintentional bias can be eliminated.
Furthermore, we provide evidence that using commonly available pre-trained embeddings to represent text data also acts as a new source of bias. While this was not intentional at the data collection or model development stages, these observations suggest a need for further analysis. Furthermore, they raise questions about the current employment of AI in NZ healthcare. Are changes necessary to adapt these generic measures and thresholds to the New Zealand context? Do these models adequately represent Māori data specifically suited for the task? If not, do they risk worsening existing inequities, even if developed and used with the best intentions? If used to guide clinical decision-making or resource allocations, would they entrench systemic or societal biases under the guise of impartiality?
This research analyzed fairness metrics for NZ EHRs while considering data and algorithmic bias. We provided an overview of reproducible concepts that can be adapted to any NZ population data. Furthermore, we discuss the gaps and future research avenues that will enable more focused development of fairness measures suitable for the New Zealand population's needs and social structure. A primary focuses of this research was ensuring fair inclusions. As such, we combine expertise in AI, clinical knowledge, and the representation of indigenous populations. This inclusion of experts will be vital moving forward, proving a stepping stone toward the integration of AI for better outcomes in healthcare.
Figure 1 provided an overview of the AI/ML cycle where the two primary stages included building a model and model application. We believe an ideal AI/ML cycle should include an in-between stage, where data and model bias needs to be identified and mitigated before applying the model. Hence, the modified AI/ML cycle would be:
Step 1: Building a model
Step 2: Identifying and mitigating data and model bias
Step 3: Model application
Steps 1 and 2 will require multiple iterations to ensure a satisfactory outcome before reaching step 3. Step 2 will require “Humans,” i.e., the experts mentioned above, input to ensure data and model bias are identified and mitigated. Moreover, this inclusion will enable the required threshold changes to satisfy the NZ population's needs. Future research will include extensive discussions and possibly interviews or studies with other experts in the field to help understand the real-world implications, validate and improve these measures and lead to ways to mitigate biases along data collection, model training, evaluation and interpretation.
The aim of developing socially responsible, fair machine learning algorithms to improve the healthcare outcomes of underrepresented and indigenous populations is a vital avenue of research and has a magnitude of impact on the equality of healthcare across the world. In New Zealand, the ongoing health system reforms and the inclusion of a new Māori health authority are expected to provide opportunities and platforms for health equity.
Data availability statement
The data analyzed in this study is subject to the following licenses/restrictions: Anonymised datasets may be made available on reasonable request from the corresponding authors. Code can be found at https://github.com/vithyayogarajan/HealthAI-Bias-Data-Model-NZ. Requests to access these datasets should be directed to c2hhcm9uLmxlaXRjaEBvdGFnby5hYy5ueg==.
Ethics statement
The studies involving human participants were reviewed and approved by University of Otago Human Ethics Committee University of Auckland Ethics Committee. Written informed consent from the participants' legal guardian/next of kin was not required to participate in this study in accordance with the national legislation and the institutional requirements.
Author contributions
VY was the lead researcher of this study and was responsible for coordinating and collaborating with the listed co-authors and also responsible for the following: code, validation, experiments, research goal/questions development, writing the original draft, and reviewing and editing. In addition to VY, other AI research experts includes GD, JB, and MW. GD contributed toward research goal development and reviewing and editing. JB also contributed toward writing, reviewing, and editing. NZ clinical experts are SL, VA, and DR. SL was the clinical coordinator of the NZ-GP Harms study and as such is responsible for data and ethics and contributed toward the understandings of healthcare implications of NZ population, reviewing, and editing. DR also contributed toward reviewing and editing. VA was the clinical coordinator of the NZ-GPF study hence responsible for data and ethics and also helped with reviewing and editing. Māori research academics in this paper are TK and JB. TK is an expert in te ao Māori and also contributed toward reviewing and editing. All authors contributed to the article and approved the submitted version.
Funding
The original data collection studies were funded by the Health Research Council of New Zealand. Frontiers of Computer Science ISSN 2095-2236 is included in the 2022 Read and Publish agreement with the University of Otago, as an associate member of the CAUL (Council of Australian University Libraries) Procurement consortium.
Acknowledgments
We thank Dr. David Welch for reviewing this paper and for his constructive suggestions and comments. VY would like to thank the Strong AI lab for the ongoing support and the University of Otago for the computer resources.
Conflict of interest
The authors declare that the research was conducted in the absence of any commercial or financial relationships that could be construed as a potential conflict of interest.
Publisher's note
All claims expressed in this article are solely those of the authors and do not necessarily represent those of their affiliated organizations, or those of the publisher, the editors and the reviewers. Any product that may be evaluated in this article, or claim that may be made by its manufacturer, is not guaranteed or endorsed by the publisher.
Supplementary material
The Supplementary Material for this article can be found online at: https://www.frontiersin.org/articles/10.3389/fcomp.2022.1070493/full#supplementary-material
Supplementary Figure S1. Summary plots. XGBoost (Left) and Logistic regression (Right). Here “NConsultations” refers to the number of consultations; “NoUniqueMedsRx” refers to the number of unique medications prescribed; size of the medical practice is given by “Large,” “Medium,” and “Small”; location by “Urban” and “Rural”; and race includes “NZ Europeans,” “Māori,” “Pasifika,” and “Others.”
Supplementary Figure S2. BOW with LR using NZ-GP Harms data. Selected features that influence the final outcomes are presented where the most prominent features, and the influential features from a collection of Bias tokens is included. (Left): Wrongly predicted as “no Harm” when the true label is harm with an outcome of a NZ European patient death. (Right): correctly labeled as “Harm” for a Māori patient. The bottom of the plot starts as the expected value of the model output, and then each row shows how the positive (red) or negative (blue) contribution of each feature moves the value from the expected model output to the prediction.
Supplementary Table S1. Tasks 1,2 and 3 classification. 10-fold cross-validation is performed using various classifiers.
Supplementary Table S2. NZ-GP Harms Data. Using chi-squared Test, gender-related and ethnicity-related bias tokens from Figure 4 are tested between the two classes ‘No Harm' and ‘Harm'. For Gender-related tokens, the chi-square statistic: 9.97, p-value: 0.076 and the degree of freedom: 5. The expected contingency table is also presented. For ethnicity-related tokens, chi-square statistic: 2.38, p-value: 0.51, and the degree of freedom: 3.
Footnotes
1. ^https://waitangitribunal.govt.nz/treaty-of-waitangi/
2. ^https://www.health.govt.nz/about-ministry/what-we-do/work-programme-2019-20/achieving-equity
3. ^https://www.govinfo.gov/content/pkg/CFR-2017-title29-vol4/xml/CFR-2017-title29-vol4-part1607.xml
4. ^https://code.google.com/archive/p/word2vec/
5. ^https://fasttext.cc/docs/en/english-vectors.html
References
Asrani, V. M., McArthur, C., Bissett, I., and Windsor, J. A. (2021). The intensivist's assessment of gastrointestinal function: a pilot study. Aust. Crit. Care. 35, 636–643. doi: 10.1016/j.aucc.2021.10.008
Badilla, P., Bravo-Marquez, F., and Pérez, J. (2020). “WEFE: the word embeddings fairness evaluation framework,” in IJCAI (Yokohama), 430–436.
Barak-Corren, Y., Chaudhari, P., Perniciaro, J., Waltzman, M., Fine, A. M., and Reis, B. Y. (2021). Prediction across healthcare settings: a case study in predicting emergency department disposition. NPJ Digit. Med. 4, 1–7. doi: 10.1038/s41746-021-00537-x
Besse, P., del Barrio, E., Gordaliza, P., Loubes, J.-M., and Risser, L. (2022). A survey of bias in machine learning through the prism of statistical parity. Am. Stat. 76, 188–198. doi: 10.1080/00031305.2021.1952897
Bisong, E. (2019). “Logistic regression,” in Building Machine Learning and Deep Learning Models on Google Cloud Platform (Ottawa, ON: Springer), 243–250.
Caliskan, A., Bryson, J. J., and Narayanan, A. (2017). Semantics derived automatically from language corpora contain human-like biases. Science 356, 183–186. doi: 10.1126/science.aal4230
Carvalho, D. V., Pereira, E. M., and Cardoso, J. S. (2019). Machine learning interpretability: a survey on methods and metrics. Electronics 8, 832. doi: 10.3390/electronics8080832
Celi, L. A., Cellini, J., Charpignon, M.-L., Dee, E. C., Dernoncourt, F., Eber, R., et al. (2022). Sources of bias in artificial intelligence that perpetuate healthcare disparities–a global review. PLoS Digit. Health 1, e0000022. doi: 10.1371/journal.pdig.0000022
Curtis, E., Jones, R., Tipene-Leach, D., Walker, C., Loring, B., Paine, S.-J., et al. (2019). Why cultural safety rather than cultural competency is required to achieve health equity: a literature review and recommended definition. Int. J. Equity Health 18, 1–17. doi: 10.1186/s12939-019-1082-3
Esmail, L., Moore, E., and Rein, A. (2015). Evaluating patient and stakeholder engagement in research: moving from theory to practice. J. Comp. Eff. Res. 4, 133–145. doi: 10.2217/cer.14.79
Farhangfar, A., Kurgan, L. A., and Pedrycz, W. (2007). A novel framework for imputation of missing values in databases. IEEE Trans. Syst. Man Cybern. A Syst. Hum. 37, 692–709. doi: 10.1109/TSMCA.2007.902631
Feldman, M., Friedler, S. A., Moeller, J., Scheidegger, C., and Venkatasubramanian, S. (2015). “Certifying and removing disparate impact,” in Proceedings of the 21th ACM SIGKDD International Conference on Knowledge Discovery and Data Mining (Sydney, NSW), 259–268.
Feuerriegel, S., Dolata, M., and Schwabe, G. (2020). Fair AI. Bus. Inf. Syst. Eng. 62, 379–384. doi: 10.1007/s12599-020-00650-3
Fletcher, R. R., Nakeshimana, A., and Olubeko, O. (2021). Addressing fairness, bias, and appropriate use of artificial intelligence and machine learning in global health. Front. Artif. Intell. 3, 561802. doi: 10.3389/frai.2020.561802
Forde, J. Z., Cooper, A. F., Kwegyir-Aggrey, K., De Sa, C., and Littman, M. (2021). “Model selection's disparate impact in real-world deep learning applications,” in Science and Engineering of Deep Learning Workshop, ICLR 2021.
Garg, N., Schiebinger, L., Jurafsky, D., and Zou, J. (2018). Word embeddings quantify 100 years of gender and ethnic stereotypes. Proc. Natl. Acad. Sci. U.S.A. 115, E3635–E3644. doi: 10.1073/pnas.1720347115
Goebel, R., Chander, A., Holzinger, K., Lecue, F., Akata, Z., Stumpf, S., et al. (2018). “Explainable AI: the new 42?” in International Cross-domain Conference for Machine Learning and Knowledge Extraction (Hamburg: Springer), 295–303.
Goldberg, Y. (2017). Neural network methods for natural language processing. Synthesis Lect. Hum. Lang. Technol. 10, 1–309. doi: 10.1007/978-3-031-02165-7
Goodfellow, I., Bengio, Y., Courville, A., and Bengio, Y. (2016). Deep Learning. Cambridge: MIT Press.
Gudivada, V., Apon, A., and Ding, J. (2017). Data quality considerations for big data and machine learning: going beyond data cleaning and transformations. Int. J. Adv. Software 10, 1–20.
Guidotti, R., Monreale, A., Ruggieri, S., Turini, F., Giannotti, F., and Pedreschi, D. (2018). A survey of methods for explaining black box models. ACM Comput. Surveys 51, 1–42. doi: 10.1145/3236009
Hamon, R., Junklewitz, H., and Sanchez, I. (2020). Robustness and Explainability of Artificial Intelligence. Luxembourg: Publications Office of the European Union.
Hardt, M., Price, E., and Srebro, N. (2016). “Equality of opportunity in supervised learning,” in Advances in Neural Information Processing Systems, Vol. 29 (Barcelona).
Hotzy, F., Theodoridou, A., Hoff, P., Schneeberger, A. R., Seifritz, E., Olbrich, S., et al. (2018). Machine learning: an approach in identifying risk factors for coercion compared to binary logistic regression. Front. Psychiatry 9, 258. doi: 10.3389/fpsyt.2018.00258
Howard, F. M., Dolezal, J., Kochanny, S., Schulte, J., Chen, H., Heij, L., et al. (2021). The impact of site-specific digital histology signatures on deep learning model accuracy and bias. Nat. Commun. 12, 1–13. doi: 10.1038/s41467-021-24698-1
Hudson, M. L., and Russell, K. (2009). The Treaty of Waitangi and research ethics in Aotearoa. J. Bioeth. Inq. 6, 61–68. doi: 10.1007/s11673-008-9127-0
Ipsen, N., Mattei, P.-A., and Frellsen, J. (2022). “How to deal with missing data in supervised deep learning?” in ICLR 2022-10th International Conference on Learning Representations.
Jaipuria, N., Zhang, X., Bhasin, R., Arafa, M., Chakravarty, P., Shrivastava, S., et al. (2020). “Deflating dataset bias using synthetic data augmentation,” in Proceedings of the IEEE/CVF Conference on Computer Vision and Pattern Recognition Workshops (Seattle, WA: IEEE), 772–773.
James, J., Yogarajan, V., Shields, I., Watson, C., Keegan, P., Mahelona, K., et al. (2022). “Language models for code-switch detection of te reo Māori and English in a low-resource setting,” in Findings of the Association for Computational Linguistics: NAACL 2022 (Seattle, WA: Association for Computational Linguistics), 650–660.
Joulin, A., Grave, É., Bojanowski, P., and Mikolov, T. (2017). “Bag of tricks for efficient text classification,” in Proceedings of the 15th Conference of the European Chapter of the Association for Computational Linguistics: Volume 2, Short Papers (Valencia), 427–431.
Kalkman, S., van Delden, J., Banerjee, A., Tyl, B., Mostert, M., and van Thiel, G. (2022). Patients' and public views and attitudes towards the sharing of health data for research: a narrative review of the empirical evidence. J. Med. Ethics 48, 3–13. doi: 10.1136/medethics-2019-105651
Koene, A., Dowthwaite, L., and Seth, S. (2018). “IEEE P7003™ standard for algorithmic bias considerations: work in progress paper,” in Proceedings of the International Workshop on Software Fairness (Gothenburg), 38–41.
Korteling, J. H., van de Boer-Visschedijk, G., Blankendaal, R. A., Boonekamp, R., and Eikelboom, A. (2021). Human-versus artificial intelligence. Front. Artif. Intell. 4, 622364. doi: 10.3389/frai.2021.622364
Leitch, S., Dovey, S., Cunningham, W., Wallis, K., Eggleton, K., Lillis, S., et al. (2021). Epidemiology of healthcare harm in New Zealand general practice: a retrospective records review study. BMJ Open 11, e048316. doi: 10.1136/bmjopen-2020-048316
Leslie, D., Mazumder, A., Peppin, A., Wolters, M. K., and Hagerty, A. (2021). Does “AI” stand for augmenting inequality in the era of COVID-19 healthcare? BMJ 372, 3837493. doi: 10.2139/ssrn.3837493
Liu, X.-Y., Wu, J., and Zhou, Z.-H. (2009). Exploratory undersampling for class-imbalance learning. IEEE Trans. Syst. Man Cybern. B 39, 539–550. doi: 10.1109/TSMCB.2008.2007853
Lundberg, S. M., and Lee, S.-I. (2017). “A unified approach to interpreting model predictions,” in Advances in Neural Information Processing Systems 30, eds I. Guyon, U. V. Luxburg, S. Bengio, H. Wallach, R. Fergus, S. Vishwanathan, and R. Garnett (Curran Associates, Inc.), 4765–4774.
Luo, L., Li, J., Liu, C., and Shen, W. (2019). Using machine-learning methods to support health-care professionals in making admission decisions. Int. J. Health Plann Manag. 34, e1236–e1246. doi: 10.1002/hpm.2769
Madhu, G., Bharadwaj, B. L., Nagachandrika, G., and Vardhan, K. S. (2019). “A novel algorithm for missing data imputation on machine learning,” in 2019 International Conference on Smart Systems and Inventive Technology (ICSSIT) (Tirunelveli: IEEE), 173–177.
Madhu, G., and Rajinikanth, T. (2012). “A novel index measure imputation algorithm for missing data values: a machine learning approach,” in 2012 IEEE International Conference on Computational Intelligence and Computing Research (Coimbatore: IEEE), 1–7.
Maurer, M., Mangrum, R., Hilliard-Boone, T., Amolegbe, A., Carman, K. L., Forsythe, L., et al. (2022). Understanding the influence and impact of stakeholder engagement in patient-centered outcomes research: a qualitative study. J. Gen. Intern. Med. 37, 6–13. doi: 10.1007/s11606-021-07104-w
McCall, C. (2022). New Zealand launches new Māori health authority. Lancet 400, 16. doi: 10.1016/S0140-6736(22)01238-7
Mehrabi, N., Morstatter, F., Saxena, N., Lerman, K., and Galstyan, A. (2021). A survey on bias and fairness in machine learning. ACM Comput. Surveys 54, 1–35. doi: 10.1145/3457607
Nathans, L. L., Oswald, F. L., and Nimon, K. (2012). Interpreting multiple linear regression: a guidebook of variable importance. Pract. Assess. Res. Evaluat. 17, n9. doi: 10.7275/5fex-b874
Norori, N., Hu, Q., Aellen, F. M., Faraci, F. D., and Tzovara, A. (2021). Addressing bias in big data and AI for health care: a call for open science. Patterns 2, 100347. doi: 10.1016/j.patter.2021.100347
Obermeyer, Z., Powers, B., Vogeli, C., and Mullainathan, S. (2019). Dissecting racial bias in an algorithm used to manage the health of populations. Science 366, 447–453. doi: 10.1126/science.aax2342
Paleyes, A., Urma, R.-G., and Lawrence, N. D. (2022). Challenges in deploying machine learning: a survey of case studies. ACM Comput. Surv. 55, 29. doi: 10.1145/3533378
Panch, T., Mattie, H., and Atun, R. (2019). Artificial intelligence and algorithmic bias: implications for health systems. J. Glob Health 9, 010318. doi: 10.7189/jogh.09.020318
Parikh, R. B., Teeple, S., and Navathe, A. S. (2019). Addressing bias in artificial intelligence in health care. JAMA 322, 2377–2378. doi: 10.1001/jama.2019.18058
Peng, J., Jury, E. C., Dönnes, P., and Ciurtin, C. (2021). Machine learning techniques for personalised medicine approaches in immune-mediated chronic inflammatory diseases: applications and challenges. Front. Pharmacol. 12, 720694. doi: 10.3389/fphar.2021.720694
Rajkomar, A., Hardt, M., Howell, M. D., Corrado, G., and Chin, M. H. (2018). Ensuring fairness in machine learning to advance health equity. Ann. Intern. Med. 169, 866–872. doi: 10.7326/M18-1990
Ribeiro, M. T., Singh, S., and Guestrin, C. (2016). ““Why should I trust you?” Explaining the predictions of any classifier,” in Proceedings of the 22nd ACM SIGKDD International Conference on Knowledge Discovery and Data Mining (San Francisco), 1135–1144.
Rudin, C. (2018). Please stop explaining black box models for high stakes decisions. Stat 1050, 26. doi: 10.1038/s42256-019-0048-x
Sharma, S., Zhang, Y., Ríos Aliaga, J. M., Bouneffouf, D., Muthusamy, V., and Varshney, K. R. (2020). “Data augmentation for discrimination prevention and bias disambiguation,” in Proceedings of the AAAI/ACM Conference on AI, Ethics, and Society (New York, NY), 358–364.
Shin, D. (2021). The effects of explainability and causability on perception, trust, and acceptance: Implications for explainable AI. Int. J. Hum. Comput. Stud. 146, 102551. doi: 10.1016/j.ijhcs.2020.102551
Smith, A. L., Chaudhuri, A., Gardner, A., Gu, L., Salem, M. B., and Lévesque, M. (2018). “Regulatory frameworks relating to data privacy and algorithmic decision making in the context of emerging standards on algorithmic bias,” in NIPS Conference Workshop on Ethical, Social and Governance Issues in AI (Montreal, QC).
Snider, B., McBean, E. A., Yawney, J., Gadsden, S. A., and Patel, B. (2021). Identification of variable importance for predictions of mortality from COVID-19 using AI models for Ontario, Canada. Front. Public Health 9, 675766. doi: 10.3389/fpubh.2021.759014
Tong, Z., Liu, Y., Ma, H., Zhang, J., Lin, B., Bao, X., et al. (2020). Development, validation and comparison of artificial neural network models and logistic regression models predicting survival of unresectable pancreatic cancer. Front. Bioeng. Biotechnol. 8, 196. doi: 10.3389/fbioe.2020.00196
Trye, D., Yogarajan, V., Konig, J., Keegan, T., Bainbridge, D., and Apperley, M. (2022). “A hybrid architecture for labelling bilingual māori-english tweets,” in Findings of the Association for Computational Linguistics: AACL-IJCNLP 2022 (Association for Computational Linguistics).
Wang, C., Deng, C., and Wang, S. (2020). Imbalance-XGBoost: leveraging weighted and focal losses for binary label-imbalanced classification with XGBoost. Pattern Recognit. Lett. 136, 190–197. doi: 10.1016/j.patrec.2020.05.035
Webster, C. S., Taylor, S., Thomas, C., and Weller, J. M. (2022). Social bias, discrimination and inequity in healthcare: mechanisms, implications and recommendations. BJA Educ. 22, 131–137. doi: 10.1016/j.bjae.2021.11.011
Widmer, G., and Kubat, M. (1996). Learning in the presence of concept drift and hidden contexts. Mach. Learn. 23, 69–101. doi: 10.1007/BF00116900
Wilson, D., Tweedie, F., Rumball-Smith, J., Ross, K., Kazemi, A., Galvin, V., et al. (2022). Lessons learned from developing a COVID-19 algorithm governance framework in Aotearoa New Zealand. J. R. Soc. N. Z. 1–13. doi: 10.1080/03036758.2022.2121290
Wu, Y., Zhang, Q., Hu, Y., Sun-Woo, K., Zhang, X., Zhu, H., et al. (2022). Novel binary logistic regression model based on feature transformation of XGBoost for type 2 Diabetes Mellitus prediction in healthcare systems. Fut. Generat. Comput. Syst. 129, 1–12. doi: 10.1016/j.future.2021.11.003
Yao, R.-q., Jin, X., Wang, G.-w., Yu, Y., Wu, G.-s., Zhu, Y.-b., et al. (2020). A machine learning-based prediction of hospital mortality in patients with postoperative sepsis. Front. Med. 7, 445. doi: 10.3389/fmed.2020.00445
Yogarajan, V. (2022). Domain-specific language models for multi-label classification of medical text (Ph.D. thesis). The University of Waikato.
Zafar, M. B., Valera, I., Rogriguez, M. G., and Gummadi, K. P. (2017). “Fairness constraints: mechanisms for fair classification,” in Artificial Intelligence and Statistics (Ft. Lauderdale, FL: PMLR), 962–970.
Keywords: Artificial Intelligence, bias, healthcare, New Zealand, Māori, equity
Citation: Yogarajan V, Dobbie G, Leitch S, Keegan TT, Bensemann J, Witbrock M, Asrani V and Reith D (2022) Data and model bias in artificial intelligence for healthcare applications in New Zealand. Front. Comput. Sci. 4:1070493. doi: 10.3389/fcomp.2022.1070493
Received: 14 October 2022; Accepted: 30 November 2022;
Published: 22 December 2022.
Edited by:
Dakuo Wang, IBM Research, United StatesReviewed by:
Yaoli Mao, Autodesk, United StatesGiles Oatley, Federation University Australia, Australia
Copyright © 2022 Yogarajan, Dobbie, Leitch, Keegan, Bensemann, Witbrock, Asrani and Reith. This is an open-access article distributed under the terms of the Creative Commons Attribution License (CC BY). The use, distribution or reproduction in other forums is permitted, provided the original author(s) and the copyright owner(s) are credited and that the original publication in this journal is cited, in accordance with accepted academic practice. No use, distribution or reproduction is permitted which does not comply with these terms.
*Correspondence: Vithya Yogarajan,  dml0aHlhLnlvZ2FyYWphbkBhdWNrbGFuZC5hYy5ueg==