 Alexandra Ritchie
 Suvi Laitinen
 Pekka Katajisto
 Johanna I. Englund
- 1Institute of Biotechnology, HiLIFE, University of Helsinki, Helsinki, Finland
- 2Department of Cell and Molecular Biology (CMB), Karolinska Institutet, Stockholm, Sweden
- 3Faculty of Biological and Environmental Sciences, University of Helsinki, Helsinki, Finland
Techniques to acquire and analyze biological images are central to life science. However, the workflow downstream of imaging can be complex and involve several tools, leading to creation of very specialized scripts and pipelines that are difficult to reproduce by other users. Although many commercial and open-source software are available, non-expert users are often challenged by a knowledge gap in setting up analysis pipelines and selecting correct tools for extracting data from images. Moreover, a significant share of everyday image analysis requires simple tools, such as precise segmentation, cell counting, and recording of fluorescent intensities. Hence, there is a need for user-friendly platforms for everyday image analysis that do not require extensive prior knowledge on bioimage analysis or coding. We set out to create a bioimage analysis software that has a straightforward interface and covers common analysis tasks such as object segmentation and analysis, in a practical, reproducible, and modular fashion. We envision our software being useful for analysis of cultured cells, histological sections, and high-content data.
Introduction and Related Work
Analysis of biological processes in quantitative manner through image acquisition has become a widespread technique used across life sciences (Danuser, 2011). Several computational methods have been created to analyze various aspects of biological imaging data, as demonstrated by the numbers of different software available (Levet et al., 2021). Recently, biological questions and bioimaging have become increasingly multifaceted, and can thus lead to generation of vast quantities of data and to development of complex and often custom-made scripts and pipelines (Meijering et al., 2016). There are various efforts and new processing tools created to tackle this issue, including use of artificial intelligence (AI) and deep learning (DL) assisted methods (Litjens et al., 2017; Gomez-de-Mariscal et al., 2021; Hallou et al., 2021; Szkalisity et al., 2021; von Chamier et al., 2021). However, many of these tools require advanced computational expertise or knowledge in bioimage analysis limiting their use. Nevertheless, bioimage analysis tasks routinely performed in life science laboratories require basic tools, including accurate object segmentation, intensity measurements and object classification. Users without in-depth expertise on bioimage analysis or computer sciences are also often challenged by knowledge gap in creating complex analysis pipelines or reproducing custom-made pipelines generated by other users (Carpenter et al., 2012).
Different open-source software including ImageJ, CellProfiler, Icy, QuPath, and Ilastik (Carpenter et al., 2006; de Chaumont et al., 2012; Schindelin et al., 2012; Schneider et al., 2012; Bankhead et al., 2017; Berg et al., 2019) already aim for straightforward analysis of specific bioimage data. ImageJ and CellProfiler are perhaps the most established and widely used image analysis software (Levet et al., 2021). ImageJ, and especially the Fiji distribution of ImageJ, contain various plug-ins and scripts for image visualization, processing, and analysis. Advanced users can readily customize their analysis tools via scripting, and the analyses can be further automated by users recording their own macros (Schneider et al., 2012), which enable replicating the analysis features later. Fiji includes several plug-ins, which are additions to the software and often created for specialized analysis, such as for tracking of objects or image processing (Schindelin et al., 2015). While the available number of tools for ImageJ is large, the choice of appropriate tool and parameters, and how they are combined in pre- and post-processing, can be challenging. CellProfiler, in turn is more modular in its functions, and thus users can easily create specific analysis pipelines (Carpenter et al., 2006). However, we found that whereas efficient and reproducible use of these and other software is uncomplicated for the expert users, there is still a need for user-friendly software with easy access to bioimage analysis for novice users. Thus, we sought to develop a software with an intuitive graphical user-interface, which is easy to operate, and performs the most common bioimage analysis tasks accurately in a reproducible and modular fashion. Special attention was paid to streamlining the combination of segmentation, cell counting, and fluorescent intensities measurement, while providing support for both small and large data sets. We wanted to provide users with automated protocols including all analysis stages from pre-processing to the numerical results, that could seamlessly combine further analysis in a preferred spread sheet program, and designed the software to contain a wizard feature, which aims to suggest a suitable protocol for the analysis to help users select the right tools.
Methods
Overview
The software is based on Java and presents a graphical user interface. The main software window is divided into the left panel listing all the imported images and their layers, a zoomable main image panel, a separate zoom image panel for viewing image details, and a right tabbed panel, containing method parameters and execution, result panel, and a histogram panel (Figure 1). Additional information on the usage of the available filters, protocols, and user interface components and are displayed on the status bar during mouse hover.
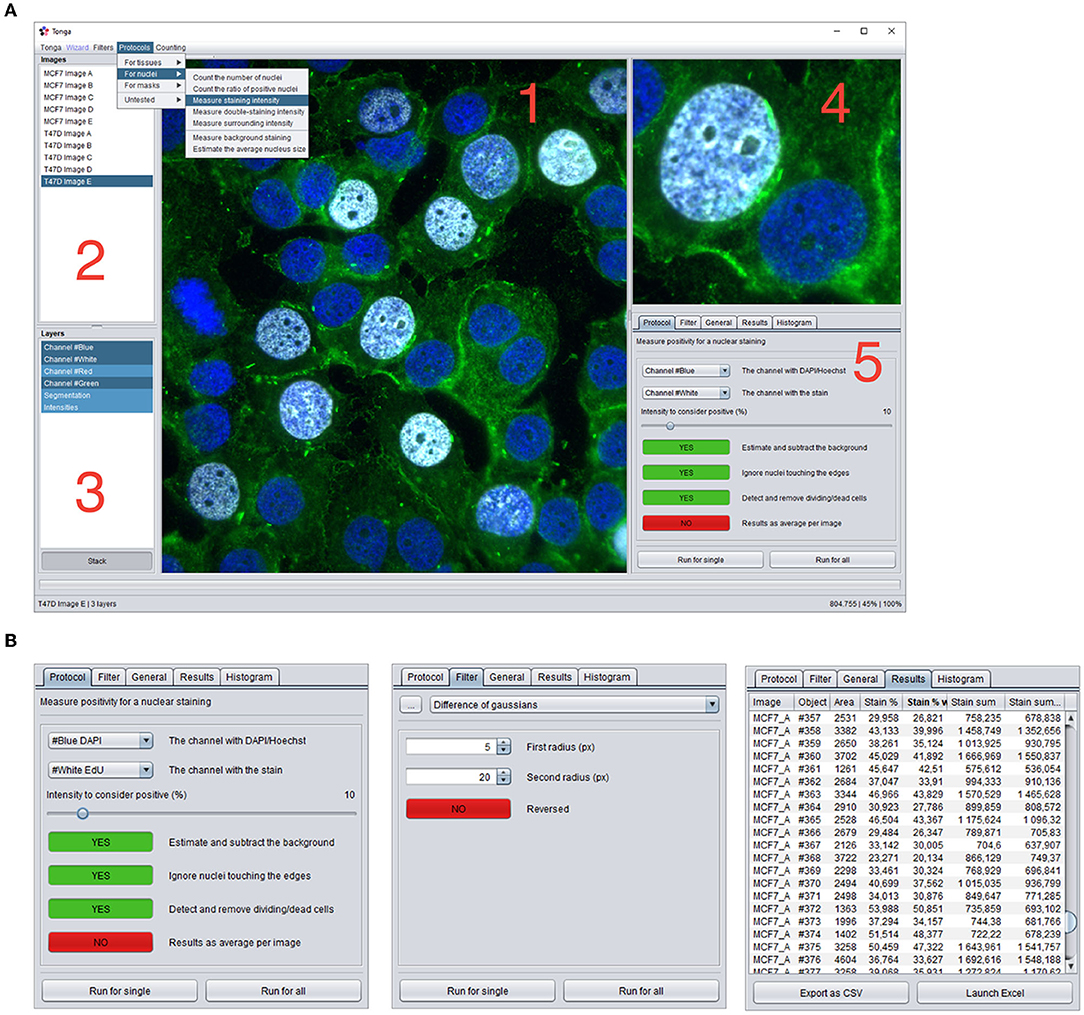
Figure 1. Overview of the Tonga user-interface. (A) Main user-interface of Tonga. 1: Main image panel, 2: List of imported images, 3: List of layers (channels and processed versions of images) 4: Zoom panel, 5: Tab panel. Dropdown menus for lauching filters, protocols and counting functions. (B) Examples of the content of the Protocols, Filters, and Results Tab panels.
The main functionality is achieved through three main components: filters, protocols, and counters. Filters are implementations of general-purpose image processing tools, such as thresholding, gamma and illumination correction, blurring, edge detection, and morphological operations. Filters accept and produce one input and output image. Filters can be used by the user manually, and they are widely utilized internally by the protocols. Protocols are combinations of various subsequently executed filters, additional supplementary code, and a final counter. They provide a full method for processing a series of images for a specific task, such as tissue or nucleus detection and extract numerical data. They accept and can produce one or more input and output images. Counters are special functions for outputting only numerical data from the images into a results table, which can be further saved as TSV or opened in Excel. Full list of available filters and protocols with usage descriptions are available in the user guide (See availability).
Functionality
Various protocols are available via the wizard feature, which aims to suggest a suitable method by asking the user questions about the images and the task the user wants to execute. The protocols and their main settings have been organized into a decision tree, utilized by the wizard (Figures 2A,B). Relevant questions from the tree with example images and explanations are presented to the user in a simple “yes or no”-format, and a suitable protocol and settings are selected based on the combination of these choices (Figures 2B,C). This eliminates the need to combine filters or search for the suitable methods manually.
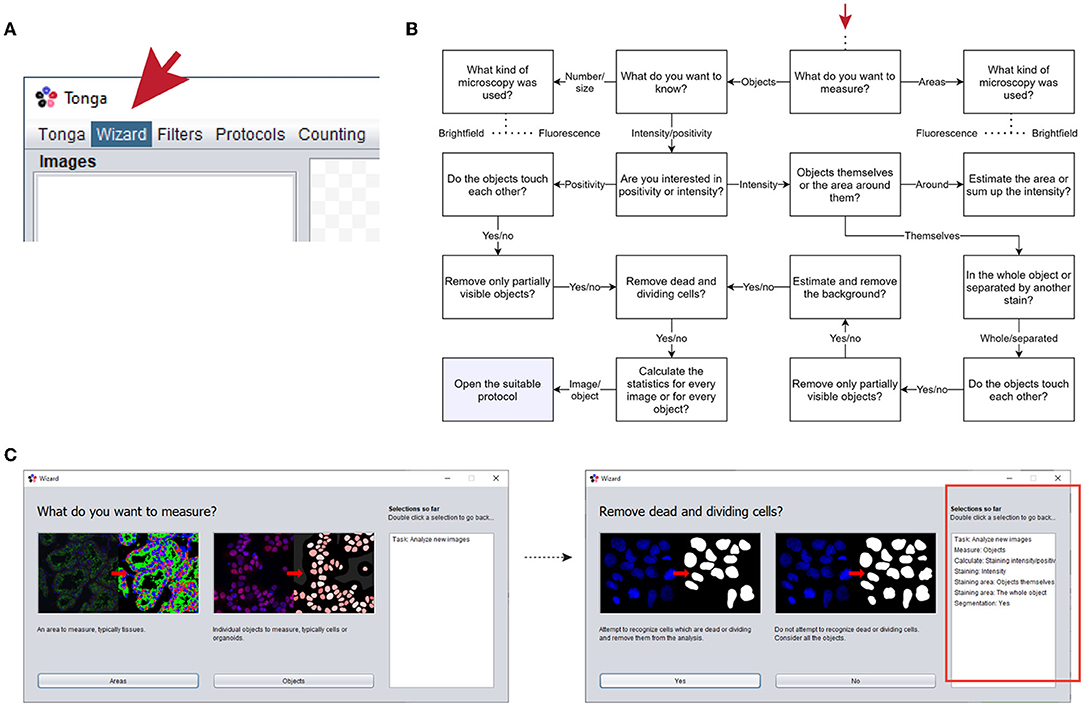
Figure 2. Overview of the wizard feature. (A) Wizard can be found and launched from the menu bar. (B) Example of one branch of the wizard decision tree, starting point indicated by red arrow. (C) Examples of the wizard window helping to select suitable protocol to use. Selections for the analysis made by the user are listed in the box on the right (highlighted with red box in the right image).
Parameters, such as nucleus size, background, radiuses and thresholds required for the protocols are estimated automatically on the go, and the protocol setup requires mainly user interaction related to the input images, and subjective values and preferences such as the desired sensitivity, or removal of dividing cells. Protocols are suitable for both small and large-scale analyses and feature memory mapping and multithreading for efficiently handling a large number of images. There is also a separate batch processing mode for processing several images without importing them before processing.
Most of the common scientific image file formats are supported by Tonga, as the software uses the Bio-Formats importer by Open Microscopy Environment (OME) (Linkert et al., 2010). No knowledge of image formats is required from the user, and the software internally handles imported files as either 32-bit ARGB-images (8 bits per channel), or as 16-bit colored grayscale images, converting them as necessary without user interaction. As the software is currently aimed for 2D images, three-dimensional Z-stack images are automatically converted into average intensity Z-projections. Imported images are displayed to the user as a list (Figure 1A; no 2–3), and each image further consist of separate layers, including all fluorescence channels, as well as processed versions of the image produced by the user via filters or protocols. Images can be viewed separately, or as a combined stack image. Any output from the filters or protocols is appended to the list of layers for the image, allowing user to compare the output to the original picture and return to the previous steps.
Protocols
Presently Tonga offers basic protocols for nuclei detection, overlapping and touching nuclei separation, and intensity measurements from fluorescence images, and analysis of tasks such as cell positivity, dye intensity, double-staining intensity, and intensity around the nucleus. Description of the protocol steps and basic principles is presented below. Technical details are available together with the source code, and the usage of the protocols is described in the user guide (See availability).
Nucleus Detection
Tonga proceeds in nucleus detection in three major steps by combining area detection and concave point detection (Zafari et al., 2017) with a concave point pairing algorithm and secondary mask creation. First, a binarized mask is created from the original image using a series of difference of Gaussians (DoG) edge detection with various radiuses, attempting to identify only the area where the target objects are, and remove majority of the background. Second, the edges of these detected areas are traced and any concave points forming sharp corners are detected. The detected concave points are then connected to each other with lines, utilizing information of the angle and direction of the concave point, as well as the location, proximity, parallelity, and sharpness of the other concave points in attempt to determine where the cells most likely overlap. The masks are cut along these connected lines to separate overlapping objects into individual nuclei. Ultimately, the obtained masks are compared back to the original image, in attempt to detect any inconsistencies on the edges, improve mask accuracy, smoothen the mask, and remove unwanted structures, such as additional nuclear structures such as micronuclei and holes caused by nucleoli (Kwon et al., 2020). Dividing and dead cells are removed, per user choice, by detecting nuclei with deviant texture and morphology compared to the other nuclei.
Measurements
The final adjusted mask is used as the nucleus area and compared to the original image for intensity measurements, reported as the average intensity and as the total sum. Background is estimated using an average measurement from one or more areas in the image, which do not produce any signal during the object detection, due to minimal intensity differences. Cell positivity is based on a user-set protocol parameter on the level of intensity required to consider a cell positive.
Modularity
As internally protocols function with an input-output principle by calling existing filters, counters, or other protocols, together with supplementary code, creation of new protocols for various purposes requires only minor code modifications. Implementing new filters also requires minimally only the code which returns an output image array, as the filters share the common internal basic structure, and are executed independently from each other. Indeed, one of the future areas of development in the software is to enable users to extend the software functionality by creating new protocols and loading new filter or counter classes dynamically.
Cell Culture and Immunofluorescence Staining
To generate authentic cell culture data to test our segmentation and intensity measurement data, MCF7, T47D and SKBR-3 breast cancer cell lines (Holliday and Speirs, 2011) (all from ATCC) were cultured on glass coverslips for 24–48 h. Samples were fixed with 4% PFA for 10 min at room temperature. After fixation, cells were washed with PBS and permeabilized with 0.5% Triton-X (Sigma) in PBS for 10 min. Next, samples were washed twice with PBS and non-specific binding sites were blocked with 10% FCS in PBS for 60 min and incubated 120 min at RT with primary antibody (ERα, Santa Cruz 1:100) diluted in blocking solution. Following incubation, samples were washed three times with PBS and then incubated for 60 min at RT with appropriate Alexa Fluor 594 secondary antibody (Life Technologies). Finally, samples were washed for 3 times with PBS followed by counterstaining of nuclei with Hoechst33342 (Sigma). For detection of proliferating cells, cells were treated with 10 μM 5-ethynyl-2′-deoxyuridine (EdU) for 2 h and thereafter fixed with 4 % PFA. Immunostaining to detect EdU positive cells was performed using Click-IT EdU Alexa Fluor 647 Imaging Kit (ThermoFisher) according to manufacturer's instructions. Before mounting, nuclei were counterstained with Hoechst.
Imaging and Quantitation
Imaging of the stained coverslips was performed using Leica DM5000b microscope with 20 × objective and 2,048 × 2,048, 0.27 μm/pixel resolution. To test our segmentation method, we prepared MCF7, T47D, and SKBR-3 breast cancer cells stained with Hoechst for counting of nuclei. Two independent human observers counted the nuclei in total of 12 independent images using the Cell Counter function in Fiji. For MCF7 and T47D cells, the nuclei were also classified as either interphase nuclei, or as condensed and small nuclei indicative of mitotic or apoptotic cells.
Comparison With Watershed and StarDist Segmentation in ImageJ
For comparison with watershed segmentation, the images were first pre-processed with illumination correction in Tonga, and then segmented in ImageJ 1.53c by binarizing them with global thresholding and then processing with the watershed operation. For comparison with StarDist segmentation (Schmidt et al., 2018), original RGB images were converted to 8-bit images in ImageJ 1.53c and then processed with the StarDist ImageJ/Fiji plugin (https://imagej.net/StarDist) using the built-in versatile (fluorescent nuclei) model and default settings for post-processing. Processed images were transferred back to Tonga, and any objects touching the images edges or being smaller than 500 pixels (MCF7), 300 pixels (T47D), or 100 pixels (SKBR-3) were removed. The number of segmented areas was counted using the object counter tool in Tonga. Finally, the number of dead and dividing cells estimated by Tonga was subtracted from the total number of objects, to get the number of interphase nuclei. Bland-Altman plots of the results was calculated and drawn in Prism 9.
Results
To demonstrate the usage and accuracy of the automated protocols available in Tonga, we applied segmentation, nuclear counting, stain positivity, and staining intensity protocols to various data sets, and compared the results visually or either to the ground truth numbers or other available methods outside Tonga.
The nuclear segmentation protocol in Tonga was demonstrated by analyzing a nuclear count of a set of MCF7, T47D, and SKBR-3 breast cancer cells (Holliday and Speirs, 2011) by Tonga and two independent human observers (Figure 3A). The nuclear counts obtained with Tonga differed 0.1–8% from the observer average, showing good consistency across the image set (Supplementary Figures 1A,B). We additionally demonstrated the segmentation protocol in Tonga using fluorescence images from a publicly available, ground truth annotated data set prepared for testing nuclear segmentation methods (Kromp et al., 2020). The data set includes 2D fluorescence images of cell lines and cultured primary cells with varying level of overlapping cells. We segmented 29 images with normal nuclei from the collection using Tonga and compared the number of nuclei against the ground truth annotations of the data sets (Figure 3B). For a fair comparison, we used the same criteria for nuclei to be included as in the original work (Kromp et al., 2020), and excluded any nuclei excluded in the ground truth annotations, as well as nuclei which appeared dead or dividing. We found that difference between the ground truth and Tonga was between 0 and 6% across the data set, demonstrating suitability of the nuclear segmentation and counting protocols on various data sets and cell types.
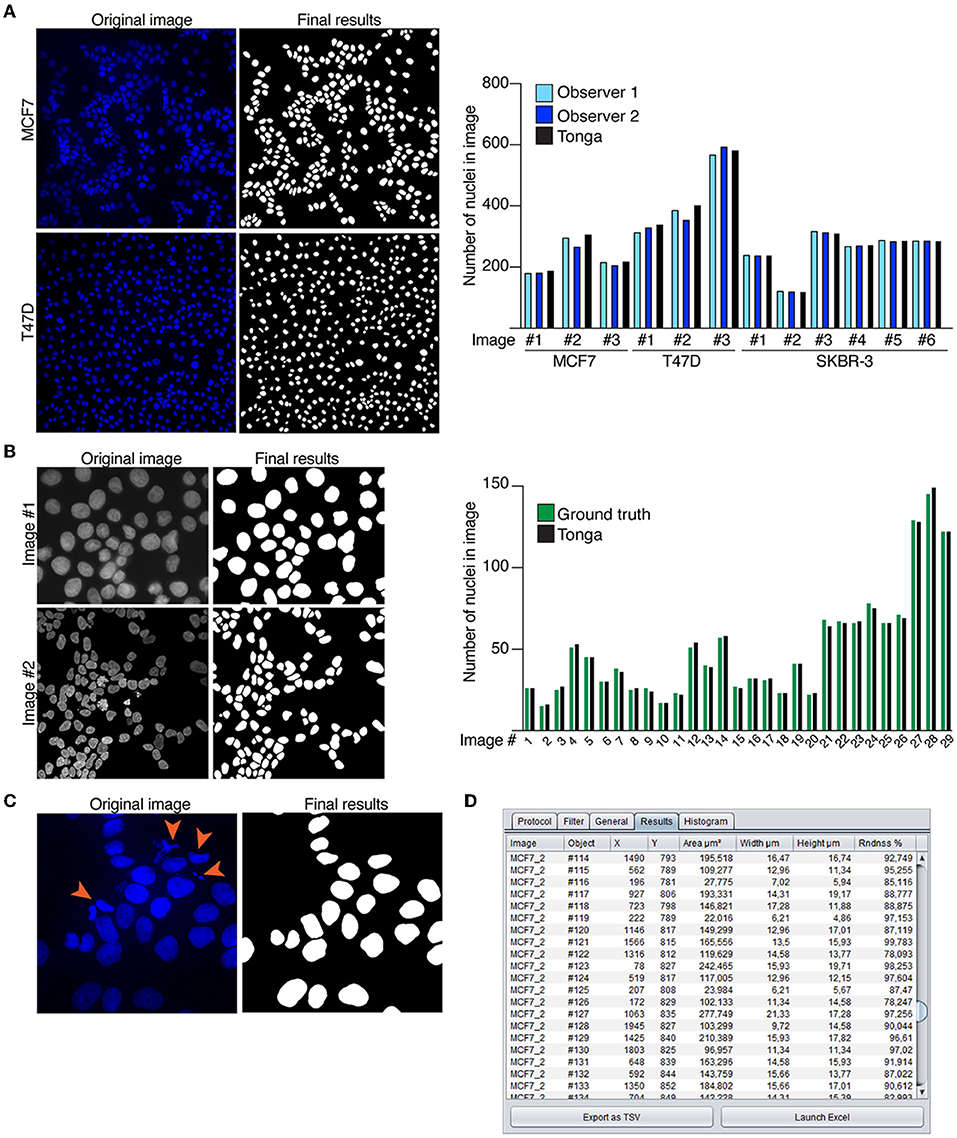
Figure 3. Nuclear segmentation protocols. (A) Example images of MCF7 and T47D breast cancer cells with nuclear stain (Hoechst) and corresponding segmentation masks by Tonga. Graph shows quantitation of round nuclei in 12 independent images. Counting was performed manually by two observers, and compared to count by Tonga. (B) Example images of Kromp et al. (2020) data set and the final segmentation results created in Tonga. Graph shows nuclear count of 29 images by Tonga compared to the ground truth. (C) Example image of MCF7 with nuclear stain (Hoechst). Dividing and apoptotic cells indicated by orange arrowheads in the original image are removed from the final results. (D) Numeric output from the nuclear segmentation protocol shown in the results tab.
To compare the Tonga segmentation protocol with other existing methods, we analyzed our own data set using widely used watershed-based segmentation with binary thresholding, as well as with state-of-the-art StarDist segmentation method (Schmidt et al., 2018; Supplementary Figures 1A,B). For unbiased comparison of only clustered cells, we removed cells with condensed nuclei and micronuclei from the images. We detected no systemic differences or bias in nuclear count with Tonga compared to watershed method or to StarDist when comparing the difference between the methods using a Bland-Altman plot (Supplementary Figure 1C). We additionally segmented the Kromp et al. (2020), data set with both Tonga and StarDist to further compare these methods. This data set was also segmented in a similar fashion by Tonga and StarDist, especially when examining clustered nuclei (Supplemental Figures 1D,E). Thus, we conclude that the Tonga segmentation protocol functions comparably to both earlier and state-of-the art methods.
Detection of apoptotic and dividing cells largely depends on size and morphology of the nuclei that can vary between different cell types, yet condensed nuclei are indicative of both processes. Condensed nuclei can be removed from or included in the segmentation and counting as per user choice. We demonstrated using the MCF7 cell line that condensed nuclei can be accurately recognized in Tonga using an automated protocol (Figure 3C). The final numeric output from the segmentation and counting protocols is displayed to the user in the Results table (Figure 3D).
Next, we demonstrated intensity measurements in nuclei in conjunction to nuclear segmentation of nuclei. Measuring of immunofluorescence staining intensity can be used for instance to quantitate number of positive or negative cells in a population, and thus we analyzed MCF7 cells treated with EdU as indication of proliferation (Figure 4A). Images were first segmented using the Hoechst nuclear stain channel, whereafter an intensity threshold on channel with background corrected EdU staining was set manually to determine, which nuclei were positive. Cells exhibiting staining intensity below the selected threshold were determined negative, and above the threshold positive (Figure 4A, marked in gray and white, respectively). When comparing the segmentation mask and original image, it is clear the precision of the original segmentation mask is critical for accurate determination of positive and negative cells (Figure 4A). Furthermore, the masks generated by the segmentation protocol appear in the list of layers in the software, which makes it straightforward for the users to examine the data and compare it to the original images.
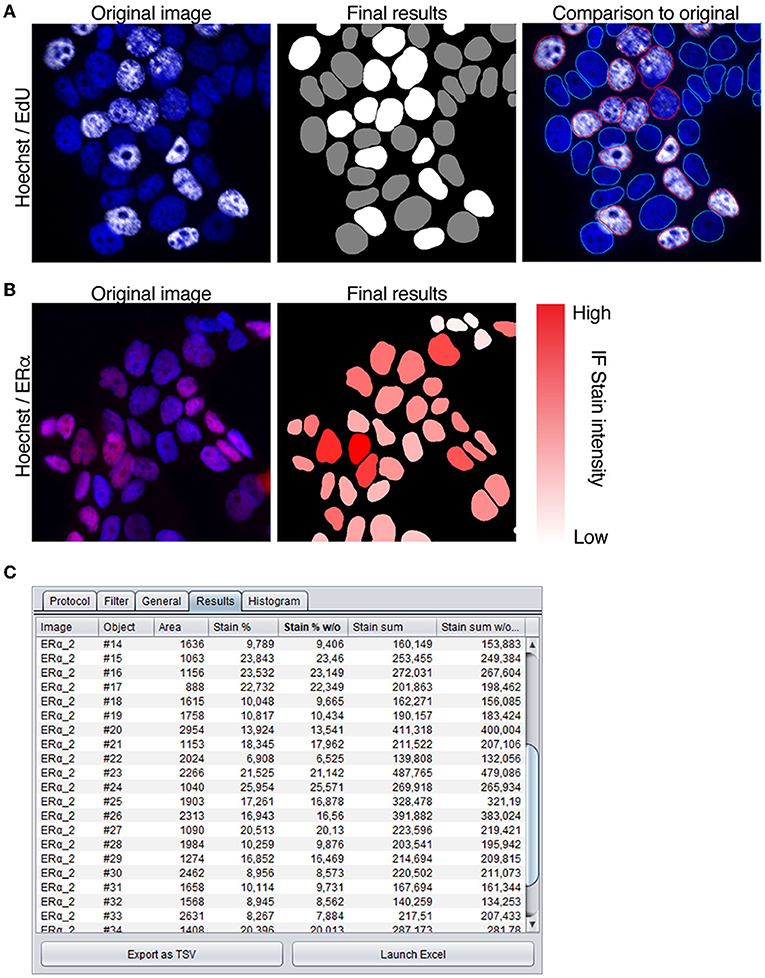
Figure 4. Intensity measurement protocols. (A) MCF7 cells stained with nuclear stain (Hoechst) and to detect EdU (white) incorporated cells. To quantitate EdU positive cells, nuclei are segmented using the Hoechst channel and a threshold is set to determine positive staining. In final results image nuclei that are negative for EdU staining are marked gray, and positive nuclei white. Comparison to original image shows overlay of segmentation mask marked with positive (red) and negative (blue) nuclei (B) MCF7 cells immunostained with ERα antibody (red), segmented using nuclear stain channel (Hoechst) and measured for intensity of the staining. Immunofluorescence intensity is indicated with the color slider (white–low intensity, red–high intensity). (C) Numeric output of the intensity measurement protocol shown in the results tab.
Combination of segmentation and measuring of immunofluorescence staining intensity can also be used to quantitate the full dynamic range of a nuclear stain (Figure 4B). To establish this with our method, MCF7 cells, known to exhibit positive staining (Comsa et al., 2015), were immunostained with antibody against estrogen receptor a (ERα). From the images, nuclei were segmented using the Hoechst channel, and intensity measured from the channel with ERα staining and taking into consideration both the stain intensity and the area of the nucleus. The final mask shows the segmented nuclei overlaid with color ranging from white to red, indicative of the immunostaining intensity (white—low, red—high; Figure 4B), and the final numeric results are displayed in the results-table (Figure 4C). Our results show that the color corresponds accurately with the brightness of the staining in the original image. These examples demonstrate the suitability of the automated protocols in Tonga for recording immunostaining intensity within nuclei either for quantitative or qualitative analysis.
Discussion
Being user-friendly, modular, and validated are among the key components for a bioimage analysis program to be widely usable for the bioscience community (Carpenter et al., 2012; Levet et al., 2021). Here we describe a validated open-source image analysis software Tonga, which we have developed with the purpose of being practical for everyday image analysis tasks. We paid special attention to the user interface being intuitive, thus making the software straightforward to use and accessible also for users without in-depth knowledge of image analysis. We additionally aimed to develop the software modular and automatic, that combining different analysis tasks would be uncomplicated and analyses would require minimal set up. Therefore, we added the Wizard feature, which helps users to choose the right protocol for their analyses.
We acknowledge there are several excellent open-source software available for variety of complex image analysis tasks (Levet et al., 2021). When developing our software, we especially concentrated on constructing a toolbox for everyday image analysis needs of users that often include segmentation and recording intensity measurements from immunofluorescence images. We show that the protocols we have developed for these analysis work equally well compared to for instance watershed -based algorithms and to deep-learning based methods such as StarDist (Schmidt et al., 2018), especially when nuclei are located close to each other or in aggregates. Moreover, we show our protocols can be effectively used to detect dead and dividing cells and used together with measurement of immunofluorescence staining intensity.
In the future we aim to expand the toolbox with other protocols, including detection and segmentation of tissues and measurement of fluorescence and histochemical stain intensity from histological slides, as well as object detection and segmentation from phase contrast images. The latter would provide analysis tools for example for organoid cultures, and for smaller particles such as organelles within the cell. Furthermore, we are planning to enable a feature in Tonga, where users can integrate their own filters and protocols as a part of the software, to better customize pipelines for their specific needs. As Tonga can analyze several images at a given time, we envision it will be advantageous for large scale image analyses, but also for quick analysis of smaller scale set-up experiments. We believe that the existing features, as well as the future modifications, enable users of different levels operate the system effectively leading to improved access to image analyses and data reproducibility.
Data Availability Statement
A compiled software packages for both Windows and MacOS, as well as the full Java source code of Tonga and all the protocols described in this manuscript are available in GitHub (https://github.com/avritchie/tonga). The user guide for the software is also available in GitHub (https://github.com/avritchie/tonga/wiki). Java version 9 or later is required to run Tonga. The examples shown in this manuscript were made with the development version of the software (0.1.2).
Author Contributions
AR, PK, and JE conceptualized and designed the study. AR did primary code development. AR, SL, and JE contributed to the experiments in the manuscript. All authors contributed to the text. All authors contributed to the article and approved the submitted version.
Funding
We acknowledge the following sources: Academy of Finland (266869, 304591, and 320185), the Swedish Research Council 2018-03078, Cancerfonden 190634, the Jane and Aatos Erkko Foundation and the Cancer Foundation Finland (PK), and the Finish Cultural Foundation (JE).
Conflict of Interest
The authors declare that the research was conducted in the absence of any commercial or financial relationships that could be construed as a potential conflict of interest.
Publisher's Note
All claims expressed in this article are solely those of the authors and do not necessarily represent those of their affiliated organizations, or those of the publisher, the editors and the reviewers. Any product that may be evaluated in this article, or claim that may be made by its manufacturer, is not guaranteed or endorsed by the publisher.
Acknowledgments
The authors would like to thank all the members of the Katajisto laboratory for discussions and feedback regarding the manuscript. Imaging was performed at the Light Microscopy Unit, Institute of Biotechnology, supported by HiLIFE and Biocenter Finland.
Supplementary Material
The Supplementary Material for this article can be found online at: https://www.frontiersin.org/articles/10.3389/fcomp.2022.777458/full#supplementary-material
References
Bankhead, P., Loughrey, M. B., Fernandez, J. A., Dombrowski, Y., McArt, D. G., Dunne, P. D., et al. (2017). QuPath: Open source software for digital pathology image analysis. Sci. Rep. 7, 16878. doi: 10.1038/s41598-017-17204-5
Berg, S., Kutra, D., Kroeger, T., Straehle, C. N., Kausler, B. X., Haubold, C., et al. (2019). ilastik: interactive machine learning for (bio)image analysis. Nat. Methods 16, 1226–1232. doi: 10.1038/s41592-019-0582-9
Carpenter, A. E., Jones, T. R., Lamprecht, M. R., Clarke, C., Kang, I. H., Friman, O., et al. (2006). CellProfiler: image analysis software for identifying and quantifying cell phenotypes. Genome Biol. 7, R100. doi: 10.1186/gb-2006-7-10-r100
Carpenter, A. E., Kamentsky, L., and Eliceiri, K. W. (2012). A call for bioimaging software usability. Nat. Methods 9, 666–670. doi: 10.1038/nmeth.2073
Comsa, S., Cimpean, A. M., and Raica, M. (2015). The story of MCF-7 breast cancer cell line: 40 years of experience in research. Anticancer Res. 35, 3147–3154.
Danuser, G. (2011). Computer vision in cell biology. Cell 147, 973–978. doi: 10.1016/j.cell.2011.11.001
de Chaumont, F., Dallongeville, S., Chenouard, N., Herve, N., Pop, S., Provoost, T., et al. (2012). Icy: an open bioimage informatics platform for extended reproducible research. Nat. Methods 9, 690–696. doi: 10.1038/nmeth.2075
Gomez-de-Mariscal, E., Garcia-Lopez-de-Haro, C., Ouyang, W., Donati, L., Lundberg, E., Unser, M., et al. (2021). DeepImageJ: a user-friendly environment to run deep learning models in ImageJ. Nat. Methods 18, 1192–1195. doi: 10.1038/s41592-021-01262-9
Hallou, A., Yevick, H. G., Dumitrascu, B., and Uhlmann, V. (2021). Deep learning for bioimage analysis in developmental biology. Development 148, dev199616. doi: 10.1242/dev.199616
Holliday, D. L., and Speirs, V. (2011). Choosing the right cell line for breast cancer research. Breast Cancer Res. 13, 215. doi: 10.1186/bcr2889
Kromp, F., Bozsaky, E., Rifatbegovic, F., Fischer, L., Ambros, M., Berneder, M., et al. (2020). An annotated fluorescence image dataset for training nuclear segmentation methods. Sci. Data 7, 262. doi: 10.1038/s41597-020-00608-w
Kwon, M., Leibowitz, M. L., and Lee, J. H. (2020). Small but mighty: the causes and consequences of micronucleus rupture. Exp. Mol. Med. 52, 1777–1786. doi: 10.1038/s12276-020-00529-z
Levet, F., Carpenter, A. E., Eliceiri, K. W., Kreshuk, A., Bankhead, P., and Haase, R. (2021). Developing open-source software for bioimage analysis: opportunities and challenges. F1000Res 10, 302. doi: 10.12688/f1000research.52531.1
Linkert, M., Rueden, C. T., Allan, C., Burel, J. M., Moore, W., Patterson, A., et al. (2010). Metadata matters: access to image data in the real world. J. Cell Biol. 189, 777–782. doi: 10.1083/jcb.201004104
Litjens, G., Kooi, T., Bejnordi, B. E., Setio, A. A. A., Ciompi, F., Ghafoorian, M., et al. (2017). A survey on deep learning in medical image analysis. Med. Image Anal. 42, 60–88. doi: 10.1016/j.media.2017.07.005
Meijering, E., Carpenter, A. E., Peng, H., Hamprecht, F. A., and Olivo-Marin, J. C. (2016). Imagining the future of bioimage analysis. Nat. Biotechnol. 34, 1250–1255. doi: 10.1038/nbt.3722
Schindelin, J., Arganda-Carreras, I., Frise, E., Kaynig, V., Longair, M., Pietzsch, T., et al. (2012). Fiji: an open-source platform for biological-image analysis. Nat. Methods 9, 676–682. doi: 10.1038/nmeth.2019
Schindelin, J., Rueden, C. T., Hiner, M. C., and Eliceiri, K. W. (2015). The ImageJ ecosystem: An open platform for biomedical image analysis. Mol. Reprod. Dev. 82, 518–529. doi: 10.1002/mrd.22489
Schmidt, U., Weigert, M., Broaddus, C., and Myers, G. (2018). “Cell detection with star-convex polygons,” in International Conference on Medical Image Computing and Computer-Assisted Intervention (MICCAI). Granada, 265–273. doi: 10.1007/978-3-030-00934-2_30
Schneider, C. A., Rasband, W. S., and Eliceiri, K. W. (2012). NIH image to ImageJ: 25 years of image analysis. Nat. Methods 9, 671–675. doi: 10.1038/nmeth.2089
Szkalisity, A., Piccinini, F., Beleon, A., Balassa, T., Varga, I. G., Migh, E., et al. (2021). Regression plane concept for analysing continuous cellular processes with machine learning. Nat. Commun. 12, 2532. doi: 10.1038/s41467-021-22866-x
von Chamier, L., Laine, R. F., Jukkala, J., Spahn, C., Krentzel, D., Nehme, E., et al. (2021). Democratising deep learning for microscopy with ZeroCostDL4Mic. Nat. Commun. 12, 2276. doi: 10.1038/s41467-021-22518-0
Keywords: bioimage analysis, software, segmentation, concave point, intensity measurement, toolbox
Citation: Ritchie A, Laitinen S, Katajisto P and Englund JI (2022) “Tonga”: A Novel Toolbox for Straightforward Bioimage Analysis. Front. Comput. Sci. 4:777458. doi: 10.3389/fcomp.2022.777458
Received: 15 September 2021; Accepted: 23 February 2022;
Published: 31 March 2022.
Edited by:
Florian Levet, UMR5297 Institut Interdisciplinaire de Neurosciences (IINS), FranceCopyright © 2022 Ritchie, Laitinen, Katajisto and Englund. This is an open-access article distributed under the terms of the Creative Commons Attribution License (CC BY). The use, distribution or reproduction in other forums is permitted, provided the original author(s) and the copyright owner(s) are credited and that the original publication in this journal is cited, in accordance with accepted academic practice. No use, distribution or reproduction is permitted which does not comply with these terms.
*Correspondence: Johanna I. Englund, am9oYW5uYS5lbmdsdW5kQGhlbHNpbmtpLmZp; Pekka Katajisto, cGVra2Eua2F0YWppc3RvQGhlbHNpbmtpLmZp