 Fabiano Papaiz1,2,3*
 Mario Emílio Teixeira Dourado Jr.1,4
 Ricardo Alexsandro de Medeiros Valentim1
 Antonio Higor Freire de Morais1,3
 Joel Perdiz Arrais2
- 1Laboratory of Technological Innovation in Health (LAIS), Federal University of Rio Grande do Norte, Natal, Brazil
- 2Centre for Informatics and Systems of the University of Coimbra, Department of Informatics Engineering, University of Coimbra, Coimbra, Portugal
- 3Advanced Nucleus of Technological Innovation, Federal Institute of Rio Grande do Norte, Natal, Brazil
- 4Department of Internal Medicine, Federal University of Rio Grande do Norte, Natal, Brazil
The prognosis of Amyotrophic Lateral Sclerosis (ALS), a complex and rare disease, represents a challenging and essential task to better comprehend its progression and improve patients' quality of life. The use of Machine Learning (ML) techniques in healthcare has produced valuable contributions to the prognosis field. This article presents a systematic and critical review of primary studies that used ML applied to the ALS prognosis, searching for databases, relevant predictor biomarkers, the ML algorithms and techniques, and their outcomes. We focused on studies that analyzed biomarkers commonly present in the ALS disease clinical practice, such as demographic, clinical, laboratory, and imaging data. Hence, we investigate studies to provide an overview of solutions that can be applied to develop decision support systems and be used by a higher number of ALS clinical settings. The studies were retrieved from PubMed, Science Direct, IEEEXplore, and Web of Science databases. After completing the searching and screening process, 10 articles were selected to be analyzed and summarized. The studies evaluated and used different ML algorithms, techniques, datasets, sample sizes, biomarkers, and performance metrics. Based on the results, three distinct types of prediction were identified: Disease Progression, Survival Time, and Need for Support. The biomarkers identified as relevant in more than one study were the ALSFRS/ALSFRS-R, disease duration, Forced Vital Capacity, Body Mass Index, age at onset, and Creatinine. In general, the studies presented promissory results that can be applied in developing decision support systems. Besides, we discussed the open challenges, the limitations identified, and future research opportunities.
1. Introduction
Amyotrophic Lateral Sclerosis (ALS) is a rare, incurable, and progressive disease that affects the neurons of the human motor system. The communication between the brain and muscles is gradually interrupted, leading patients to paralysis and death. Its causes are unknown, typically commits men and women between the ages of 40 and 70. The average life expectancy is 3–5 years after symptoms onset, and the worldwide incidence is about 1.9 cases per 100,000 individuals per year. ALS is clinically heterogeneous, presenting different sites of disease onset, extra-motor involvements, progression rates, and survival times among their patients (Andersen et al., 2012; Chiò et al., 2014; Swinnen and Robberecht, 2014; Hardiman et al., 2017). Being ALS a complex disease, providing an accurate prognosis becomes a challenge to the physicians (e.g., survival time, disease progression, moment to introducing specific treatments). Thus, it is essential to identify relevant biological markers (biomarkers) and understand how they are related to ALS disease progression. Biomarkers are parameters collected from the patients that can be used to confirm a disease presence (diagnosis), follow up a disease progression (prognosis) or treatment response (monitoring), and calculate the probability of developing a disease (risk) (Group, 2001). They can comprise different data types, such as clinical, biometric, imaging, biofluid, and genetic. Previous studies identified helpful biomarkers that can assist in ALS prognosis, such as age at symptom onset, diagnosis delay, weight loss, bulbar site of onset, rate of functional and respiratory impairment over time, microRNAs, neurofilaments, and laboratory tests (ALS, 1996; Cedarbaum et al., 1999; Kollewe et al., 2008; Chiò et al., 2009; Varghese et al., 2013; Hardiman et al., 2017; Waller et al., 2017).
Researches using Artificial Intelligence techniques, like Machine Learning (ML) algorithms, have been successfully applied to improve the diagnosis and prognosis of diseases, such as the recent advances in the oncology field (Kourou et al., 2015; O'Shea et al., 2016). The ML field aims to develop computer programs capable of learning using previous experience (training data) without being explicitly programmed for this. ML algorithms could extract information from the training data, transform it into knowledge, and use it to solve different categories of problems (e.g., classification, regression, clustering, Samuel, 1988). In theory, the greater the amount of training data available, the greater the algorithm's learning and performance (Mitchell, 1997; Kubat, 2017). In this sense, having access to ALS patient data is crucial to perform relevant studies in the prognostic area and create ML solutions to help physicians in their daily work. The analysis of medical data usually involves dealing with high-dimensional data, covering a large number of biomarkers. Thus, some ML techniques (e.g., Feature Selection, Dimensionality Reduction) can be applied to transform a complex dataset into a simpler one by identifying the more relevant biomarkers, which improve the learning performance, data collecting efficiency, and algorithm understanding (Lee and Verleysen, 2007; Brank et al., 2011). ML algorithms can be used to develop Clinical Decision Support Systems (CDSS). The CDSS are computer programs designed to help physicians make more appropriate and timely decisions about their patients (Berner et al., 2007; Beeler et al., 2014; Gultepe et al., 2014; CDS, 2015; Rosati et al., 2020; Romeo and Frontoni, 2022). These systems usually provide prognostic predictions to improve the decision-making process and, thus, improve the patient's quality of life. Some benefits include improving patients' quality of care, treatment efficiency, resource planning, and reducing costs. CDSS also represents a valuable tool to promote knowledge dissemination among all interested health workers. ML-based CDSS can improve clinical decisions by helping physicians analyze and make inferences on a large amount of patient data. However, some ML approaches present results that can not be easily understood, decreasing their interpretability (e.g., Artificial Neural Networks or Support Vector Machines). Interpretability refers to how well a person can understand the decisions made by the ML algorithm (Miller, 2019). This issue can difficult the process of acceptance and integration of a CDSS in the clinical environment routine. Consequently, the development of a CDSS must have concerned about interpretability issues, being transparent enough so that health workers can understand how any support was offered.
Many countries present financial limitations on their health system. This fact makes it unfeasible to collect complex and costly biomarkers (e.g., genetic) in primary care. In this manner, it is essential to carry out studies considering these limitations to develop computational solutions (e.g., CDSS) that can assist a higher number of primary care units.
The main objective of this study is to investigate ML approaches on ALS prognosis that analyzed less complex biomarkers, which can be potentially applied to develop clinical decision support systems to assist physicians in the real-world ALS clinical setting. We focused on studies that analyzed biomarkers commonly present in the ALS disease clinical practice, such as demographic, clinical (including functional, respiratory, and nutritional), laboratory, and imaging data. Hence, we investigate studies using biomarkers obtained through a less complex process, aiming to provide an overview of solutions that can be applied to develop decision support systems and be used on a large scale in primary care, considering financial limitations. In this sense, we did not include studies using omics data (i.e., genomic, transcriptomic, proteomic, and metabolomic). We described the recent advances in this area, the currently available datasets, the biomarkers analyzed, the ML algorithms and techniques used, the most relevant biomarkers identified, and their outcomes. Besides, we discussed the open challenges, the limitations identified, and future research opportunities.
2. Methods
This systematic review aims to investigate ML solutions applied to ALS prognosis. In this sense, we elaborated research questions (RQ) to guide the conduct of this article, which are presented in Table 1. Next, we performed the following stages: (i) search articles related to ALS prognosis using ML in scientific databases, (ii) apply the inclusion criteria, (iii) apply the exclusion criteria, and (iv) analyze and summarize the selected articles.
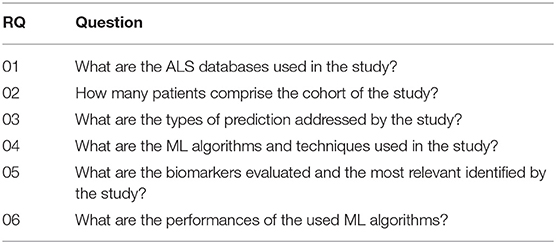
Table 1. Research questions.
In the first stage, the relevant literature was obtained from the PubMed, Science Direct, IEEEXplore, and Web of Science databases. The search was performed in April 2021 using the following search query: (“artificial intelligence” OR “machine learning” OR “deep learning”) AND (“amyotrophic lateral sclerosis” OR “motor neurone disease”) AND (“predict” OR “prognosis” OR “progression”). We used the Rayyan Web Application (Ouzzani et al., 2016) to organize the resulting articles and also to perform the remaining stages.
In the second and third stages, we applied the Inclusion (IC) and Exclusion (EC) Criteria to filter the articles according to the scope of this article (see Tables 2, 3). We considered only articles published in Journals, written in English, and published between January 2011 and April 2021 (IC-01, IC-02, and IC-03). Articles that did not belong to the Information Technology, Computer Engineer, or Computer Science related areas were not included (IC-04). Next, we carried out the removal of the review articles (EC-01), the duplicate entries (EC-02), and articles not related to ML applied to ALS prognosis (EC-03). Then, the articles using omics data were removed (EC-04).
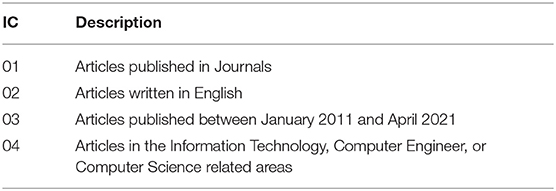
Table 2. Inclusion criteria.
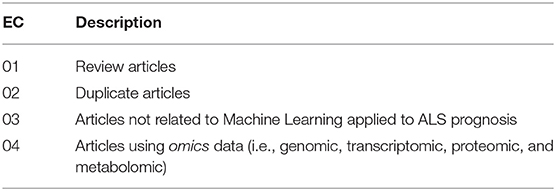
Table 3. Exclusion criteria.
Finally, in the fourth stage, the select articles were thoroughly read, which allowed the final analysis and accomplishment of the objectives of this research.
3. Results
Figure 1 illustrates the search and screening process for this systematic review. The search query and all inclusion criteria were used to perform the database searches. A total of 52 articles were retrieved, where two review articles were immediately excluded. After the removal of 15 duplicates, 35 articles were chosen for abstract review. A total of 25 studies were excluded due to the use of omic data (n = 6) and not being related to ML applied to ALS prognosis (n = 19). After completing the searching and screening process, 10 articles were selected to be analyzed and summarized. The following sections present the results that address the research questions defined in this study (Table 1).
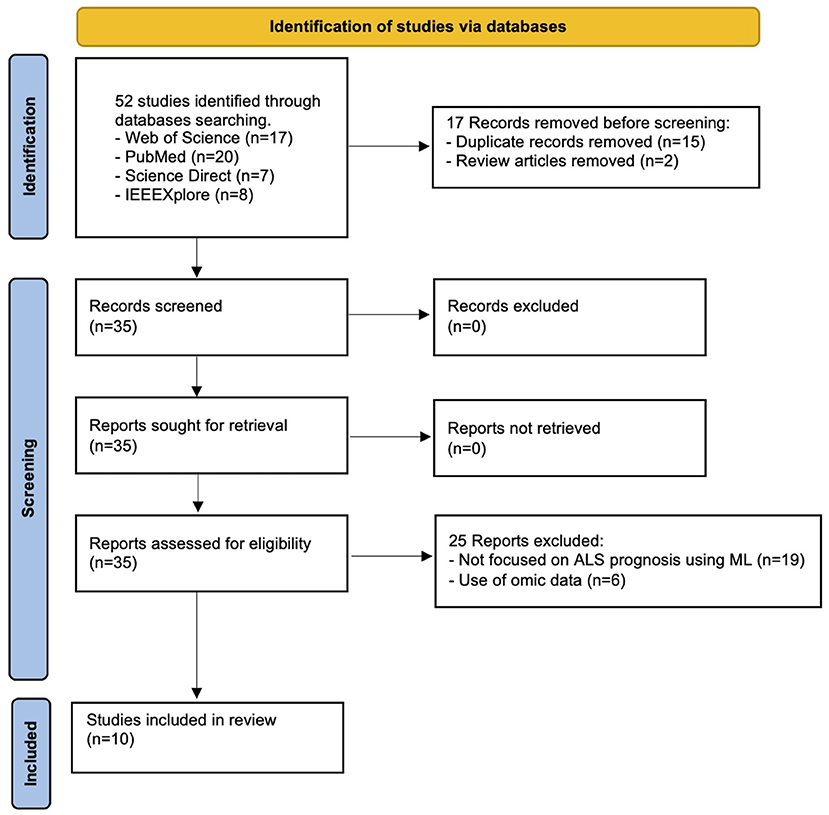
Figure 1. PRISMA flow chart of this study.
3.1. ALS Datasets and Sample Sizes
Different datasets were analyzed and their sample sizes ranged from 41 up to over 10,000 samples. Table 4 describes all the datasets analyzed. Most of the studies (60%) analyzed data from the PRO-ACT (Atassi et al., 2014) dataset, probably because it was the only publicly available. The other datasets used were local or proprietary. The data formats analyzed included tabular (all studies) and image (van der Burgh et al., 2017). More detail about the sample size used by each study are described in Tables 6–8.
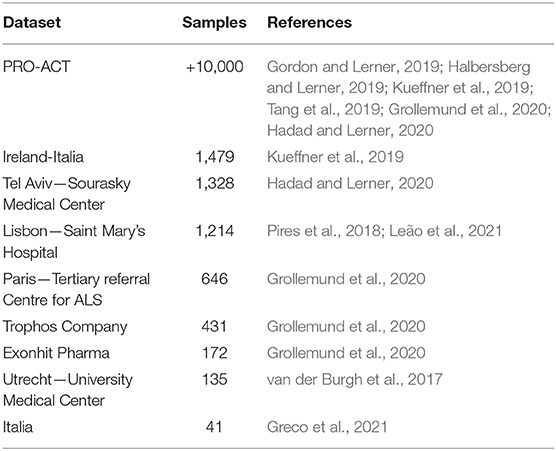
Table 4. List of datasets used in the studies, inversely ordered by the sample size.
3.2. Types of Prediction Addressed
Based on the included studies, three distinct types of prediction were identified: Disease Progression, Survival Time, and Need for Support (more detail in Table 5). Kueffner et al. (2019) addressed the Disease Progression and Survival Time types simultaneously.
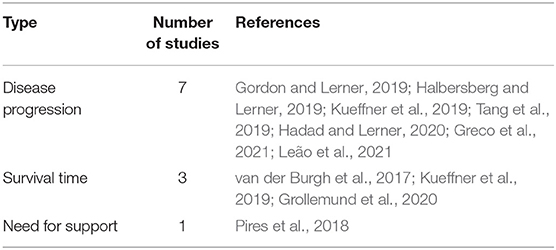
Table 5. Types of prediction addressed by the studies.
The Disease Progression prediction aimed to estimate the patient's state at a given moment in the future and was the type most addressed by the studies included (70%). The Survival Time prediction aimed to estimate the occurrence of death from a baseline date to a point-time in the future, such as the probability of death after 12 months from symptoms onset. The Need for Support prediction aimed to estimate the moment when patients will need more specialized support.
3.3. Predictive Machine Learning Approaches
For Disease Progression prediction, most studies aimed to estimate changes in the ALS Functional Rating Scale (ALSFRS) or the Revised ALS Functional Rating Scale (ALSFRS-R) over time. Two other studies aimed to classify patients concerning their disease progression rates (Slow/Fast Kueffner et al., 2019, Low/High Greco et al., 2021). Table 6 details the target predictions, best ML algorithm, performance, datasets, samples size, techniques, validation strategies, and biomarkers evaluated for each study.
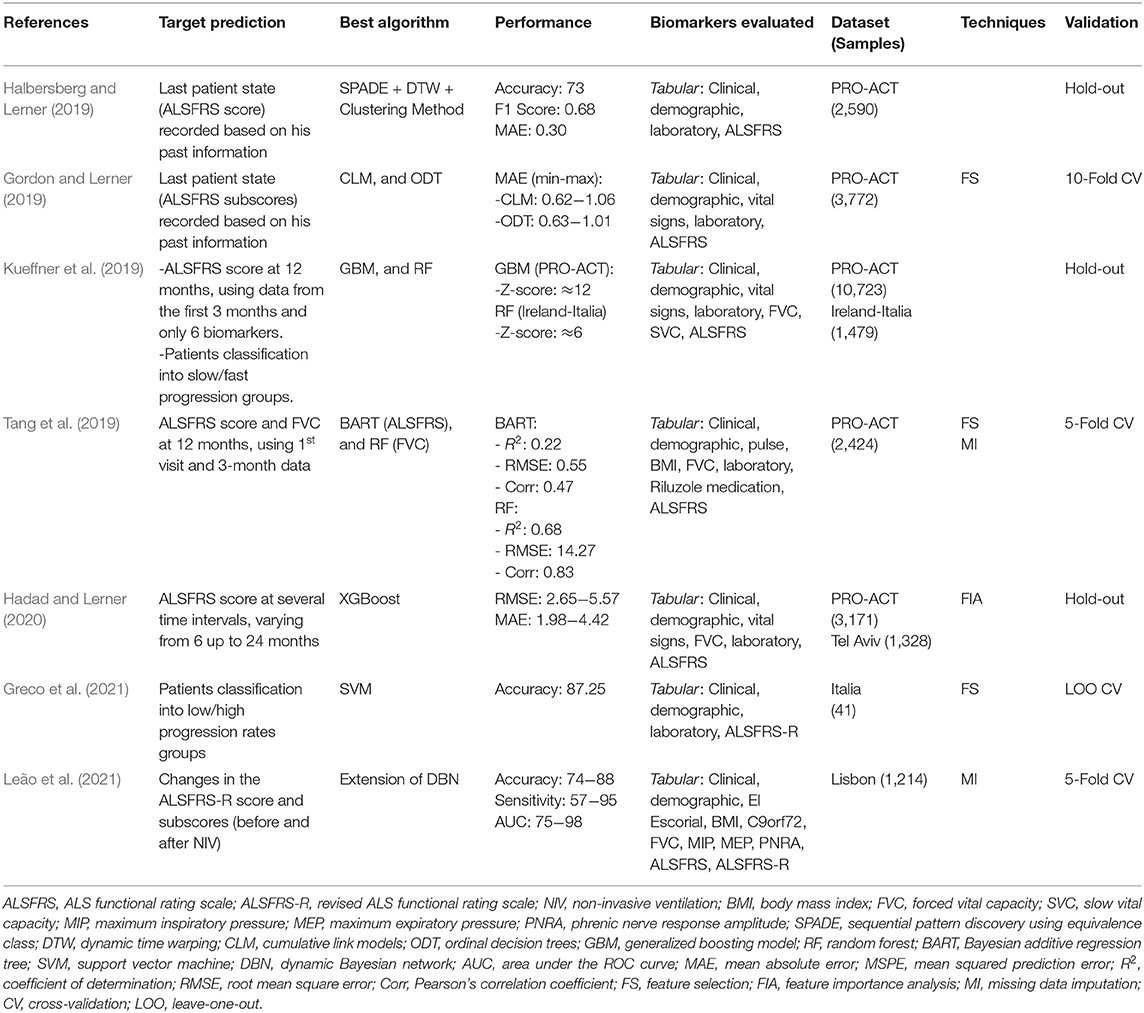
Table 6. Overview of ML approaches on disease progression.
The studies that addressed the Survival Time prediction aimed to classify the patients into survival groups and estimate the probability of death after a specific time interval. van der Burgh et al. (2017) aimed to classify patients into Short (<25 months), Medium (25−50 months), or Long (>50 months) survival groups. Kueffner et al. (2019) aimed to estimate the probability of survival after 12, 18, and 24 months. Grollemund et al. (2020) aimed to estimate the probability of patients being alive after 12 months. All three studies used the date of symptoms onset as the baseline date. The characteristics of each study are detailed in Table 7.
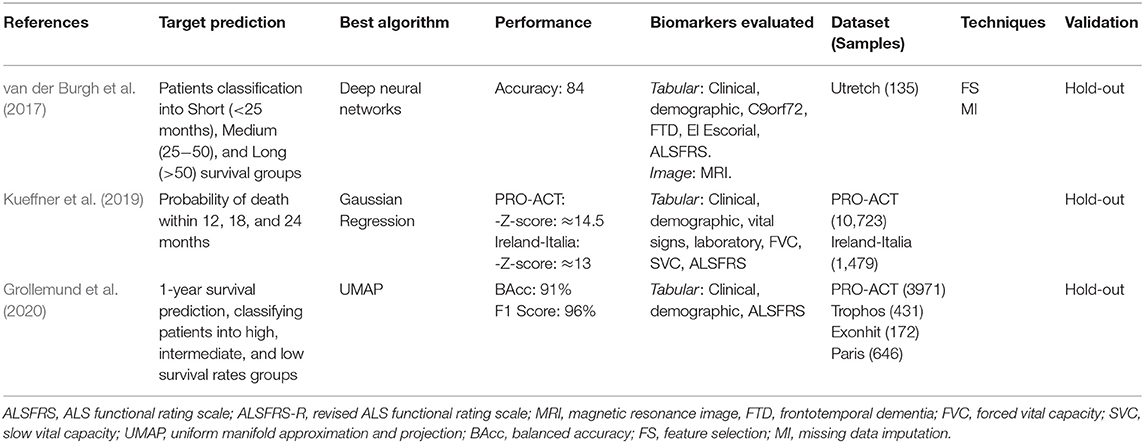
Table 7. Overview of ML approaches on survival time.
Pires et al. (2018) was the unique study that addressed the Need for Support prediction, aiming to estimate the need for Non-Invasive Ventilation (NIV) support after 3, 6, and 12 months. The characteristics of this study are detailed in Table 8.
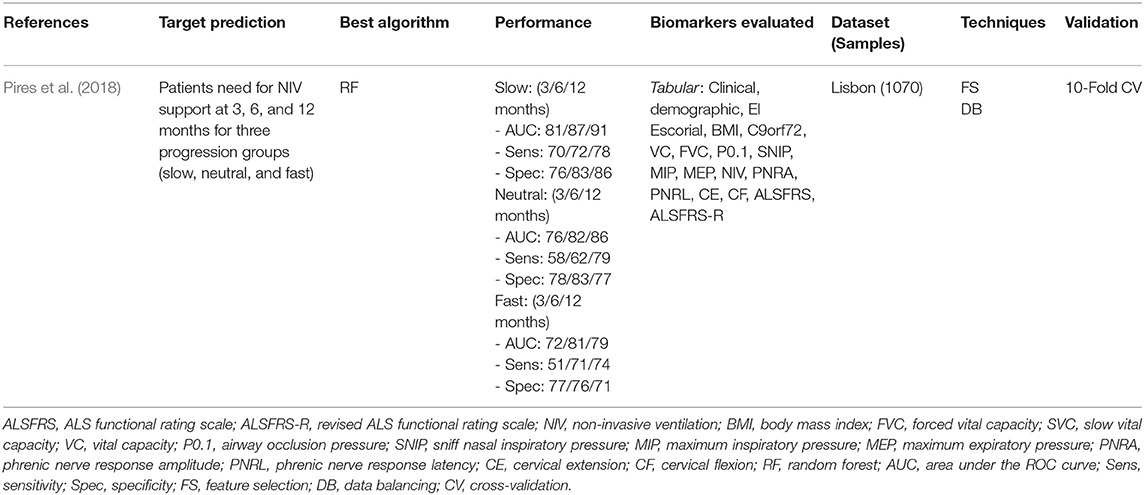
Table 8. Overview of ML approach on need for support.
3.4. Biomarkers Evaluated and the Most Relevant Identified
As previously mentioned, we focused on the biomarkers commonly present in the ALS disease clinical practice, being obtained in a less costly and complex way. The biomarkers evaluated comprise clinical, demographic, vital signs, respiratory, functional, laboratory, imaging, neurophysiological, and medication data. For more detail, please see column Biomarkers Evaluated in Tables 6–8. All the selected studies evaluated the ALS Functional Rating Scale (ALSFRS) or the Revised ALS Functional Rating Scale (ALSFRS-R) biomarkers. This fact highlights the importance of these biomarkers in monitoring ALS patients.
Table 9 depicts the most relevant biomarkers identified in the studies, with the information about their associated types of prediction. They comprised clinical, imaging, functional, respiratory, and laboratory data. The biomarkers identified as relevant in more than one study were the ALSFRS/ALSFRS-R (n = 7), disease duration (n = 5), Forced vital capacity (n = 4), Body mass index (n = 2), age at onset (n = 2), and Creatinine (n = 2).
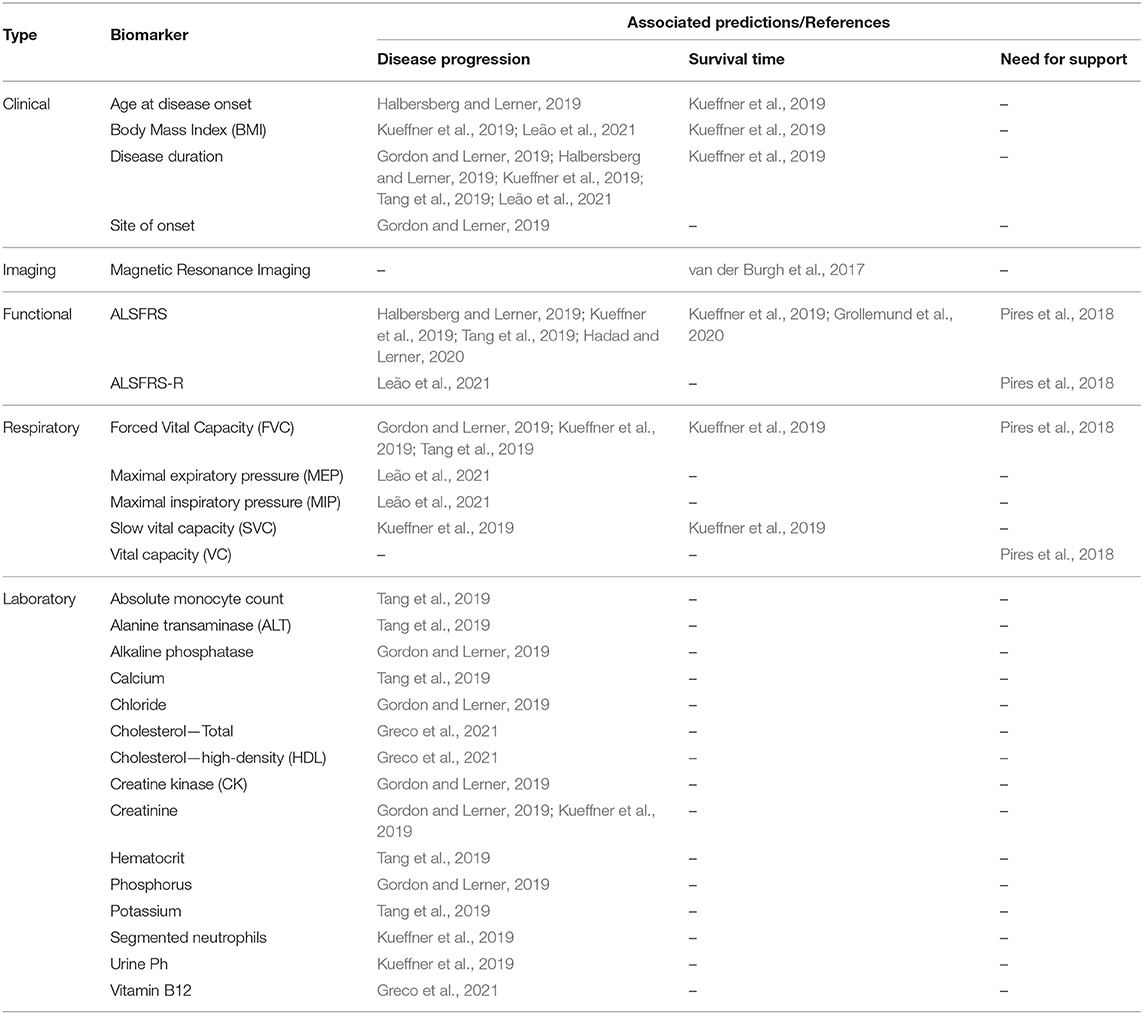
Table 9. Most relevant biomarkers identified, associated predictions, and references.
3.5. Description of the Studies
van der Burgh et al. (2017) demonstrated the positive impact of using Magnetic Resonance Images (MRI) along with clinical information to classify ALS patients into three survival groups: Short (<25 months), Medium (25−50 months), and Long (>50 months). The biomarkers evaluated were clinical information (e.g., site of onset, age at onset, ALSFRS slope, FVC) and MRI images (Structural Connectivity and Brain Morphology data) from 135 ALS patients. They developed Deep Neural Networks models and evaluate them in four scenarios using different biomarkers sets: (i) only Clinical Data, (ii) only Structural Connectivity MRI Data, (iii) only Brain Morphology MRI Data, and (iv) combining Clinical and MRI Data. The greater accuracy was obtained using the Clinical-MRI combined data (84%) compared to the other three strategies (Clinical: 69%; Structural Connectivity MRI: 63%; Brain Morphology MRI: 63%). They pointed out the power of Deep Neural Networks in making predictions using complex data. However, the relationships between input and output variables could not be easily recognized, needing more investigation to understand ALS progression better.
Pires et al. (2018) developed a model to predict when a patient will need NIV support according to a given time window (3, 6, and 12 months). They used the Portuguese ALS Dataset (n = 1,070), combining the static and temporal data into a data structure called snapshot, which contains all information about a patient at a specific date. The patients were divided into three disease progression groups (Slow, Neutral, and Fast) and, for each group, their respective snapshots were used as learning instances to evaluate several ML models. A Feature Selection Ensemble approach was used to select the relevant biomarkers for each group. The Random Forest model obtained the best performance for 3, 6, and 12 months time window values. The relevant biomarkers present in all groups were BMI, FVC, and VC. Other relevant biomarkers (present in 75% of the time) were age at onset, disease duration, and ALSFRS score. The authors reported the advantage of using specialized ML models for different patient groups (e.g., disease progression groups) rather than create generalized models treating all the patients similarly.
Halbersberg and Lerner (2019) demonstrated the benefit of using temporal modeling, sequence clustering, and sequential pattern mining to predict the last patient state recorded (ALSFRS score) based on his past information. To find relevant deterioration patterns in temporal patients data they developed a framework consisting of three stages: (i) group patients with similar progression using hierarchical clustering based on Dynamic Time Warping, (ii) perform pattern mining to found out common functional deterioration patterns among patients based on the SPADE sequence mining algorithm, and (iii) develop a Random Forest model to classify patients into their most similar cluster to predict their next disease state. The performance obtained by the proposed framework (Accuracy: 73, F1 score: 0.68, Mean Absolute Error: 0.3) was superior related to two other benchmark models (Random Forest and Long Short-Term Memory, both using no temporal modeling). They used static (e.g., age at onset, time from onset, gender) and longitudinal (ALSFRS scores and subscores) data of 2,590 subjects from the PRO-ACT dataset. The most important predictors reported were the previous ALSFRS score, the previous ALSFRS Dressing subscore, the previous Climbing Stairs subscore, the previous Turning in Bed subscore, the time from disease onset, and the deterioration pattern termed < E,G,I> (i.e., a sequential declining in the Writing, Dressing, and Walking ALSFRS subscores).
Gordon and Lerner (2019) evaluated the capacity of ordinal classifiers to predict the functional decline of the patients. They used data about the first and last patient visits from the PRO-ACT dataset (n = 3,772), analyzing the following biomarkers: clinical, demographic, ALSFRS, FVC, medication, vital signs, and laboratory tests. The target variables were all ten ALSFRS items (questions) separately. The patient states were mapped to the ALSFRS items, thus correlating patient state to disease progression for each point in time. Addressing the ordinal nature of the ALSFRS, they evaluated the following ordinal classifiers: Cumulative Link Models (CLM), Ordinal Decision Trees (ODT), and Cumulative Probability Tree (CPT). To evaluate their performances, they defined a penalizing system that accounts for various error severities differently. Thus, a classifier was less penalized when it predicted the value of 2 instead of 1 when the real value was 3. These three classifiers were compared with the Random Forest (RF), a non-ordinal classifier. The results showed that the CLM and ODT ordinal classifiers presented a similar performance and outperformed the RF classifier regarding the Mean Absolute Error measured in the best experiment scenario (CLM: 0.62−1.06; ODT: 0.63−1.01; RF: 1.01−1.61). For feature selection, the authors implemented an algorithm based on the J3 scattering matrix criterion for each ALSFRS item individually. The most relevant predictors were the FVC, the site of onset, the time from onset, and the laboratory tests Creatinine, CK, Chloride, Phosphorus, and Alkaline Phosphatase.
A crowdsourcing strategy was presented in Kueffner et al. (2019), where were selected 30 teams around the world to participate in an ALS stratification challenge. They asked the participants to create ML models to perform prediction tasks using the PRO-ACT and the Irish-Italian Registries datasets. The teams used patient data from the first three months and were limited to evaluate only six of all biomarkers available. The target predictions were the Disease Progression at 12 months (decline of the Functional Rate Scale) and the Probability of Survival at 12, 18, and 24 months. Regarding the survival prediction, one team outperformed the others significantly using a Gaussian Process Regression model, presenting a better approach in leading with the right-censored patient outcome (dead or trial dropout). The best models related to the disease progression prediction used the Generalized Boosting Model and the Random Forest algorithms. The more relevant biomarkers were disease duration, age at onset, site of onset, gender, weight, BMI, respiratory exams (FVC and SVC), laboratory tests (Creatinine and Segmented Neutrophils), and ALSFRS scores and subscores. Based on the relevant biomarkers chosen by the teams, the authors have identified four distinct patient groups: Slow Progressing, Fast Progressing, Early Stage, and Late Stage. The main biomarkers related to each group were also detailed in this study, where the authors highlighted the importance of the ALSFRS Bulbar subscore (questions 1−3) in discriminating between groups.
Tang et al. (2019) addressed predictions in changing of the ALSFRS score and in the FVC percentage. They used static and longitudinal biomarkers from the PROC-ACT dataset (n = 2,424), including only those patients with information about ALSFRS scores over time. The longitudinal data were transformed into signature vectors aggregating statistics values (minimum, median, maximum, and slope). Using data from the first visit and at the 3-month, the authors create models to predict the changes in the ALSFRS slope at 12-month. The evaluated models (Random Forest and Bayesian Additive Regression Tree) achieved modest results (Correlation: 0.47; RMSE: 0.55; R2: 0.22), thus, indicating the difficulty in predicting 12-month ALSFRS slope using the only baseline and 3-months data. Feature Selection was performed using the Random Forest and the Knockoff Filter methods. After combining the top-ranked biomarkers returned by both methods, the best predictive biomarkers were the ALSFRS score, the disease duration, the FVC, and the Absolute Monocyte Count. To predict the FVC Percentage changes between 3 and 12 months, Random Forest models were tested in two scenarios (either including the baseline FVC or not). The best results were obtained using the FVC at baseline data, demonstrating the power of this biomarker, which increased the correlation from 0.67 to 0.83. The authors also applied unsupervised classification (K-Means) to find distinct phenotypes groups, founding four balanced clusters among the patients. However, it was considered impractical to clearly understand how the groups differ due to the high number of biomarkers defined for each group during the clustering process.
Hadad and Lerner (2020) studied prediction of the ALSFRS score in several time intervals, varying from 6 to 24 months. Temporal (Long Short Term Memory—LSTM) and non-temporal (Random Forest, XGBoost, and Multilayer Perceptron) models were evaluated over the PRO-ACT dataset (n = 3,171). To be used by the non-temporal models, the longitudinal data were transformed into vectors containing aggregated values (mean, standard deviation, slope, minimum, maximum). Each model was tested using 60 different randomly generated configurations, and their averaged performances were compared (Root Mean Square Error and Mean Absolute Error). The XGBoost model obtained superior performance for the most time intervals evaluated (RMSE: 2.65−5.57, MAE: 1.98−4.42), being more precise for shorter than longer intervals. The relevant predictive biomarkers were the ALSFRS subscores. In another experiment, these models were evaluated in two scenarios: (i) trained with the PRO-ACT and tested with the TASMC dataset (n = 1,328), and (ii) trained and tested using only the TASMC data. The short-term predictions (up to 6 months) were more precise using models trained with the PRO-ACT, and the XGBoost obtained the best results again. The authors highlighted that the PROC-ACT contains data from clinical trials that may not reflect the reality presented by the clinical environment patients due to the inclusion/exclusion criteria used. Thus, their patients tend to be younger and to have a slower disease progression, in addition to having more visits registered than the usual clinical patients. To address this problem, they proposed a final experiment applying the Domain Adaptation approach to develop predictive models using the PRO-ACT data and improve their performances using patient clinical data. Firstly, LSTM and Multilayer Perceptron models were trained using only data from the PRO-ACT. Then, the training phase was complemented using the TASMC data to fine-tune the models to the clinical data. The results demonstrated that the use of domain adaptation improved the predictive performance for both models.
Grollemund et al. (2020) presented a dimensionality reduction model to predict 1-year survival rates. The biomarkers analyzed were gender, site onset, age, weight, disease duration, ALSFRS scores, ALSFRS slopes, and if died or not after one year. They combined data from four datasets (PRO-ACT, Trophos, Exonhit, and Paris Tertiary Referral Center), totaling 5,220 samples. The obtained dataset was further divided into development and validation sets. After, the high-dimensional data from the development set were reduced and projected onto 2D space through the Uniform Manifold Approximation and Projection (UMAP) algorithm. Thus, the authors were able to project information about the patients into a 2D graph. The 2D data were divided into three 1-year survival probability zones: High (90%), Intermediate (80%), and Low (58%). Then, the validation set was used to evaluate the proposed model, and the results were compared with the Random Forest and the Logistic Regression models. The UMAP model obtained better classification results (F1 score: 96%, Balanced Accuracy: 91%) when compared to the average results of the other models (F1 score: 50%, Balanced Accuracy: 60%). The adopted approach also helped identify the biomarkers with higher or lower correlation with the survival prediction. For example, the age and ALSFRS score presented a high correlation, while the gender and weight showed a low correlation. However, the total comprehension of the relationship between input and output variables cannot be obtained because the adopted model is considered a black-box approach, which degrades its interpretability.
Despite Greco et al. (2021) aimed to find blood analytes to distinguish patients who have ALS from those with Lower Motor Neuron Disease (LMND), they also studied the classification of these patients with relation to their disease progression rates (High or Low). They analyzed clinic, demographic, and blood (108 analytes) data from 41 ALS patients. An SVM model was developed, and the Recursive-Feature-Elimination algorithm was used as a feature selection method. This model obtained an accuracy of 87.25% in classifying ALS patients into the High and Low groups using the first 16 ranked analytes, indicating the potential of using blood data as predictor biomarkers. Elevated levels of Vitamin-B12, Total Cholesterol, and HDL were related to a higher disease progression rate.
Leão et al. (2021) proposed a predictive model based on Dynamic Bayesian Networks (DBN), including both static and longitudinal data. They accessed data from the Portuguese ALS dataset (n = 1,214), and the target prediction was the disease progression (ALSFRS score and subscores) related to the need for NIV support. To be processed by the DBN model, the longitudinal data were converted into time-series data and then divided into Before NIV and After NIV subsets. Thus, they were able to determine the most relevant biomarkers related to these two essential disease stages. The authors developed a predictive model, termed stdDBN framework, which uses stationary DBNs to predict disease progression and non-stationary DBNs to determine how the biomarkers analyzed change over time in each subset. The average results for predicting disease progression were above 80% for both subsets regarding the Accuracy, Sensitivity, and AUC metrics, demonstrating the potential of the proposed methodology. Graphs were generated to visualize how the biomarkers change over time, displaying their values in different time steps for each stage (before and after NIV). This approach allowed identifying some interesting relationships, as following mentioned. The Maximum Expiratory Pressure (MEP) was considered the most important respiratory exam to predict the patient ventilatory decline before the need for NIV support. The ALSFRS Bulbar subscore had more influence on disease progression after NIV than before NIV. The BMI and Disease Duration had a stronger influence than the other static biomarkers for both subsets.
4. Discussion
This study systematically reviewed the literature to identify relevant studies that used ML approaches to assist ALS disease prognosis. As explained before in Section 2, we focused on those studies comprising biomarkers commonly present in the daily ALS clinical practice. We identified 10 studies and detailed their the target predictions, best ML algorithm, performance, datasets, samples size, techniques, validation strategies, biomarkers evaluated, and the most relevant biomarkers identified.
4.1. ALS Datasets and Data Preprocessing
Notably, the studies accessed datasets that concentrate ALS patients from Europe and the United States of America. Data from other regions were not analyzed (e.g., South America, Africa, or Asia). We consider this analysis essential to confirm (or not) if the predictive ML solutions can be broadly generalized and if different datasets can be combined to compose an even more relevant ALS dataset. Most of the studies (60%) analyzed data from the PRO-ACT dataset. PRO-ACT is the largest public ALS dataset available, containing over 10,000 samples, serving as a basis for several studies on ALS disease, and suitable for developing ML solutions. However, some studies included advised that the PRO-ACT has limitations that can increase the risk of creating biased models (Tang et al., 2019; Grollemund et al., 2020; Hadad and Lerner, 2020). Previous studies also reported these PRO-ACT limitations, and the risk of it does not represent the clinical patient population due to the inclusion and exclusion criteria used in the clinical trials (Chio et al., 2011; Atassi et al., 2014). For instance, their patients tend to be younger and present fewer functional impairments. In this sense, using a validation strategy that includes an external dataset represents an alternative to decrease bias risk and achieve a more reliable ML algorithm evaluation. This strategy was utilized by Hadad and Lerner (2020) and Grollemund et al. (2020). Hadad and Lerner (2020) created a training dataset combining samples from the PRO-ACT (100%) and Tel Aviv (90%) dataset. The samples remaining (10%) of the Tel Aviv dataset were used to test the model. Grollemund et al. (2020) performed the validation using the Paris dataset, which was not used in the training and testing stages. Preferably, the external dataset should contain data from the clinical patient population.
When designing ML solutions, we need to be aware of issues that can affect the performance and reliability of the model, such as missing values or data imbalance. The PRO-ACT dataset presented a considerable amount of missing values what caused that only 32% of its samples could be used in practice. Thus, it is valuable to evaluate how the missing data imputation methods can help to increase the sample size. van der Burgh et al. (2017) and Tang et al. (2019) used a more straightforward imputation method, calculating the average for each feature and imputed it in the samples with missing values. Leão et al. (2021) combined the results of Last Observation Carried Forward and Linear Interpolation missing imputation methods, eliminating posteriorly the samples that still presented some missing values. However, the authors did not detail the sample sizes increase by using these strategies. The data imbalance problem occurs when the training data presents an unequal distribution between samples regarding some class of interest. Pires et al. (2018) combined Undersampling and Oversampling techniques to achieve a balance of 50% between the classes of interest. Grollemund et al. (2020) reported that the data imbalanced related to the target prediction (1-year survival probability) influenced the choice of adequate evaluation metrics due to 75% of the patients had survived for more than 1 year.
4.2. Predictive Biomarkers Analysis
Although some biomarkers evaluated are collected longitudinally (e.g., ALSFRS, respiratory, laboratory), most studies modeled these temporal data as non-temporal by summarizing longitudinal data into single values (e.g., slope, minimum, maximum, mean, standard deviation). This approach is termed Summary Measures and has some advantages such as being simple to comprehend, can be applied with unequal time intervals between measurements, and being considered statistically robust and valid (Matthews et al., 1990). It allowed that longitudinal information could be processed by non-temporal ML algorithms (e.g., Random Forest, XGBoost) to develop predictive solutions. However, this approach can hide some details about the biomarker changes over time because the aggregated value represents a linear variation over time. For example, an ALSFRS slope decline of 10 in 12 months can be seen as a decline of 0.84 per month (i.e., a linear decline), but the decline may have been accentuated only in the last three months. Future ALS prognosis studies can address this subject by comparing the results obtained using Summary Measures and longitudinal data, depicting the advantages and disadvantages of each approach. Approaches using temporal ML algorithms were presented by Halbersberg and Lerner (2019), Hadad and Lerner (2020), and Leão et al. (2021). Pires et al. (2018) used a strategy to create several snapshots representing the patient states over time by combining static and longitudinal data.
Regarding the ALSFRS/ALSFRS-R biomarker, we consider the approach of analyzing each subscore separately (e.g., swallowing, walking, writing, respiratory) should be preferred instead of analyzing the total score solely. A more precise analysis of the functional loss characteristics among patients can be performed. For example, two patients can have the same total score but with different values in their subscores, indicating a different disease progression for each patient. In the studies included, this approach helped to find distinct biomarkers associated with each subscore (Gordon and Lerner, 2019; Tang et al., 2019; Leão et al., 2021).
Different FS strategies were used by the studies included, which helped to find the more relevant biomarkers related to ALS disease (see Table 9 for more detail). Some benefits reported were described hereafter. The FS strategy used by Greco et al. (2021) helped to select the 16 best predictors among 108 blood analytes (a reduction of 85%). Two laboratory tests (Chloride and Alkaline Phosphatase) were first associated with ALS progression due to the FS strategy used by Gordon and Lerner (2019).
4.3. Predictive Machine Learning Approaches
We identified three types of prediction addressed by the studies included (Disease Progression, Survival Time, and Need for Support). The studies evaluated and used different ML algorithms, techniques, datasets, sample sizes, biomarkers, and performance metrics. Consequently, a direct comparison of their performances is difficult, even within a specific type of prediction. In general, the results showed a considerable decrease in the predictive performance when using data from the first 3 months to predict long-term patient functional changes (e.g., at 12 or 24 months). Therefore, performing long-term predictions is still challenging due to ALS heterogeneity and complexity. The high accuracies reported by van der Burgh et al. (2017) (87.25%) and Greco et al. (2021) (84%) were overshadowed by the reduced number of samples analyzed (135 and 41, respectively), representing an elevated risk of model overfitting. Overfitting occurs when the algorithm presents good performance when using the training data but reduced performance when using the validation data, occurring a super adjust to the training data.
Both ML algorithms used by van der Burgh et al. (2017) (Deep Neural Networks) and Grollemund et al. (2020) (Dimensionality Reduction) presented interpretability issues by being considered black-box approaches. In these studies, the total comprehension of the relationship between input and output variables can not be easily explained. Physicians will desire to understand how the predictions were obtained to verify if they make sense and are trustworthy to be used for prognostication. The complexity of ALS disease makes a large number of biomarkers necessary to obtain good model performances. This fact also complicates the model interpretability when using black-box approaches. Thus, FS strategies can become an important allied to increase the model interpretability by reducing the number of biomarkers necessary. Some ML frameworks also can be explored to explain predictions obtained with black-box models, such as SHAP (Lundberg and Lee, 2017) and LIME (Ribeiro et al., 2016). These frameworks are part of a recent research field termed Explainable Artificial Intelligence (XAI) (Adadi and Berrada, 2018).
Finally, the research efforts analyzed in this review, which used only biomarkers commonly present in the ALS clinical practice, demonstrated promissory results that can be applied in developing CDSS. Unexpectedly, only Gordon and Lerner (2019) reported the development of an information system based on their predictive approach and its deployment in an ALS clinical setting. This fact can indicate an absence of CDSS in the ALS prognostic area. Thus, the massive knowledge produced is not used to build decision support systems effective to assist physicians in their daily work. It is an essential step to verify if the results obtained by the studies will be confirmed in a real-world clinical environment. As the results are confirmed, the CDSS will become more reliable to be used as a support tool by the physicians, even when black-box approaches have been utilized. From a practical point of view, a CDDS to assist the ALS prognosis could provide numerous valuable predictions. For example, based on the current patient disease progression rate, the system can inform how much a functional condition is estimated to decline in the following months (e.g., speech, respiratory, walking, swallowing). With this information, physicians could plan adequate treatment for the patient and determine if additional support will be needed (e.g., wheelchair, non-invasive ventilation, gastrostomy, cough assist machine). It could also be helpful to keep patients and families informed to better prepare themselves for the changes resulting from the worsening of the disease.
5. Conclusions
ALS is a devastating and incurable disease with no effective treatments, leading patients to death within 3–5 years from symptoms onset. Research efforts are essential to understand better the progression of this complex disease and improve patients' quality of life. This study reviewed relevant articles published between 2011 and 2021 that addressed the development of ML solutions to support the ALS prognosis.
The studies are promising, but some aspects need special attention. The datasets concentrated patients' data mainly from the USA and Europe. Thus, there is a need to collect and analyze data from other world regions to ensure that the ML solutions can be, in fact, generalized to all populations. When analyzing medical data, the Missing Values and Data Imbalance problems need to be addressed to avoid a negative impact on models' performance and reliability. The model interpretability issue is another important point to consider when using ML algorithms considered black-box, such as Neural Networks and Dimensionality Reduction. Despite the research advances, there is a probable lack of CDSS to assist the physicians in their daily work on ALS disease prognosis.
Limitations of this Study
This research was limited in terms of scope as it did not cover studies that used more complex biomarkers, such as omics data (i.e., genomic, transcriptomic, proteomic, and metabolomic).
The reduced number of studies included (n = 10) can increase the risk of bias. We used a simplistic search query based on keywords. Probably, the number of studies could be increased by using more advanced search options, such as MeSH tags or semantic search.
Data Availability Statement
The original contributions presented in the study are included in the article/supplementary material, further inquiries can be directed to the corresponding author.
Author Contributions
FP, AM, and JA: conceptualization and methodology. FP, MD, RV, AM, and JA: validation and writing—review and editing. FP: investigation, data curation, and writing—original draft preparation. MD, RV, AM, and JA: supervision. RV: project administration and funding acquisition. All authors contributed to the article and approved the submitted version.
Funding
The Brazilian Ministry of Health funded the present study through the Scientific and Technological Development Applied to ALS project, carried out by the Laboratory of Technological Innovation in Health (LAIS), of the Federal University of Rio Grande do Norte.
Conflict of Interest
The authors declare that the research was conducted in the absence of any commercial or financial relationships that could be construed as a potential conflict of interest.
Publisher's Note
All claims expressed in this article are solely those of the authors and do not necessarily represent those of their affiliated organizations, or those of the publisher, the editors and the reviewers. Any product that may be evaluated in this article, or claim that may be made by its manufacturer, is not guaranteed or endorsed by the publisher.
Acknowledgments
This research was carried out in cooperation agreement between Federal University of Rio Grande do Norte and University of Coimbra. We express our sincere gratitude to all leaders that was involved with this agreement.
References
Adadi, A., and Berrada, M. (2018). Peeking inside the black-box: a survey on explainable artificial intelligence (XAI). IEEE Access 6, 52138–52160. doi: 10.1109/ACCESS.2018.2870052
ALS (1996). The amyotrophic lateral sclerosis functional rating scale: assessment of activities of daily living in patients with amyotrophic lateral sclerosis. Arch. Neurol. 53, 141–147. doi: 10.1001/archneur.1996.00550020045014
Andersen, P. M., Abrahams, S., Borasio, G. D., de Carvalho, M., Chio, A., Van Damme, P., et al. (2012). EFNS guidelines on the clinical management of amyotrophic lateral sclerosis (MALS)-revised report of an EFNS task force. Eur. J. Neurol. 19, 360–375. doi: 10.1111/j.1468-1331.2011.03501.x
Atassi, N., Berry, J., Shui, A., Zach, N., Sherman, A., Sinani, E., et al. (2014). The PRO-ACT database: design, initial analyses, and predictive features. Neurology 83, 1719–1725. doi: 10.1212/WNL.0000000000000951
Beeler, P. E., Bates, D. W., and Hug, B. L. (2014). Clinical Decision Support Systems. EMH Swiss Medical Publishers. doi: 10.4414/smw.2014.14073
Berner, E. S., Hannah, K. J., and Ball, M. J., (Eds.). (2007). “Clinical decision support systems,” in Health Informatics (New York, NY: Springer New York). doi: 10.1007/978-0-387-38319-4_1
Brank, J., Mladenić, D., Grobelnik, M., Liu, H., Mladenić, D., Flach, P. A., et al. (2011). “Feature selection,” in Encyclopedia of Machine Learning, eds C. Sammut and G. I. Webb (Boston, MA: Springer US), 402–406. doi: 10.1007/978-0-387-30164-8_306
CDS (2015). Practical Predictive Analytics and Decisioning Systems for Medicine. Amsterdam: Elsevier.
Cedarbaum, J. M., Stambler, N., Malta, E., Fuller, C., Hilt, D., Thurmond, B., et al. (1999). The ALSFRS-R: a revised ALS functional rating scale that incorporates assessments of respiratory function. J. Neurol. Sci. 169, 13–21. doi: 10.1016/S0022-510X(99)00210-5
Chio, A., Canosa, A., Gallo, S., Cammarosano, S., Moglia, C., Fuda, G., et al. (2011). ALS clinical trials: do enrolled patients accurately represent the ALS population? Neurology 77, 1432–1437. doi: 10.1212/WNL.0b013e318232ab9b
Chiò, A., Logroscino, G., Hardiman, O., Swingler, R., Mitchell, D., Beghi, E., et al. (2009). Prognostic factors in ALS: a critical review. Amyotr. Lateral Scler. 10, 310–323. doi: 10.3109/17482960802566824
Chiò, A., Pagani, M., Agosta, F., Calvo, A., Cistaro, A., and Filippi, M. (2014). Neuroimaging in amyotrophic lateral sclerosis: insights into structural and functional changes. Lancet Neurol. 13, 1228–1240. doi: 10.1016/S1474-4422(14)70167-X
Gordon, J., and Lerner, B. (2019). Insights into amyotrophic lateral sclerosis from a machine learning perspective. J. Clin. Med. 8:1578. doi: 10.3390/jcm8101578
Greco, A., Chiesa, M. R., Da Prato, I., Romanelli, A. M., Dolciotti, C., Cavallini, G., et al. (2021). Using blood data for the differential diagnosis and prognosis of motor neuron diseases: a new dataset for machine learning applications. Sci. Rep. 11:3371. doi: 10.1038/s41598-021-82940-8
Grollemund, V., Chat, G. L., Secchi-Buhour, M.-S., Delbot, F., Pradat-Peyre, J.-F., Bede, P., et al. (2020). Development and validation of a 1-year survival prognosis estimation model for Amyotrophic Lateral Sclerosis using manifold learning algorithm UMAP. Sci. Rep. 10:13378. doi: 10.1038/s41598-020-70125-8
Group, B. D. W. (2001). Biomarkers and surrogate endpoints: preferred definitions and conceptual framework. Clin. Pharmacol. Therap. 69, 89–95. doi: 10.1067/mcp.2001.113989
Gultepe, E., Green, J. P., Nguyen, H., Adams, J., Albertson, T., and Tagkopoulos, I. (2014). From vital signs to clinical outcomes for patients with sepsis: a machine learning basis for a clinical decision support system. J. Am. Med. Inform. Assoc. 21, 315–325. doi: 10.1136/amiajnl-2013-001815
Hadad, B., and Lerner, B. (2020). “Domain adaptation from clinical trials data to the tertiary care clinic—Application to ALS,” in 2020 19th IEEE International Conference on Machine Learning and Applications (ICMLA) (Miami), 539–544. doi: 10.1109/ICMLA51294.2020.00090
Halbersberg, D., and Lerner, B. (2019). “Temporal modeling of deterioration patterns and clustering for disease prediction of ALS patients,” in 2019 18th IEEE International Conference on Machine Learning And Applications (ICMLA) (Boca Raton, FL), 62–68. doi: 10.1109/ICMLA.2019.00019
Hardiman, O., Al-Chalabi, A., Chio, A., Corr, E. M., Logroscino, G., Robberecht, W., et al. (2017). Amyotrophic lateral sclerosis. Nat. Rev. Dis. Primers 3:17071. doi: 10.1038/nrdp.2017.71
Kollewe, K., Mauss, U., Krampfl, K., Petri, S., Dengler, R., and Mohammadi, B. (2008). ALSFRS-R score and its ratio: a useful predictor for ALS-progression. J. Neurol. Sci. 275, 69–73. doi: 10.1016/j.jns.2008.07.016
Kourou, K., Exarchos, T. P., Exarchos, K. P., Karamouzis, M. V., and Fotiadis, D. I. (2015). Machine learning applications in cancer prognosis and prediction. Comput. Struct. Biotechnol. J. 13, 8–17. doi: 10.1016/j.csbj.2014.11.005
Kubat, M. (2017). An Introduction to Machine Learning. Cham: Springer International Publishing. doi: 10.1007/978-3-319-63913-0
Kueffner, R., Zach, N., Bronfeld, M., Norel, R., Atassi, N., Balagurusamy, V., et al. (2019). Stratification of amyotrophic lateral sclerosis patients: a crowdsourcing approach. Sci. Rep. 9:690. doi: 10.1038/s41598-018-36873-4
Leão, T., Madeira, S. C., Gromicho, M., de Carvalho, M., and Carvalho, A. M. (2021). Learning dynamic Bayesian networks from time-dependent and time-independent data: unraveling disease progression in Amyotrophic Lateral Sclerosis. J. Biomed. Informatics 117:103730. doi: 10.1016/j.jbi.2021.103730
Lee, J. A., and Verleysen, M. (2007). “High-dimensional data,” in Nonlinear Dimensionality Reduction, Series Title: Information Science and Statistics, eds J. A. Lee and M. Verleysen (New York, NY: Springer New York), 1–16. doi: 10.1007/978-0-387-39351-3_1
Lundberg, S. M., and Lee, S.-I. (2017). “A unified approach to interpreting model predictions,” in Advances in Neural Information Processing Systems, Vol. 30, eds I. Guyon, U. V. Luxburg, S. Bengio, H. Wallach, R. Fergus, S. Vishwanathan, and R. Garnett (Curran Associates, Inc.).
Matthews, J. N., Altman, D. G., Campbell, M. J., and Royston, P. (1990). Analysis of serial measurements in medical research. BMJ 300, 230–235. doi: 10.1136/bmj.300.6719.230
Miller, T. (2019). Explanation in artificial intelligence: Insights from the social sciences. Artif. Intell. 267, 1–38. doi: 10.1016/j.artint.2018.07.007
Mitchell, T. M. (1997). Machine Learning, 1st Edn. McGraw-Hill series in computer science (New York, NY: McGraw-Hill)
O'Shea, K., Cameron, S. J., Lewis, K. E., Lu, C., and Mur, L. A. (2016). Metabolomic-based biomarker discovery for non-invasive lung cancer screening: a case study. Biochim. Biophys. Acta 1860(11 Pt B), 2682–2687. doi: 10.1016/j.bbagen.2016.07.007
Ouzzani, M., Hammady, H., Fedorowicz, Z., and Elmagarmid, A. (2016). Rayyan–a web and mobile app for systematic reviews. Syst. Rev. 5:210. doi: 10.1186/s13643-016-0384-4
Pires, S., Gromicho, M., Pinto, S., Carvalho, M., and Madeira, S. C. (2018). “Predicting non-invasive ventilation in ALS patients using stratified disease progression groups,” in 2018 IEEE International Conference on Data Mining Workshops (ICDMW) (Singapore), 748–757. doi: 10.1109/ICDMW.2018.00113
Ribeiro, M. T., Singh, S., and Guestrin, C. (2016). “‘Why should i trust you?’: explaining the predictions of any classifier,” in Proceedings of the 22nd ACM SIGKDD International Conference on Knowledge Discovery and Data Mining, KDD '16 (New York, NY: Association for Computing Machinery), 1135–1144. doi: 10.1145/2939672.2939778
Romeo, L., and Frontoni, E. (2022). A Unified Hierarchical XGBoost model for classifying priorities for COVID-19 vaccination campaign. Pattern Recogn. 121:108197. doi: 10.1016/j.patcog.2021.108197
Rosati, R., Romeo, L., Silvestri, S., Marcheggiani, F., Tiano, L., and Frontoni, E. (2020). Faster R-CNN approach for detection and quantification of DNA damage in comet assay images. Comput. Biol. Med. 123:103912. doi: 10.1016/j.compbiomed.2020.103912
Samuel, A. L. (1988). “Some studies in machine learning using the game of checkers,” in Computer Games I, ed D. N. L. Levy (New York, NY: Springer New York), 335–365. doi: 10.1007/978-1-4613-8716-9_14
Swinnen, B., and Robberecht, W. (2014). The phenotypic variability of amyotrophic lateral sclerosis. Nat. Rev. Neurol. 10, 661–670. doi: 10.1038/nrneurol.2014.184
Tang, M., Gao, C., Goutman, S. A., Kalinin, A., Mukherjee, B., Guan, Y., et al. (2019). Model-based and model-free techniques for amyotrophic lateral sclerosis diagnostic prediction and patient clustering. Neuroinformatics 17, 407–421. doi: 10.1007/s12021-018-9406-9
van der Burgh, H. K., Schmidt, R., Westeneng, H.-J., de Reus, M. A., van den Berg, L. H., and van den Heuvel, M. P. (2017). Deep learning predictions of survival based on MRI in amyotrophic lateral sclerosis. Neuroimage Clin. 13, 361–369. doi: 10.1016/j.nicl.2016.10.008
Varghese, A. M., Sharma, A., Mishra, P., Vijayalakshmi, K., Harsha, H. C., Sathyaprabha, T. N., et al. (2013). Chitotriosidase - a putative biomarker for sporadic amyotrophic lateral sclerosis. Clin. Proteom. 10:19. doi: 10.1186/1559-0275-10-19
Keywords: Amyotrophic Lateral Sclerosis, prognosis, Machine Learning, health informatics, literature review
Citation: Papaiz F, Dourado MET Jr, Valentim RAM, Morais AHF and Arrais JP (2022) Machine Learning Solutions Applied to Amyotrophic Lateral Sclerosis Prognosis: A Review. Front. Comput. Sci. 4:869140. doi: 10.3389/fcomp.2022.869140
Received: 03 February 2022; Accepted: 24 March 2022;
Published: 28 April 2022.
Edited by:
Peter Kokol, University of Maribor, SloveniaReviewed by:
Riccardo Rosati, Marche Polytechnic University, ItalyQian Du, GNS Healthcare, United States
Copyright © 2022 Papaiz, Dourado, Valentim, de Morais and Arrais. This is an open-access article distributed under the terms of the Creative Commons Attribution License (CC BY). The use, distribution or reproduction in other forums is permitted, provided the original author(s) and the copyright owner(s) are credited and that the original publication in this journal is cited, in accordance with accepted academic practice. No use, distribution or reproduction is permitted which does not comply with these terms.
*Correspondence: Fabiano Papaiz, ZmFiaWFub3BhcGFpekBnbWFpbC5jb20=