Abstract
Underventilation in classrooms is associated with poorer academic performance and greater transmission risk of COVID-19. In a study involving data from CO2 logging in 67 classrooms in Brisbane, Australia, it was found that more than half of the classrooms monitored experienced between 5 and 50 separate instances of CO2 concentrations exceeding 1,800 ppm, a level at which cognitive performance reductions have been recorded and which is considered high risk for COVID-19 transmission. The research identifies a number of human-related factors affecting ventilation in certain classrooms, including the disabling of window operation to minimize the potential for student interference, keeping windows closed in naturally ventilated buildings to improve energy efficiency, difficult to reach switches for exhaust fans and perceptions of the likelihood of remedial action being taken. Identifying Inbodied Interaction as a useful lens to enable users themselves to better identify and remedy instances of poor IAQ, the paper contributes: (1) Insight into the CO2 concentrations experienced in Australian classrooms during the COVID pandemic; (2) Identification of human-factors contributing to the ventilation—and underventilation—of the rooms monitored; and (3) Suggestions for how to foster greater awareness of ventilation among classroom occupants and translate awareness into more active, informed, and healthier ventilation behaviors from occupants, using principles of Inbodied Interaction.
Introduction
This paper aims to present a snapshot of indoor air quality in classrooms in Brisbane, Australia during the SARS CoV-2 (hereafter COVID) pandemic and explore the applicability of the Inbodied Interaction philosophy to engage classroom occupants with indoor air quality (IAQ) and developing healthier ventilation habits. The relationship between poor IAQ and reduced productivity, concentration and decision making ability has long been identified in classrooms (Fisk, 2017) and offices (Wargocki and Wyon, 2013; Zhang et al., 2017). Yet the COVID pandemic has thrust the importance of room ventilation into the international spotlight, as the disease is proven to be more readily transmitted through particulates exhaled in human breath than through touching contaminated surfaces (Morawska and Milton, 2020; Buonanno et al., 2022; Gulland, 2022). Classrooms have remained of particular interest to air quality scientists pre- and during-COVID, given their high occupant densities and consideration given to children's developing respiratory systems (Gurdasani et al., 2021). Children perform on average worse on academic tests conducted in spaces with poor ventilation (Haverinen-Shaughnessy and Shaughnessy, 2015) and that underventilation is commonplace in schools worldwide (Fisk, 2017). It is vital for researchers to identify opportunities to maintain adequate ventilation in classrooms to ensure children learn in the healthiest and most productive environment possible. While IAQ in classrooms was measured during the pandemic, disease transmission itself is not a central research question of the study.
While the provision of ventilation is often conceptualized as an engineering problem, human actions and even social factors (Howieson et al., 2013; Snow et al., 2016) are found to impact significantly on the indoor air quality of a room, indicating the importance of human-centric approaches to technology design in this area, e.g., carbon dioxide (CO2) monitors (Rigger et al., 2015; Snow et al., 2019) and behavioral interventions (Ornaghi et al., 2018). The deployment of visual-based CO2 monitors has been credited with improving awareness of IAQ (Rigger et al., 2015; Snow et al., 2019) and prompting healthy ventilation behavior (Wargocki and Da Silva, 2015), however, CO2 monitors are unlikely to be fitted to every room in every home, school or office. In this paper, we identify the importance of “insourcing”(Schraefel et al., 2020) occupant awareness of poor IAQ and developing user competencies around becoming able to identify poor IAQ themselves through smell, feel (e.g., “stuffiness” or “closeness”) and opportunities to improve it through positive ventilation actions. This is in contrast to the current expectation that CO2 monitors alone will lead to improved awareness and behavioral modifications (Brogan, 2022). Inbodied Interaction design principles (Andres et al., 2019; Schraefel et al., 2020) present a useful lens to guide design approaches toward greater human awareness of IAQ and individual capability with respect to ventilating classrooms, and a novel application to the practice of room ventilation.
The paper reports findings from IAQ monitoring in 67 classrooms in Brisbane, Australia, using in-situ observations and opportunistic and formal interviews to identify human-related and building-related factors affecting classroom ventilation and potential pathways to remediation. Over half the classrooms monitored experienced one or more instances of poor ventilation throughout monitoring periods lasting 4–8 weeks. Based on the Inbodied Interaction philosophy (Andres et al., 2019; Schraefel et al., 2020), we distill a set of recommendations which may assist occupants themselves to take better control of their IAQ at a time when these actions are of exceptional importance in limiting the spread of COVID. The present paper makes three contributions: (1) Insight into the CO2 concentrations experienced in 67 Australian classrooms in Brisbane, Australia, during the COVID pandemic; (2) Insight into the specifically human-factors contributing to the ventilation—and underventilation—of the rooms monitored; and (3) Suggestions for how to foster greater awareness of ventilation among classroom occupants and translate awareness into more active, informed and healthier ventilation behaviors from occupants, using principles of Inbodied Interaction.
Background
Measuring indoor air quality using CO2 concentration
Indoor air quality (IAQ) refers to the condition of the air inside a building or closed space and its affect on human health and wellbeing, quantified by the presence of pollutants and impurities (Bb101, 2019). IAQ and its effect on human health has been the subject of research enquiry for decades (Etheridge, 2015). Historically, ventilation guidelines were originally designed for tobacco smoke and odor control. Following a move toward greater building energy efficiency, the provision of outside air when heating or air conditioning a space is costly and has been historically minimized (Etheridge, 2015). More recently, a realization of the health effects of underventilation and the utility of measuring CO2 as a proxy for ventilation has led to CO2-based guidelines for building ventilation.
Measuring CO2 levels provides a good estimate of the likely presence of bioeffluents, IAQ and ventilation in a room, given CO2 is exhaled in human breath and accumulates in occupied spaces with insufficient fresh air supply (Etheridge, 2015; Wargocki and Wyon, 2017). Guidelines for acceptable levels of CO2 in classrooms vary between countries and may be subject to change following the recent COVID pandemic. The US American Society of Heating, Refrigerating and Air-Conditioning Engineers (ASHRAE) guidelines for health and comfort (developed in 2004, revised in 2018) specifies a minimum average fresh air supply of 7 liters per person per second (l/p/s) in classrooms, equating to approximately 1,000 ppm or less average CO2 concentrations throughout a day (Beaton et al., 2004). The UK Building Bulletin 101 handbook for ventilation in classrooms (published 2018) states that where mechanical extraction is used, or when hybrid systems are operating in mechanical mode, then sufficient outdoor air should be provided during the occupied period to achieve a daily average CO2 concentration <1,000 ppm (Bb101, 2019). Where natural ventilation is used, or when hybrid systems are operating in natural mode, then sufficient outdoor air should be provided to achieve a daily average CO2 concentration < 1,500 ppm (Bb101, 2019). For new buildings in Australia, the National Construction Code recommends for building uses that include classrooms, that provision is made to enable CO2 concentrations to be maintained no higher than 850 ppm over a workday (National Construction Code, 2019). The WELL Building Standard and Fitwel standard take a more holistic approach to recommendations for IAQ, e.g., Fitwel's tailored scorecards and WELL's specification of 800 ppm CO2 concentration, but additionally factoring occupant density, operable windows etc. (Alfonsin et al., 2018). However, all these guidelines pre-date COVID, and during COVID, guidance has generally been to maintain classroom ventilation rates as high as practicable (NSW Government, 2021), due to the effects of poor ventilation on COVID transmission potential, which are discussed below in Section COVID and effect of poor IAQ on disease transmission. It is likely many guidelines will undergo revision based on findings made throughout the COVID pandemic.
Effect of poor IAQ on human performance
A substantial body of research tests the effects of elevated CO2 concentrations and ventilation rates on productivity and cognitive performance (Satish et al., 2012; Vehviläinen et al., 2016; Wargocki and Wyon, 2017; Zhang et al., 2017). At 2,500 ppm of CO2, a laboratory study found large and statistically significant reductions occurred in seven scales of decision-making performance (Satish et al., 2012). A study of multiple 4 h-long work meetings undertaken at average CO2 concentrations of 2,756 ± 1,100 ppm due to underventilation, found occupants experienced decreased vigilance with increased self-reported sleepiness (Vehviläinen et al., 2016). Following 255 min exposure to CO2 concentrations of 3,192 ± 343 ppm, occupants performance significantly worsened on speed of addition and attention-based tasks, while self-reporting of headache, sleepiness and difficulty concentrating increased (Zhang et al., 2017). The duration of exposure necessary for negative cognitive performance effects is imperfectly understood. Research comparing respirated CO2 during exposure to underventilation suggests that humans may be capable of physiologically self-regulating against the effects of poor ventilation for up to 2 h, and that perceivable symptoms for occupants may onset or increase after this time (Vehviläinen et al., 2016). Critically, however findings suggest temporary cognitive performance effects can occur prior to occupants becoming aware of the poor air quality. Occupants exposed to average CO2 concentrations above 1,800 ppm (due to poor ventilation), reported no “sick building syndrome” (Redlich et al., 1997) symptoms (e.g., itchy eyes, headache, fatigue), despite significant negative impacts on decision making parameters (Maddalena et al., 2015). This paper highlights that humans may be unlikely to identify poor IAQ until it is at a level at which aspects performance is affected.
COVID and effect of poor IAQ on disease transmission
The COVID pandemic has thrust a spotlight on the relationship between indoor ventilation and disease transmission, where there is now exceptionally strong evidence that the pathogen responsible for COVID infection is transmitted primarily via respirated particles suspended in air (Morawska and Milton, 2020; Buonanno et al., 2022). Based on scientific evidence in this area, OzSAGE, an organization of scientists providing independent advice to the Australian government, advises that:
CO2 reading below 800 ppm: “Indicates a low risk of infection”.
CO2 reading between 800 and 1,500 ppm: “Indicates a moderate relative risk of infection. Improvements should be made where practicable to increase the provision of fresh air into the indoor space”.
CO2 reading above 1,500 ppm: “Indicates a high relative risk of infection. Immediate improvements must be made to increase the provision of fresh air into the indoor space or air filters must be operational. If this is not possible, the space should be evacuated” (Crabb, 2021, p. 6).
These recommendations indicate that current guidelines for CO2 in workplaces and classrooms may be revised in the future, in the context of public health and occupational health and safety.
The role of ventilation in reducing COVID transmission was recognized early in the pandemic (Morawska and Milton, 2020), yet responses varied substantially by region (Fitzpatrick, 2021). The term “hygiene theater” (Thompson, 2020) was coined to highlight the prevalence of “feel-good” actions in pandemic responses such as hand sanitizing continuing to feature prominently, despite relatively limited efficacy versus ventilation improvements (Thompson, 2020). In Queensland, a state characterized by an elimination strategy (pre-vaccine) and conservative approach to lockdowns and border re-openings, recorder far lower cases than much of Europe and the US throughout the pandemic (Jansen et al., 2021). For context, Queensland recorded only 1,246 cases during the beginning of the pandemic to the end of December 2020 (Queensland Government, 2020), despite a population of over five million. Lockdowns in Queensland were also fewer and shorter than those experienced in Sydney or Melbourne. Cumulatively, these factors may have led to a reduced urgency in implementing ventilation improvements and potentially lower awareness of the relationship between ventilation and COVID transmission. It should also be noted that COVID-19 transmission was not a central research question of the study, and that Greater Brisbane had very low numbers of COVID cases during the study period.
Ventilation in classrooms
Underventilation is a common and enduring problem in classrooms, relative to other building uses. Fisk (2017) collated evidence from 27 published studies of classroom ventilation spanning the 1990's to 2010's, each of which had monitored CO2 from at least 20 classrooms. Results indicate underventilation issues reported in many of the studies, with widespread time-averaged classrooms CO2 concentrations greater than 2,000 ppm and “compelling evidence of an association of increased student performance…with increased ventilation rates” (Fisk, 2017, p. 1048). Findings obtained from classrooms immediately following the 2020–2021 COVID lockdowns in Europe report lower average CO2 concentrations than the Fisk et al. meta-review (Fisk, 2017), detail how many schools struggled to maintain classrooms at the required 700 ppm guideline (Di Gilio et al., 2021). All 11 classrooms experienced guidelines exceedances (> 700 ppm) between January and February 2021 with two classrooms recording concentrations of 3,947 and 2,591 ppm (Di Gilio et al., 2021). A similar study in Central Spain found only 5 of 19 classrooms exceeded guidelines, but note the warm time of year (Sept–Oct 2021) meant windows were more likely to remain open than in winter (Villanueva et al., 2021). Despite the widespread CO2 guideline exceedances in classrooms and an abundance of literature concerning the effect of engineering factors such as building design, orientation and HVAC system performance on ventilation (Howieson et al., 2013; Wargocki and Wyon, 2013; Etheridge, 2015), far fewer studies focus on the ways in which humans themselves affect ventilation in buildings how technology can best support user actions to improve ventilation. Ventilation problems when recorded, are often seen as problems requiring an engineering solution rather than as potential avenues for behavioral intervention. In contrast, this paper suggests there is a case for supporting students and staff to insource (i.e., learn to identify and remedy) poor IAQ themselves and become more active participants in solutions to underventilation problems.
Human effects and behavioral interventions
Window opening and closing behavior in buildings is often in response to environmental factors (wind, rain, noise, etc.) as well as personal preferences (Ornaghi et al., 2018). Adaptive Comfort theory details how users modify their environment to realize thermal comfort, and comfort preferences vary according to acclimatization and cultural factors (Humphreys and Fergus Nicol, 2018). Ventilation behavior varies between countries and climatic regions and studies of ventilation and comfort benefit from a regional focus (Chen and Chang, 2012). In terms of the personal and social factors affecting ventilation, a small study found those seated next to a window in UK offices were likely to “own” that window and operate it to their personal preference, while those seated away from windows may have apprehensions to ask if a window can be opened when the air quality is felt to be poor (Snow et al., 2016). Research finds instances of under-ventilation caused by occupants unknowingly blocking external air vents with personal items (Howieson et al., 2013) or switching off HVAC systems to reduce noise in classrooms (Sanguinetti et al., 2022). A pre-pandemic study from California found many teachers were uninformed in respect of providing adequate ventilation and that perceived comfort was generally higher in poorly ventilated classrooms relative to well ventilated classrooms, potentially on account of less thermal variation or drafts (Sanguinetti et al., 2022). These findings confirm previous findings that occupants cannot reliably detect poor IAQ (Maddalena et al., 2015), making a strong case for technical systems to support awareness.
Visual displays of CO2 concentration offer promise for improving occupant awareness of ventilation and enable occupants themselves to positively affect their classroom's IAQ. A 2015 trial of physical CO2 feedback displays, when combined with a teaching package was successful in increasing ventilation behavior in classrooms (Wargocki and Da Silva, 2015). Ambient CO2 representations have successfully engaged students in universities (Rigger et al., 2015), and classrooms (McLaughlin et al., 2021), as well as occupants of offices (Snow et al., 2019) and homes (Kim et al., 2013; Fang et al., 2016). During COVID, several studies tested the effect of CO2 monitoring alongside ventilation protocols. Following a period of baseline monitoring and observation, Di Gilio et al. (2021) implemented an intervention study consisting of a ventilation protocol to be followed by teachers (e.g., when to open windows/doors), complemented with continuous real-time CO2 monitoring. The study found significant reductions following the intervention. Similar findings were recorded from Spain where strict adherence to a ventilation protocol resulted in lower CO2 concentrations (Villanueva et al., 2021). Yet the durability of these behavior changes is largely un-tested. InAir, a home-based IAQ dashboard, found it is possible for personal informatics on IAQ to affect users' habits (Kim et al., 2013), but adherence to CO2 monitoring over the longer term remains improperly understood. The provision of over 300,000 CO2 monitors to UK education institutions (Press Release, 2021) epitomizes an expectation that monitors alone will seamlessly translate to greater awareness of ventilation and prompt healthier ventilation actions. Yet engagement with personal informatics decreases naturally over time (Hargreaves et al., 2013) and it is accepted that support beyond the feedback itself is necessary to habitualize new behaviors (Hedin et al., 2019). Inbodied Interaction represents an approach toward this goal. Further, experience from overseas highlights how ventilation practices can successfully become habitualized. Lüften (airing a room) and stoßlüften (shock-airing) refers to the common German practices of periodically opening all windows—in all seasons—to completely air out a room (Connolly, 2020). Lüften is not only culturally habitualized, but legally binding; many German rental tenancy agreements require the occupant to practice regular airing as part of their obligation as a tenant (DMB, 2019). COVID has served to increase vigilance in enacting these practices (Connolly, 2020).
Design for inbodied interaction
Inbodied Interaction is a design movement which aims to better align technology design for health with humans' physiological (physical, chemical, neurological) systems (Andres et al., 2019). It focuses on technology designed toward building self-knowledge in improving health, providing an alternative to outsourcing the “design, management and motivation” of exercise to a third party, such as a personal trainer or fitness app (Schraefel et al., 2020). Inbodied Interaction holds that there is value in helping users to develop a greater self-awareness of their own bodies and surroundings in order to “self-tune” one's health and improve one's own health outcomes (Schraefel et al., 2020). The philosophy focuses around two core concepts; the Inbodied 5 and Circumbodied 4 (I5/C4) (Andres et al., 2019). The Inbodied 5 (I5) concept includes Move (i.e., exercise), Eat, Engage (e.g., social interaction), Cogitate (e.g., brain engagement, reflection) and Sleep, each of which are important to quality of life and capacity for human performance (Schraefel, 2019). The Circumbodied 4 (C4) include: Gravity, Air, Light, and Microbiome, which interact with I5 elements, i.e., the effect of light on humans' circadian rhythm, the effect of gravity on exercise and air (i.e., IAQ) on our capacity to cogitate and engage, given poor IAQ reduces capacity to concentrate (Schraefel, 2019; Schraefel et al., 2020). Central to the Inbodied Interaction philosophy is a focus on designing for greater self-awareness and self-help. Inbodied Interaction focuses on designing technology which fosters a greater awareness of self and engagement in the complexity of interactions between our physiology and our environment (Andres et al., 2019; Schraefel, 2019; Schraefel et al., 2020), rather than focusing on the optimization of singular metrics, as is common with personal informatics technology (Li et al., 2011).
In this paper, we use the I5/C4 framework coupled with findings from our CO2 monitoring of 67 classrooms and observations made during deployment to develop designs for how to better enable users to identify and remedy instances of poor IAQ in classrooms. We focus on the intersection between people's sphere of influence (e.g., opening windows, doors) with physical building factors (e.g., ventilation type, window placement). This research is important, as the type of ventilation provided in classrooms (e.g., natural, mixed mode or mechanical ventilation) determines the most appropriate action to assist in ventilation, yet ventilation type often varies within schools (Fisk, 2017) and visual CO2 monitoring is unlikely to become standardized across all classrooms in all schools. Accordingly, it is important to equip occupants themselves with a greater ability to identify potential ventilation issues in classrooms and capability to enact situation-specific ventilation.
Method
Indoor CO2 monitoring was carried out as part of the Study Fresh program. Study Fresh is a University of Queensland initiative, seeking to engage schools and school children with IAQ through (1) free-of-charge monitoring established in classrooms of interest at participating schools and/or (2) digital technologies workshops where students learn to build and program a simple IAQ sensor. This paper pertains specifically to the method and results of the classroom CO2 monitoring component of Study Fresh.
Sampling of classrooms
Monitoring was established in classrooms within 13 schools and one early learning center. Valid data was obtained from a total of 67 classrooms. The 13 schools included state schools (government funded), catholic education schools and independent schools. Of the total 67 classrooms monitored with valid data, 30 were primary school classrooms, including the 5 kindergarten (4–5 years old) and “pre-kindergarten” (3–4-years old) rooms, while 37 were secondary school classrooms. Participating schools were recruited through the study's website, by word of mouth between teachers, and from local events such as a university stall at a Sustainability and Science Expo event. All participating schools were located in the Greater Brisbane Area. None of the classrooms had air purifiers in operation at the time of monitoring.
Study Fresh was a “citizen science” project (Bonney et al., 2016), aiming to involve ordinary citizens in scientific discovery and increase understanding of science. The study was designed as a tool to assist schools in increasing awareness of ventilation in classrooms and providing a means of measuring CO2 (hence estimating ventilation adequacy). Accordingly, schools were self-selecting and the choice of classrooms to monitor was made by the schools. We suggested that each school measure rooms of interest to them, whether good or bad. Generally, schools tended to choose a mixture of classrooms that their teachers anecdotally reported to be stuffy or hot, and, for comparison, others which were not considered a problem. Because of this, we do not claim the sample of classrooms is representative of all classrooms in the Brisbane region, nor of every type of classroom ventilation system installed in each school. We do, however, suggest that the sample provides a useful overview of the types of ventilation issues which may be present in Brisbane schools and that the sample is reflective of the fact that many schools have buildings of different ages and construction types and accordingly, that the same ventilation strategy can seldom be sensibly applied across all classrooms in a given school.
Logger type and placement
Custom-built loggers were used for the Study Fresh program, incorporating CO2, temperature and relative humidity sensors. The loggers were designed to be readable by room occupants, but the purpose of the logging was to gather IAQ data on classrooms and not a behavioral intervention. The loggers had a small screen displaying the live values, as well as red/yellow/green LED lights which were programmed to change color according to the CO2 concentration: green = less than 1,000 ppm, yellow = 1,000 to 1,800 and red over 1,800 ppm (Figure 1). Justification for these LED color thresholds are outlined below.
Figure 1
The loggers measured CO2, temperature, and relative humidity readings once every 10 s and recorded the average of six measurements every minute to a local SD card. In this paper, we focus on the CO2 readings. The choice to record data locally (rather than send readings over WiFi) was due to the strict network security protocols common to many school IT infrastructures. It was therefore more convenient and reliable for us to record data to a local SD card which was then extracted after the monitoring period. In order to minimize cost and complexity, the loggers were designed without a Real Time Clock (RTC). As a consequence, if loggers were unplugged and re-plugged or lost power, the measurement time-stamp becomes indicative rather than precise. A total of 42 out of 67 loggers deployed restarted at least one or more times during the monitoring period, caused by a brief loss of communications causing restart, a momentary loss of power, or students or teachers unplugging monitors temporarily to charge phones. In instances where this occurred, the data timestamps were retroactively and manually corrected based on (1) references to previous timestamps, communications with schools regarding the approximate time the logger was switched off and references to the rise and fall of temperature and CO2 readings indicating day and night. For these loggers, the timing is correct to approximately 1 h, where it is still possible to estimate the timing of CO2 events based on the approximate timestamps, and knowledge that no classrooms were known to be used outside of school hours (e.g., night school or other activities). Cognizant of these limitations however, the paper focuses primarily on consecutive minutes above a threshold, rather than attempting to infer exactly what time given peak or threshold was reached.
CO2 sensor
CO2 was logged using a Wisen MH-Z19B non-dispersive infra-red (NDIR) CO2 sensor1 This sensor is widely used for CO2 monitoring, well-supported in software and code, and incorporates automatic baseline calibration (ABC). ABC takes the lowest value recorded over a pre-set period, in our case, 72 h, and calls this reading 400 ppm (the average outdoor sea-level CO2 concentration). The setting of the ABC to 72 h is based on assumptions that (a) classrooms would not be occupied at night, and therefore, (b) classrooms would return to CO2 concentrations reflective of those outdoors at least once every 72 h. ABC calibration overcomes sensor drift and improves the accuracy of instrument over longer deployments relative to those without ABC. Accuracy of the MH-Z19B is reported as 50 ppm ± 5% of reading value. A Raspberry Pi was used to run the CO2 and the DHT22 temperature/relative humidity sensor2, with a Python script used to log values every minute to a CSV, with automatic logger restart enabled if the logger was unplugged and re-plugged for any reason. The IAQ logger implemented a Python program executed by a Raspberry Pi Zero W connected to a Wisen MH-Z19B CO2 and DHT22 temperature and relative humidity sensor. The device recorded an average of six CO2, temperature, and humidity measurements every minute into a CSV file stored on the Raspberry Pi SD card. In cases where the device was inadvertently powered off during the monitoring period, it was programmed to automatically restart and continue monitoring once power was restored.
Sensor placement
One Study Fresh IAQ logger was deployed in each classroom. Sensor placement was informed by teachers' preferences, room constraints and the ISO16000-26:2012- Indoor Air Quality standard, 2012 being the year of last review (International Standards Organisation, 2012). In line with this standard, we ensured that all loggers were out of the direct line of breath of any student, located at least 1.5 m away from any student's seat and positioned between 0.75 and 1.8 m above the floor in the “breathing zone” of the occupants (International Standards Organisation, 2012). In four instances this was not possible, and the logger was placed higher than 1.8 m, on the top of a cupboard or near a projector.
Teachers decided whether the logger in each classroom was visible to occupants. Some teachers wanted to be able to see the color of the lights, while many others felt it important to hide from students, so they would not interfere with the devices. Hence in most of deployments, the logger was not in fact visible to occupants without close inspection and there was anecdotally little or no influence of the sensors on ventilation behavior or involvement of the students with the sensors during the monitoring periods. Hence, the results instead provide a useful “baseline” or “pre-intervention” readings from the monitored classrooms, with minimal potential of a Hawthorne effect (i.e., behavior modification due to occupants' awareness of their being observed; McCambridge et al., 2014).
Deployment timeframes
The suggested deployment timeframe for Study Fresh loggers was 5–6 weeks (half an Australian school term). In practice, loggers were in place in classrooms between 4 and 8 weeks. The variation in deployment lengths reflects the need to work around term dates, individual schools' requests and two COVID-19 lockdowns (29 June−02 July 2021 and 31 July−08 August 2021) which extended deployments in these instances. For the purpose of this study, “Winter” is defined as 01 May to 31 August and “Summer” is defined as any other time of year. This reflects Brisbane's subtropical climate where the coldest month (July) averages 10–22°C3 and May-August are the only months likely to be heating-dominant. All other months are neutral to cooling dominant, where even April and September average 17–27°C and 14–26°C, respectively, and January (the warmest month) averages lows of 22°C and highs of 30°C.4 The timing of the deployments was evenly spread, with 31 classrooms monitored during “winter” and 36 during “summer”.
Ventilation observations
Each classroom in which a Study Fresh IAQ logger was deployed was photographed by researchers and observations made regarding the nature of ventilation in the room.
Analysis and justification
Data
The 1-min time series CO2 data were downloaded from all Study Fresh Loggers following pick-up from each school. Data was processed using Python and analyzed using Python and Excel to determine the duration of continuous events with CO2 levels over 1,000, over 1,800 and over 2,500 ppm. The focus on continuous exceedances rather than maximum values was due to the 5,000 ppm upper limit of the sensor itself.
Justification of CO2 analysis thresholds
The thresholds of interest in the analysis were chosen based on scientific evidence of impact on learning performance.
CO2concentrations > 1,000 ppm: American ASHRAE guidelines recommend ventilation is provided such that average CO2 concentrations in classrooms is maintained below 1,000 ppm (Beaton et al., 2004). The Australian National Construction Code (NCC) recommends a lower average of 850 ppm throughout a day (National Construction Code, 2019).
CO2concentrations > 1,800: Concentrations above 1,800 ppm, when achieved through underventilation, can temporarily affect cognitive performance parameters after extended exposure without occupants being aware of the poor air quality of the classroom (Maddalena et al., 2015). One thousand and eight hundred parts per million is also well in exceedance of the OzSAGE advice that “CO2reading above 1,500 ppm indicates a high risk of infection” (Crabb, 2021).
CO2concentrations > 2,500 ppm: When achieved through underventilation, concentrations above 2,500 ppm are correlated to large and statistically significant decrements in multiple decision-making metrics (Satish et al., 2012). Occupants may experience symptoms such as headaches, itchy eyes and difficulty concentrating. Two thousand and five hundred parts per million is higher than the UK guideline for 20-minute maximum CO2 concentration indoors (Bb101, 2019) and far in exceedance of the OzSAGE 1,500 ppm guideline (mentioned above).
Ventilation type
All rooms were photographed to document the type of ventilation, which were broken down into (1) natural ventilation (2) mechanical ventilation or (3) mixed mode ventilation, detailed below. Of the 67 classrooms with valid data obtained, 28 were naturally ventilated, 8 were mechanically ventilated and 31 were mixed mode. Ventilation type is detailed in Table 1 below.
Table 1
| # | Ventilation type | Indicative photograph |
|---|---|---|
| 1 | Natural ventilation: Natural ventilation implies a room is ventilated by opening windows and doors only. Twenty-eight of the sixty-seven classrooms were naturally ventilated. | |
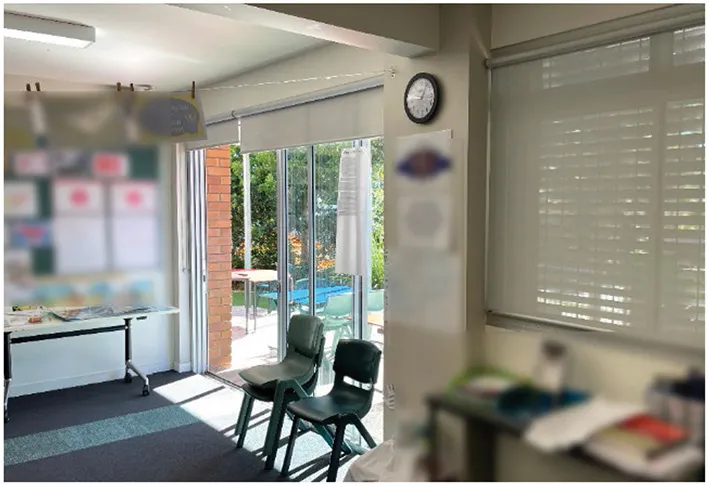 In this example pictured, the sliding door complements openable external windows another side of the classroom, allowing for cross ventilation. There is a split system air conditioner fitted but no mechanical ventilation, HVAC or air change unit fitted. In naturally ventilated spaces, occupants themselves are the only mechanisms to ensure the room is ventilated. | ||
| 2 | Mechanical ventilation: In mechanically ventilated classrooms, all ventilation is provided through HVAC. Occupants can open doors, but have no other control over any aspect of room ventilation (including windows). Eight of the sixty-seven classrooms were mechanically ventilated. | |
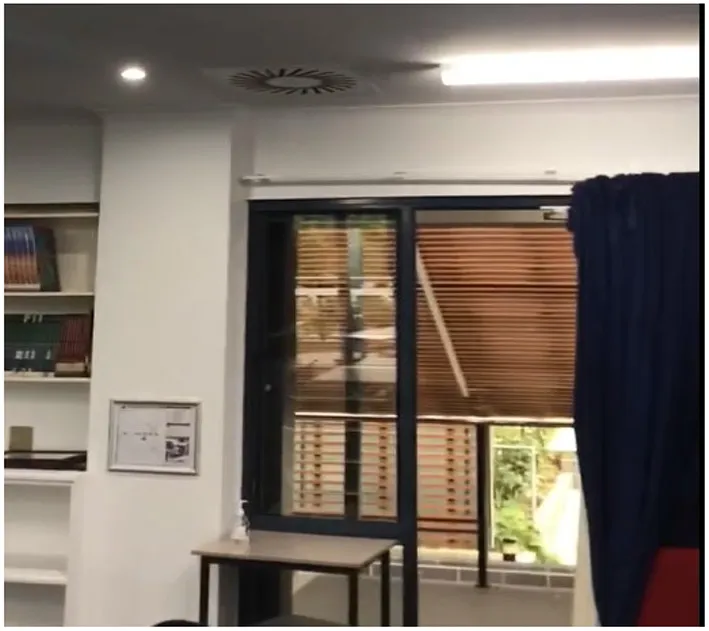 In this classroom pictured, ventilation and air conditioning are provided exclusively via a computerized Building Management System (BMS) controlling the HVAC. Ventilation and extract supplied through ceiling-mounted vents. | ||
| 3 | Mixed Mode: indicates a classroom is equally capable of natural ventilation (e.g., occupants opening windows and doors), as well as mechanical ventilation, in this case provided by a balanced inlet/extract system such as a roof-mounted air conditioning, where fresh air supply and extraction are provided during air conditioning operation. Thirty-first of the sixty-seven classrooms had mixed mode ventilation. In three of the 67 classrooms, mixed mode incorporated smart technology, e.g., window actuators triggered from CO2 sensors, or air conditioning automatically turned off if window sensors detected open windows. | |
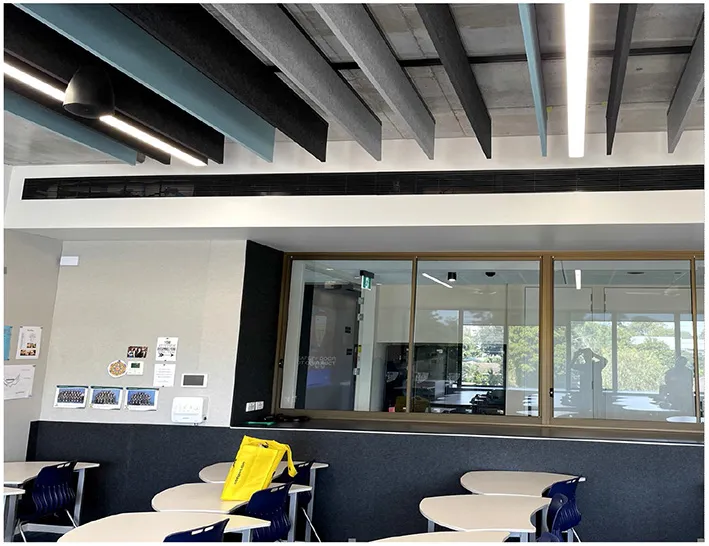 Depicted is a Mixed Mode ventilated classroom, with openable windows to a corridor, openable windows to the exterior of the building visible through reflection in glass). Thermostat controls for the HVAC unit are visible to the left of shot. Inlet and extraction ducts are provided out of shot on the ceiling. |
Ventilation type descriptions.
Results
IAQ in classrooms were measured against the following thresholds, which are justified above in Section Analysis and justification. Low ventilation affected an exceptional number of the classrooms monitored. Valid data as achieved in all but one of the classrooms monitored, leaving 67 classrooms with valid data which was analyzed. Figures 2A,B below show the number of classrooms which exceeded the pre-determined CO2 thresholds, including the duration of the longest exceedance of each threshold (Figure 2) and the number of exceedances of each threshold (Figure 2B).
Figure 2
Greater than 1,000 ppm
Almost all classrooms (64 of the 67) had one or more instances of CO2 concentrations exceeding 1,000 ppm. 33 of these 64 classrooms had more than 50 separate events of CO2 exceeding 1,000 ppm (Figure 2B). 35 classrooms remained above 1,000 ppm for 3 h (180 consecutive minutes) or longer on one or more occasion during the monitoring period (Figure 2A). The longest duration for which a classroom was continuously above 1,000 ppm was 1,265 min, or 21 h. Ventilation in this particular classroom is explored in detail in Section Focus on worst performing rooms below.
Greater than 1,800 ppm
Forty-two of the sixty-seven classrooms recorded one or more events with concentrations above 1,800 ppm (noting that each 1,800 ppm exceedance is also a 1,000 ppm exceedance). Ten classrooms recorded more than 50 separate events of 1,800 ppm or more (Figure 2B). Sixteen classrooms recorded one or more > 1,800 ppm event that lasted 180 consecutive minutes or longer (Figure 2A). The longest continuous exceedance of 1,800 ppm was 1,083 min or 18 h. This was recorded in the same classroom that recorded the longest >1,000 ppm event (noted above).
Greater than 2,500 ppm
Twenty-seven of the sixty-seven classrooms had one or more events >2,500 ppm (noting that each > 2,500 ppm event is also a > 1,800 and a > 1,000 ppm event). Seven of the 67 classrooms recorded continuous CO2 concentrations above 2,500 ppm for 180 min or longer. Five classrooms had more than 50 separate exceedances of 2,500 ppm. The longest continuous exceedance was 717 min (almost 12 h). The exceptional length of this event appears due to the high air tightness of the room meaning CO2 took several hours to decay after the likely end of the room's occupation for that day. Five of the 67 classrooms recorded more than 50 separate exceedances of > 2,500 ppm.
Figures 2A,B below shows the number of classrooms whose longest continuous run of readings over each CO2 threshold (top row) fall within different time durations (left-hand column). For example, there were 20 classrooms whose longest continuous CO2 event above 1,000 ppm was between 61 and 180 min. Concerningly, seven of the classrooms experienced one or more event where the CO2 remained above 2,500 ppm for 180 consecutive minutes or longer (Figure 2A).
Figure 2B shows the number of unique exceedance events of each CO2 threshold and how many classrooms experienced how many exceedance events. An exceedance event is defined as one or more consecutive minutes with readings above the threshold value for that column. For example, 33 classrooms experienced more than 50 separate instances of the CO2 exceeding 1,000 ppm (Figure 2B). While 40 classrooms had no readings above 2,500 ppm, concerningly, five classrooms had more than 50 separate 2,500 ppm exceedance event (Figure 2B).
Figures 2A,B show that many of the classrooms monitored experienced either prolonged, or frequent exceedances of CO2 levels which are considered sub-optimal both for containing the spread of COVID-19 and retaining occupant concentration.
Figure 3 below shows the spread of CO2 exposure events, highlighting outliers. It can be seen that while classrooms in the study averaged 11 separate exceedances of 2,500 ppm over the monitoring timeframe, one classroom experienced 115 separate exceedances of CO2.
Figure 3
Figures 4, 5 (below) show classrooms in terms of the length in minutes (y-axis) of their longest continual CO2 exceedance of each of the two thresholds (>1,800 and >2,500 ppm), coding classrooms according to their ventilation type (x-axis), where the code indicates 1= natural, 2= mechanical, 3= mixed mode ventilation). This coding method groups together classrooms with the same ventilation type, while the separation of classrooms on the scatterplot enables visibility of all classrooms on the graphs without bunching. Color denotes timing of deployment; blue means winter deployment (01 May−31 August), yellow denotes summer deployment (all other times of the year). Shape indicates primary or secondary classroom, where triangle indicates primary school classroom and circle indicates secondary school classroom (refer Figures 4, 5). It should be noted that there were more secondary classrooms monitored (37) than primary classrooms (30) and that only eight of the classrooms monitored were mechanically ventilated.
Figure 4
Figure 5
Figures 4, 5 show that mixed mode classrooms where monitoring was undertaken during winter recorded the highest number of events of both >1,800 and >2,500 ppm (where an event is classified as 2 or more consecutive minutes above the given threshold). Further, the classrooms with the greatest number of exceedance events >1,800 or >2,500 ppm, were recorded in predominantly secondary school classrooms and when monitoring was conducted over the winter period (Figure 5). Mixed mode classrooms accounted for those with the highest number of exceedances. We discuss possible reasons for this and some of the drivers of these underventilation events below.
Possible reasons for underventilation
Given the opportunistic nature of the monitoring and lack of continuous observation of occupant actions, it is not possible to definitely state the reasons why each instance of underventilation occurred. Yet, our observations, photographs and anecdotal conversations with teachers during each of the 67 logger deployments provided useful qualitative insight as to possible reasons.
Air conditioner (AC) retrofitting
All of the 67 classrooms visited had AC fitted. Almost all the AC systems retrofitted into previously naturally ventilated classrooms were split systems, which do not introduce fresh air or extract stale air. Twenty-one of the forty-one classrooms with one or more >1,800 ≤2,500 ppm exceedance events recorded during the monitoring period were naturally ventilated. Two of these twenty-one classrooms had exhaust fans which could be switched on manually on a switch outside the classroom. Hence, 19 of the classrooms had no fresh air supply aside from that achieved by opening windows. Anecdotally, teachers spoke of keeping windows closed when the AC was operating in the interests of sustainability and energy efficiency. These actions suggest occupants may not be cognizant of the need to ventilate in rooms with split system air conditioners, or aware that these systems recycle existing air and do not supply fresh air. The lack of additional mechanical ventilation to supply fresh air combined with a lack of knowledge or consideration of ventilation, and an understandable motivation for energy efficiency, appears to have contributed to the frequent underventilation events recorded. These findings highlight a lack of awareness or consideration which is likely to be replicated throughout classrooms in Australia, where consideration of ventilation has previously not been commonplace. A greater awareness of the need to balance adequate ventilation with sensible energy efficiency is required, where improved awareness (e.g., IAQ monitoring) may be a useful first step.
Operation of mixed mode buildings
Figures 4, 5 (above) shows that classrooms with the highest number of >1,800 and >2,500 ppm exceedances were of mixed mode ventilation type and the events occurred during cooler month deployments. These mixed mode classrooms had occupant-operable air conditioning with forced extraction which operated when the AC was switched on, but not when it was switched off. We suspect that the relatively young age of the buildings, with relatively good insulation and air tightness, coupled with Brisbane's mild subtropical climate (maximum and minimum temperature average 22.1°C to 10.3–°C in the coolest month5), means that these classrooms do not require the use of AC for heating or cooling. Therefore, these rooms operated with all windows and doors closed, but no AC, and hence no air supply and extraction.
Human factors
The anecdotal conversations with teachers and observations made during the deployment provided insight into the number of human factors (e.g., safety, ergonomics) which can affect ventilation in classrooms. Four of the classrooms with >1,800 ppm exceedances, for example, were found to have windows forced shut, through either bolts or screws. This solution was variously justified in terms of energy efficiency (i.e., to prevent children opening windows while the AC was in operation) and for safety concerns, with one instance where the teacher was not sure why they were unopenable. However, other factors unrelated to the building design may have compromised the ability of the rooms to ventilate, as in the four examples of classrooms shown in Figure 6.
(a) Mechanical exhaust fans have been fitted to older naturally ventilated classrooms which had split-system air conditioning retrofitted and limited cross-ventilation potential. The power switches (white boxes pictured in Figure 6A) to operate these fans were located at least 2.4 m from the ground and out of reach for anyone less than approximately 178 cm tall. The exhausts were not operating at the time of the photograph. In this situation, the classroom may be capable of ventilating adequately, but users' ability to switch on the exhaust fan (assuming they identify this as an option to improve ventilation in the first place) is compromised by the height of the switch.
(b) A screw has been driven to stop a double-hung window opening upwards. This was described as a safety measure. The classroom was located on the second floor and the windows had been disabled in this way to eliminate the risk of students falling out through misadventure. The result is a classroom, designed for cross-ventilation, which was operating with single sided ventilation only, leading to sustained elevated CO2 concentrations.
(c) Door and window opening up to a busy corridor. This classroom was naturally ventilated with cross ventilation potential. Yet, one side opened to a corridor with connection to the outdoors, hence fresh air flow, but which was described as frequently noisy as students moved between classes. As a result, these corridor-facing windows were almost never opened, compromising cross ventilation.
(d) Bolts fitted to disable horizontally sliding windows. This was a first-floor classroom with fly-screen mesh fitted to the outside of the window. The teacher described the bolts as being used to stop students opening the windows when the (retrofitted split system) air conditioners were running. As a result of this, an important source of fresh air was compromised as split systems do not themselves supply fresh air.
Figure 6
Facilities management staff featured in anecdotes from three teachers, representing three schools and 16 of classrooms monitored. Facilities management often emerged in conversations regarding hot, cold, or stuffy classrooms, e.g., “I've spoken to facilities management about this” (referring to the inability to get breezes into the classroom pictured in Figure 6B). In this way it can be seen that facilities management staff were frequently seen as responsible for the comfort (or ability to make comfort) in classrooms. It appeared that the trust in facilities management to address concerns or even the approachability of the contact person played a role in ventilation, where—anecdotally—if facilities staff were considered unapproachable or unresponsive, teachers may be less inclined to raise concerns and simply put up with undesirable conditions.
Focus on worst performing rooms
Here we provide more specific information on the two worst performing rooms including detailed analysis of CO2 concentrations. To preserve the anonymity of monitored classrooms, wide angle photographs are omitted in favor of close-up photos of specific features.
Classroom A
Is a secondary classroom located in a building < 5 years old. The room seats approximately 20–25 students, but occupancy was reported to vary according to which class was used. It is supplied with mixed mode ventilation with the option of natural ventilation through large double-sliding doors on one face, with a small (approximately 600 × 1,200 mm) louver window on an adjacent wall. Mechanical inlet and extract rely on operation of the HVAC system, which is occupant controlled using a panel on the wall (Figure 7). Logging took place between May and June (winter).
Figure 7
Classroom A recorded the longest consecutive period above 2,500 ppm (717 min) and the longest consecutive period >1,800 (1,083 min). In total, there were 32 separate exceedances of >2,500 ppm throughout the 7-week deployment. Figure 8 shows CO2 fluctuations over a 2-week period, while Figure 9 shows the maximum and minimum CO2 concentrations observed each day of the deployment.
Figure 8
Figure 9
Several observations can be made. As a secondary school classroom, occupancy varies daily and weekly, where primary classrooms might be expected to exhibit more uniform peaks. Being a new building, it is well-sealed and the air tightness of the room is highlighted by the exceptionally fast rate at which CO2 climbs when occupied and the slow rate at which it falls (Figure 8). For example, on the right-hand side graph, the period from the final peak of a day to the lowest recorded value is well over 6 hours, indicative that (when closed up), the air is replaced in the room at an exceptionally slow rate. On days of very high occupation, e.g., Friday 4/6 and Wednesday 9/6, after reaching highs of over 4,000 ppm, the room does not completely ventilate before classes begin the next morning (Figure 8). Note the timings of the peaks in Figures 8, 9 are approximate only, owing to timing on certain loggers being manually corrected where loggers were stopped or lost power.
Throughout the monitoring period, the maximum CO2 values were found to regularly exceed 3,000 ppm, levels at which occupants would be expected to experience sick building syndrome symptoms including headache, difficulty concentrating, itchy eyes and sore throat. The minimum CO2 concentrations recorded indicate several occasions throughout the recording period where the room appears not to ventilate completely between end-of-class on certain days and the beginning of classes the following day. The variability in CO2 concentrations visible in Figure 8 may reflect (a) variation in the utilization of the room, which being a secondary classroom, varies according to school timetabling, (b) ventilation events, where it appears possible the HVAC system was operated during Tuesday 01/06/21 but not on other days and (c) anecdotal reports from a teacher that the room was occasionally used for workshops or other half-day or all-day events which may contribute to the highest peaks. Minor decreases following smaller peaks may be either empty periods and/or ventilation events.
Potential causes
We expect the air tightness and good thermal performance of the room, coupled with Brisbane's mild climate (averages listed above) meant that the classroom was never cool enough or warm enough for the occupants to choose to run the HVAC for heating or cooling. Yet equally, being winter, it was still cool enough to keep windows and doors closed. There was no indication of any operational issues with the HVAC, however, the air inlet and extract system rely on HVAC operation (whether heating or cooling). This factors resulted in a classroom with high air tightness being operated with no air inlet or extract. Better information may be required in this instance to alert teachers of the need to either operate the HVAC system or keep the sliding door and windows open.
Classroom B
Is a secondary school classroom located in an older brick building. It is naturally ventilated with horizontally opposed windows; however, one side are smaller windows opening to a corridor. The larger windows facing the outside of the building were bolted shut at the time of the visit, which was described as a measure to stop students opening the windows when the air conditioners were operational. Two reverse cycle air conditioners were present, with a small exhaust fan proximal to one of these units, however, the exhaust did not start automatically with the air conditioners at the time of the deployment and an additional switch for the extractor fan could not be located (Figure 10). The room seats approximately 25 students.
Figure 10
Classroom B experienced the second-longest continuous exceedance of 2,500 ppm behind Classroom A, at 448 min.
Visible from Figure 11 are the exceptionally high CO2 peaks, reaching up to almost 5,000 ppm, the measurement limit of the sensor. The left-hand side graph shows a pattern of the room not completely ventilating in time for classes the following day, leading to minimum values of 800 ppm or higher. The variability of maximum peaks in both graphs in Figure 11 is expected to result from school timetabling resulting in less utilization of the classroom on certain days. The right-hand side graph shows that the room is capable of being ventilated rapidly, e.g., following Monday 7th June and Friday 11th June. It is possible this may be due to the extractor fan being switched on manually following class, or a window (on the side that is not bolted), being opened. The former appears more realistic given the relative speed of CO2 decreases following classes on these dates. The weather during the (winter) deployment averaged 11.7–22.3°C.
Figure 11
Figure 12 shows the exceptionally high CO2 values for Classroom B, where 4,000 ppm was reached on 11 days of the five school weeks monitored. Similar to Classroom A, there are at least four instances in which the classroom does not ventilate completely overnight.
Figure 12
Potential causes
Unlike Classroom A, which was physically capable of adequate ventilation, physical issues prevent Classroom B being properly ventilated. Namely, the bolts on the windows impede natural ventilation, while the extraction fan not operating when the air conditioning is switched on (and lack of signage alerting occupants to the need to manually switch it on) is clearly an impediment to its use, meaning it is likely the room is simply not being ventilated. These issues likely explain the consistency in the readings, relative to the higher daily variability of CO2 readings in Classroom A. Solutions for Classroom B may be both engineering and behavioral, e.g., re-wiring of the extraction fan to run during school hours or switch on with the air conditioner, and either removal of bolts on windows, or signage alerting occupants to run the air conditioner at all times when a class is being held.
Classrooms A and B are both secondary classrooms, which experience a higher rotation of students than primary classrooms, and where teachers who enter the classroom for 1–2 lessons only, may be less attuned to the room ventilation or need to ventilate compared to primary teachers who spend all day in the same classroom.
Discussion
The findings point to significant and prolonged exceedances in many classrooms. Five of the 67 classrooms monitored recorded more than 50 separate exceedances of 2,500 ppm of CO2 throughout their monitoring period. None of the classrooms visited had CO2 monitoring installed and the high CO2 readings reflect findings that sensory adaptation means users can remain unaware of poor IAQ until it becomes very poor (typically > 2,500 ppm; Maddalena et al., 2015). Almost two thirds of classrooms (42 of the 67) exceeded 1,800 ppm on one or more occasions and 13 of these exceeded 1,800 ppm continuously for 120 min (2 h) or longer on at least one occasion. Prolonged exposure (>3 h) to concentrations of this magnitude can negatively affect work performance and decision making (Maddalena et al., 2015; Zhang et al., 2017), meaning it is possible that students' cognitive performance may have been affected in certain rooms. However, students' movement between classrooms breaks outdoors during recess and lunch serve mitigates potential effects on work performance. Based on the OzSAGE guidelines, almost two thirds of the 67 classrooms with valid data experienced at least one (and in many cases multiple) instances of “high transmission risk” for COVID-19 (>1,500 ppm of CO2; Crabb, 2021).
Yet while concerning, our findings should not be considered unusual or surprising. (a) High CO2 concentrations in classrooms are commonly reported; our findings reflect those of a pre-COVID meta-review of CO2 concentrations in classrooms in Europe and the US which recorded widespread and significant instances of underventilation (Fisk, 2017). Our findings also reflect those of a study of CO2 concentrations in Italian classrooms during the initial weeks of school following a prolonged COVID lockdown in winter, which saw multiple instances of >1,500 ppm in classrooms (Di Gilio et al., 2021). (b) The push in recent decades for energy efficiency has led to a greater emphasis both in building design, and social expectations of behavior, to minimize air flow when heating or cooling (Howieson et al., 2013). Only very recently has the COVID pandemic thrust a light on the need to balance energy efficiency with disease transmission minimization. (c) Humans cannot reliably detect poor IAQ until it is very poor (i.e., at least 2,500 ppm) (Maddalena et al., 2015) and hence cannot be expected to (unaided) diagnose and remedy underventilation themselves. (d) CO2 monitoring is not yet widespread in Australian classrooms (Hamner, 2021), meaning occupants have no indication of when the air quality is poor.
There was no clear relationship observed between the type of room ventilation and propensity to exceed CO2 guideline values. Very high CO2 values were achieved in modern mixed-mode classrooms (when neither the windows or the HVAC was used), as well as older naturally ventilated classrooms. It is clear from our human-centered study that a wide range of building-related and human-related factors influence ventilation, including retrofits made for comfort (e.g., split system retrofits), safety (e.g., disabling second story windows), and external noise. Even relationships with facilities management appeared to have a bearing on classroom ventilation given certain teachers admitted they may not report issues to facilities staff if they did not feel confident they would receive a prompt or adequate response. Cultural factors may also assist in contextualizing the results. Prior to widespread vaccination, Brisbane experienced far fewer COVID-19 cases and far fewer days of lockdown compared to many cities in Europe, the US and China. It is possible that this relative insulation from the worst effects of the pandemic meant teachers did not feel it necessary to depart greatly from their usual practices for classroom airing, in contrast to the more extreme measures seen in parts of Europe where classroom windows were kept open during winter (Wilcock, 2022). Queensland's subtropical climate and traditionally airy and unsealed housing design (Taylor, 2017) underpins a traditionally limited public cognizance of ventilation, unlike parts of Europe where it is more ingrained as cultural practice (Connolly, 2020).
Mid-COVID ventilation guidance (e.g., the US CDC guidelines) do not include any provision for behavior change (CDC, 2021) and we feel it is vital that as such guidelines evolve to include consideration of how occupants themselves can be supported and incentivized to take an active role in airing rooms where this is possible. Based on our findings, making real time CO2 data available to occupants to support their ability to identify, remedy, or seek support (e.g., through facilities management) is an important first step. Yet the importance of CO2 monitor design and suggestions for design of ambient feedback for indoor air quality is already relatively well-discussed in literature (Kim et al., 2013; Rigger et al., 2015; Snow et al., 2019). We focus instead on considerations for how Inbodied Interaction might assist users to best benefit, learn and adapt behavior from CO2 monitoring.
Inbodied Interaction design focuses on an appropriate mix of outsourcing and insourcing management of personal health (Schraefel, 2019). Drawing on the Inbodied Interaction philosophy, we additionally highlight the importance of supplementing CO2 monitoring with programs and opportunities to improve users self-knowledge, so that such that users' proficiency in identifying and remedying poor ventilation extends beyond rooms in which CO2 monitoring is installed.
Design suggestions toward insourcing awareness of ventilation
Here we present several design suggestions toward complementing CO2 monitoring which are drawn from the context of Brisbane Australia, but some of which we hope might be widely applicable. (a)“Tuning” awareness:Tuning in the Inbodied Interaction philosophy relates to how an experience is mediated by knowledge, skills and practice and how that experience is felt internally. In the context of ventilation tuning may involve encouraging teachers and students to use CO2 monitors to learn what different concentrations of CO2feels like, e.g., “closeness” or stuffiness or freshness. Supportive practices to “feeling” the air in this way could be encouragement to visually scan a room upon entry (the same way we are encouraged to take note of fire exists) to identify the ventilation opportunities or problems, e.g., which windows would best be opened, or whether the user has control over the HVAC. From here, it may be possible to diagnose poor ventilation in other unmonitored rooms using these learned skills of sensing and scanning. This process represents a tuning of our bodies senses, both sign, smell and feel, to better diagnose -and know how to remedy- instances of poor ventilation. (b) Affordances: Our findings highlight how poor ventilation can be experienced in mixed mode and naturally ventilated rooms, while literature finds even mechanically ventilated classrooms may experience underventilation if teachers turn off the HVAC for reduced noise (Sanguinetti et al., 2022). These findings point to the importance of teaching students to identify different ventilation types (natural, mechanical, mixed mode) and understand what affordances each ventilation type offers. For example, if students in Classroom A understood that they need to either open windows OR run the HVAC system to ensure adequate ventilation, the high CO2 readings may have been avoided. Knowledge that naturally ventilated rooms rely only on windows being opened, may have led to occupants in the rooms with disabled windows to seek prompt attention from their facilities maintenance team. We argue that basic information should be provided with CO2 monitors around the different classroom ventilation types and the affordances available with each. (c)Habitualization through rituals and support: We feel it is important to take steps toward habitualization of ventilation actions, toward mainstreaming of ventilation as front-of-mind and everyday practice, similar to the engrained nature of “stoßlüften” in German culture (Connolly, 2020). Further, we argue that schools are an ideal place for this, given so many positive habits are formed at school (Martin and Murtagh, 2015). Habitualizing ventilation could involve setting a specific “ventilation time”, when windows and doors in naturally ventilated and mixed mode classrooms are opened. Setting “ventilation time” to 10 min before recess and lunch, supports children become accustomed to regular airing, and forming positive associations with ventilation, given its positive association just before a period of break. This timing allows the room to remain open during recess to ensure a complete air change. For staff, rituals could involve starting a meeting with an outline of the ventilation possibilities in the room, alongside pointing out toilets and fire exists. This ritual might act both as a means of improving awareness of the affordances available to occupants to ventilate, as well as a signal that the head of the meeting cares about ventilation and is happy for people to speak up, potentially breaking down the apprehension we—and others—have found regarding occupants speaking up or taking action if they feel the air quality of a room to be poor. (d) I5 information sheets and teaching activities: Teaching activities, information sheets and other learning resources should incorporating the I5 principles and emphasize insourcing awareness rather than dependence on the monitor. This might involve asking students to experience and discuss how different CO2 concentrations feel, and to correlate these feelings to the information displayed on the monitor, to enable them to pick up on early cues of underventilation. The most effective ventilation strategies vary by ventilation type and according to specific rooms. Educational resources should encourage students to experiment with different solutions for a given room (e.g., opening different combinations of doors/windows) to establish what is the most effective means of ventilating a particular room. This self-experimentation, e.g., trying and measuring different strategies and correlating these to ones own physiological feelings aligns with the Inbodied Interaction focus on learning, experimenting, “tuning” and adapting (Andres et al., 2019; Schraefel et al., 2020). All these suggestions reflect findings that engagement naturally decreases with situated informatics over time (Kim et al., 2013; Snow et al., 2015; Micallef et al., 2017) and we argue there is more value in designing to insource awareness through the measures above, rather than try to keep users constantly engaged through continual notifications or prompts from the technology.
Limitations
This study is limited by the small sample size and the results should not be considered representative of all classrooms in Brisbane or Queensland. The study did not attempt to measure occupancy in classrooms during CO2 peaks, meaning it is not possible to accurately measure the specific cause(s) of the underventilation, which could include building performance issues, users failing to ventilate and/or over-occupancy of rooms. Occupancy should be carefully considered in future discussions of inbodied interaction and classroom air quality. The approximate, rather than definitive timestamps from 42 of the 67 loggers mean specific timings of peaks is not possible to determine, but does not invalidate the focus of this study on exceedance number and duration.
Conclusion
The COVID pandemic has underscored the importance of adequate ventilation in occupied spaces. Through a study of CO2 concentrations in 67 classrooms across greater Brisbane, this study found widespread instances of underventilation above thresholds indicative of elevated COVID transmission risk (Crabb, 2021). Underventilation was caused by a range of human-related factors, including actions taken toward health and safety, energy efficiency and simple ergonomics, e.g., difficult to reach exhaust fan switches. In response, the study has identified ways in which the I5/C4 framework might be operationalized to complement the already substantial increase in CO2 monitoring, including insourcing awareness, tuning senses, understanding affordances and developing rituals to habitualize the regular airing of naturally ventilated classrooms. As the world re-calibrates to a new normal following the pandemic, we expect a widespread reconfiguration of ventilation guidance to provide a balance between energy efficiency and efforts to minimize the spread of airborne diseases such as COVID-19. Against this backdrop, we argue that research which centers around how human factors specifically affect ventilation as vital to efforts in understanding the reasons for underventilation and how we can prevent it. We hope this research provides a basis for future work related to the design of technology for indoor air quality applications.
Funding
This study was made possible through the Office of the Queensland Chief Scientist—Citizen Science Grants scheme.
Publisher's note
All claims expressed in this article are solely those of the authors and do not necessarily represent those of their affiliated organizations, or those of the publisher, the editors and the reviewers. Any product that may be evaluated in this article, or claim that may be made by its manufacturer, is not guaranteed or endorsed by the publisher.
Statements
Data availability statement
The anonymised raw data supporting the conclusions of this article can be made available by the authors through written request.
Ethics statement
The studies involving human participants were reviewed and approved by University of Queensland Low Risk Ethics Committee Approval number: 2020002680. The patients/participants provided their written informed consent to participate in this study. The study received additional approvals from the Queensland Department of Education and from Brisbane Catholic Education.
Author contributions
SS won the funding, managed the logger development and production, co-ran deployments and led data analysis, and led the paper. RD managed the deployments and played a large role in data cleaning and analysis. MG assisted in writing the paper. PL provided advice on architectural, ventilation and HVAC matters and assisted in writing the paper. BB assisted in sensor calibration, sensor design and technical design, and helped edit the paper. L-MO helped edit the paper. MB assisted in deployments, co-managed the process, and assisted in editing the paper. All authors contributed to the article and approved the submitted version.
Conflict of interest
Author BB was employed by PhiSaver. The remaining authors declare that the research was conducted in the absence of any commercial or financial relationships that could be construed as a potential conflict of interest.
Footnotes
1.^https://www.winsen-sensor.com/d/files/infrared-gas-sensor/mh-z19b-co2-ver1_0.pdf
2.^https://learn.adafruit.com/dht
3.^http://www.bom.gov.au/climate/averages/
4.^Ibid
References
1
AlfonsinN.McLeodV.LoderA.DiPietroL. (2018). Active design strategies and the evolution of the WELL Building StandardTM. J. Phys. Act. Health15, 885–887. 10.1123/jpah.2018-0584
2
AndresJ.SchraefelM. C.TaborA.HeklerE. B. (2019). The body as starting point: applying inside body knowledge for inbodied design, in Extended Abstracts of the 2019 CHI Conference on Human Factors in Computing Systems (Glasgow: ACM), 1–8. 10.1145/3290607.3299023
3
Bb101 (2019). Building Bulletin 101 Ventilation of School Buildings. Available online at: https://www.iesve.com/discoveries/blog/4234/building-bulletin-101.
4
BeatonM.BellengerL. G.CogginsJ. L.FeldmanE.GalloF. M.HansonS. D.et al. (2004). Addendum to ANSI/ASHRAE Standard 62 Ventilation for Acceptable Indoor Air Quality.ANSI/ASHRAE Addendum n to ANSI/ASHRAE Standard62–2001.
5
BonneyR.PhillipsT. B.BallardH. L.EnckJ. W. (2016). Can citizen science enhance public understanding of science?Public Understand Sci.25, 2–16. 10.1177/0963662515607406
6
BroganC. (2022). Curing COVID-19 in Schools: Imperial Scientists Support CO2 Monitor Rollout.Imperial College London.
7
BuonannoG.RobottoA.BrizioE.MorawskaL.CivraA.CorinoF.et al. (2022). Link between SARS-CoV-2 emissions and airborne concentrations: closing the gap in understanding. J. Hazard. Mater.428, 128279. 10.1016/j.jhazmat.2022.128279
8
CDC (2021). Ventilation in Buildings: Summary of Recent Changes. Available online at: https://www.cdc.gov/coronavirus/2019-ncov/community/ventilation.html (accessed April 17, 2022).
9
ChenA.ChangV. W.-C. (2012). Human health and thermal comfort of office workers in Singapore. Build. Environ.58, 172–178. 10.1016/j.buildenv.2012.07.004
10
ConnollyK. (2020). Germans Embrace Fresh Air to Ward Off Coronavirus. The Guardian. Available online at: https://www.theguardian.com/world/2020/sep/30/germans-embrace-fresh-air-to-ward-off-coronavirus (accessed January 7, 2022).
11
CrabbB. (2021). Safe Indoor Air (Ventilation) Recommendations. Available online at: https://ozsage.org/wp-content/uploads/2021/09/Safe-Indoor-Air-advice.pdf (accessed February 22, 2022).
12
Di GilioA.PalmisaniJ.PulimenoM.CerinoF.CacaceM.MianiA.et al. (2021). CO2 concentration monitoring inside educational buildings as a strategic tool to reduce the risk of SARS-CoV-2 airborne transmission. Environ. Res.202, 111560. 10.1016/j.envres.2021.111560
13
DMB (2019). Richtig Heizen, Richtig Lüften. Available online at: https://www.mieterbund.de/mietrecht/mietrecht-a-z/stichworte-zum-mietrecht-g/heizen.html (accessed March 6, 2022).
14
EtheridgeD. (2015). A perspective on fifty years of natural ventilation research. Build. Environ.91, 51–60. 10.1016/j.buildenv.2015.02.033
15
FangB.XuQ.ParkT.ZhangM. (2016). AirSense: an intelligent home-based sensing system for indoor air quality analytics, in UbiComp 2016 Proceedings of the 2016 ACM International Joint Conference on Pervasive and Ubiquitous Computing (Heidelberg), 109–119. 10.1145/2971648.2971720
16
FiskW. J. (2017). The ventilation problem in schools: literature review. Indoor Air27, 1039–1051. 10.1111/ina.12403
17
FitzpatrickF. (2021). COVID: Why You Still Need to Wash Your Hands. The Conversation. Available online at: https://theconversation.com/covid-why-you-still-need-to-wash-your-hands-164832 (accessed June 13, 2022).
18
GullandA. (2022). COVID Hygiene: The Main Risk From Omicron Is the Air We Breathe - But Cleaning Surfaces Is Still Important. The Telegraph. Available online at: https://www.telegraph.co.uk/global-health/science-and-disease/point-cleaning-surfaces-protect-against-spread-covid/ (accessed December 2, 2022).
19
GurdasaniD.AlwanN. A.GreenhalghT.HydeZ.JohnsonL.McKeeM.et al. (2021). School reopening without robust COVID-19 mitigation risks accelerating the pandemic. Lancet397, 1177–1178. 10.1016/S0140-6736(21)00622-X
20
HamnerG. (2021). Schools Need to Know Classrooms' Air Quality to Protect Against COVID. But Governments Aren't Measuring It Properly. The Conversation. Available online at: https://theconversation.com/schools-need-to-know-classrooms-air-quality-to-protect-against-covid-but-governments-arent-measuring-it-properly-171107
21
HargreavesT.NyeM.BurgessJ. (2013). Keeping energy visible? Exploring how householders interact with feedback from smart energy monitors in the longer term. Energy Policy52, 126–134. 10.1016/j.enpol.2012.03.027
22
Haverinen-ShaughnessyU.ShaughnessyR. J. (2015). Effects of classroom ventilation rate and temperature on students' test scores. PLoS ONE10, e0136165. 10.1371/journal.pone.0136165
23
HedinB.KatzeffC.ErikssonE.PargmanD. (2019). A systematic review of digital behaviour change interventions for more sustainable food consumption. Sustainability11, 2638. 10.3390/su11092638
24
HowiesonS. G.SharpeT.FarrenP. (2013). Building tight - ventilating right? How are new air tightness standards affecting indoor air quality in dwellings?Build. Serv. Eng. Res. Technol.35, 475–487. 10.1177/0143624413510307
25
HumphreysM. A.Fergus NicolJ. (2018). Principles of adaptive thermal comfort, in Sustainable Houses and Living in the Hot-Humid Climates of Asia, eds KubotaT.RijalH. B.TakaguchiH. (Singapore: Springer), 103–113. 10.1007/978-981-10-8465-2_10
26
International Standards Organisation (2012). ISO16000-26:2012 Indoor Air - Part 26: Sampling Strategy for Carbon Dioxide (CO2). Available online at: https://www.iso.org/standard/52140.html (accessed February 21, 2022).
27
JansenC.DarbroJ.BirrellF.ShivasM.van den HurkA. (2021). Impact of COVID-19 mitigation measures on mosquito-borne diseases in 2020 in Queensland, Australia. Viruses13, 1150. 10.3390/v13061150
28
KimS.PaulosE.MankoffJ. (2013). InAir: a longitudinal study of indoor air quality measurements and visualizations, in Proceedings of the SIGCHI Conference on Human Factors in Computing Systems (Paris), 2745–2754. 10.1145/2470654.2481380
29
LiI.DeyA. K.ForlizziJ. (2011). Understanding my data, myself: supporting self-reflection with ubicomp technologies, in UbiComp'11 Proceedings of the 2011 ACM Conference on Ubiquitous Computing (Beijing: ACM). 10.1145/2030112.2030166
30
MaddalenaR.MendellM. J.EliseevaK.ChanW. R.SullivanD. P.RussellM.et al. (2015). Effects of ventilation rate per person and per floor area on perceived air quality, sick building syndrome symptoms, and decision-making. Indoor Air25, 362–370. 10.1111/ina.12149
31
MartinR.MurtaghE. M. (2015). Preliminary findings of active classrooms: an intervention to increase physical activity levels of primary school children during class time. Teach. Teach. Educ.52, 113–127. 10.1016/j.tate.2015.09.007
32
McCambridgeJ.WittonJ.ElbourneD. R. (2014). Systematic review of the Hawthorne effect: new concepts are needed to study research participation effects. J. Clin. Epidemiol.67, 267–277. 10.1016/j.jclinepi.2013.08.015
33
McLaughlinB.SnowS.ChapmanA. (2021). Codesign to improve IAQ awareness in classrooms, in Intelligent Environmental Data Monitoring for Pollution Management, eds BattacharyaS.MondalN. K.PlatosJ.SnaselV.KromerP. (New York, NY: Elsevier), 241–267. 10.1016/B978-0-12-819671-7.00011-7
34
MicallefN.JustM.BaillieL.AlharbyM. (2017). Stop annoying me! an empirical investigation of the usability of app privacy notifications, in ACM International Conference Proceeding Series, 371–375. 10.1145/3152771.3156139
35
MorawskaL.MiltonD. K. (2020). It is time to address airborne transmission of coronavirus disease 2019 (COVID-19). Clin. Infect. Dis.71, 2311–2313. 10.1093/cid/ciaa939
36
National Construction Code (2019). Building Code of Australia, Vol. 1. Canberra, ACT. Available online at: https://ncc.abcb.gov.au/
37
NSW Government (2021). COVID-19 Guidance on Ventilation. Available online at: https://www.nsw.gov.au/covid-19/business/rules-guidance/ventilation
38
OrnaghiC.CostanzaE.Kittley-DaviesJ.BourikasL.AragonV.JamesP. A. B. (2018). The effect of behavioural interventions on energy conservation in naturally ventilated offices. Energy Econ.74, 582–591. 10.1016/j.eneco.2018.07.008
39
Press Release (2021). All Schools to Receive Carbon Dioxide Monitors. Department for Education. Available online at: https://www.gov.uk/government/news/all-schools-to-receive-carbon-dioxide-monitors (accessed May 19, 2022).
40
Queensland Government (2020). Queensland COVID-19 Update: 28 December 2020. Queensland Health. Available online at: https://www.health.qld.gov.au/news-events/doh-media-releases/releases/queensland-covid-19-update-2020-12-28 (accessed January 6, 2022).
41
RedlichC. A.SparerJ.CullenM. R. (1997). Sick-building syndrome. Lancet349, 1013–1016. 10.1016/S0140-6736(96)07220-0
42
RiggerP.WortmannF.DahlingerA. (2015). Design science in practice: design and evaluation of an art based information system to improve indoor air quality at schools, in International Conference on Design Science Research in Information Systems (Dublin: Springer International Publishing), 71–86. 10.1007/978-3-319-18714-3_5
43
SanguinettiA.OutcaultS.PistochiniT.HoffackerM. (2022). Understanding teachers' experiences of ventilation in California K-12 classrooms and implications for supporting safe operation of schools in the wake of the COVID-19 pandemic. Indoor Air32, 1–13. 10.1111/ina.12998
44
SatishU.MendellM. J.ShekharK.HotchiT.SullivanD.StreufertS.et al. (2012). Is CO2 an indoor pollutant? Direct effects of low-to-moderate CO2 concentrations on human decision-making performance. Environ. Health Perspect.120, 1671–1677. 10.1289/ehp.1104789
45
SchraefelM. C. (2019). in5: a model for inbodied interaction, in Extended Abstracts of the 2019 CHI Conference on Human Factors in Computing Systems (Glasgow: ACM), 1–6. 10.1145/3290607.3312977
46
SchraefelM. C.TaborA.AndresJ. (2020). Toward insourcing-measurement in inbodied interaction design. Interactions27, 56–60. 10.1145/3381340
47
SnowS.OakleyM.SchraefelM. C. (2019). Performance by design: supporting decisions around indoor air quality in offices, in Proceedings of the 2019 on Designing Interactive Systems Conference (San Diego, CA: ACM), 99–111. 10.1145/3322276.3322372
48
SnowS.SoskaA.ChatterjeeS.SchraefelM. C. (2016). Keep calm and carry on: exploring the social determinants of indoor environment quality, in CHI Extended Abstracts on Human Factors in Computing Systems (San Jose, CA), 1476–1482. 10.1145/2851581.2892490
49
SnowS.VyasD.BreretonM. (2015). When an eco-feedback system joins the family. Pers. Ubiquit. Comput.19, 929–940. 10.1007/s00779-015-0839-y
50
TaylorW. M. (2017). Hot modernism: Queensland architecture 1945-1975. Fabrications27, 310–312. 10.1080/10331867.2017.1310013
51
ThompsonD. (2020). Hygiene Theater Is a Huge Waste of Time: People Are Power Scrubbing Their Way to a False Sense of Security. The Atlantic. Available online at: https://www.theatlantic.com/ideas/archive/2020/07/scourge-hygiene-theater/614599/ (accessed August 7 2022).
52
VehviläinenT.LindholmH.RintamäkiH.PääkkönenR.HirvonenA.NiemiO.et al. (2016). High indoor CO2 concentrations in an office environment increases the transcutaneous CO2 level and sleepiness during cognitive work. J. Occup. Environ. Hyg.13, 19–29. 10.1080/15459624.2015.1076160
53
VillanuevaF.NotarioA.CabañasB.MartínP.SalgadoS.GabrielM. F. (2021). Assessment of CO2 and aerosol (PM2.5, PM10, UFP) concentrations during the reopening of schools in the COVID-19 pandemic: the case of a metropolitan area in Central-Southern Spain. Environ. Res.197, 111092. 10.1016/j.envres.2021.111092
54
WargockiP.Da SilvaN. A. F. (2015). Use of visual CO2 feedback as a retrofit solution for improving classroom air quality. Indoor Air25, 105–114. 10.1111/ina.12119
55
WargockiP.WyonD. P. (2013). Providing better thermal and air quality conditions in school classrooms would be cost-effective. Build. Environ.59, 581–589. 10.1016/j.buildenv.2012.10.007
56
WargockiP.WyonD. P. (2017). Ten questions concerning thermal and indoor air quality effects on the performance of office work and schoolwork. Build. Environ.112, 359–366. 10.1016/j.buildenv.2016.11.020
57
WilcockD. (2022). Cold Discomfort Harm? Ministers Slammed for Taking Almost a YEAR to Launch Classroom Ventilation Pilot Scheme That Will Not Report Back Until the End of the School Year. Daily Mail. Available online at: https://www.dailymail.co.uk/news/article-10423435/Ministers-slammed-classroom-ventilation-scheme-children-sit-freezing-classrooms.html (accessed May 22 2022).
58
ZhangX.WargockiP.LianZ. (2017). Physiological responses during exposure to carbon dioxide and bioeffluents at levels typically occurring indoor. Indoor Air27, 65–77. 10.1111/ina.12286
Summary
Keywords
ventilation, IAQ, cognitive performance, COVID-19, CO2, energy efficiency
Citation
Snow S, Danam R, Leardini P, Glencross M, Beeson B, Ottenhaus L-M and Boden M (2022) Human factors affecting ventilation in Australian classrooms during the COVID-19 pandemic: Toward insourcing occupants' proficiency in ventilation management. Front. Comput. Sci. 4:888688. doi: 10.3389/fcomp.2022.888688
Received
04 March 2022
Accepted
29 July 2022
Published
25 August 2022
Volume
4 - 2022
Edited by
Michael Jones, Brigham Young University, United States
Reviewed by
Josh Andres, Australian National University, Australia; Giovanni Ciampi, Università degli Studi della Campania Luigi Vanvitelli, Italy; Jenna Mikus, Queensland University of Technology, Australia
Updates
Copyright
© 2022 Snow, Danam, Leardini, Glencross, Beeson, Ottenhaus and Boden.
This is an open-access article distributed under the terms of the Creative Commons Attribution License (CC BY). The use, distribution or reproduction in other forums is permitted, provided the original author(s) and the copyright owner(s) are credited and that the original publication in this journal is cited, in accordance with accepted academic practice. No use, distribution or reproduction is permitted which does not comply with these terms.
*Correspondence: Stephen Snow s.snow@uq.edu.au
This article was submitted to Human-Media Interaction, a section of the journal Frontiers in Computer Science
Disclaimer
All claims expressed in this article are solely those of the authors and do not necessarily represent those of their affiliated organizations, or those of the publisher, the editors and the reviewers. Any product that may be evaluated in this article or claim that may be made by its manufacturer is not guaranteed or endorsed by the publisher.