 Joseph S. Lappin1*
 Herbert H. Bell2
- 1Department of Psychology, Vanderbilt University, Nashville, TN, United States
- 2Independent Consultant, Mount Dora, FL, United States
Biological vision relies on the intrinsic spatiotemporal structure of a continuously flowing image stream. We review converging psychophysical and physiological evidence about the structure and precision of the perceived spatiotemporal organization of dynamic images. Visual acuity, temporal resolution, and contrast sensitivity have been found to involve (a) motion-produced increases in image contrast, (b) coherent phase relations among temporally varying retinal signals, and (c) physiological preservation of spatiotemporal structure from retina to cortex. Moreover, psychophysical theory and evidence show that the spatiotemporal structure of dynamic retinal images carries precise information for perceiving surfaces and motions—consistent with the corresponding differential structures of spatiotemporal images and environmental surfaces.
Introduction
Vision is a system for acquiring and transmitting dynamic optical information. Even when we fixate on a stationary object, our eyes are constantly in motion. As a result, the location of the image on our retinal photoreceptors is continually changing. Intuitively, these constant changes might seem a threat to vision, analogous to noise. The image changes are not independent, however, and their covariation is a basis for perceptual organization and constitutes information about environmental surfaces, objects, and motions.
Our aim in this article is to show that spatiotemporal structure is essential to the visual organization of retinal images. We briefly summarize psychophysical evidence about visual sensitivity to spatiotemporal variations and describe information provided by those variations. We also discuss mechanisms that may underly the acquisition of this information.
Image motions provide spatial information
Many traditional ideas about vision reflect film-based systems, where image motion causes blur and reduces contrast. Light-induced changes in the photosensitive molecules in film are mainly integrative and independent among neighboring elements. In the eye, however, neighboring photoreceptors, bipolar cells, and ganglion cells interact with one another (Rodieck, 1998; Strauss et al., 2022). Lateral inhibition serves to differentiate and thereby increase local contrasts (Ratliff, 1965).
In fact, our eyes are constantly moving (Martinez-Conde et al., 2004a,b). Even while steadily fixating an object, retinal image positions undergo small random drifts and jitter at microscopic scales covering multiple photoreceptors, which are separated in central fovea by about 0.5 arcmin. And the image positions are interrupted at random intervals about twice per second by rapid micro-saccades of roughly 10 arcmin (Kowler, 2011; Rucci and Poletti, 2015; Intoy and Rucci, 2020). Importantly, small image motions improve spatial resolution (Rucci et al., 2007; Rucci and Poletti, 2015; Intoy and Rucci, 2020).
Image motion improves spatial resolution by transforming spatial contrasts into larger contrasts in space-time. Figure 1 illustrates how this happens. A shift in the spatial position of a given image feature (a dark bar in Figure 1) produces a spatiotemporal dipole defined by the difference between successive images. The contrast of this dipole is twice that of the separate spatial images, and it has an ordered structure that specifies its displacement in both space and time. That spatial displacement is an intrinsic property of the dipole that does not involve extrinsically defined spatial positions.1
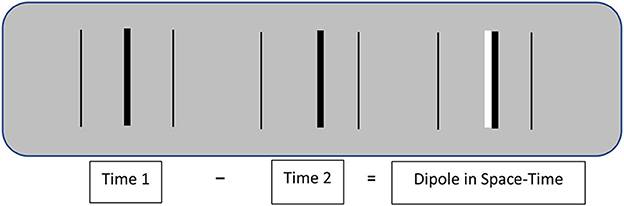
Figure 1. Schematic illustration of the dipole image contrast created by the image motion of a central target line. Real-time shifts in spatial position are much more visible than equivalent differences in stationary positions. The thin outside lines in this illustration are stationary reference lines.
Intrinsic image structure
Visual information about spatial relations and motions is defined relative to a reference frame. Specifying that reference frame is fundamental for vision sciences. A common intuition is that the initial reference frame for spatial vision is the anatomical mosaic of retinal photoreceptors. Marr (1982), for example, states that “…in the case of human vision, the initial representation [of optical images] is in no doubt—it consists of arrays of image intensity values as detected by the photoreceptors in the retina” (p. 31). This statement might be taken to mean that spatial positions and relations are encoded by local signs of the photoreceptors stimulated by any given optical image. One might wonder, how else could it be?
Despite the intuitive necessity of this starting point for perceptual organization, it entails two computational problems: First, this reference frame is extrinsic to the spatial organization of observed objects and motions in the environment. Second, it is an implicitly static reference frame—whereas retinal positions, spatial separations, and angular directions of retinal image features are actually continually changed by movements of the observer's eyes, head, and body relative to the observed environment. A basic problem for a theory of vision is to understand how information defining objects is obtained from continually shifting images.
Representing image structure by reference to the retinal photoreceptors is consistent with our intuitive understanding of space and time as reference frames that are independent of their contents. In modern physics, space and time are derived relations among moving masses, but that abstract physical realm may seem irrelevant to visual science. Nevertheless, spatial organization can be structured by intrinsic spatiotemporal relations within moving images, invariant with retinal position.
Two insights about the intrinsic image information for perception are that (a) retinal images are images of surfaces, and (b) the 2nd-order differential structure2 of moving images is isomorphic with that of environmental surfaces (Koenderink and van Doorn, 1975, 1980, 1991, 1992a,b; Koenderink, 1987, 1990). The interdisciplinary literature on that intrinsic image information is beyond the scope of this article, though we recently reviewed evidence about that information (Lappin and Bell, 2021). Here, we focus on the role of motion in perceptual organization.
If spatial positions and relations are represented relative to the intrinsic image structure, that does not in any way indicate the irrelevance of retinal photoreceptors and neurons. The question is whether spatial relations are anatomically defined by the positions of the receptors, or by spatiotemporal distributions of activity in the receptors and neurons.
Lappin and Craft (2000) tested alternative hypotheses about intrinsic image structure vs. extrinsic coordinates as reference frames for the optical input to vision. A first experiment tested the precision of visual information about intrinsic spatial positions in images that were rapidly and randomly jittered on the display monitor, as compared with stationary displays. The randomly jittered images disrupted extrinsically defined spatial positions on the monitor and the retina, but preserved intrinsic image structure that was invariant with the random changing positions.
Images of three lines similar to those in Figure 1 were used to evaluate visual acuities for (a) detecting motion and (b) discriminating relative positions. Two image conditions involved either stationary or randomly jittered images. In both conditions, observers used one joystick to adjust the amplitude of rapid (10/s) random displacements of the center line relative to the two flankers so that its relative motion was undetectable; and they used a second joystick to center the target line (1° in length) so as to bisect the space between the two flankers. The correct target-flanker separation was varied from 0.5° to 4°. In the randomly jittered images, the whole 3-line pattern was randomly repositioned 10 times per sec at equally probable positions in a rectangular area of 12 × 12 arcmin. The root-mean-square (RMS, standard deviation) random image displacements were 5.4 arcmin both horizontally and vertically. Figure 2 illustrates the stimulus pattern and two concurrent adjustment tasks, along with the adjustment acuities of three observers.
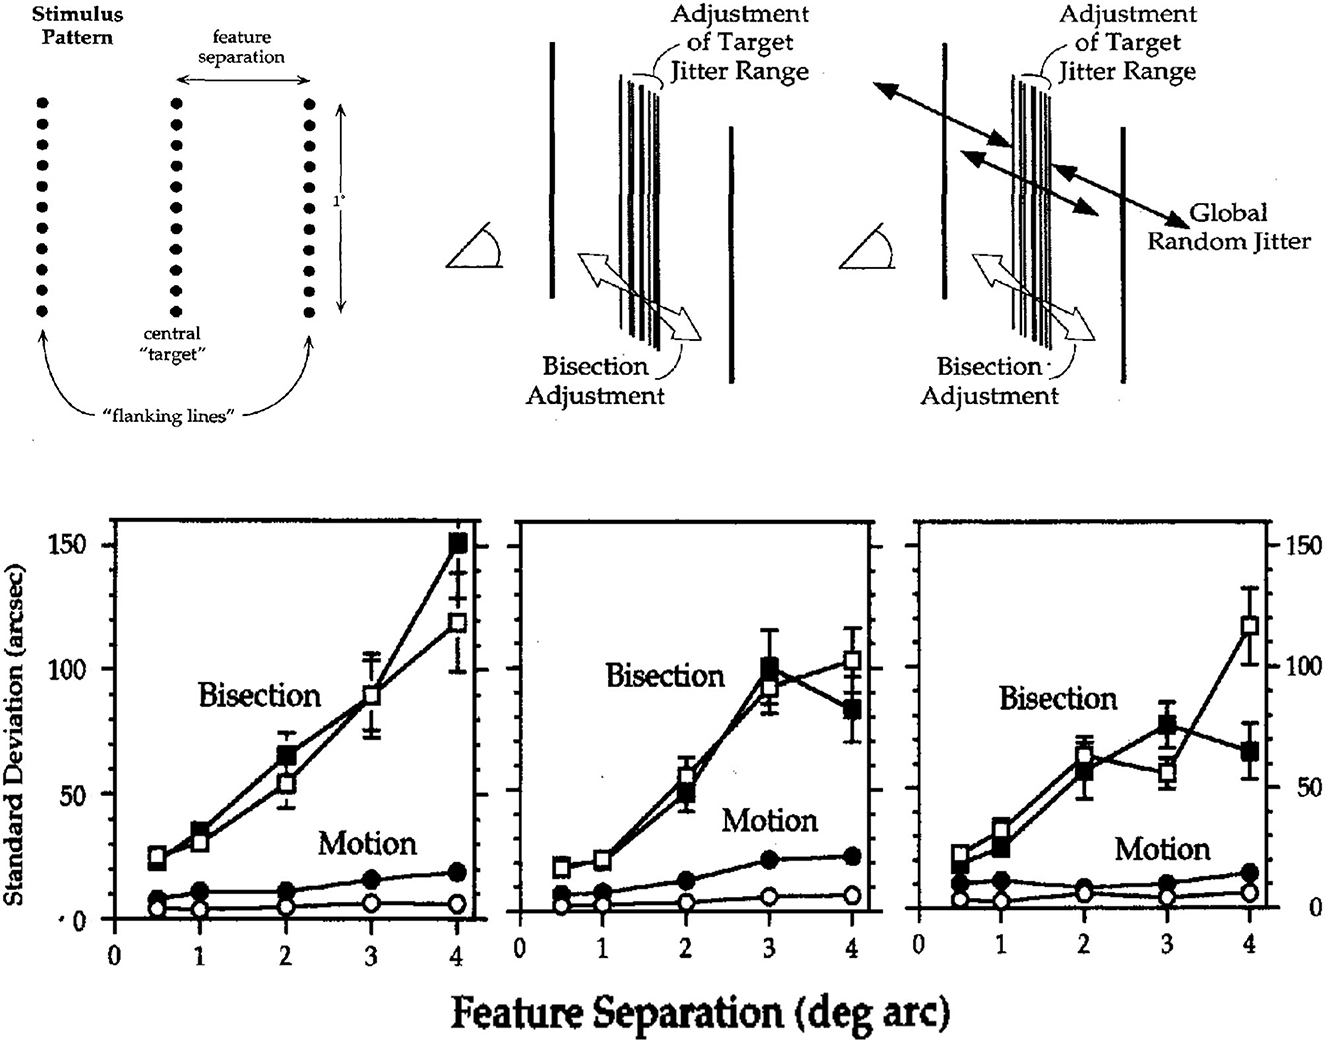
Figure 2. Spatial acuities for bisection and motion detection in stationary images (unfilled symbols) and images with randomly jittered global image positions (filled symbols). (Upper) Schematic illustrations of the visual patterns and two adjustment tasks. (Lower) Acuities for bisection and motion detection (standard deviations of 20 adjustments, arcsec) for three observers. Error bars are ±1 SEM; those not shown were too small to be visible (From Lappin and Craft, 2000. Copyright © 2000 by the American Psychological Association. Reproduced and adapted with permission).
The results in Figure 2 show that substantial global random image jitter had very little effect on acuities for detecting motion or bisecting spaces. Of particular interest are the “hyperacuities”3 (Westheimer, 1975, 1979) for motion detection. In stationary images with 1° feature separations, for example, detection thresholds for three observers averaged just 3.1 arcsec—about 10% of the distance between photoreceptors in central fovea! In the randomly jittered images, with RMS horizontal jitter of 340 arcsec, average detection thresholds for relative motion increased—but to only 10.1 arcsec, less than half the half the separation between foveal cones! Thus, precise visual information about motion was based on relative motion—relative to the intrinsic image structure, robust over substantial random variations in retinal positions.
As expected, bisection acuities were less precise than those for motion detection, but these too were barely affected by global random image jitter. For feature separations of 1° to 4°, bisection acuities were approximately proportional to the feature separations, averaging just 0.78 and 0.83% of the separation between target and flankers.
Though not immediately evident in Figure 2, thresholds for motion detection as well as bisection increased approximately in proportion to separations of 1°-4° between the target line and flankers (Proportions were slightly greater for the 0.5° separation). For the stationary and jittered images, the motion acuities averaged just 0.06 and 0.18% of the feature separation. The proportionality of spatial resolution and feature separation also shows that perceived image motion involves intrinsic image structure, not local retinal positions as previously suggested (McKee et al., 1990).
Homogeneity of the visual motion field
Image motion is probably also a basis for the perceptual homogeneity of space over the whole visual field. As is well known, spatial resolution of static patterns is substantially reduced in the peripheral field. Nevertheless, despite those reduced acuities, spatial structure and motion seem subjectively constant over the visual field. That subjective phenomenology might seem surprising and puzzling—given that the densities of photoreceptors, ganglion cells, and cortical neurons all decrease rapidly with increased eccentricity, and the receptive fields of ganglion cells and cortical cells increase substantially (see Banks et al., 1991). Accordingly, spatial forms must be much larger in the periphery to be as visible as those in the fovea (Anstis, 1974). At 30 deg eccentricity, Anstis estimated that image sizes should be about 15 times larger to be seen as well as in the fovea.
Visual resolution for motion, however, is not reduced in the peripheral field. Lappin et al. (2009) evaluated spatial and temporal thresholds (which covary with motion speed) for discriminating left/right motion directions in the fovea and at ±30 deg eccentricity (High-contrast vertical gratings (1 c/deg) moved within 3 deg diameter envelopes at speeds ranging from 0.08 to 20 deg/s). Visual resolution for these motion discriminations differed sharply from that of stationary forms. For image speeds above 0.5 deg/s, spatial (and temporal) thresholds were lower in the periphery than in the fovea. Even at a very slow speed of 0.08 deg/s, peripheral thresholds were just 1.1 arcmin (compared to a foveal threshold about half that size). With increasing speeds, spatial displacement thresholds increased (and temporal durations decreased), but both spatial and temporal thresholds were consistently lower in the periphery. Related results were also reported by van de Grind et al. (1983, 1992). Thus, the visual motion field is more homogeneous than the visual field of static patterns.
Such homogeneity of the visual motion field was also found in experiments that evaluated perceptual relationships among multiple moving and stationary patterns—which were simultaneously presented in the fovea and at ±30 deg eccentricity (Lappin et al., 2004a,b). Using stimuli like those above (Lappin et al., 2009), motion perception was evaluated by temporal thresholds for direction discrimination; and stationary form discriminations were evaluated by orientation thresholds for discriminating stationary left/right tilts of the gratings. One experiment measured thresholds for an oddball detection task in which all three directions of motion or tilt were the same or one was different. For moving gratings, we found that their relative directions were easily perceived: Thresholds for the same/different motion directions were essentially the same as those for discriminating the direction of any single grating—much lower than if they were visually independent. For stationary gratings, however, the opposite result occurred: Thresholds for same/different tilts were much higher than those at any single location. Simultaneously perceiving stationary forms in the central and peripheral fields involved competition for attention. But the visual motion field was perceptually organized, coherent.
The visual nervous system preserves order in space-time
The importance of motion for perceptual organization is also indicated by the fidelity with which information about image motion is preserved by neural signals. Under optimal conditions, human observers can perceive the spatiotemporal order (direction) of two adjacent stimuli separated in time by only 3 ms (Westheimer and McKee, 1977). To be consciously perceived and discriminated, such differences must exist in the retina (Brindley, 1970) and remain through transmission to the cortex.
Individual retinal ganglion cells transmit information about the changing stimulation in their receptive fields by modulating their spike rates. The precision and reliability of these temporally varying signals was evaluated by Borghuis (2003) and Borghuis et al. (2019). Spike trains carrying this temporal information are illustrated in Figure 3, which shows spike trains recorded for a single retinal ganglion cell of a cat in response to moving gratings (from Borghuis et al., 2019). Dynamics of these neurons are similar for all mammals (Borghuis, 2003; Chichilnisky and Kalmar, 2003). Responses of these cells are not directionally selective, but they are highly sensitive to the temporal modulations produced by motion.
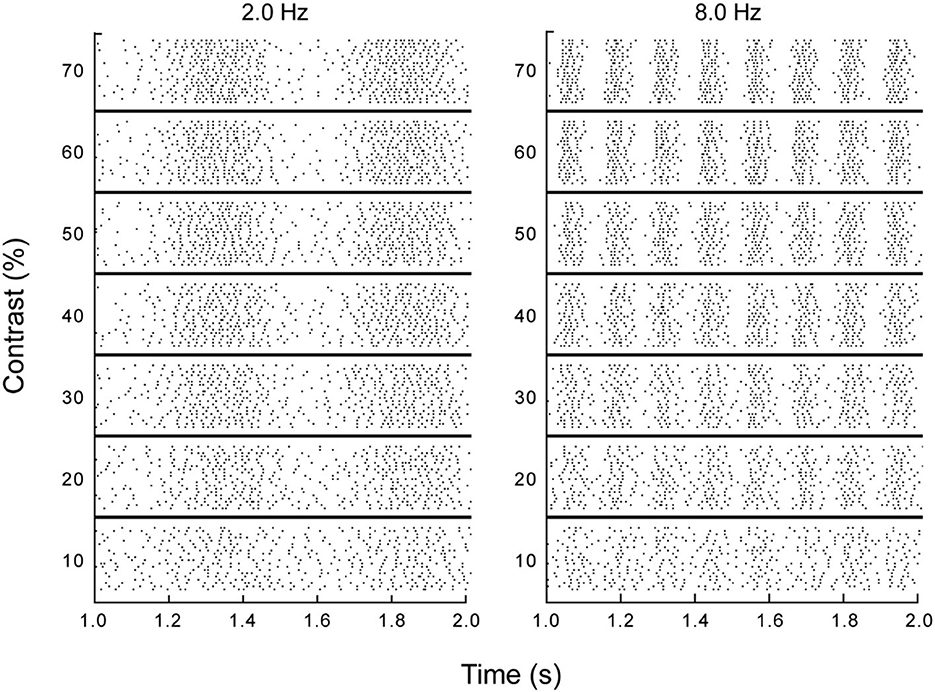
Figure 3. Responses of a single retinal ganglion cell to drifting sinusoidal gratings. Each row in each section is a 1 second raster plot of responses to a grating at the specified temporal frequency and contrast, with each stimulus repeated at least 20 times and each dot representing a single spike (from Borghuis et al., 2019, p. 6).
Figure 3 shows the spatial organization implicit in the temporal variations in spike rates at a given spatial position. The temporal periodicity of spike rates in the columns for the 2.0 and 8.0 Hz drift rates illustrate how an individual ganglion cell reveals the spatial structure of a sinusoidal luminance pattern moving through its receptive field. This periodic structure is robust over wide variations in contrast. Information about the direction and speed of motion is provided by phase differences in the spike trains of neighboring neurons. In short, temporally varying spike rates carry spatial information about moving patterns.
The temporal resolution of spike-rate variations like those in Figure 3 is limited by random variability. But this variability is reduced by temporal integration. Borghuis and colleagues (Borghuis et al., 2019) evaluated the temporal resolution of these neural signals by determining the integration times needed to distinguish stimulus-controlled spike rates from random sequences of the same inter-spike intervals. Responses to optical motions ranging from 0.5 to 16 Hz at contrasts ranging from 10 to 70% were recorded for 37 ganglion cells (33 X-type, 4 Y-type). Critical integration times were identified by cross-correlating pairs of spike trains for 20 repetitions of the same stimulus and then comparing those correlations with those for randomized sequences of the same spike trains. These cross-correlations vary as a function of the temporal interval over which the momentary spike rates are measured; and correlations were evaluated for integration times ranging from 1 to 500 ms. A well-defined peak in the difference in cross-correlations for the stimulus-controlled vs. randomized spike trains identified the optimal integration time and temporal resolution of each cell in each stimulus condition. Results are shown in panels A and B of Figure 4.
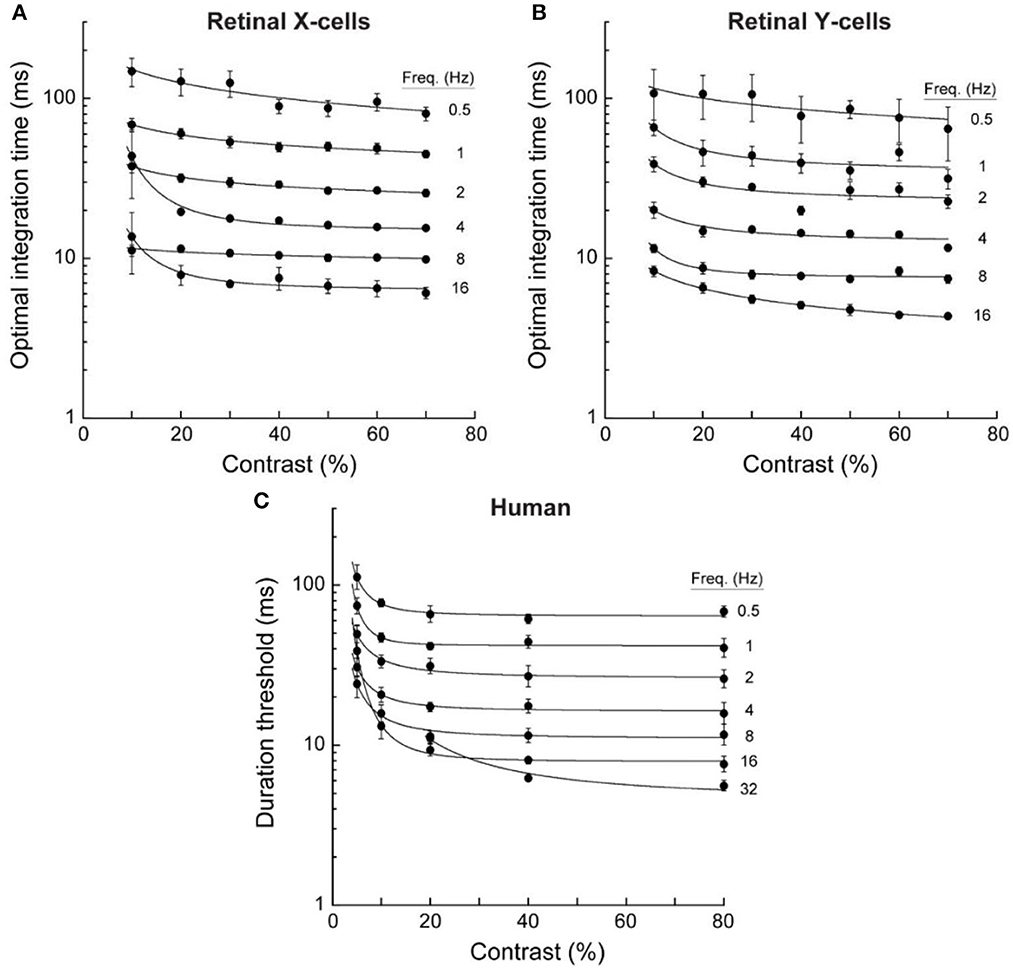
Figure 4. Optimal integration times for neural responses of retinal ganglion cells and duration thresholds for human direction discriminations. Data were averaged for 33 retinal X cells, 4 retinal Y cells, and 4 human observers. Error bars are for SEM. These temporal integration durations decreased with temporal frequency but were little affected by contrast above about 10% (adapted from Borghuis et al., 2019, p. 9).
Data in the upper panels of Figure 4 show that that the temporal resolution of these retinal neurons improved rapidly as the temporal frequency of the optical oscillation increased from 0.5 to 16 Hz. Indeed, the decreases in optimal integration times were almost inversely proportional to the temporal frequency of the motion-caused oscillation. One might expect that temporal resolution would depend on the optical contrast of the gratings, but contrasts above 20% had almost no effect. The temporal resolution of these retinal signals depends on motion speed rather than contrast: Slower motions resolve more slowly.
How does the temporal resolution of retinal ganglion cells relate to discriminations of motion direction—which depend on phase differences among the spike rates of neighboring cells? Borghuis et al. (2019) addressed that question by evaluating temporal duration thresholds for human observers' discriminations of left/right motion directions for similar moving gratings. Stimuli for the human observers were Gabor patches: 0.33 deg diameter at ±2σ width of a Gaussian envelope, 3.0 c/deg spatial frequency, with temporal frequencies from 0.5 to 32 Hz and contrasts from 5 to 80%.
Results are shown in panel C of Figure 4. Remarkably, these two aspects of information about moving visual images—one involving single retinal cells, and the other involving large numbers of cortical cells—were both qualitatively and quantitatively similar. The correlation between human duration thresholds and neural time constants was r = 0.99 for retinal X cells, and r = 0.98 for retinal Y cells. For fast motions at 16 Hz, the integration time constants for both X and Y retinal cells were slightly lower than the human discrimination thresholds; but for very slow motions at 0.5 Hz, requiring temporal integration approaching 100 ms, human discriminations exhibited slightly better resolution than the (cat's) retinal cells (This advantage for the humans probably reflects their greater spatial acuity).
Similar temporal resolution of motion by retinal neurons and human discriminations of motion directions, involving phase relations among multiple neurons, implies that the visual system preserves the spatiotemporal order of moving images with very little information loss from retina to cortex.
Coherent phase relations among spatially separate motion signals
How does vision resolve different image motions? Image motions are produced by the eyes and body as well as external objects. How does vision differentiate relative motions? In fact, vision is extraordinarily sensitive to relative motion. And the spatial resolution of relative motion implies correlated—coherent—phase relations among spatially separate retinal signals.4
Lappin et al. (2001) evaluated visual resolution of relative motion by measuring observers' abilities to detect phase differences in sinusoidal oscillations of spatially separate image features. The stimuli were three horizontally aligned and horizontally oscillating Gaussian luminance blobs [The apparent diameter of the blobs was roughly 1/2 deg (σ = 7.1 arcmin) and the peak luminance was 78% above the background]. In one experiment with 100 arcmin center-to-center separation between blobs and 1.5 Hz sinusoidal oscillations, average threshold acuities (at d' = 1.0) for discriminating in-phase vs. anti-phase motions of the central blob relative to the two flankers were lower than those for detecting rigid motions of all three blobs−8.7 vs. 11.0 arcsec. This hyperacuity for relative motion involved image displacements of only 0.14 and 0.18 pixels (on a monitor with 1,024 pixels horizontal resolution) and 0.14 and 0.18% of the space between blobs.
Because these perceived relative image displacements were fractions of single pixels and fractions of separations between foveal photoreceptors, the visual temporal variations produced by individual pixels as well as retinal photoreceptors and neurons must be correlated. This spatial hyperacuity derives from temporal phase differences. Indeed, discrimination thresholds for spatial oscillations provide an estimate of the correlation between visual oscillations of the center and flanking features: Thresholds, at d' = 1.0, estimate standard deviations corresponding to visually detected motion distances. By a geometric construction, where the cosine of the angle between two vectors equals their product-moment correlation, the law of cosines gives an estimate of the correlation.5 If 11.0 arcsec is the distance of the in-phase center and flanker motions, and if 8.7 arcsec is the anti-phase motion distance, then r = 0.67. Coherent retinal signals are necessary for the obtained hyperacuities.
A similar experiment evaluated acuity by varying the relative oscillation phase of the central blob. For Gaussian blobs separated by 320 arcmin and a 1.6 arcmin oscillation, the threshold phase difference was <18°. This acuity was robust over increased spatial separations. For separations of 80, 160, and 320 arcmin, threshold values were 0.24, 0.36, and 0.49 arcmin (0.3, 0.2, and 0.15% of the separation). The acuities were also robust over varying temporal frequencies—best at 3 Hz and increasing from about 0.25 arcmin to 0.5 arcmin at 9 Hz.
The visual precision in this study is also remarkable when evaluated by the tiny changes in luminance (8-bit grayscale resolution) produced by small image motions. A lateral shift of 0.14 pixels produced no luminance change at either the center or outside edges of the blob, nor indeed any luminance change in 80% of the blob's pixels. These detectable changes in relative image positions involved a change of about 1% of the initial luminance of just 20% of the 1,272 pixels in the Gaussian blob (The area of each pixel was 1 arcmin2, stimulating several neighboring photoreceptors, and each blob stimulated several thousand photoreceptors). Relative to the total blob luminance, the contrast change produced by a shift of 0.14 pixels was just 0.24%. Figure 5 illustrates the luminance distribution and the dipole change produced by a leftward shift of 0.14 pixels. Visual sensitivity to such tiny changes in the spatiotemporal distribution of stimulation entails the correlated responses of many thousands of adjacent and separated retinal receptors and neurons.
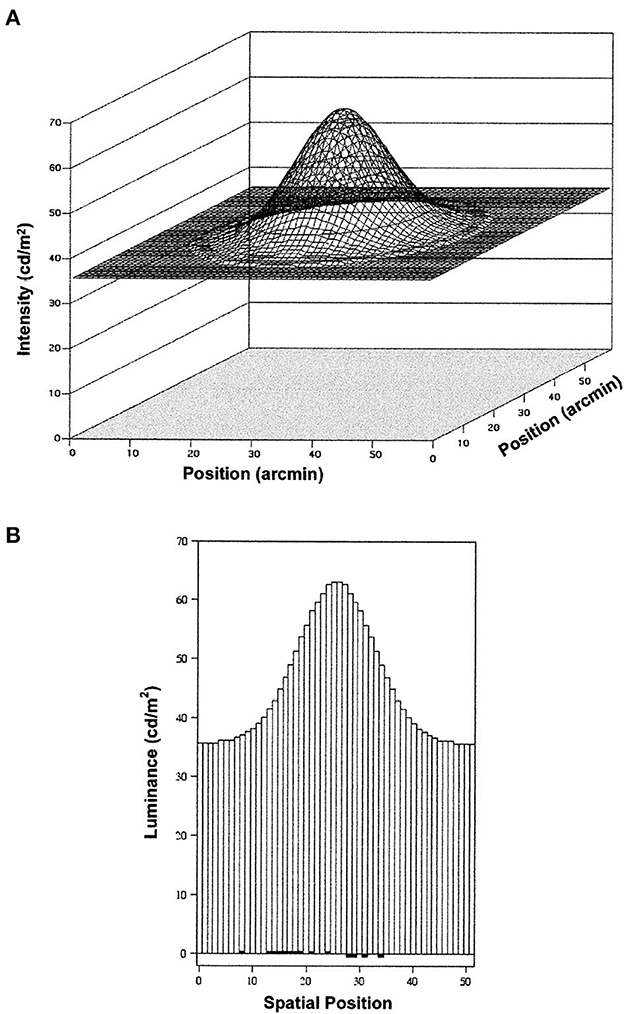
Figure 5. Luminance distributions for the Gaussian blobs and background in the study of Lappin et al. (2001). (A) is a smoothed surface plot of the luminance distribution, and (B) is a histogram showing the luminance at each 1 arcmin2 square pixel at a cross-section through the center of the blob. Dark areas at the bottom of this histogram show the increased and decreased luminance produced by a detectable leftward shift of 0.14 pixel. That displacement changed the luminance by one gray-scale unit (8-bit resolution, ~0.5 cd/m2) in 20% of the 1,272 pixels in the blob (reprinted from Lappin et al., 2001, p. 718).
The dipole structure of these motion-produced changes in stimulation is important for the visual sensitivity to motion. The visual importance of this dipole structure is shown by the results of experiments by Lappin et al. (2002). Discriminations of relative motion were compared with those for equivalent contrast changes in symmetrical (not dipole) oscillations that do not alter the blob's spatial position. Single blobs ranging in size from σ = 3 to 60 arcmin were oscillated at 3 Hz. Thresholds for detecting the stationary symmetrical oscillations were about 3 times greater than those for oscillating motions, although both were similar for the smallest blobs. The detection thresholds for contrast changes in large blobs averaged 0.09% for motion but 0.23% for stationary oscillations.
Lappin et al. (2002) evaluated the perceptual organization of these moving vs. stationary image changes by testing discriminations of phase differences in oscillations of center and flanking blobs. As expected, phase differences in motion were visually salient and effortlessly discriminated, but phase differences in the stationary symmetrical oscillations were difficult to perceive even when contrast oscillations of individual blobs were large and easily visible. Averaged across spatial separations of 80 and 240 arcmin and oscillation frequencies of 1, 3, and 8.5 Hz, contrast thresholds for discriminating in-phase vs. anti-phase oscillations averaged 0.21% for relative motion and 1.38% for stationary contrast oscillations. Thus, image motions were visually coherent, but stationary contrast oscillations were not.
As described above (footnote 5), correlations between these visual signals can be estimated from the oscillation detection thresholds for the center blob by itself, the two flanking blobs alone, and in-phase vs. anti-phase oscillations of the central and flanking blobs. These threshold estimates were obtained for three Gaussian blobs (σ = 10 arcmin) oscillating at 3 Hz, and separated in the phase discrimination task by 100 arcmin, and by 200 arcmin between the two blobs in the flanker oscillation threshold task. Thresholds for detecting oscillations of the center, flankers, and center/flanker phase difference were, respectively, 0.33, 0.34, and 0.23 arcmin. The estimated correlation was r = 0.76.
For the stationary (symmetrical) contrast oscillations, however, the thresholds (in corresponding spatial values) averaged 0.50, 0.69, and 1.32 arcmin, yielding an estimated negative correlation beyond r = −1.0 (see Lappin et al., 2002, for the computational rationale). Without very large contrast changes, the relative contrast oscillations of the separated image features were not simultaneously perceived.
Statistical coherence of perceived structure from motion
To perceive the organized structure of images, the visual system must integrate common motion. Aspects of the process resemble auto-correlation—a linear statistical correlation between optical patterns at neighboring spatial and temporal locations (Reichardt, 1961; Uttal, 1975). Auto-correlation functions are defined on the transformations that map successive images onto one another, not on the image coordinates per se. The general form of such functions can be written as
where φ is a transformation that maps a 2-dimensional image f1(x, y) at time 1 onto image f2(x, y) at time 2. Auto-correlations are sometimes presented as functions of horizontal and vertical translations, φ[f(x, y)] = f (x + Δx, y + Δy). In that special case, the functional distinction between the (x, y) image coordinates and the motion parameters Δx and Δy is not obvious. In more general cases, however, moving objects and observers often change relative viewing directions (rotating in 3D), which changes relative spaces between neighboring image features. And autocorrelations can also be defined on such image transformations. Psychophysical experiments have tested applications of autocorrelation to the statistical characteristics of both 2D and 3D structure from motion.
The statistical nature of motion integration was evident in early studies with random-dot patterns. Direction discriminations were found to increase with the area, number of elements, and inter-frame correlation, and decrease at low contrast and with greater spatial and temporal separations between images (e.g., Bell and Lappin, 1973; Lappin and Bell, 1976; van Doorn and Koenderink, 1982a,b; Chang and Julesz, 1983; Williams and Sekuler, 1984; van Doorn et al., 1985; van de Grind et al., 1992). To a reasonable approximation, visual detection of the coherence of these patterns operates as a linear system: The output signal/noise ratio (d') of motion discriminations increases proportionally with the input signal/noise ratio—with the percentage of elements with the same displacements, the square root of the number of elements, and the square root of the number of frames (Lappin and Bell, 1976; Lappin and Kottas, 1981).
The visual coherence of moving images is not limited to 2D translations. Rotations in the image plane, for example, involve a 360° range of directions and velocities that increase from the center of rotation. Nevertheless, discriminations of rotation direction and statistical coherence are as accurate as those for 2D translations (Bell and Lappin, 1979; Lappin et al., 1991).
Lappin et al. (1991) found similar visual sensitivities to the statistical coherence of barely visible small rapid random translations, rotations, expansions/contractions, and combinations of those transformations. In one experiment, the image positions of sparse dot patterns (e.g., 8 equally spaced dots on the circumference of a 10 deg diameter circle) were randomly sampled from normal distributions at 50 Hz for 1s, and observers discriminated between coherent images in which all dots were displaced by the same transformation vs. those in which displacements were independent for each dot. If observers could see any motions at all, they could see whether they were coherent or incoherent. And discrimination thresholds were similar for each transformation.
A similar experiment, also with small 50 Hz random image transformations, tested perceptual interactions between transformations. Coherence discriminations for one transformation were evaluated alone or when added to coherent random changes produced by another transformation. Coherence detections of rotations and expansions were the same whether or not one was added to the other. Violations of such linear independence were found when rotations or expansions were combined with random horizontal and vertical translations, but these violations were not large. Discriminations between coherent and incoherent rotations were 95% correct even when added to noisy backgrounds of uncorrelated translations of each dot. Thus, the perceptual organization of these rapid random image changes was governed by an essentially linear visual representation of the whole spatial pattern.
Importantly, the limiting spatial parameters for detecting these coherent motions are defined on the image rather than the retina. Limiting displacement distances between frames are proportional to the size of the pattern rather than the retinal distance (Bell and Lappin, 1973, 1979; Lappin and Bell, 1976; Chang and Julesz, 1983). This image scale-invariance is contrary to the idea that the perception of these patterns involves a “short-range process” limited by retinal spacing (Braddick, 1974).
Nonlinear visual coherence of three-dimensional structure and motion
The perceptual role of spatiotemporal structure is also clear in experiments on the perception of 3D structure from motion (e.g., Johansson, 1973; Braunstein, 1976; Rogers and Graham, 1979; Lappin et al., 1980; Doner et al., 1984; Todd and Norman, 1991; Perotti et al., 1998; Lappin and Craft, 2000). Analogous to Julesz's demonstrations of “cyclopean” perception of random-dot stereograms (Julsez, 1971; Julesz and Tyler, 1976; Tyler and Julesz, 1978), similar perception of surfaces moving in depth can also be achieved with two frames of random-dot cinematograms—where the perceived 3D organization derives from visually coherent motion between frames but is invisible in either frame alone.
Unlike the approximate linearity of perceived 2D image dynamics, however, perception of 3D structure and motion evidently involves nonlinear organization. Smooth surface structure and coherent motion between the successive frames are found to be important for perceiving the 3D organization.
As illustrated in Figure 6, Lappin et al. (1980) displayed two frames of dots randomly positioned on the surface of a sphere rotated around its central vertical axis between frames, with each frame 200 ms and no inter-frame interval. Despite each dot shifting in a curved trajectory that varies with its spherical position and in opposite directions on the front and back surfaces, the smooth surface and motion are immediately obvious to most naïve observers—if the dot positions are perfectly correlated in the two frames of the rotated surface.
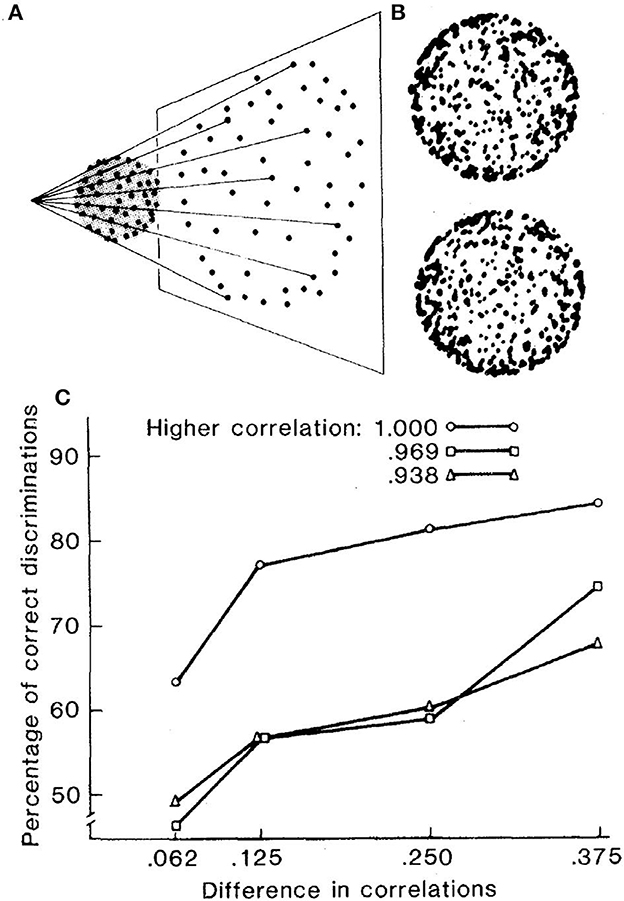
Figure 6. (A) Schematic illustration of the projected image of 512 dots randomly distributed with uniform probability density over the surface of a transparent sphere. (B) Photographic images of two successive frames of the sphere rotated by 5.6° around its vertical axis. Each frame was displayed in the experiment for 200 ms, with no interval between frames. (C) Average accuracies of four observers in discriminating between patterns with two different correlations in a 2-alternative forced choice task (reprinted from Lappin et al., 1980, p. 718).
The accuracy of these perceptions was evaluated by observers' coherence discriminations for patterns with different inter-frame correlations. Observers were about 63% correct in discriminating between displays with 100 vs. 94% correlated dot positions, and more than 80% correct in discriminating 100 vs. 75% correlated patterns. But small reductions in inter-frame correlations disrupted the visual coherence. Accuracy declined to <60% in discriminating patterns with 97 vs. 72% correlations. Thus, the visual coherence was nonlinear.
This nonlinear stability was studied further by Doner et al. (1984). Coherence discriminations improved substantially with added frames, and also when frame durations were reduced from about 240 to 60 ms. These and other results indicate that visual coherence of this 3D structure and motion involves self-organizing, globally cooperative processes. The coherent organization required integration of signals from opposite motion directions of dots on the transparent front and back surfaces of the sphere plus smoothly varying displacements in images of the spherically curved surfaces. Even though this 3D structure and motion is quite perceivable, its structural coherence is evidently less immediate than that of 2D image motions. Perceptual organization of some moving patterns seems to entail nonlinear visual dynamics (see Strogatz, 2003, 2018).
Spatial forms defined by differential motion
The statistical nature of visual coherence in dynamic random dot patterns might suggest that visual organization is mainly integrative, gaining information from common motion. Visual integration is insufficient, however. The spatial structure of moving optical patterns also involves differential motion, and perceiving that structure requires spatial differentiation as well as integration. Integration and differentiation are opposed but basic inter-dependent aspects of visual organization.
Evidence about a basic visual mechanism for differentiating image motion comes from discoveries by Tadin and colleagues. Tadin et al. (2003) found converging evidence about a counter-intuitive phenomenon: Larger moving patterns are often less visible. Evidently, visual motion mechanisms involve spatial suppression.
Figure 7, from Tadin et al. (2003), illustrates the suppressive effects—measured by temporal thresholds for discriminating the directions of gratings (1 cycle/deg) drifting (2°/s) within stationary Gabor patches of varied size and contrast. The motion directions of high-contrast gratings became substantially less discriminable as size increased from 0.7° to 5°; and large patches became less discriminable as contrast increased from 2.8 to 92%. The size of the most discriminable motions decreases as contrast increases (Tadin and Lappin, 2005). Tadin (2015) reviews many of the findings that clarify both neural mechanisms and visual functions of this spatial suppression. The neural mechanism—for integrating small patterns with low contrast and suppressing large patterns with high contrast—involves the center-surround antagonism of receptive fields of motion sensitive neurons in cortical area MT (Pack et al., 2005; Tadin et al., 2011; Tadin, 2015).
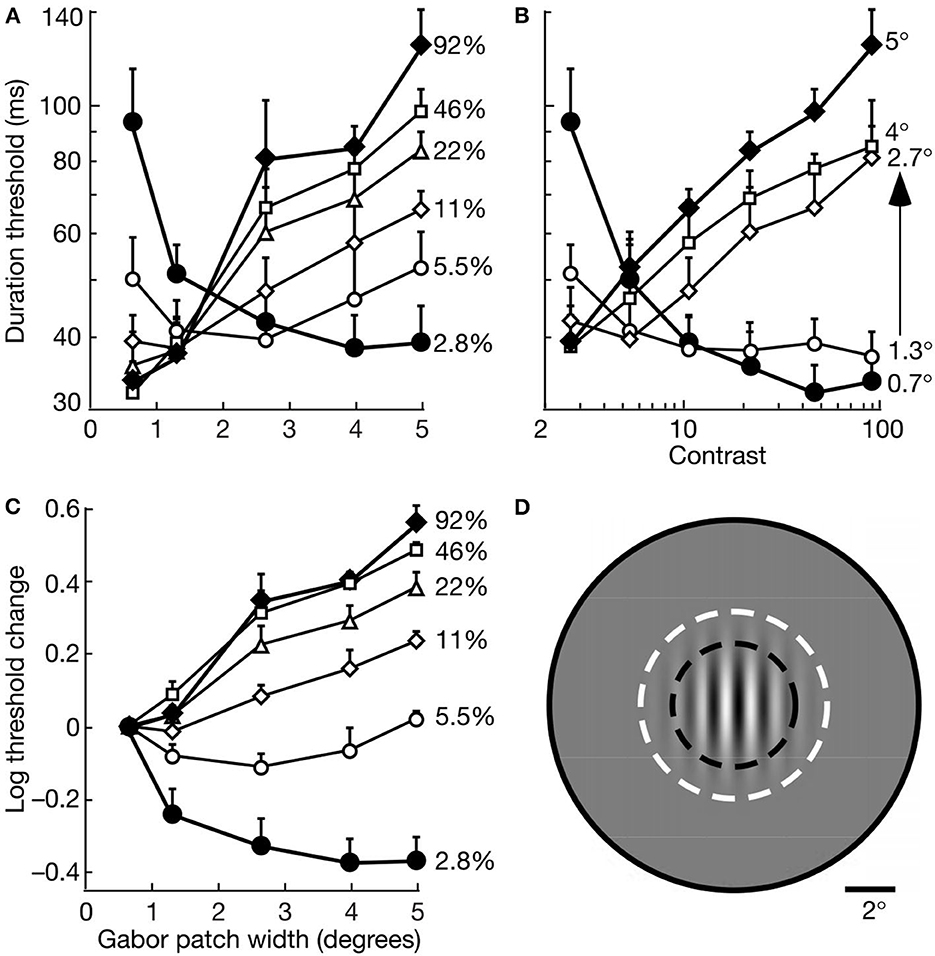
Figure 7. Motion discrimination depends on interactive effects of size and contrast. Data points are average thresholds for five observers. (A) Duration thresholds as a function of size for varied contrasts. (B) Duration thresholds as a function of contrast for varied sizes. (C) Log10 of threshold change as a function of size at varied contrasts. For each observer, the threshold change was evaluated relative to the duration threshold at the smallest size (0.7°) at each contrast. (D) A Gabor patch 2.7° wide is shown relative an average macaque foveal MT receptive field. The dark dashed lines indicate the size at which such cells often exhibit surround suppression, and the size of the surround is indicated by the full gray circle. The white dashed lines indicate the ±3σ radius of the Gabor patch (reprinted from Tadin et al., 2003, p. 313; Figure 1).
Center-surround antagonism is widespread in the visual nervous system because optical information entails spatiotemporal variations rather than merely total energy. This neural antagonism adds information—by segregating figure from ground.
Converging causal and correlational evidence about the role of spatial suppression in figure/ground organization was described recently by Tadin et al. (2019). Causal evidence was provided by the opposite effects of luminous contrast on two aspects of perceptual organization of moving patterns. A form discrimination task measured duration thresholds for discriminating the shape of an embedded form defined by opposite motion directions inside and outside the form. A motion discrimination task measured duration thresholds for discriminating the background motion without an embedded form. The two tasks are illustrated in Figures 8A, B.
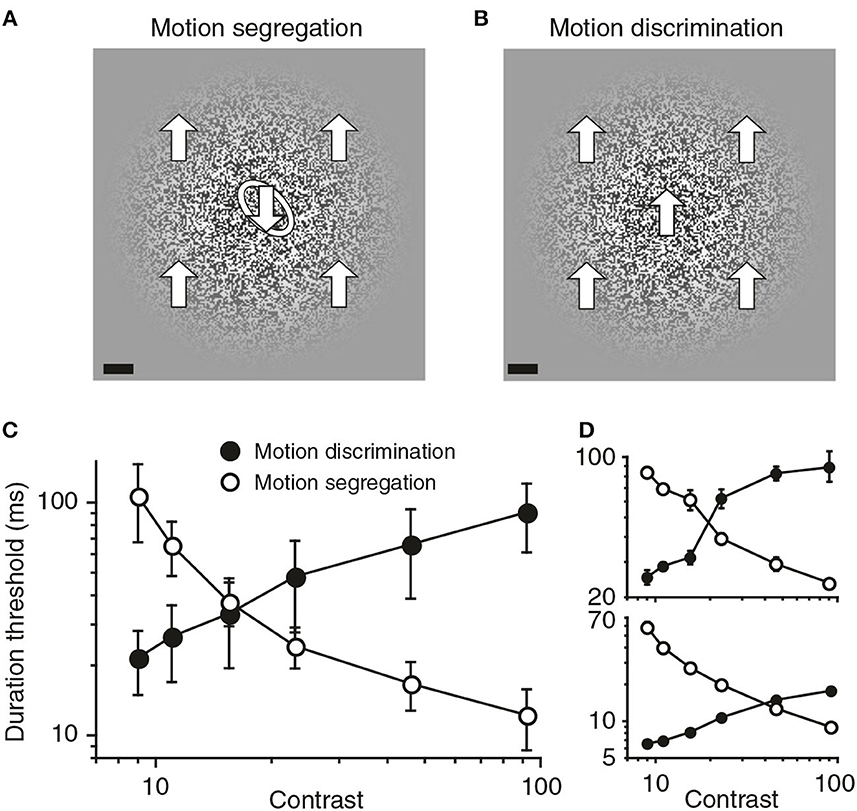
Figure 8. Visual segregation of an embedded form defined by differential motion becomes more effective when the background motion is visually suppressed. (A) In the motion segregation task, observers identified the tilt of a motion-defined oval, which could be tilted either left (as shown) or right. The large arrows that indicate motion directions and the white outline of the embedded oval are added here only for purposes of illustration. The scale bar at bottom left is 1°. (B) In the motion discrimination task, the background in (A) was presented without the embedded oval, and observers discriminated up vs. down directions of motion. (C) Group data showing the opposite effects of stimulus contrast on motion discrimination and motion segregation. Error bars are SEM. (D) Data for two individual observers (reprinted from Tadin et al., 2019, Figure 1, p. 3).
Figure 8C shows that the contrast of these moving patterns had reciprocal effects on the time durations needed for these two discrimination tasks. Increased contrast multiplied the duration thresholds for discriminating the background motion direction; but the same increased contrast divided the duration thresholds for form discrimination by an almost equal amount. Spatial suppression was responsible for both effects. Increased contrast suppressed the spatial integration of motion signals needed to discriminate motion directions, but this same suppression enhanced the spatial differentiation of motion in the form discrimination task.
The perceptual effects of this suppressive mechanism are also found in its influence on the perceptual characteristics of several different observer populations (Tadin, 2015). Older observers, for example, are found to be better (lower duration thresholds) than control populations in discriminating large high-contrast motions (e.g., Betts et al., 2009). These effects have been shown to be linked to reduced spatial suppression.
Importantly, the better perception of large high-contrast motion patterns by older observers is accompanied by a reduced ability to perceive spatial forms defined by differential motion. Interactive effects of age on integrating and differentiating moving patterns were demonstrated by Tadin et al. (2019). Form discrimination and motion discrimination by younger and older observers were evaluated for small patterns as well as large patterns like those in Figures 8A, B. As found in previous studies, the older observers had less spatial suppression and better motion discrimination of large patterns; but the older observers also had reduced efficiency in segregating forms defined by differential motion. This interactive effect of age on motion discrimination and form discrimination is correlational evidence that visual integration and differentiation play reciprocal roles in perceiving moving images.
Perception of surface structure from moving images
As mentioned earlier in this article, two basic principles of visual perception are that (a) retinal images are primarily images of surfaces, and (b) the 2nd-order differential structure of spatiotemporal images is isomorphic with that of environmental surfaces. These insights are mainly from Koenderink and van Doorn (1975, 1980, 1991, 1992a,b), Koenderink (1987, 1990). Local surface shape is quantified by the relative values of minimal and maximal curvature, and is specified in images by spatial changes produced by rotation in depth or by stereoscopic views. A substantial literature of theoretical, psychophysical, and engineering research has validated this spatiotemporal image information about surface shape. The top panel of Figure 9 illustrates the geometrical correspondence between 2nd-order structures of image motions and surface shapes.
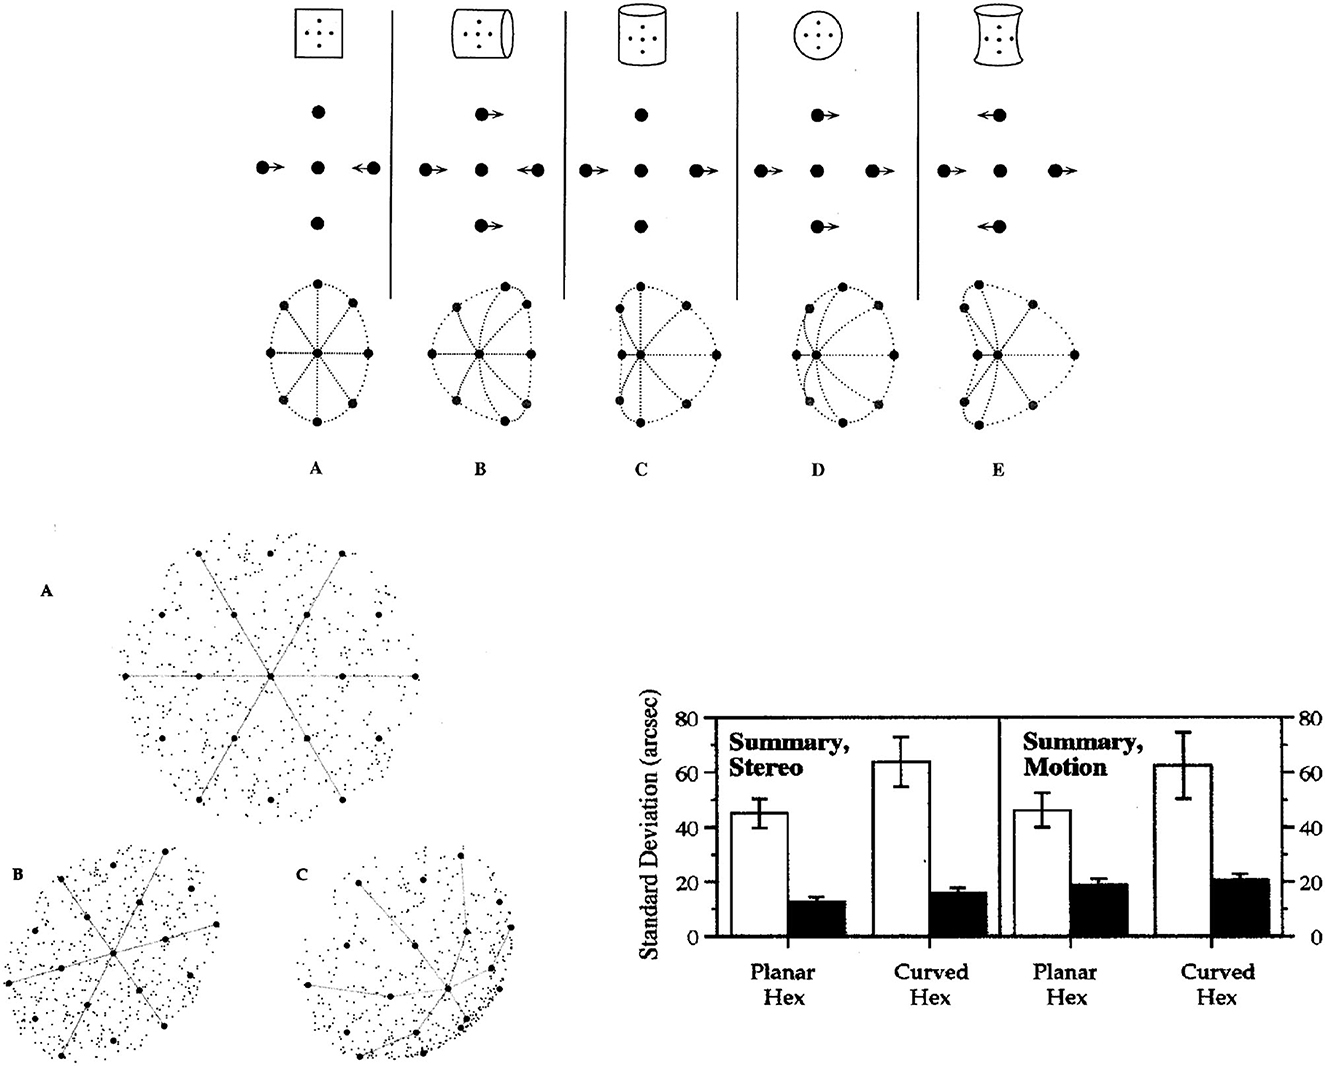
Figure 9. (Top) Five qualitatively different surface shapes are specified by their relative curvatures in the two orthogonal directions of minimum and maximum curvature. These five categories of surface shape are identifiable by 2nd-order image differences in stereoscopic images and relative motions produced by rotating the surface in depth. Relative values of the two principal surface curvatures are specified by such image pairs, but curvedness of the surface in depth is ambiguous. (Lower left) A schematic illustration of the planar and spherical surfaces used to test acuities for the position of the central target dot in 19-dot hexagonal patterns. The lines and speckled textures are added here only for purposes of illustration, and were not in the 19-dot patterns seen by the observers. The patterns contained 19 dots equally spaced in a hexagonal array, as seen in pattern A. Pattern B is an image of the planar surface tilted down and to the right. Pattern C is an image of the equally tilted spherical surface. Collinearities and relative spaces between dots are changed in the image when the spherical surface is tilted in depth, but neither bisection nor collinearity is altered by tilting the planar surface. (Lower right) The average acuities of three observers for centering surface position of the target dot (involving bisection and collinearity) and for adjusting the depth of the target dot onto the surface. Light bars indicate spatial bisection acuities, and dark bars indicate thresholds for binocular disparity or relative motion between the surface and target point (From Lappin and Craft, 2000. Copyright ©2000 by the American Psychological Association. Reproduced and adapted with permission).
Perception of this image information about surface shape was tested by Lappin and Craft (2000). The experimental strategy was analogous to that in Figure 2: We quantified visual acuities for the 3D position of a point on curved and planar surfaces, and tested the invariance of that perceptual precision under perturbations of lower-order spatial structure. Acuity for relative 3D position was tested with image motions produced both by rotating surfaces in depth and by stereoscopic images.
The spatial patterns were hexagonal arrays of 19 dots orthographically projected onto either a spherical or a planar surface, as illustrated in the lower left panel of Figure 9. The 19 dots were equally spaced on the surfaces, but their relative image positions were changed by tilting the surfaces in depth, by 20° around both horizontal and vertical axes, so that the surface normal was slightly upward to the left. The patterns were also varied by random image rotations of 0° to 50° around the direction of view (the lines and speckled texture in this figure are for illustration only and were not in the 19-dot patterns seen by the observers). The average image separation between adjacent dots was 1°. In the moving images, surface shapes were produced by two-frame alternating ±3° rotations around the vertical axis. In the stereoscopic images, the binocular disparity between the central target dot and its nearest neighbors was 5.9 arcmin. The observer's task in both moving and stereoscopic displays of both spherical and planar surfaces was to adjust the center dot to be equidistant from the 6 surrounding dots. In the images of the spherical surface, this central surface position was neither collinear with nor centered between the surrounding dots. That position on the spherical surface was defined by the relative curvatures in two directions. The relative values of the minimal and maximal curvatures specify the surface shape but not its extension in depth. Image C in the lower left panel of Figure 9 illustrates how spherical shape is specified by these relative image curvatures.
For the planar surface, however, that central surface position was specified by both collinearity and bisection in any single image of the surface. Collinearity and bisection are both 2nd-order relations among three points in a single image direction. As illustrated in image B in the lower left panel of Figure 9, images of the tilted planar surface preserved both collinearity and bisection. To isolate these (1-dimensional) 2nd-order relations on the planar surface, 1st-order (pair-wise) information about spatial separations was disrupted by random image expansions/contractions (±2%) that were uncorrelated between the two stereoscopic images and uncorrelated between the two successive images in the relative motion displays.
The observers used two joysticks to adjust two aspects of the 3D spatial position of the target dot at the center of the 19-point hexagon—to bisect the surface space between the surrounding dots, and to position it in depth onto the surface. The latter judgments involved minimizing relative motion or stereo disparity between the target point and the smooth surface specified by the other 18 points. Importantly, the latter judgments involved the shape the surface, not its curvedness or slant in depth, and not a depth scale per se.
The average stereoscopic and relative motion acuities of three observers for the bisection and depth positions on planar and spherical surfaces are shown in the lower right panel of Figure 9. The findings of principal interest are the hyperacuities for 2nd-order image information about surface shape. The average stereoacuities were 12.1 arcsec for the planar surface and 15.4 arcsec for the spherical surface. The average acuities for relative motion were 18.6 arcsec for the planar surface and 20.4 arcsec for the spherical surface. Subjectively, the perceived surface shapes were clear and unambiguous, consistent with the obtained hyperacuities.
Not surprisingly, bisections of relative distances on these surfaces were much less precise than placing the point's depth relative to the surface. And bisecting spaces were less precise on the curved than on the planar surface—presumably because the depth scale of the surfaces, rather than their shapes, is optically ambiguous in both stereoscopic and relative motion patterns.
General principles
The psychophysical and physiological results reviewed in this article indicate that the visual system obtains precise information about environmental surface structure from the intrinsic spatiotemporal structure of moving images. The eye's remarkable spatial acuity and contrast sensitivity derive from (a) dipole image contrast changes produced by image motions, (b) coherent temporal phase relations among spatially distributed neural response patterns, and (c) preservation of this spatiotemporal structure from retina to cortex. Spatiotemporal image structure is preserved to a surprising extent in transmission through the visual nervous system. In short, perceptual organization derives from the visual coherence of moving images.
Author contributions
This article was written by both authors, and both approved the submitted version. JL was the primary author, and HB contributed editorial suggestions, scientific content, and references.
Conflict of interest
The authors declare that the research was conducted in the absence of any commercial or financial relationships that could be construed as a potential conflict of interest.
Publisher's note
All claims expressed in this article are solely those of the authors and do not necessarily represent those of their affiliated organizations, or those of the publisher, the editors and the reviewers. Any product that may be evaluated in this article, or claim that may be made by its manufacturer, is not guaranteed or endorsed by the publisher.
Footnotes
1. ^This dipole contrast change involves a spatiotemporal relation between two images. If the position shift is defined relative to the flanking lines, then motion of the target bar changes the relative position of the target and flankers. Experiments have shown that such spatial relations are important for acuities in both stationary and moving images (e.g., Legge and Campbell, 1981; Lappin and Craft, 2000). Moreover, the difference between the target vs left flanker and target vs. right flanker involves a difference of differences—a change in 2nd-order differential image structure. The nature and function of such 2nd-order structure are discussed below.
2. ^Zero-order spatial relations are defined by absolute spatial positions; 1st-order spatial derivatives involve relations between pairs of points; and 2nd-order spatial derivatives involve relations among three points defined by differences in the pair-wise distances on either side of a given point. The 2-dimensional structure of such differences of differences identify the local shapes of smooth surfaces—as illustrated in the top panel of Figure 9.
3. ^Hyperacuity refers to spatial resolution that exceeds a limit of about ½ arcmin or 30 cycles per degree imposed by the human eye's optical diffraction and by separations of about ½ arcmin between cones in central fovea.
4. ^“Coherence” is used here with essentially the same meaning as in optics and lasers—based on and measured by correlated variations. In both optics and vision, coherent phase relations resolve spatial scales much finer than the wavelengths of uncorrelated variations.
5. ^Let S represent the standard deviations corresponding to the motion thresholds at d' = 1.0. And let the subscripts C, F, and D designate vectors corresponding to motion distances of the center, flankers, and center-flanker difference—where D is the difference vector between the ends of C and F joined at their base. By the law of cosines, S = S + S – 2 SC SF (cos δ), where δ is the angle between vectors C and F, and cos δ = r. Lappin et al. (2001) used a more complex formulation that yielded a similar value.
References
Anstis, S. M. (1974). A chart demonstrating variations in acuity with retinal position. Vision Res. 14, 589–592. doi: 10.1016/0042-6989(74)90049-2
Banks, M. S., Sekuler, A. B., and Anderson, S. J. (1991). Peripheral spatial vision: limits imposed by optics, photoreceptors, and receptor pooling. J. Opt. Soc. Am. A 8, 1775–1787. doi: 10.1364/JOSAA.8.001775
Bell, H. H., and Lappin, J. S. (1973). Sufficient conditions for the discrimination of motion. Percept. Psychophys. 14, 45–50. doi: 10.3758/BF03198616
Bell, H. H., and Lappin, J. S. (1979). The detection of rotation in random-dot patterns. Percept. Psychophys. 26, 415–417. doi: 10.3758/BF03204169
Betts, L. R., Sekuler, A. B., and Bennett, P. J. (2009). Spatial characteristics of center- surround antagonism in younger and older adults. J. Vision 9, 1–15. doi: 10.1167/9.1.25
Borghuis, B. G. (2003). Spike timing precision in the visual front-end (Ph.D. thesis). Utrecht University Library, Utrecht, The Netherlands. ISBN: 90-393-3293-2.
Borghuis, B. G., Tadin, D., Lankheet, M. J. M., Lappin, J. S., and van de Grind, W. (2019). Temporal limits of visual motion processing: Psychophysics and neurophysiology. Vision 3, 1–17. doi: 10.3390/vision3010005
Braddick, O. (1974). A short-range process in apparent motion. Vision Res. 14, 519–527. doi: 10.1016/0042-6989(74)90041-8
Braunstein, M. L. (1976). Depth perception through motion. New York: Academic Press. doi: 10.1016/B978-0-12-127950-9.50010-1
Chang, J. J., and Julesz, B. (1983). Displacement limits, directional anisotropy and direction versus form discrimination in random-dot cinematograms. Vision Res. 23, 639–646. doi: 10.1016/0042-6989(83)90070-6
Chichilnisky, E. J., and Kalmar, R. S. (2003). Temporal resolution of ensemble visual motion signals in primate retina. J. Neurophysiol. 23, 6681–6689. doi: 10.1523/JNEUROSCI.23-17-06681.2003
Doner, J., Lappin, J. S., and Perfetto, G. (1984). Detection of three-dimensional structure in moving optical patterns. J. Exper. Psychol. 10, 1–11. doi: 10.1037/0096-1523.10.1.1
Intoy, J., and Rucci, M. (2020). Finely tuned eye movements enhance visual acuity. Nat. Commun. 11, 795. doi: 10.1038/s41467-020-14616-2
Johansson, G. (1973). Visual perception of biological motion and a model for its analysis. Percept. Psychophys. 14, 201–211. doi: 10.3758/BF03212378
Julesz, B., and Tyler, C. W. (1976). Neurontropy, an entropy-like measure of neural correlation in binocular fusion and rivalry. Biol. Cyber. 23, 25–32. doi: 10.1007/BF00344148
Koenderink, J. J. (1987). “An internal representation of solid shape based on the topological properties of the apparent contour,” in Image Understanding 1985-1986, eds. W. Richards and S. Ullman (Norwood, NJ: Ablex) 257–285.
Koenderink, J. J., and van Doorn, A. J. (1975). Invariant properties of the motion parallax field due to the movement of rigid bodies relative to the observer. Optica Acta 22, 773–791. doi: 10.1080/713819112
Koenderink, J. J., and van Doorn, A. J. (1980). Photometric invariants related to solid shape. Optica Acta 27, 981–996. doi: 10.1080/713820338
Koenderink, J. J., and van Doorn, A. J. (1991). Affine structure from motion. J. Opt. Soc. Am. A 8, 377–385. doi: 10.1364/JOSAA.8.000377
Koenderink, J. J., and van Doorn, A. J. (1992a). Second-order optic flow. J. Opt. Soc. Am. A 9, 530–538. doi: 10.1364/JOSAA.9.000530
Koenderink, J. J., and van Doorn, A. J. (1992b). Generic neighborhood operators. IEEE Trans. Patt. Analy. Mach. Intell. 14, 597–605. doi: 10.1109/34.141551
Kowler, E. (2011). Eye movements: The past 25 years. Vision Res. 51, 1457–1483. doi: 10.1016/j.visres.2010.12.014
Lappin, J. S., and Bell, H. H. (1976). The detection of coherence in moving random-dot patterns. Vision Res. 16, 161–168. doi: 10.1016/0042-6989(76)90093-6
Lappin, J. S., and Bell, H. H. (2021). Form and function in information for visual perception. I-Perception. 12, 1–22. doi: 10.1177/20416695211053352
Lappin, J. S., and Craft, W. D. (2000). Foundations of spatial vision: From retinal images to perceived shapes. Psychol. Rev. 107, 6–38. doi: 10.1037/0033-295X.107.1.6
Lappin, J. S., Doner, J., and Kottas, B. L. (1980). Minimal conditions for the visual detection of structure and motion in three dimensions. Science. 209, 717–720. doi: 10.1126/science.7394534
Lappin, J. S., Donnelly, M. P., and Kojima, H. (2001). Coherence of early motion signals. Vis. Res. 41, 1631–1644. doi: 10.1016/S0042-6989(01)00035-9
Lappin, J. S., and Kottas, B. L. (1981). The perceptual coherence of moving visual patterns. Acta Psychol. 48, 163–174. doi: 10.1016/0001-6918(81)90058-5
Lappin, J. S., Norman, J. F., and Mowafy (1991). The detectability of geometric structure in rapidly changing optical patterns. Perception 20, 513–528. doi: 10.1068/p200513
Lappin, J. S., Nyquist, J. B., and Tadin, D. (2004a). Acquiring visual information from central and peripheral fields [Abstract]. J. Vision 5, 161. doi: 10.1167/5.8.161
Lappin, J. S., Nyquist, J. B., and Tadin, D. (2004b). Coordinating central and peripheral vision of stationary and moving patterns [Abstract]. J. Vision 4, 61. doi: 10.1167/4.11.61
Lappin, J. S., Tadin, D., Nyquist, J. B., and Corn, A. L. (2009). Spatial and temporal limits of motion perception across variations in speed, eccentricity, and low vision. J. Vision. 30, 1–14. doi: 10.1167/9.1.30
Lappin, J. S., Tadin, D., and Whittier, E. J. (2002). Visual coherence of moving and stationary image changes. Vision Res. 42, 1523–1534. doi: 10.1016/S0042-6989(02)00062-7
Legge, G. E., and Campbell, F. W. (1981). Displacement detection in human vision. Vision Res. 21, 205–213. doi: 10.1016/0042-6989(81)90114-0
Martinez-Conde, S., Macknik, S. L., and Hubel, D. (2004a). The role of fixational eye movements in visual perception. Nat. Rev. Neurosci. 5, 229–241. doi: 10.1038/nrn1348
Martinez-Conde, S., Macknik, S. L., Troncoso, X. G., and Hubel, D. (2004b). Microsaccades: a neurophysiological analysis. Trend Neurosci. 32, 463–474. doi: 10.1016/j.tins.2009.05.006
McKee, S. P., Welch, L., Taylor, D. G., and Bowne, S. F. (1990). Finding the common bond: Stereoacuity and the other hyperacuities. Vision Res. 30, 879–891. doi: 10.1016/0042-6989(90)90056-Q
Pack, C. C., Hunter, J. N., and Born, R. T. (2005). Contrast dependence of suppressive influences in cortical area MT of alert macaque. J. Neurophysiol. 93, 1809–1815. doi: 10.1152/jn.00629.2004
Perotti, V. J., Todd, J. T., Lappin, J. S., and Phillips, F. (1998). The perception of surface curvature from optical motion. Percept. Psychophys. 60, 377–388. doi: 10.3758/BF03206861
Ratliff, F. (1965). Mach Bands: Quantitative Studies on Neural Networks in the Retina. San Francisco: Holden-Day.
Reichardt, W. (1961). “Autocorrelation: A principle for the evaluation of sensory information by the central nervous system,” in Sensory communication, ed. W.A. Rosenblith (New York: Wiley) 303–318.
Rogers, B. J., and Graham, M. (1979). Motion parallax as an independent cue for depth perception. Perception 8, 125–134. doi: 10.1068/p080125
Rucci, M., Iovin, R., Poletti, M., and Santini, F. (2007). Miniature eye movements enhance fine spatial detail. Nature 447, 851–855. doi: 10.1038/nature05866
Rucci, M., and Poletti, M. (2015). Control and functions of fixational eye movements. Ann. Rev. Vision Sci. 1, 499–518. doi: 10.1146/annurev-vision-082114-035742
Strauss, S., Korympidou, M. M., Ran, Y., Franke, K., Schubert, T., Baden, T., et al. (2022). Center-surround interactions underlie bipolar cell motion sensitivity in mouse retina. Nat. Communic. 13, 1–18. doi: 10.1038/s41467-022-32762-7
Strogatz, S. H. (2003). Sync: How Order Emerges From Chaos in the Universe, Nature and Daily Life. New York: Hyperion.
Strogatz, S. H. (2018). Nonlinear Dynamics and Chaos, second edition. Boca Raton, FL: CRC Press. doi: 10.1201/9780429492563
Tadin, D. (2015). Suppressive mechanisms in visual motion processing: From perception to intelligence. Vision Sci. 115A, 58–70. doi: 10.1016/j.visres.2015.08.005
Tadin, D., and Lappin, J. S. (2005). Optimal size for perceiving motion decreases with contrast. Vision Res. 45, 2059–2064. doi: 10.1016/j.visres.2005.01.029
Tadin, D., Lappin, J. S., Gilroy, L. A., and Blake, R. (2003). Perceptual consequences of centre-surround antagonism in visual motion processing. Nature. 424, 312–315. doi: 10.1038/nature01800
Tadin, D., Park, W.-J., Dieter, K. C., Melnick, M. D., Lappin, J. S., and Blake, R. (2019). Spatial suppression promotes rapid figure-ground segmentation of moving objects. Nat. Commun. 10, 2732. doi: 10.1038/s41467-019-10653-8
Tadin, D., Silvanto, J., Pascual-Leone, A., and Batelli, L. (2011). Improved motion perception and impaired spatial suppression following disruption of cortical area MT/V5. J. Neurosci. 31, 1279–83. doi: 10.1523/JNEUROSCI.4121-10.2011
Todd, J. T., and Norman, J. F. (1991). The visual perception of smoothly curved surfaces from minimal apparent motion sequences. Percept. Psychophys. 50, 509–523. doi: 10.3758/BF03207535
Tyler, C. W., and Julesz, B. (1978). Binocular cross-correlation in time and space. Vision Res. 18, 101–105. doi: 10.1016/0042-6989(78)90083-4
van de Grind, W. A., Koenderink, J. J., and van Doorn, A. J. (1992). Viewing distance invariance of movement detection. Exper. Brain Res. 91, 135–150. doi: 10.1007/BF00230022
van de Grind, W. A., van Doorn, A. J., and Koenderink, J. J. (1983). Detection of coherent movement in peripherally viewed random-dot patterns. J. Optical Soc. Am. 73, 1674–1683. doi: 10.1364/JOSA.73.001674
van Doorn, A. J., and Koenderink, J. J. (1982a). Temporal properties of the visual detectability of moving spatial white noise. Exper. Brain Res. 45, 179–188. doi: 10.1007/BF00235777
van Doorn, A. J., and Koenderink, J. J. (1982b). Spatial properties of the visual detectability of moving spatial white noise. Exper. Brain Res. 45, 189–195. doi: 10.1007/BF00235778
van Doorn, A. J., Koenderink, J. J., and van de Grind, W. A. (1985). Perception of movement and correlation in stroboscopically presented noise patterns. Perception 14, 209–224. doi: 10.1068/p140209
Westheimer, G. (1979). The spatial sense of the eye. Proctor Lecture. Invest. Ophthalmol. Visual Sci. 18, 893–912.
Westheimer, G., and McKee, S. P. (1977). Perception of temporal order in adjacent visual stimuli. Vision Res. 17, 887–892. doi: 10.1016/0042-6989(77)90062-1
Keywords: dynamic images, coherence, perceptual organization, spatial resolution, psychophysics, hyperacuity, contrast, relative motion
Citation: Lappin JS and Bell HH (2023) The coherent organization of dynamic visual images. Front. Comput. Sci. 5:1124230. doi: 10.3389/fcomp.2023.1124230
Received: 14 December 2022; Accepted: 30 May 2023;
Published: 19 June 2023.
Edited by:
Mary Peterson, University of Arizona, United StatesReviewed by:
Taiki Fukiage, NTT Communication Science Laboratories, JapanCathleen Moore, The University of Iowa, United States
Copyright © 2023 Lappin and Bell. This is an open-access article distributed under the terms of the Creative Commons Attribution License (CC BY). The use, distribution or reproduction in other forums is permitted, provided the original author(s) and the copyright owner(s) are credited and that the original publication in this journal is cited, in accordance with accepted academic practice. No use, distribution or reproduction is permitted which does not comply with these terms.
*Correspondence: Joseph S. Lappin, am9lLmxhcHBpbkB2YW5kZXJiaWx0LmVkdQ==