 Andreas Foltyn
 Jessica Deuschel1
 Maximilian P. Oppelt
- 1Department Digital Health and Analytics, Fraunhofer IIS, Fraunhofer Institute for Integrated Circuits IIS, Erlangen, Germany
- 2Machine Learning and Data Analytics Lab (MaD Lab), Department Artificial Intelligence in Biomedical Engineering, Friedrich-Alexander-University Erlangen Nuremberg, Erlangen, Germany
Numerous studies have focused on constructing multimodal machine learning models for estimating a person's cognitive load. However, a prevalent limitation is that these models are typically evaluated on data from the same scenario they were trained on. Little attention has been given to their robustness against data distribution shifts, which may occur during deployment. The aim of this paper is to investigate the performance of these models when confronted with a scenario different from the one on which they were trained. For this evaluation, we utilized a dataset encompassing two distinct scenarios: an n-Back test and a driving simulation. We selected a variety of classic machine learning and deep learning architectures, which were further complemented by various fusion techniques. The models were trained on the data from the n-Back task and tested on both scenarios to evaluate their predictive performance. However, the predictive performance alone may not lead to a trustworthy model. Therefore, we looked at the uncertainty estimates of these models. By leveraging these estimates, we can reduce misclassification by resorting to alternative measures in situations of high uncertainty. The findings indicate that late fusion produces stable classification results across the examined models for both scenarios, enhancing robustness compared to feature-based fusion methods. Although a simple logistic regression tends to provide the best predictive performance for n-Back, this is not always the case if the data distribution is shifted. Finally, the predictive performance of individual modalities differs significantly between the two scenarios. This research provides insights into the capabilities and limitations of multimodal machine learning models in handling distribution shifts and identifies which approaches may potentially be suitable for achieving robust results.
1 Introduction
Cognitive load refers to the subjective, physiological state of mental effort that results from the dynamic interplay between an individual's finite cognitive resources and the demands placed upon them by a task. Task load represents the objective assortment of demands that a task inherently imposes on an individual. Together, these concepts form the cornerstone of our understanding of how tasks affect performance and well-being. Therefore, the recognition of cognitive overload could improve various working environments, such as education (Antonenko et al., 2010), public transportation (Fridman et al., 2018; Wilson et al., 2021) and situations that require high attention (Abrantes et al., 2017). Consequently, there is a need for robust cognitive load estimation models that perform well in different environments.
In recent years, many studies have been conducted for cognitive load estimation. Some studies have encompassed the data collection of a range of scenarios, including standardized tests (Beh et al., 2021), driving situations (Oppelt et al., 2023), and aviation scenarios (Wilson et al., 2021). Based on these data sets, approaches have been evaluated for their ability to infer cognitive load, utilizing different modalities (as outlined in Table 1). This body of research has explored classical machine learning strategies, advanced deep learning techniques, fusion methods and the impact of varying data processing approaches. Many of these papers primarily emphasize predictive performance while often overlooking two equally crucial evaluation aspects of learning systems: robustness and uncertainty estimation.
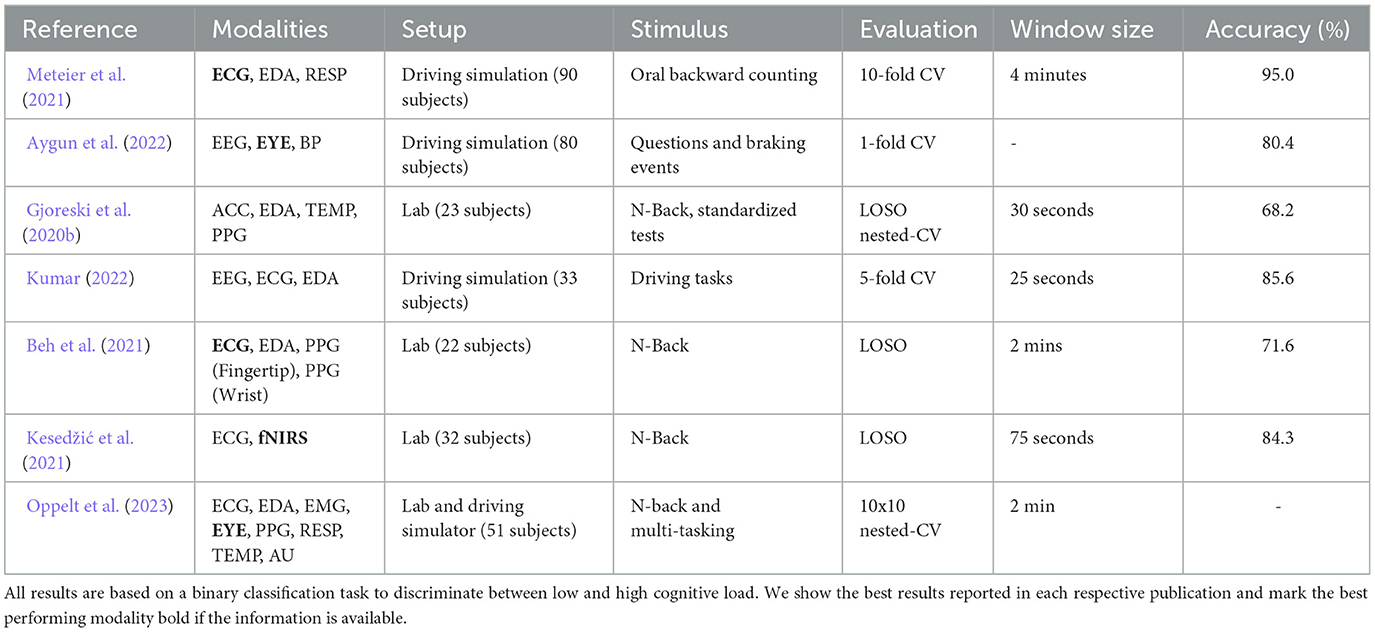
Table 1. Overview of recent publications evaluating cognitive load estimation models.
Robustness has different definitions in the literature. In this paper we refer to the ability of a model to maintain a relatively stable performance in spite of changes in the data distribution (Freiesleben and Grote, 2023). Such changes may arise from slight variations in the scenario, such as increased movement of a person during model deployment in comparison to training data, or sudden corruptions of individual modalities. Despite the challenges inherent in maintaining accuracy under these circumstances, it is vital that the model possesses the capacity to know what it does not know. This enables reliable predictions that can be trusted, which can be achieved through the use of well-calibrated uncertainty estimates. Furthermore, it opens up possibilities to extend the functionality of cognitive load estimation systems. For example, in instances where a prediction is deemed excessively uncertain, it can be discarded outright, or alternatively, the user can be prompted to input their current cognitive load level, thus enabling the system to adapt itself accordingly. This leads to the the following research gaps we address in this paper:
RQ1 How do machine learning, fusion, and data processing methods influence predictive performance and uncertainty estimation in estimating task load?
In this paper, we use data from participants exposed to tasks of varying difficulty and use these task assignments as labels to directly address task load estimation. Section 3.1.3 goes into more detail on how this relates to the definition of cognitive load. As a first step, we aim to investigate a range of classical machine learning, deep learning and fusion methods within a standard evaluation process. This means training and test data will come from participants who have performed the same task, ensuring minimal distribution shift. This will serve as the basis for comparing our methods to address our main research question:
RQ2 How does a data distribution shift influence the classification accuracy and uncertainty estimation in estimating task load?
To address this question, we subject the trained models to a different scenario where the user had to perform a different task, and evaluate the models from RQ1 for robustness and quality of uncertainty estimation. Consequently, we make the following contributions in this paper. We conduct a systematic investigation of unimodal and multimodal approaches, examining their impact on in-distribution classification performance and uncertainty estimates. We examine these methods in terms of distribution shifts and demonstrate their robustness. Our general desiderata for the task load estimation system are presented in Figure 1. Although this study does not directly measure cognitive load, it is important to note that task load, which we focus on, is related to cognitive load and can potentially serve as a noisy proxy for it. This potential is contingent upon verification, as we discuss in Section 3.1.3. Thus, our results can indeed be relevant to the assessment of cognitive load to a certain extent. However, it's crucial to underline that future research should aim to validate these findings with more precise cognitive load labels to ensure the applicability and accuracy of the assessment.
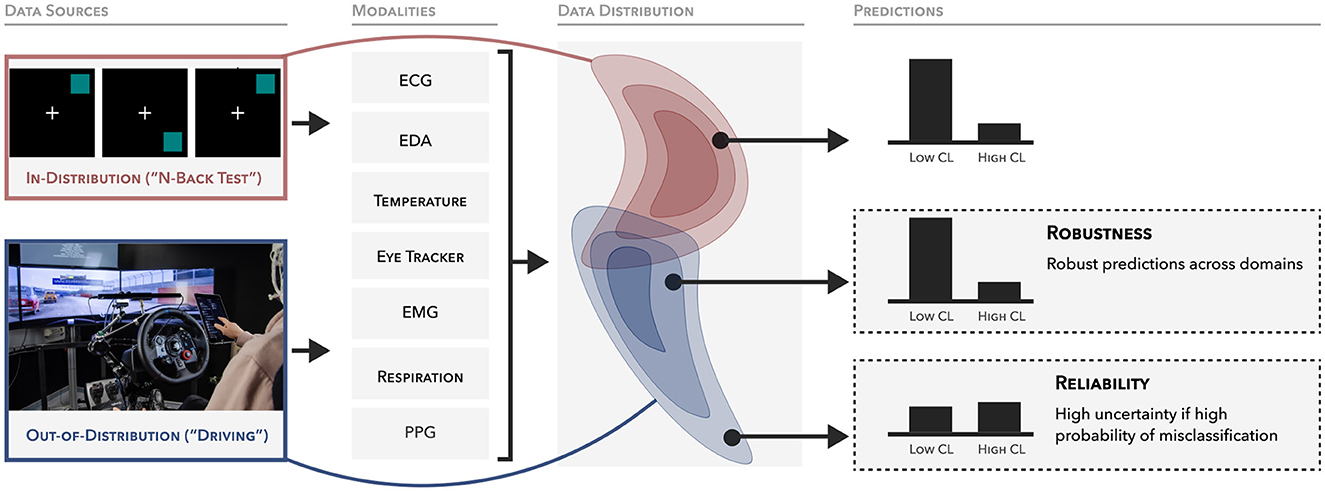
Figure 1. Overview of the experimental setup and desiderata of the model predictions. Data is collected from two domains: n-Back and k-Drive. The model is trained using the n-Back data and subsequently evaluated on both domains. Our main objective is to create a model that is highly accurate within its domain and capable of making robust predictions across other domains. It should also exhibit a high degree of uncertainty when faced with potential misclassifications.
2 Related work
2.1 Cognitive load
Cognitive load, intricately linked to the notion of mental workload, is a complex concept and has been defined in various ways throughout the literature (Paas and Van Merriënboer, 1994; Haapalainen et al., 2010; Orru and Longo, 2019; Longo et al., 2022). At its core, cognitive load encompasses the subjective physiological state of mental effort that emerges from the dynamic interplay between an individual's finite cognitive resources and the demands placed on them by a task. This understanding acknowledges both the subject involved and the task at hand as fundamental components in the conceptualization of cognitive load. Notably, Longo et al. (2022) offer a precise definition of cognitive load, describing it as “the degree of activation of a finite pool of resources, limited in capacity, while cognitively processing a primary task over time, mediated by external dynamic environmental and situational factors, as well as affected by static definite internal characteristics of a human operator, for coping with static task demands, by devoted effort and attention.” This definition highlights the interaction between external factors and an individual's inherent capabilities. In this context, task load represents the objective measure of task demands that directly influence this interplay.
2.2 Cognitive load measurement
Cognitive overload can be measured using subjective and objective approaches. Self-assessments can be used to get the subjective measure of workload, typically using standardized questionnaires such as the NASA Task Load Index (NASA-TLX) (Hart and Staveland, 1988). However, self-assessment questionnaires are limited in that they are usually completed after a task is performed, and they rely on individual perceptions, which can vary across people. Objective measures of cognitive load can be obtained through performance evaluation on a task and physiological measures. Performance-based measures can be categorized into two types. The first is based solely on the primary task performance, while the second considers both the primary and a secondary task performance as an indicator of workload. The evaluation of workload focuses on the spare mental capacity for the secondary task given the primary task demands (Paas et al., 2003). However, performance can also be influenced by other factors, such as the strategy a subject uses to solve the tasks, or the duration of the stimulus, whereby fatique causes a reduction in performance (Cain, 2007).
Another objective measure of cognitive load is physiological signals, which can be measured using various modalities. Eye tracking, for example, is an important indicator for detecting cognitive overload. Pupil dilation, saccades, blinks and fixations are the most important features that can be extracted from eye tracking data. In particular, pupil dilation is considered a good indicator of cognitive overload in the literature (Beatty, 1982; Palinko and Kun, 2012; Ayres et al., 2021; Rahman et al., 2021), as the variation can be influenced by emotional and cognitive processes (Bradley et al., 2008). However, pupil size also changes with illumination, which is a challenge to consider when analysing eye tracking data (Beatty and Lucero-Wagoner, 2000). Electroencephalography (EEG) can measure brain activity using electrodes placed on the head. These can be used to draw conclusions about cognitive processes. In principle, brain activity is a good indicator of cognitive processes (Ayres et al., 2021; Zhou et al., 2022). However, it is susceptible to noise artifacts caused by movements and the exact placement of the electrodes influences the correct measurement of the signals.
Cardiovascular activities can also provide insight into variations in cognitive overload. These include, for example, heart rate or heart rate variability (Ayres et al., 2021). However, there are some psychological and physical factors that can also influence these variables, such as activity and affective states.
2.3 Machine learning and cognitive load estimation
As discussed in Section 2.1, cognitive load is not a simple construct. When training machine learning models, the data must be annotated accordingly. This is generally a challenge in the field of affective computing when inferring psychological constructs (Booth et al., 2018). In the case of cognitive overload, various options can be considered for annotating the data, each with its own challenges. On one hand, the difficulty level of designated phases can be uniformly labeled across all individuals, regardless of their subjective experience, which is done by many approaches in the literature (Gjoreski et al., 2020a; Oppelt et al., 2023). While most papers refer to cognitive load or mental load, they are actually inferring task load. It's important to clarify that cognitive load can vary due to different influencing factors, even when the difficulty of the task remains constant. Alternatively, subjective ratings of participants can be used, such as the NASA-TLX. Although perceived cognitive load can be depicted, the issue lies in the fact that self-assessments are often challenging to compare across individuals. Finally, while performance can also serve as an indicator, its reliability can be compromised by factors unrelated to cognitive load. These include solution strategies, attention or fatigue. Seitz and Maedche (2022) provide a thorough overview of many cognitive load datasets and their respective types of annotation. There are also approaches that combine the mentioned methods for annotation (Dolmans et al., 2021).
Additionally, there is the question of how to formulate the target. In most publications, classification is used. Binary classification is the most commonly used method. A three-class division often proves to be quite difficult, presumably because it reflects the fuzziness of the construct (Gjoreski et al., 2020b). Alternatively, the problem can also be formulated as regression (Oppelt et al., 2023).
Models have been trained and evaluated for various scenarios in the literature. Several studies have been conducted using different modalities to infer cognitive load in the n-Back test (Beh et al., 2021; Kesedžić et al., 2021; Oppelt et al., 2023). Machine learning approaches have also been evaluated for application-oriented scenarios. Wilson et al. (2021) used an aviation simulation to induce overload through context-specific tasks. A number of papers have conducted driving simulations under laboratory conditions (Meteier et al., 2021; Oppelt et al., 2023) or in real-world settings (Fridman et al., 2018). Most datasets have been recorded under optimal conditions, making it unclear how robust models are to factors that could influence the ability to detect cognitive load. Albuquerque et al. (2020) used physical exercise to create an additional factor that influences the expression of some modalities, e.g. heart rate or skin conductance.
Table 1 provides an overview of relevant papers with important parameters of the experimental design and their results for binary classification. It encompasses data from EEG, electrocardiogram (ECG), photoplethysmography (PPG), blood pressure (BP), electromyogram (EMG), electrodermal activity (EDA), respiration rate (RESP), eye tracker (EYE), skin temperature (TEMP), accelaration data (ACC), and action units (AU). The selected results all come from experiments in which subject wise splitting was used. However, the exact evaluation protocols differ. The data splitting ranges from a 1-fold cross validation (CV) to a leave-one-subject-out (LOSO). It is important to note that comparing these results in a meaningful way is challenging, as many factors can impact the performance.
In other domains, deep learning approaches have already replaced classical machine learning methods that require expert features. An important prerequisite for this is having enough data to extract generalizable features. Aygun et al. (2022) provide a comparison of classical machine learning approaches with Convolutional Neural Networks (CNNs) and Recurrent Neural Networks (RNNs) that extract relevant features from raw physiological signals. In this case, methods that rely on expert features perform better. However, since deep learning approaches often provide good results in general time series literature, a possible reason for the difference is the small number of data points. Self-supervised approaches with EEG have been investigated for cognitive load estimation in this regard (Longo, 2022).
3 Methodology
3.1 Data
3.1.1 Data description
To answer our research questions, we need a cognitive load dataset that includes different modalities and also contains more than one stimulus in order to investigate robustness with respect to a data shift. Therefore, we use ADABase (Oppelt et al., 2023) for our experiments. In this dataset, two stimuli were utilized to induce cognitive overload: the n-Back test (Kirchner, 1958) and the simulated driving situation k-Drive. Both scenarios begin with baselines, in which no overload stimulus is provided. Subsequently, the subjects have to pass through different levels of difficulty, where they are increasingly overloaded. The n-Back test (Kirchner, 1958) is a standardized test for measuring the working memory capacity, where participants must remember the position of elements on a grid n steps before. By increasing n, the load on the working memory increases. In this dataset, participants were required to complete the n-Back test with varying difficulty levels, ranging from 1 to 3 steps. In addition to the single-task test described above, participants also completed a dual-task variant, as described by Jaeggi et al. (2003). This version introduces an auditory memory component that has to be performed concurrently with the visual task. In this setup, consonants are spoken by a computerized voice and have to be memorized using the n-Back approach analogous to that used in the visual task. This variant also included three levels of difficulty to further challenge participants. However, we do not use the dual-task data, as this would give us considerably more data in which the participants are overloaded. This would lead to class imbalance. Therefore, in the following we will only use data from the single-task variant. For the simulated driving situation k-Drive, the subjects had to react to various events, such as braking, in a driving scene. In the first level, subjects had to respond to only a few simple events during the driving scene. In levels 2 and 3, the complexity increased and a secondary task involved creating a playlist on a tablet. The dataset includes the following modalities: eye tracking, ECG, PPG, EDA, EMG, respiration, skin temperature, and action units. However, we exclude action units from the experiments due to the low predictive performance in Oppelt et al. (2023). The full dataset contains a total of 51 subjects. Individual erroneous or missing modalities were found in 5 subjects. These subjects were removed, leaving data from 46 subjects available for the experiments. All these subjects completed both n-Back and k-Drive.
3.1.2 Preprocessing
In the following section, we outline the preprocessing steps applied to the raw signals to make them suitable for training machine learning models. Initially, modality-specific preprocessing is conducted to eliminate potential artifacts, as outlined in Oppelt et al. (2023). This primarily involves removing outliers from the eye tracker data and detrending the ECG signal. Subsequently, the entire dataset is segmented into individual time frames using a rolling window approach. For our main experiments, we opt for a window size of 60 seconds with a stride of 10 seconds. Windows are selected only if at least the first 80% of the window matches a labeled segment, discarding windows where the label is more ambiguous. These extracted windows serve as the fundamental input for both the deep learning models and further feature extraction for the classical models. For all modalities we employ the same feature set utilized in the ADABase publication (Oppelt et al., 2023). The type of normalization plays an important role in affective computing. Features often have an individual-specific range, which means that subject normalization can lead to improved performance. This involves extracting the normalization parameters from the subject's data which is therefore only possible post hoc. For our main experiments, we use a subject wise z-score normalization using the mean and standard deviation per modality and subject. However, we also investigate the influence of normalization on in-domain and especially out-domain performance. For this purpose, an ablation study is also used to apply no normalization and a global normalization whose parameters are calculated from all training data points.
3.1.3 Annotation
ADABase provides three types of annotations that can potentially be used for machine learning tasks related to cognitive load: self-assessment using the NASA-TLX questionnaire, performance metrics, and information about the stimuli that mark the difficulty levels.
To understand whether these annotation strategies have the potential to be quantified, we align them with the components outlined in the Longo et al. (2022) definition of cognitive load. This definition states that the degree of activation of the finite pool of cognitive resources is influenced by various factors, including environmental and situational contexts, subject-specific internal characteristics, task demand, and the amount of effort and attention dedicated to a particular task. The NASA-TLX self-assessment method has the potential to represent perceived cognitive load as it can account for the impact of factors such as effort and task demand. However, self-assessments may be subject to biases and may not be consistently comparable across participants. Variations in the performance of primary tasks, such as the n-Back task, can be indicative of cognitive overload. Nonetheless, performance fluctuations can also be attributed to other factors like effort or attention, which may affect performance independently of the actual degree of activation of the finite cognitive resources.
In this study, we use the difficulty level of each task to create a binary classification. This allows us to operationalize the task demand as defined in the definition, as the annotation remains constant regardless of individual experience. Consequently, other factors, such as “effort and attention” or “internal characteristics,” are not taken into consideration. However, as shown in Figure 2, an increase in task difficulty is associated with an increased perception of cognitive load, as evidenced by the NASA-TLX self-assessments. Since we are making a rough binary distinction between a scenario with very little to no task demand and a demanding task, and there is a clear trend in perceived cognitive load when distinguishing between these two conditions, the label can be considered a noisy proxy for cognitive load, even though it only represents the task load component.
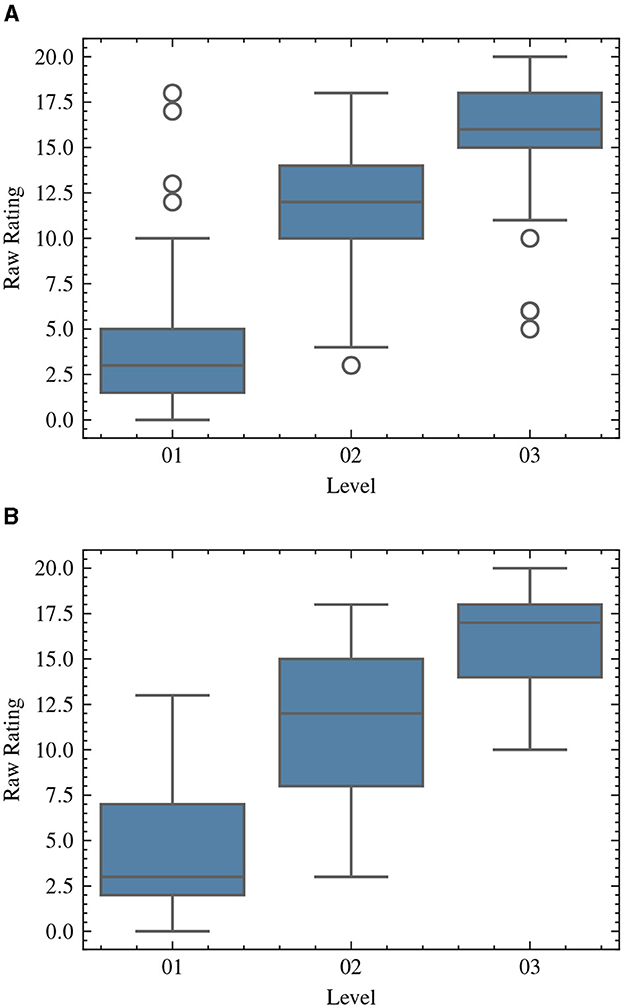
Figure 2. The NASA-TLX raw ratings of unweighted mental demand for each scenario in the ADABase dataset. (A) k-Drive. (B) n-Back.
Next, we show the precise methodology employed in generating labels based on task difficulty. We differentiate between low load and high task load by assigning each data point xi to a label yi∈{Low, High}. Each of the two stimuli contains different levels of difficulty. The n-Back test includes two baselines and a total of six difficulty levels, while the k-Drive test has three baselines and three difficulty levels. In the first baseline in both scenarios, the subjects are not exposed to any stimuli. The monitor is turned off and the subject is asked to sit quietly in the chair so that a baseline measurement of the biosignals can be made. In the n-Back, for the second baseline measurement, the subject is now exposed to the same visual stimulus as during the actual test and has to randomly press buttons. They are instructed not to make any mental effort. This ensures that the same movement patterns are present as in the actual test, as well as the same lighting conditions. In the case of the first baseline, you could tell whether the subject is in the baseline or the actual test by the light-induced pupil dilation variation. This could potentially lead to a spurious correlation in the ML models and impair the reliability of the evaluation. In the driving scenario, there are 2 baselines in addition to the first one. In both baselines there is the visual stimulus as in the real driving task. In the first baseline, the subject had to watch the driving scene and randomly click on buttons. In the second baseline, they were asked to perform a behavioral pattern similar to the secondary task by looking at the tablet and clicking randomly on it to simulate creating a playlist.
For answering RQ2, we also need to evaluate the transfer between n-Back and k-Drive. However, this is not trivial because the stimuli differ and consequently the strength of the exposed loads. Based on the self-assessment results presented in Figure 2, it is evident that the median ratings for levels 2 and 3 in both tests are above the midpoint of the rating scale. Conversely, level 1 has a low median rating. For the n-Back task, we define Low as {baseline2, level1}, and High as {level2, level3}. For k-Drive, we define Low as {baseline2, baseline3}, and High as {level2, level3}. Since we have two usable baselines available at k-Drive that closely resemble the actual test, we decided to use these for Low and not include level 1 to ensure a balanced class distribution.
3.2 Models and fusion
Below we describe the machine learning approaches used in the experiments. In general, the methods can be divided into classical machine learning and deep learning methods. Furthermore, the models can be applied to different numbers of modalities. The experiments investigate unimodal models as well as multimodal models, for which we use different fusion approaches. These are also described in this section.
3.2.1 Machine learning models
For our experiments, we use both classical machine learning (ML) and deep learning (DL) architectures. Classical machine learning refers to methods that rely on expertly crafted features, while deep neural networks, or deep learning, are capable of autonomously extracting features directly from raw data. As classical ML methods we use logistic regression, support vector machine (SVM) (Cortes and Vapnik, 1995) and XGBoost (Chen and Guestrin, 2016).
For the classification of time series data several deep learning architectures have been presented. These have often been evaluated on broad benchmark datasets such as UCR/UEA archive (Dau et al., 2019). Since the domain of affective computing differs from many in the benchmark datasets, we do not limit our evaluation to the architecture that has performed best on this benchmark but examine a small selection. We use the Fully Convolutional Network (FCN) (Wang et al., 2017), which is a simple architecture consisting of three convolutional layers with batch normalization. All layers have zero padding so that the length of the time series remains the same. Global average pooling is used to aggregate the features over the temporal dimension. As the FCN model is relatively simple, we additionally use a ResNet-1D adapted for time series data (Wang et al., 2017). These two architectures contain global pooling, which may cause a loss in temporal patterns. Therefore, we extend the ResNet-1D by a sequence model that is applied on the latent features instead of global pooling. Since the length of the time series is not reduced by the architecture, we first use a max pooling with pooling size of 1 second and stride of 0.5 seconds to reduce the length. A Gated Recurrent Unit (GRU) (Cho et al., 2014) is applied to this representation to aggregate the information over the temporal dimension. In the following, this architecture is referred to as ResNet1D-GRU. Figure 3 shows an overview of the used architectures.
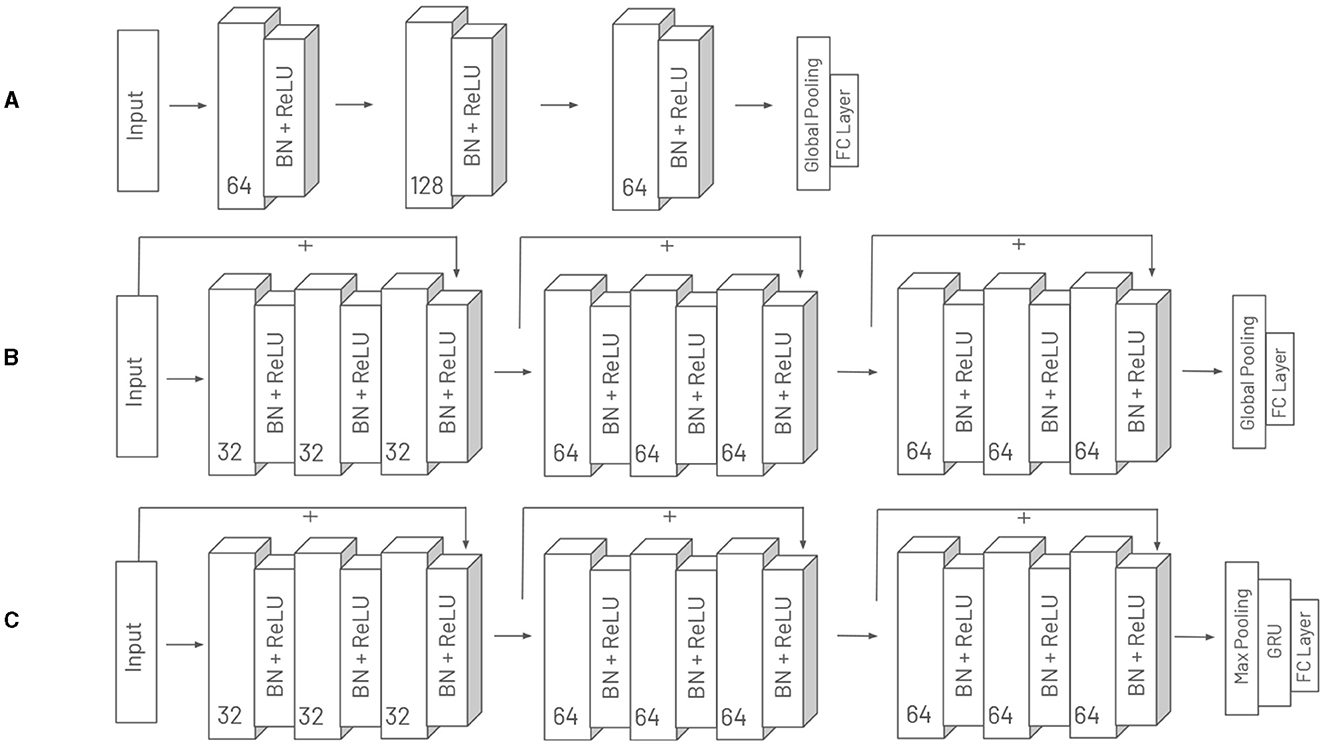
Figure 3. Overview of the three deep learning architectures employed in our experiments: (A) FCN, (B) ResNet-1D, and (C) ResNet1D-GRU. For each layer, the figure details the number of channels, the activation function used, and the application of batch normalization (BN).
3.2.2 Fusion methods
Multimodal approaches require the integration of information derived from individual modalities, and the choice of fusion method can significantly influence both accuracy and robustness. One simple approach that can be used on top of any classifier is late fusion. This involves training models for each modality independently and averaging the predictions from these models. Another simple approach is the concatenation of features of different modalities. For classical machine learning methods, expert features are concatenated prior to being fed into the classifier. In deep learning approaches, the learned latent features are concatenated. We refer to this fusion method as concat in our experiments In addition to these simple fusion methods, multi-modal gated units (Arevalo et al., 2020) for deep learning methods are also being investigated, which we refer to as gated fusion. These units use an input dependent gating mechanism that assigns weights to individual modalities. This dynamic fusion may allow for a more robust fusion when modalities are unreliable in a distribution shift.
3.3 Experimental setup
To conduct our experiments, we divide the data into training, validation and test sets using a subject-wise split, which ensures that no data points from the same subject appear in different subsets. For models that can monitor their overfitting behavior we use the validation set for early stopping. We use the model parameters from the epoch with the lowest validation loss. However, we allow the model to be trained until the end of the predefined epochs. Given the relatively small dataset, it is essential to use multiple splits to mitigate the possibility of an unfavorable split leading to biased evaluation. While a leave-one-subject-out approach is commonly used for subject-dependent data, it is not feasible for our experiments due to the computational complexity. Instead, we use a 4x4 nested cross-validation in the experiments. This approach helps us identify good hyperparameter settings and create a less biased estimate of the true error (Varma and Simon, 2006). The test sets of four outer folds are used for calculating the final reported results. The four inner folds are used for the hyperparameter optimization (HPO) for each outer fold. For the hyperparameter search we perform 25 trials per inner fold. Finally, using the best hyperparameter setting the model is trained ten times on the inner fold, if the model does not have a deterministic inference. Consequently, up to 440 training runs are performed per model. We use the Tree-structured Parzen Estimator (Bergstra et al., 2011) for the HPO using the library Optuna (Akiba et al., 2019). Table 2 shows the used hyperparameter search space. Figure 4 shows the overall experimental setup. For optimizing the deep learning models, we employ the ADAM optimizer (Kingma and Ba, 2015). Note that all experiments are performed in Python. The deep learning models are implemented using PyTorch (Paszke et al., 2019), while scitkit-learn (Pedregosa et al., 2011) is used for the other classical machine learning methods.
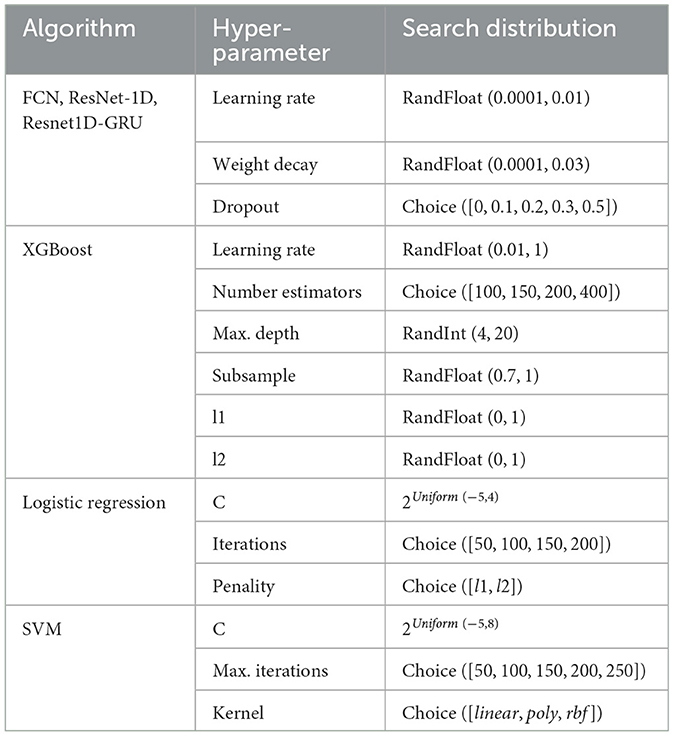
Table 2. Default hyper-parameters and random search grids for all algorithms.
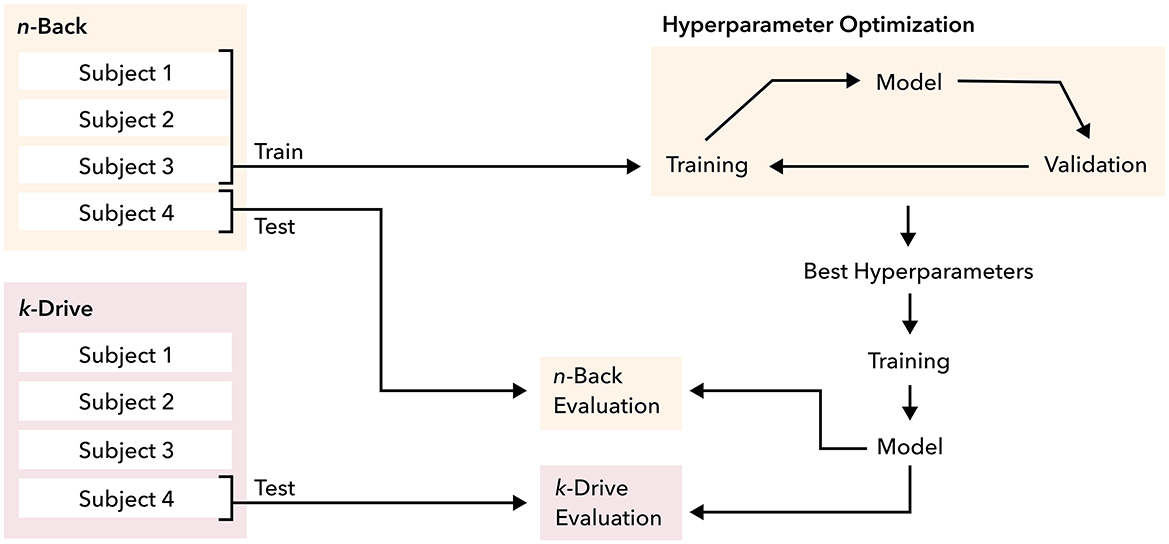
Figure 4. Training and evaluation setup using 4 × 4 nested cross-validation with an inner loop for optimal hyperparameter tuning. It is trained on n-Back and evaluated on n-Back and k-Drive test datasets.
3.4 Evaluation metrics
In this section, we describe the metrics used to evaluate classification performance and uncertainty estimates. Since our goal is to investigate robustness, we can look at the change in these performance metrics between n-Back and k-Drive. If the performance of a model decreases significantly, we can conclude that it lacks robustness with respect to this specific change in the data distribution. To evaluate the classification performance we use the F1-score because of a slight imbalance in the k-Drive dataset. For some analyses we also use the area under the receiver operating characteristic curve (AUROC). To assess the uncertainty estimation, we employ two metrics. Firstly, we utilize the Expected Calibration Error (ECE) (Guo et al., 2017). This metric provides a measure of confidence calibration, essentially quantifying the disparity between predicted probabilities and observed outcomes. The ECE is calculated by dividing the predicted probabilities into bins and contrasting them with the actual accuracy within those bins. In turn, this error diminishes when the confidence and accuracy for a specific bin come into alignment. The ECE is calculated using Equation 1:
Here, M represents the number of bins, Ni is the number of samples in the i-th bin, N is the total number of samples, acci denotes the accuracy of the i-th bin, and confi signifies the confidence of the i-th bin. The ECE is reported on a scale of 0 to 1, with 0 being the optimal value.
However, sometimes it is not necessary for this to match exactly. In the case of a human-in-the-loop system, for example, where a subject can self-correct certain mispredictions, it would be important that the misclassifications just have a higher uncertainty than correctly classified data points. For evaluating this, rejection curves (Malinin, 2019) can be used. The data points are sorted in descending order of uncertainty and sequentially replaced by ground truth labels. If the uncertainty correlates strongly with the misclassifications, then these misclassifications are quickly replaced with correct labels, causing the error to drop rapidly. If the uncertainties were absolutely uncorrelated with the misclassifications, then the error would fall linearly until the entire data set was replaced with ground truth labels. Whether the curve drops quickly or slowly can be calculated by the area under the curve. After normalizing this value with the random curve we get ARuns. We contrast this curve with the normalized area under the ideal curve ARorc, where the uncertainty perfectly correlates with the error. Our metric is the Rejection Ratio (RR) as shown in Equation 2:
The metric's range is between –1 and +1, with 1 indicating a perfect positive correlation between missclassification and uncertainty. If there is a negative correlation, meaning all high uncertainty data points are correctly classified, then the value approaches –1.
4 Results
This section presents the results of the experiments. Section 4.1 discusses the results of evaluating the unimodal and multimodal models on the n-Back data, addressing RQ1. Section 4.2 focuses on the evaluation of these models on the drive data, allowing us to investigate the robustness of the models and address RQ2. For all questions, both the classification accuracy and the quality of the uncertainty estimates are considered.
4.1 n-Back performance
In this section, we analyze the performance of models trained and evaluated on n-Back data. The classification performance for the modalities is detailed in Table 3. This table shows that eye tracking consistently achieves the highest F1-score across all models. Skin temperature, on the other hand, tends to yield the poorest classification results across most models. Notably, traditional machine learning methods generally outperform deep learning approaches, except in cases involving EMG data and skin temperature. Logistic regression, in particular, seems to deliver the best performance across most modalities.
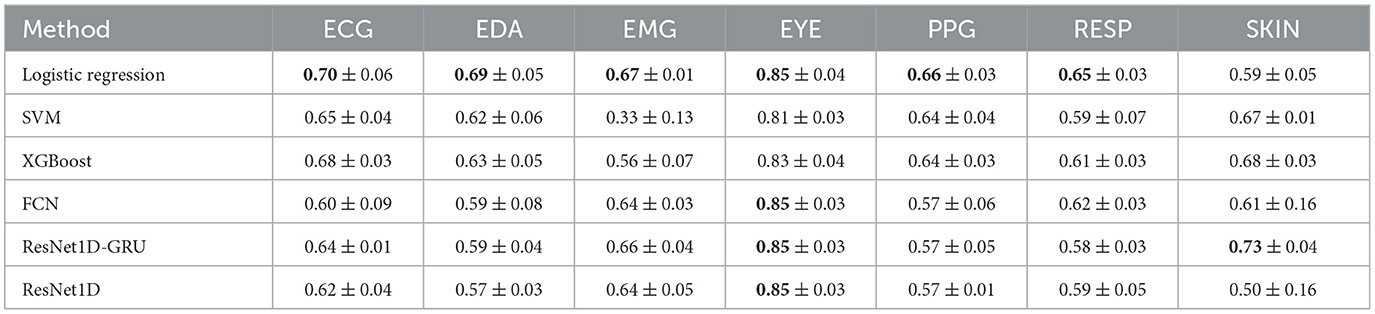
Table 3. This table shows the F1-score for models trained and evaluated on n-Back.
The results of multimodal fusion are presented in Table 4. Early fusion, using logistic regression, is shown to provide the best classification performance. Feature fusion generally leads to better classification results compared to late fusion, a trend that is also evident in the calibration error. However, this is not the case for the rejection rate, which varies between different models. Fusion approaches tend to produce classification performance that is either equal to or slightly better than the best unimodal performance for each model. In particular, among deep learning methods, gated fusion shows a tendency toward better classification accuracy and rejection rate. The Supplementary material includes detailed tables for the expected calibration error and rejection scores for all modalities and models. Although the multimodal models did not achieve an overall improvement in the uncertainty estimation compared to the best performing unimodal model, they did show a slight improvement in the rejection ratio.

Table 4. n-Back fusion results.
4.2 k-Drive performance
In this section we present the results of training on the n-Back data and evaluation on the k-Drive dataset. Table 5 shows the unimodal classification results of the k-Drive scenario. In Figure 5 we combine the results of n-Back and k-Drive to show how the performance of the unimodal models changes between the two scenarios. Notably, the eye tracker is no longer the most effective modality in this setting. Interestingly, the ECG and EMG modalities show improved performance compared to the n-Back scenario. However, there is no clear trend in the performance of the models. While classic machine learning models tend to outperform DL models in the n-Back, the results are now more ambiguous. For example, the ResNet1D-GRU model outperforms logistic regression.
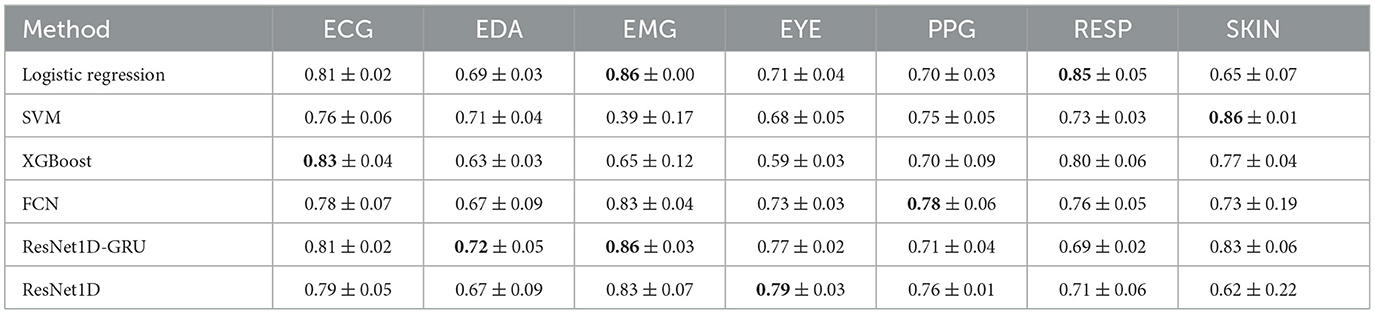
Table 5. This table shows the F1-score for models trained on n-Back and evaluated on k-Drive.
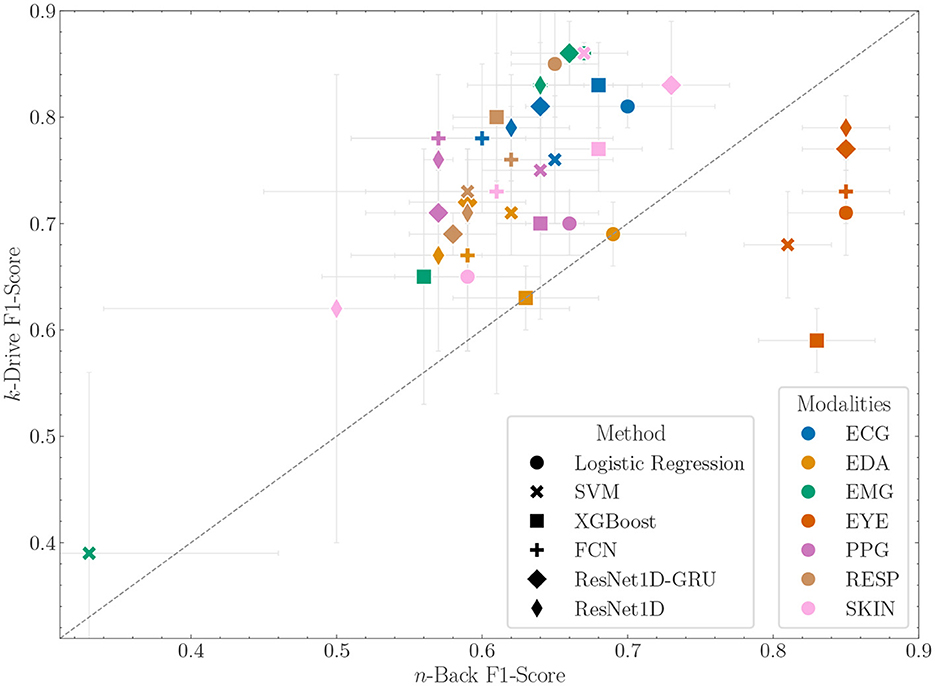
Figure 5. F1-score with standard deviation of unimodal models trained on the n-Back data and evaluated on n-Back (x-axis) and k-Drive (y-axis). Points above the bisector show better performance on the shifted dataset and performance below the bisector shows worse performance.
Next, we examine the results of multimodal approaches in Table 6. Figure 6 shows the comparison of the in-distribution F1-Score with the performance on the k-Drive dataset. In contrast to the in-distribution results, where early fusion outperforms late fusion, now the early fusion classification is inferior. This could be due to the changed importance of the modalities. For example, the reduced ability of the eye tracker to discriminate between low and high task load in k-Drive, based on n-Back training, affects early fusion where eye tracker features are critical. In late fusion, each modality contributes equally to the final prediction, mitigating this problem. For DL methods, this phenomenon is less pronounced, with late fusion slightly underperforming compared to intermediate fusion. Consequently, in FCN models, intermediate fusion achieves the best overall classification performance. It does not deviate from the predictive performance in the n-Back test, which makes it particularly robust. The Supplementary material includes detailed tables on calibration errors and rejection ratios for the models and modalities. It is important to note that multimodal fusion improved the rejection ratio compared to the best unimodal models within a model category.
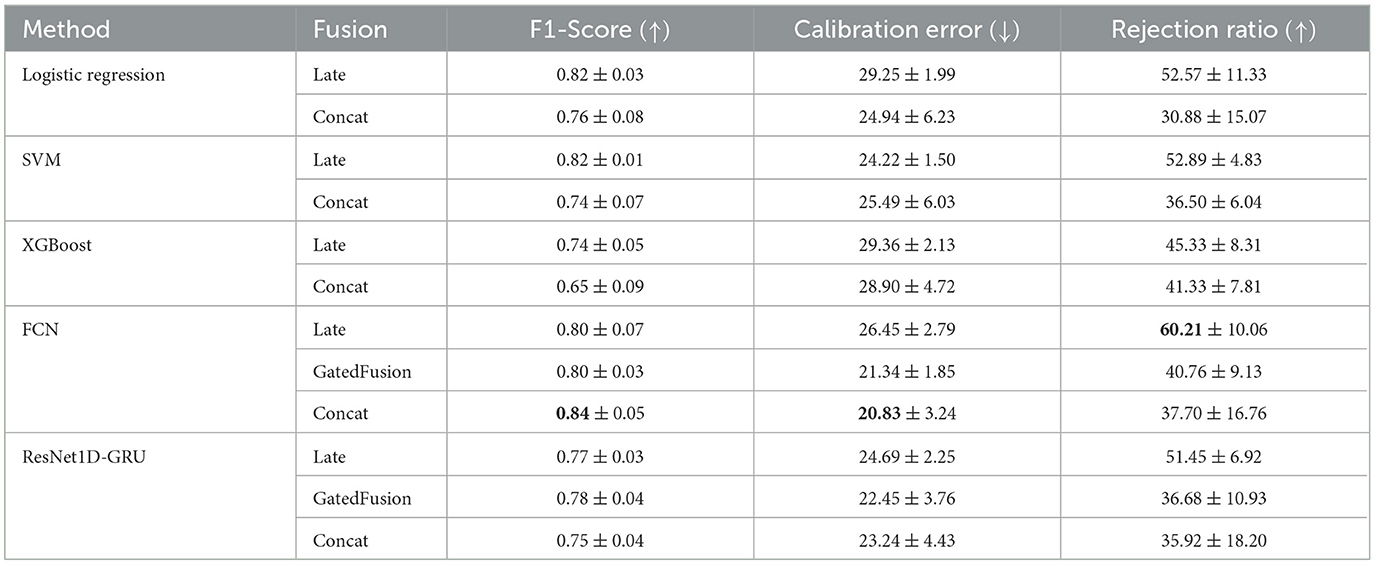
Table 6. k-Drive fusion results.
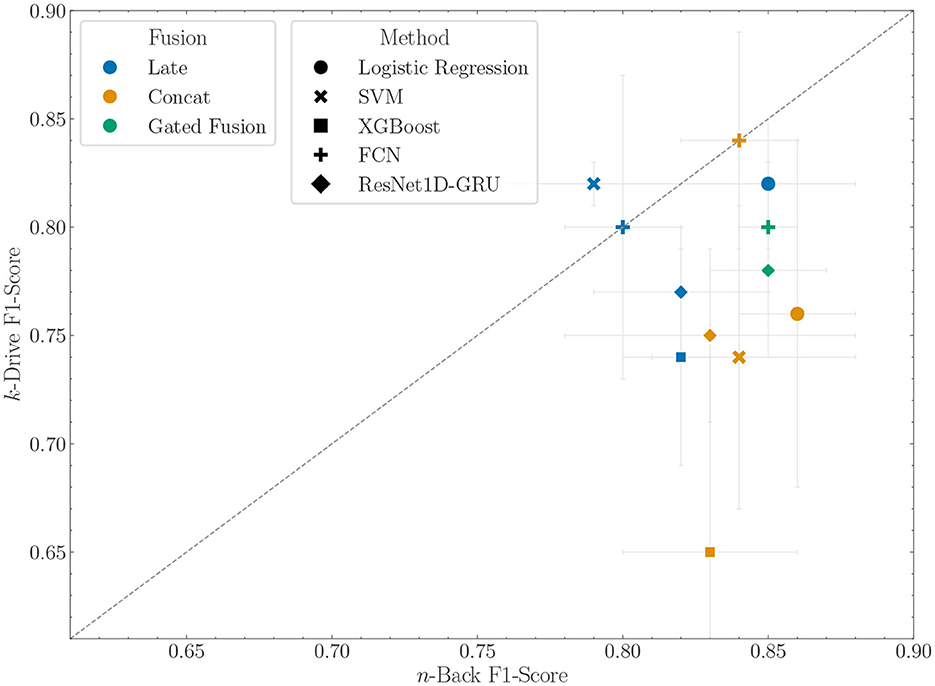
Figure 6. F1-score with standard deviation of fusion models trained on the n-Back data and evaluated on n-Back (x-axis) and k-Drive (y-axis). Points above the bisector show better performance on the shifted dataset and performance below the bisector shows worse performance.
Table 7 shows the results of an ablation study regarding the impact of different normalization approaches on the logistic regression fusion model with concatenated features vectors. In the n-Back performance analysis, we observe an incremental enhancement in logistic regression accuracy. The performance is least effective with no normalization, improves with global normalization, and reaches its best results using subject normalization. This clearly demonstrates the relative superiority of subject normalization over global normalization and no normalization in in-domain contexts. The scenario changes markedly in the k-Drive context. In this case, global normalization performed significantly worse, in contrast to the no normalization and subject normalization scenarios. Subject normalization continues to show superior performance. Interestingly, however, it was found that no normalization outperformed the global normalization. To investigate this further, we used the AUROC metric. This choice was made because AUROC indicates the separability of predictions, thus revealing whether adjusting the threshold might improve performance. In these evaluations global normalization outperforms no normalization.
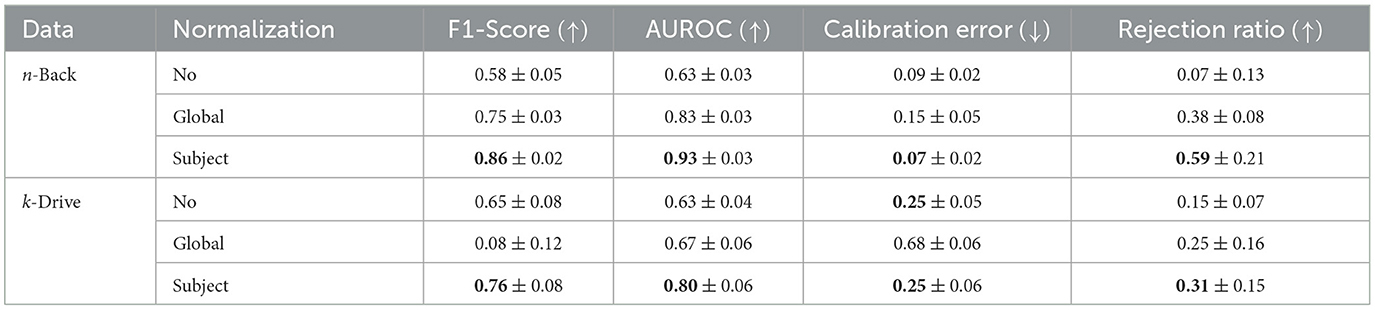
Table 7. Ablation study of normalization techniques on performance in different scenarios for early fusion logistic regression.
5 Discussion
Our investigation into various cognitive load estimation models both trained and evaluated on n-Back has yielded interesting insights. Notably, the eye tracker-based model exhibited the highest classification performance among all the models examined. This aligns with previous studies where eye tracking outperformed other modalities (Aygun et al., 2022; Oppelt et al., 2023). It is important to emphasize that the efficacy of eye tracking can be context-dependent. Factors like lighting conditions can significantly affect pupil size, a crucial indicator of cognitive overload.
When considering the models, it becomes evident that classic machine learning models tend to outperform deep learning models for in-distribution data, especially when applied to more complex signals like electrocardiography (ECG). A potential reason may be the limited dataset size, resulting in fewer generalizable features being learned. This is consistent with the results of Aygun et al. (2022), where DL models underperformed compared to classic ML models.
In addition to unimodal models, we also trained models employing various fusion techniques. However, none of these models showed an improvement compared to the top performing unimodal models. Other publications, however, demonstrate that multimodal combinations can indeed enhance classification performance. For instance, Oppelt et al. (2023) illustrated that integrating eye tracking data with biosignals can further enhance the performance of the eye tracker. The reasons for this disparate behavior can be diverse, e.g., differences in hyperparameter optimization. Nevertheless, within the realm of deep learning models, it has been repeatedly demonstrated that achieving superior performance with fusion models is non-trivial compared to the best unimodal performance (Wilson et al., 2021). Employing explainability methods might have provided insights into how different features influence classification performance across the two datasets. Such analysis could reveal not just the consistency of feature behavior across varied scenarios, but also show the specific contributions of each modality or feature within the intermediate fusion models. By combining explainable AI with robustness analysis, as demonstrated in this study, future work can focus on finding multi-faceted explanations (Longo et al., 2024) that enhance system trustworthiness. This approach provides insights into both feature interactions for classification and the reliability of those interactions under changing scenarios.
The second research question focuses on the influence of different modeling decisions on performance in a different scenario. Concerning unimodal performance, we observe that the eye tracker exhibits poorer performance across all models compared to the n-Back scenario. This scenario lacks consistent lighting conditions, which could be the reason for to diminished performance. Interestingly, all other modalities perform better than in the n-Back. One possible explanation is that this scenario induces higher levels of cognitive overload, making the data more separable based on physiological features. It is also possible that another affective state, such as enjoyment of driving, has been induced, which has similar physiological characteristics to cognitive overload. Another explanation could be that variations in physiological modalities arise not primarily from a mental state, but rather from slightly increased movement due to switching between a tablet and a steering wheel. Regarding fusion methods, we note that late fusion tends to deliver superior classification performance under a distribution shift. One potential explanation is that the feature fusion models might overly focus on a specific subset of features, particularly those derived from the eye tracker. While fusion does not outperform the best unimodal performance, late fusion in particular provides a valuable compromise between in-distribution performance and robustness, as it provides good results in both scenarios. Choosing only the best unimodal model, i.e., an eye tracker model, would have significantly degraded performance. Another important finding of our work is that the ECE decreases for all models between the n-Back to the k-Drive scenario, even if the classification performance remains stable. While the rejection ratio also exhibits a decrease across models, the decline is notably less severe in the late fusion approach. This further emphasizes late fusion as an interesting fusion method to create robust and reliable models.
Several limitations of our study should be acknowledged. Firstly, a post-hoc calibration step for the models might have impacted their performance. Incorporating such a step could potentially lead to improved calibration scores. Secondly, our study was based on a single dataset, which limits the generalizability of our findings. Finally, it is important to acknowledge the presence of possible confounding factors within the dataset that could have influenced our results.
6 Conclusion and future work
In this paper, we contribute to the understanding of the capabilities and limitations of modeling task load in real world scenarios, especially considering the common occurrence of data shifts. To this end, we first analyzed various machine learning models and fusion approaches with in-distribution data in order to subsequently observe the influence of the distribution shift on the performance. In our investigation, we came to the conclusion that, on the one hand, late fusion is a good compromise to provide good classification performance and uncertainty estimation for both in-distribution and out-of-distribution data.
Future research should aim to investigate and improve the robustness of multimodal cognitive load estimation by exploring diverse datasets and examining different types of shifts. The initial study was conducted using the same hardware across scenarios. Investigating the effects of more significant shifts, such as those introduced by varying wearable devices, could prove beneficial. These shifts affect not only the stimulus but also the quality of the signal, providing insights into developing applications that perform reliably under real-world conditions. Furthermore, expanding our research to include new modalities such as EEG and utilizing other machine learning approaches could provide valuable insights. Another important aspect for future work is to investigate how these models can be adapted to new scenarios in a better way. This could be achieved by domain adaptation techniques that address how models can be effectively adapted to new domains in a supervised or unsupervised manner. Future research could also expand our robustness experiments to incorporate more precise indicators of cognitive load as described in Longo et al. (2022). For example, this can be done integrating a diverse range of factors such as effort and motivation through self-assessments. By combining these with measures like the performance, researchers could evaluate the robustness using a more precise annotation for cognitive load.
Data availability statement
Publicly available datasets were analyzed in this study. This data can be found here: https://adabase-dataset.github.io/.
Ethics statement
Ethical approval was not required for the study involving humans in accordance with the local legislation and institutional requirements. Written informed consent to participate in this study was not required from the participants or the participants' legal guardians/next of kin in accordance with the national legislation and the institutional requirements.
Author contributions
AF: Conceptualization, Formal analysis, Investigation, Methodology, Software, Supervision, Validation, Visualization, Writing – original draft, Writing – review & editing. JD: Conceptualization, Formal analysis, Investigation, Methodology, Software, Validation, Writing – original draft, Writing – review & editing. NL-R: Funding acquisition, Resources, Writing – review & editing. NH: Project administration, Resources, Writing – review & editing. MO: Conceptualization, Data curation, Formal analysis, Investigation, Methodology, Validation, Writing – original draft, Writing – review & editing.
Funding
The author(s) declare that financial support was received for the research, authorship, and/or publication of this article. The authors acknowledge the partial funding by the EU TEF-Health project which is part of the Digital Europe Programme of the EU (DIGITAL-2022-CLOUD-AI-02-TEFHEALTH) under grant agreement no. 101100700 and the Berlin Senate and the partial support by the Bavarian Ministry of Economic Affairs, Regional Development and Energy through the Center for Analytics-Data-Applications (ADA-Center) within the framework of “BAYERN DIGITAL II” (20-3410-2-9-8).
Conflict of interest
The authors declare that the research was conducted in the absence of any commercial or financial relationships that could be construed as a potential conflict of interest.
Publisher's note
All claims expressed in this article are solely those of the authors and do not necessarily represent those of their affiliated organizations, or those of the publisher, the editors and the reviewers. Any product that may be evaluated in this article, or claim that may be made by its manufacturer, is not guaranteed or endorsed by the publisher.
Supplementary material
The Supplementary Material for this article can be found online at: https://www.frontiersin.org/articles/10.3389/fcomp.2024.1371181/full#supplementary-material
References
Abrantes, A., Comitz, E., Mosaly, P., and Mazur, L. (2017). “Classification of eeg features for prediction of working memory load,” in Advances in The Human Side of Service Engineering, eds. T. Z. Ahram, and W. Karwowski (Cham: Springer International Publishing), 115–126. doi: 10.1007/978-3-319-41947-3_12
Akiba, T., Sano, S., Yanase, T., Ohta, T., and Koyama, M. (2019). “Optuna: a next-generation hyperparameter optimization framework,” in Proceedings of the 25rd ACM SIGKDD International Conference on Knowledge Discovery and Data Mining. doi: 10.1145/3292500.3330701
Albuquerque, I., Tiwari, A., Parent, M., Cassani, R., Gagnon, J.-F., Lafond, D., et al. (2020). WAUC: a multi-modal database for mental workload assessment under physical activity. Front. Neurosci. 14:549524. doi: 10.3389/fnins.2020.549524
Antonenko, P. D., Paas, F., Grabner, R. H., and van Gog, T. (2010). Using electroencephalography to measure cognitive load. Educ. Psychol. Rev. 22, 425–438. doi: 10.1007/s10648-010-9130-y
Arevalo, J., Solorio, T., Montes-y Gomez, M., and González, F. A. (2020). Gated multimodal networks. Neural Comput. Applic. 32, 10209–10228. doi: 10.1007/s00521-019-04559-1
Aygun, A., Nguyen, T., Haga, Z., Aeron, S., and Scheutz, M. (2022). Investigating methods for cognitive workload estimation for assistive robots. Sensors 22:6834. doi: 10.3390/s22186834
Ayres, P., Lee, J. Y., Paas, F., and van Merriënboer, J. J. G. (2021). The validity of physiological measures to identify differences in intrinsic cognitive load. Front. Psychol. 12:702538. doi: 10.3389/fpsyg.2021.702538
Beatty, J. (1982). Task-evoked pupillary responses, processing load, and the structure of processing resources. Psychol. Bull. 91:276. doi: 10.1037//0033-2909.91.2.276
Beatty, J., and Lucero-Wagoner, B. (2000). The Pupillary System. Cambridge: Cambridge University Press, 142–162.
Beh, W.-K., Wu, Y.-H., and Wu, A.-Y. A. (2021). Maus: a dataset for mental workload assessment on n-back task using wearable sensor. arXiv preprint arXiv:2111.02561.
Bergstra, J., Bardenet, R., Bengio, Y., and Kégl, B. (2011). “Algorithms for hyper-parameter optimization,” in NIPS.
Booth, B. M., Mundnich, K., and Narayanan, S. S. (2018). “A novel method for human bias correction of continuous- time annotations,” in 2018 IEEE International Conference on Acoustics, Speech and Signal Processing (ICASSP), 3091–3095. doi: 10.1109/ICASSP.2018.8461645
Bradley, M. M., Miccoli, L., Escrig, M. A., and Lang, P. J. (2008). The pupil as a measure of emotional arousal and autonomic activation. Psychophysiology 45, 602–607. doi: 10.1111/j.1469-8986.2008.00654.x
Chen, T., and Guestrin, C. (2016). “Xgboost: a scalable tree boosting system,” in Proceedings of the 22nd ACM SIGKDD International Conference on Knowledge Discovery and Data Mining, 785–794. doi: 10.1145/2939672.2939785
Cho, K., van Merriënboer, B., Gulcehre, C., Bahdanau, D., Bougares, F., Schwenk, H., et al. (2014). “Learning phrase representations using RNN encoder-decoder for statistical machine translation,” in Proceedings of the 2014 Conference on Empirical Methods in Natural Language Processing (EMNLP), eds. A. Moschitti, B. Pang, and W. Daelemans (Doha, Qatar: Association for Computational Linguistics), 1724–1734. doi: 10.3115/v1/D14-1179
Cortes, C., and Vapnik, V. (1995). Support-vector networks. Mach. Lear. 20, 273–297. doi: 10.1007/BF00994018
Dau, H. A., Bagnall, A., Kamgar, K., Yeh, C.-C. M., Zhu, Y., Gharghabi, S., et al. (2019). The UCR time series archive. IEEE/CAA J. Autom. Sinica 6, 1293–1305. doi: 10.1109/JAS.2019.1911747
Dolmans, T. C., Poel, M., van 't Klooster, J.-W. J. R., and Veldkamp, B. P. (2021). Perceived mental workload classification using intermediate fusion multimodal deep learning. Front. Hum. Neurosci. 14:609096. doi: 10.3389/fnhum.2020.609096
Freiesleben, T., and Grote, T. (2023). Beyond generalization: a theory of robustness in machine learning. Synthese 202:109. doi: 10.1007/s11229-023-04334-9
Fridman, A., Reimer, B., Mehler, B., and Freeman, W. T. (2018). “Cognitive load estimation in the wild,” in Proceedings of the 2018 CHI Conference on Human Factors in Computing Systems, 1–9. doi: 10.1145/3173574.3174226
Gjoreski, M., Gams, M. Z., Lustrek, M., Genc, P., Garbas, J.-U., and Hassan, T. (2020a). Machine learning and end-to-end deep learning for monitoring driver distractions from physiological and visual signals. IEEE Access 8, 70590–70603. doi: 10.1109/ACCESS.2020.2986810
Gjoreski, M., Kolenik, T., Knez, T., Luštrek, M., Gams, M., Gjoreski, H., et al. (2020b). Datasets for cognitive load inference using wearable sensors and psychological traits. Appl. Sci. 10:3843. doi: 10.3390/app10113843
Guo, C., Pleiss, G., Sun, Y., and Weinberger, K. Q. (2017). “On calibration of modern neural networks,” in Proceedings of the 34th International Conference on Machine Learning, ICML'17 (JMLR.org), 1321–1330.
Haapalainen, E., Kim, S., Forlizzi, J., and Dey, A. K. (2010). “Psycho-physiological measures for assessing cognitive load,” in Proceedings of the 12th ACM International Conference on Ubiquitous Computing. doi: 10.1145/1864349.1864395
Hart, S. G., and Staveland, L. E. (1988). “Development of NASA-TLX (task load index): results of empirical and theoretical research,” in Human Mental Workload, eds. P. A. Hancock, and N. Meshkati (North-Holland: Elsevier), 139–183. doi: 10.1016/S0166-4115(08)62386-9
Jaeggi, S. M., Seewer, R., Nirkko, A. C., Eckstein, D., Schroth, G., Groner, R., et al. (2003). Does excessive memory load attenuate activation in the prefrontal cortex? Load-dependent processing in single and dual tasks: functional magnetic resonance imaging study. NeuroImage 19, 210–225. doi: 10.1016/S1053-8119(03)00098-3
Kesedžić, I., Šarlija, M., Božek, J., Popović, S., and Ćosić, K. (2021). Classification of cognitive load based on neurophysiological features from functional near-infrared spectroscopy and electrocardiography signals on n-back task. IEEE Sensors J. 21, 14131–14140. doi: 10.1109/JSEN.2020.3038032
Kingma, D. P., and Ba, J. (2015). “Adam: a method for stochastic optimization,” in 3rd International Conference on Learning Representations, ICLR 2015, San Diego, CA, USA, 2015, Conference Track Proceedings.
Kirchner, W. K. (1958). Age differences in short-term retention of rapidly changing information. J. Exper. Psychol. 55, 352. doi: 10.1037/h0043688
Kumar, S., He, D., Qiao, G., and Donmez, B. (2022). “Classification of driver cognitive load based on physiological data: exploring recurrent neural networks,” in 2022 International Conference on Advanced Robotics and Mechatronics (ICARM) (IEEE), 19–24.
Longo, L. (2022). Modeling cognitive load as a self-supervised brain rate with electroencephalography and deep learning. Brain Sci. 12:1416. doi: 10.3390/brainsci12101416
Longo, L., Brcic, M., Cabitza, F., Choi, J., Confalonieri, R., Ser, J. D., et al. (2024). Explainable artificial intelligence (xai) 2.0: a manifesto of open challenges and interdisciplinary research directions. Inf. Fusion 106:102301. doi: 10.1016/j.inffus.2024.102301
Longo, L., Wickens, C. D., Hancock, G., and Hancock, P. A. (2022). Human mental workload: a survey and a novel inclusive definition. Front. Psychol. 13:883321. doi: 10.3389/fpsyg.2022.883321
Malinin, A. (2019). Uncertainty estimation in deep learning with application to spoken language assessment. Doctoral dissertation.
Meteier, Q., Capallera, M., Ruffieux, S., Angelini, L., Abou Khaled, O., Mugellini, E., et al. (2021). Classification of drivers' workload using physiological signals in conditional automation. Front. Psychol. 12:596038. doi: 10.3389/fpsyg.2021.596038
Oppelt, M. P., Foltyn, A., Deuschel, J., Lang, N. R., Holzer, N., Eskofier, B. M., et al. (2023). ADABase: a multimodal dataset for cognitive load estimation. Sensors 23:340. doi: 10.3390/s23010340
Orru, G., and Longo, L. (2019). “The evolution of cognitive load theory and the measurement of its intrinsic, extraneous and germane loads: a review,” in Human Mental Workload: Models and Applications, eds. L. Longo, and M. C. Leva (Cham: Springer International Publishing), 23–48. doi: 10.1007/978-3-030-14273-5_3
Paas, F., Tuovinen, J. E., Tabbers, H., and Van Gerven, P. W. M. (2003). Cognitive load measurement as a means to advance cognitive load theory. Educ. Psychol. 38, 63–71. doi: 10.1207/S15326985EP3801_8
Paas, F. G. W. C., and Van Merriënboer, J. J. G. (1994). Instructional control of cognitive load in the training of complex cognitive tasks. Educ. Psychol. Rev. 6, 351–371. doi: 10.1007/BF02213420
Palinko, O., and Kun, A. L. (2012). “Exploring the effects of visual cognitive load and illumination on pupil diameter in driving simulators,” in Proceedings of the Symposium on Eye Tracking Research and Applications, 413–416. doi: 10.1145/2168556.2168650
Paszke, A., Gross, S., Massa, F., Lerer, A., Bradbury, J., Chanan, G., et al. (2019). “Pytorch: an imperative style, high-performance deep learning library,” in Advances in Neural Information Processing Systems 32 (Curran Associates, Inc.), 8024–8035.
Pedregosa, F., Varoquaux, G., Gramfort, A., Michel, V., Thirion, B., Grisel, O., et al. (2011). Scikit-learn: machine learning in python. J. Mach. Learn. Res. 12, 2825–2830. Available online at: https://www.jmlr.org/papers/v12/pedregosa11a.html
Rahman, H., Ahmed, M. U., Barua, S., Funk, P., and Begum, S. (2021). Vision-based driver's cognitive load classification considering eye movement using machine learning and deep learning. Sensors 21:8019. doi: 10.3390/s21238019
Seitz, J., and Maedche, A. (2022). “Biosignal-based recognition of cognitive load: A systematic review of public datasets and classifiers,” in Information Systems and Neuroscience: NeuroIS Retreat 2022, 35–52. doi: 10.1007/978-3-031-13064-9_4
Varma, S., and Simon, R. (2006). Bias in error estimation when using cross-validation for model selection. BMC Bioinform. 7, 1–8. doi: 10.1186/1471-2105-7-91
Wang, Z., Yan, W., and Oates, T. (2017). “Time series classification from scratch with deep neural networks: a strong baseline,” in 2017 International Joint Conference on Neural Networks (IJCNN) (IEEE), 1578–1585. doi: 10.1109/IJCNN.2017.7966039
Wilson, J. C., Nair, S., Scielzo, S., and Larson, E. C. (2021). Objective measures of cognitive load using deep multi-modal learning: a use-case in aviation. Proc. ACM Inter. Mobile, Wear. Ubiquit. Technol. 5, 1–35. doi: 10.1145/3448111
Keywords: cognitive load, task load, multimodal, robustness, machine learning, deep learning, uncertainty quantification
Citation: Foltyn A, Deuschel J, Lang-Richter NR, Holzer N and Oppelt MP (2024) Evaluating the robustness of multimodal task load estimation models. Front. Comput. Sci. 6:1371181. doi: 10.3389/fcomp.2024.1371181
Received: 16 January 2024; Accepted: 22 March 2024;
Published: 10 April 2024.
Edited by:
Luca Longo, Technological University Dublin, IrelandReviewed by:
Giulia Vilone, Technological University Dublin, IrelandMartin Gjoreski, University of Italian Switzerland, Switzerland
Copyright © 2024 Foltyn, Deuschel, Lang-Richter, Holzer and Oppelt. This is an open-access article distributed under the terms of the Creative Commons Attribution License (CC BY). The use, distribution or reproduction in other forums is permitted, provided the original author(s) and the copyright owner(s) are credited and that the original publication in this journal is cited, in accordance with accepted academic practice. No use, distribution or reproduction is permitted which does not comply with these terms.
*Correspondence: Andreas Foltyn, YW5kcmVhcy5mb2x0eW5AaWlzLmZyYXVuaG9mZXIuZGU=