 Halil Ergun Korkmaz
 Mehmet Nafiz Aydin
- 1Management Information Systems, Kadir Has University, Istanbul, Türkiye
- 2Management Information Systems, Bogazici University, Istanbul, Türkiye
Introduction: Despite all the efforts to successfully implement DevOps practices, principles, and cultural change, there is still a lack of understanding on how DevOps team structure formation and performance differences are related. The lack of a ground truth for DevOps team structure formation and performance has become a persistent and relevant problem for companies and researchers.
Methods: In this study, we propose a framework for DevOps team Formation–Performance and conduct a survey to examine the relationships between team formations and performance with the five metrics we identified, two of which are novel. We conducted an empirical study using a survey to gather data. We employed targeted outreach on a social media platform along via a snowball sampling and sent 380 messages to DevOps professionals worldwide. This approach resulted in 122 positive responses and 105 completed surveys, achieving a 69.7% response rate from those who agreed to participate.
Results: The research shows that implementing the DevOps methodology enhances team efficiency across various team structures, with the sole exception of “Separate Development and Operation teams with limited collaboration”. Moreover, the study reveals that all teams experienced improvements in Repair/Recovery performance metric following DevOps adoption. Notably, the “Separate Development and Operation teams with high collaboration” formation emerged as the top performer in the key metrics, including Deployment Frequency, Number of Incidents, and Number of Failures/Service Interruptions. The analysis further indicates that different DevOps organizational formations do not significantly impact Lead Time, Repair/Recovery, and Number of Failures/Service Interruptions in terms of goal achievement. However, a statistically significant disparity was observed between “Separate Development and Operation teams with high collaboration” and “A single team formation” regarding the Deployment Frequency goal achievement percentage.
Discussion: The analysis confirms that DevOps adoption improves performance across most team formations, with the exception of “Separate Development and Operation teams with limited collaboration” (TeamType1), which shows significant improvement only in Mean Time to Recovery (MTTR). Standardized effect size calculations (Cohen’s d) reveal that TeamType2 (“Separate Development and Operation teams with high collaboration”) consistently achieves large effects in Deployment Frequency (DF), Number of Incidents (NoI), and Number of Failures/Service Interruptions (NoF/NoSI), while TeamType3 shows strong results for Lead Time (LT) and NoF/NoSI. MTTR improvements are large across all formations, with TeamType4 performing best in this metric. These findings suggest that collaboration intensity is a critical determinant of performance gains. While team formation type does not significantly influence LT, MTTR, or NoF/NoSI goal achievement, DF goal achievement is significantly higher for TeamType2 compared to TeamType4, highlighting the potential competitive advantage of high-collaboration structures.
1 Introduction
Delivering continuously fast and reliable products and services to customers requires high-level coordination, cooperation, and information flow between the development and IT operation teams within the technology departments. One can argue that there is a gap and disconnection between development and IT operations for continuous delivery and deployment, whereas continuous improvement exists independently of each other. This issue was first addressed by P. Debois at the 2008 Agile Conference in Toronto, known today as DevOps (Debois, 2008).
The consensus about the very idea of DevOps is that it is a set of practices that maximizes collaboration between development (Dev) and IT operations (Ops) to reduce software development and delivery time while increasing quality (Loukides, 2012). It also shapes the organizational structure of Development and IT operations for successful delivery and deployment (Lwakatare et al., 2016b). Another view of DevOps is that it is an extension of Agile software development. It maintains culture, automation, and measurement as principles of agile methods, such as XP and Lean, as well as flow, feedback, continuous learning, and implementation (Kim et al., 2016). Despite all endeavors for achieving successful DevOps, there is still a lack of understanding of the extent to which the formation of DevOps’ team structures and performance differences are correlated.
While DevOps is highly effective for companies to react to customer demands with fast and reliable software development and delivery, they still need to address coordination and collaboration among different teams in IT organizations. Practitioners generally accept that platforms and automation tools are essential for DevOps adoption and make DevOps teams more efficient (Leite et al., 2019). However, ineffective DevOps team formation results in inadequate coordination and collaboration between teams and inefficient usage of these platforms and automation tools.
As a result, customer dissatisfaction and disappointment emerge, potentially leading to both reputational damage and financial losses in the marketplace. In response to these risks, companies increasingly invest in the development of their IT team structures and make substantial payments to solution providers in pursuit of more efficient organizational and team configurations. Identifying effective DevOps team formations, if they exist, can not only help organizations mitigate financial losses but also prevent reputational harm. For these reasons, this topic has drawn significant attention among both researchers and practitioners.
As there is no ground truth for DevOps’ team structure formation from a performance perspective, it has become a persistent and relevant issue for companies and researchers (Leite et al., 2023; Lopez-Fernandez et al., 2021). They are looking for the formation of DevOps’ team structures and performance differences. Thus, we focused on this topic using the following research questions:
• RQ1: Does adopting DevOps practices create a performance difference for all types of DevOps Teams?
• RQ2: Considering both pre-DevOps and post-DevOps performance values, which DevOps team formation shows greater performance improvement compared to others?
• RQ3: Which DevOps team type is better than others in terms of performance goals achievements?
To address these research questions, we adopted three existing performance metrics (Lopez-Fernandez et al., 2021; DORA, n.d.) which are Lead Time (LT), Deployment Frequency (DF), and Mean Time To Repair/Recovery (MTTR). In addition to these three metrics, we propose two novel metrics which are Number of Incidents (NoI) and Number of Failures/Service Interruptions (NoF/NoSI) metrics as articulated further later on, these metrics are concerned with service quality and reliability, which is a missing DevOps performance metric in the existing studies.
We conducted a survey by adopting a quantitative approach. To measure the performance difference of DevOps adoption Pre-DevOps and post-DevOps values of the five performance metrics were requested. Participants were also asked to provide the percentage of goal achievement for each performance metric except NoI. The aim is to compare the performances of the DevOps groups and determine which group performed better.
The paper is structured as follows: In Section 2, we describe the relevant works, and in Section 3, we describe the present research methodology, performance metrics, and a framework. We present the statistical methods for data analysis and the results in Section 4. Finally, we provide the research limitations, discussion, and conclusions in Sections 5 and 6, respectively.
2 Relevant works
Despite the many studies on DevOps in general, there are a limited number of studies focusing on the relationships between Formation-Performance of DevOps as summarized by Table 1. Muñoz et al. (2021) pointed out that there are three main problems in implementing DevOps practices and summarized them as lack of a defined process (Muñoz et al., 2019), lack of guidance (Hüttermann, 2012), and lack of knowledge and experience (Senapathi et al., 2018).
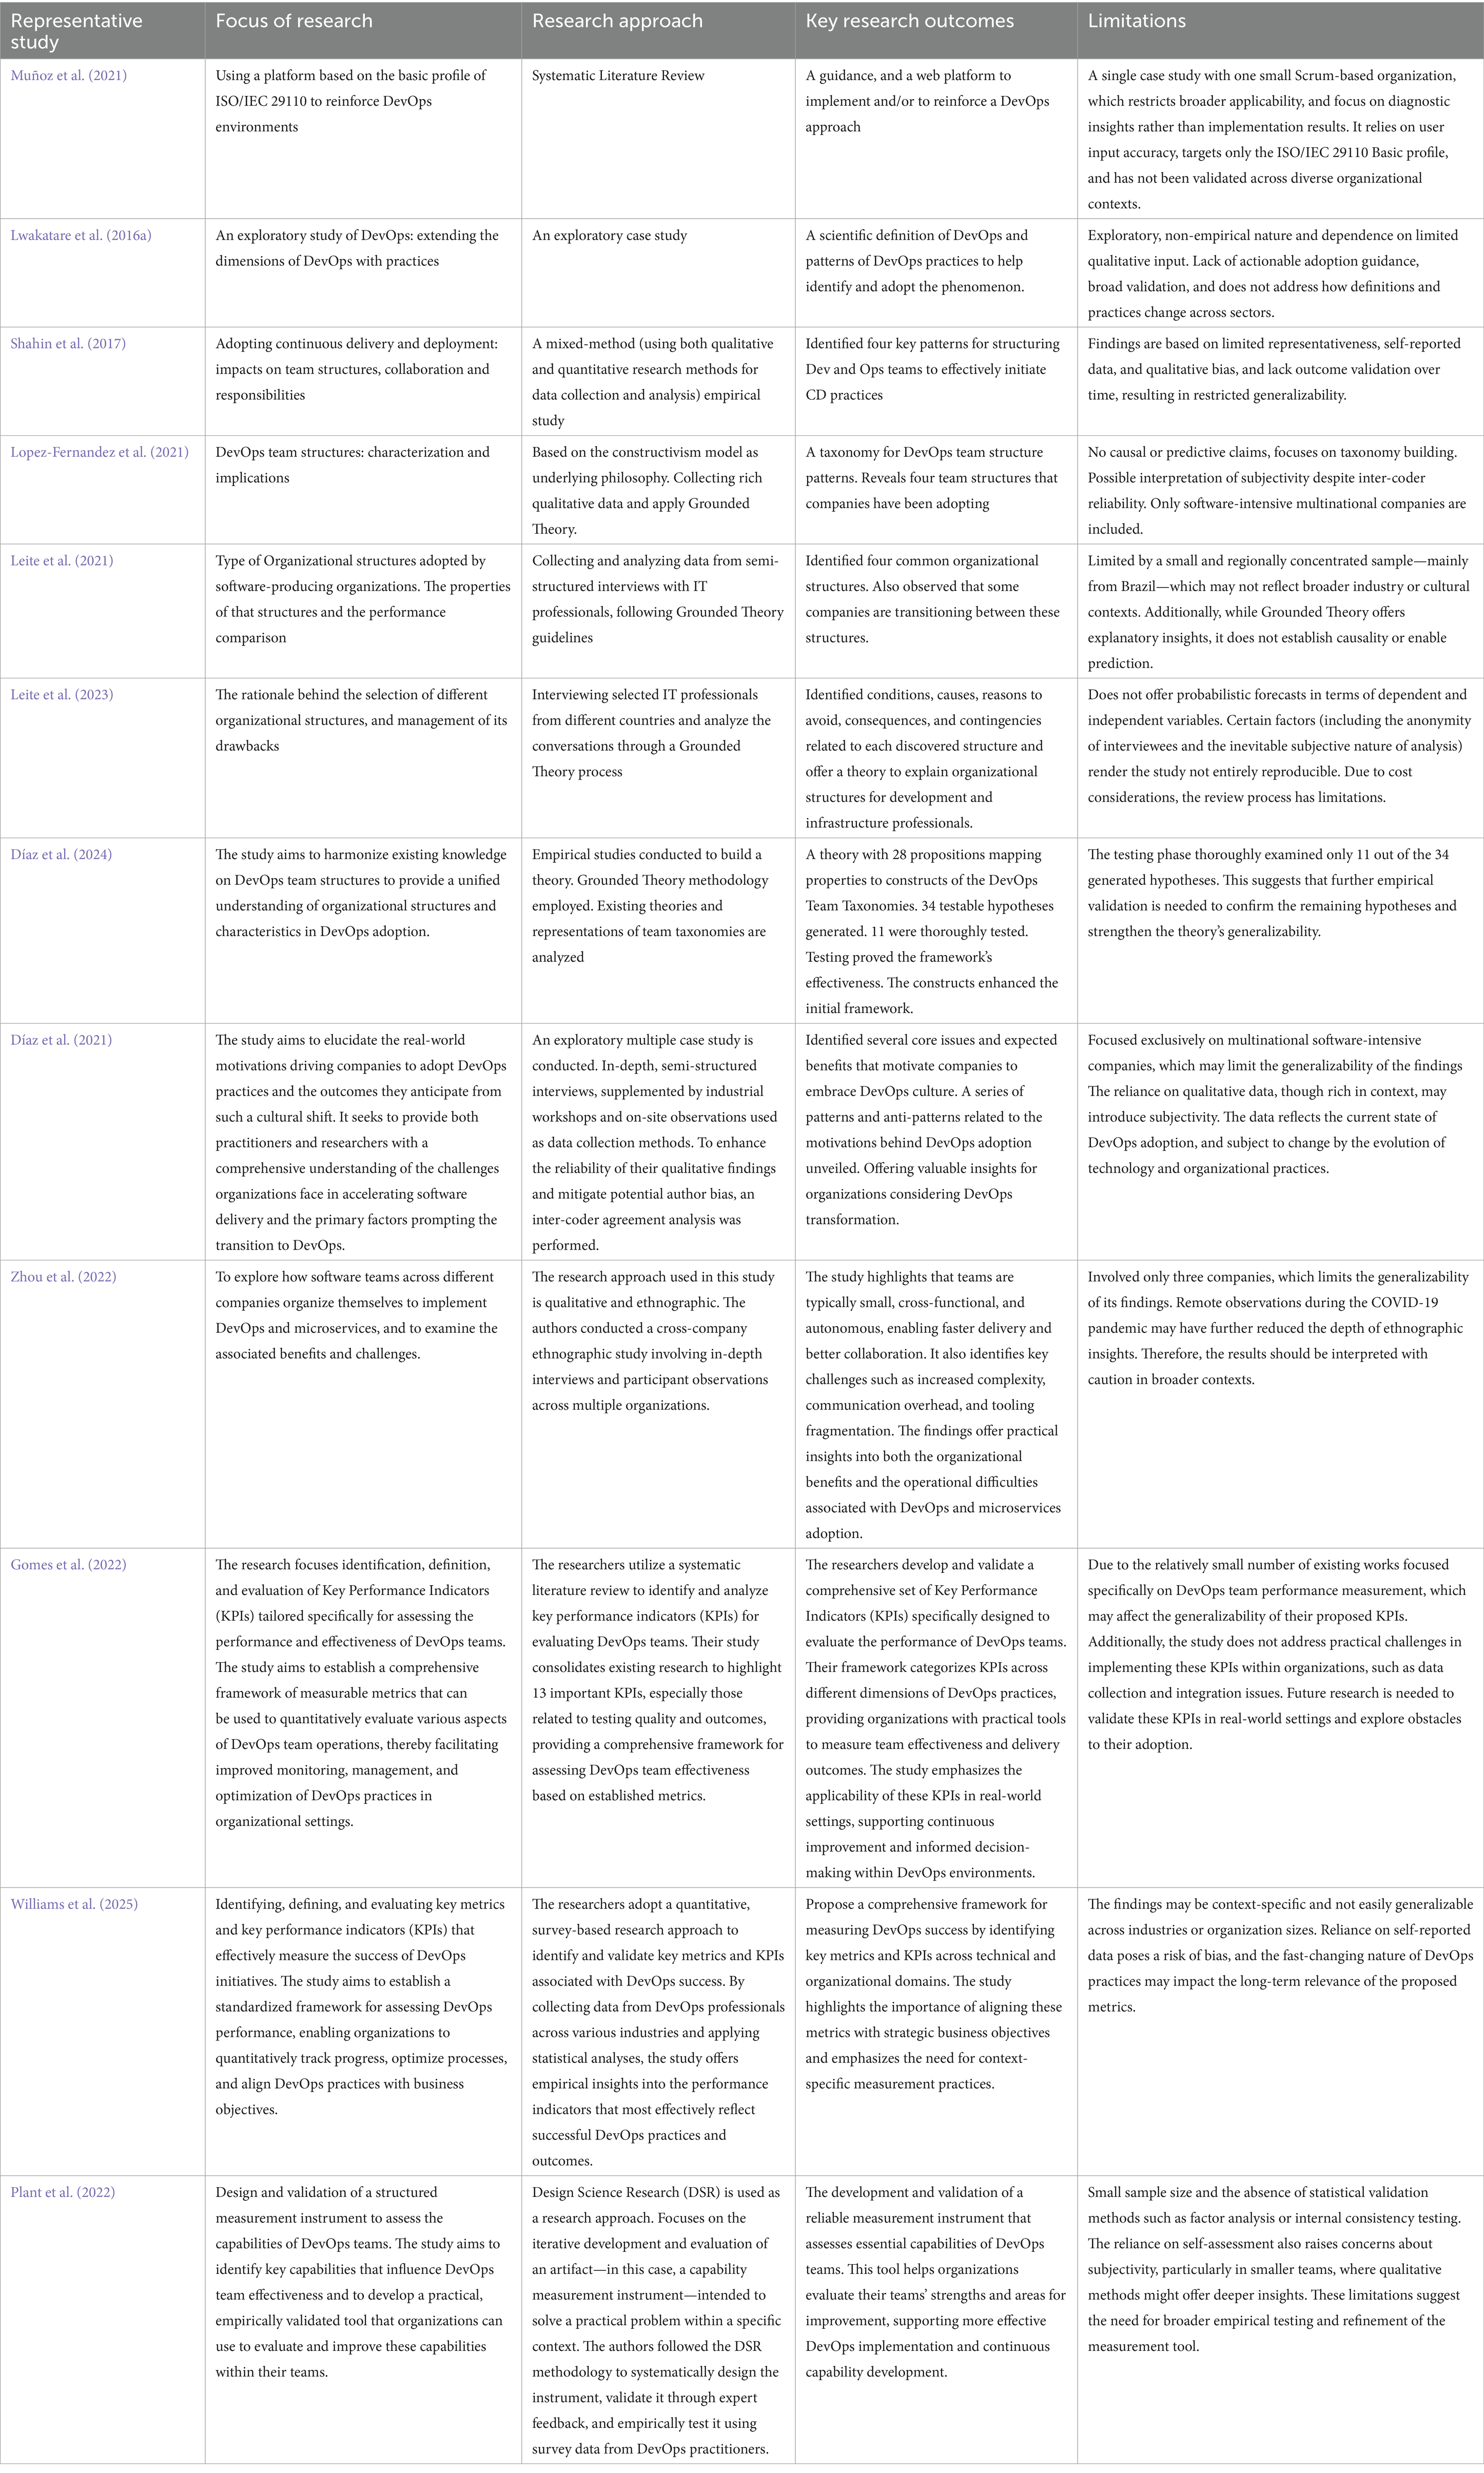
Table 1. Summary of relevant research.
In “Model Checking Adaptive Multilevel Service Compositions,” Rossi (2012) introduces a logic-based method for verifying security and correctness in service compositions. This approach aligns with DevOps principles by promoting continuous verification and integration, ensuring that adaptive services maintain compliance throughout their lifecycle.
In their study, Díaz et al. (2021) investigate the motivations behind companies adopting a DevOps culture. Through an exploratory multiple case study involving 30 multinational software-intensive companies, they conducted in-depth, semi-structured interviews with key stakeholders. The research identifies common challenges organizations face in accelerating software delivery and highlights the primary drivers for embracing DevOps practices. Findings reveal patterns and anti-patterns related to DevOps adoption, offering insights to help practitioners and researchers understand the contexts and issues prompting companies to transition towards DevOps. This study aims to strengthen evidence and support practitioners in making better-informed decisions about which problems trigger a DevOps transition and the most common expected results.
Another study characterizing the DevOps phenomenon is explored by Lwakatare et al. (2016a) via a review of multivocal ‘grey’ literature and interviews (Leite et al., 2020; Leite et al., 2021) provide further conceptual elaborations of DevOps using a set of exemplary practices and patterns.
Zhou et al. (2022) conducted an ethnographic study to comprehensively examine the organization, benefits, and problems of software teams using DevOps and microservices in three companies with different business, size, product, customer, and degree of globalization. The researchers collected data by conducting nine interviews with software teams related to DevOps and microservices over 7 months and tested their theory by conducting a comparative analysis of the companies with this data. The study contributes to a better understanding of the benefits and problems of adopting DevOps and microservices for organizations, but is limited to reveal an extent to which different team types affect DevOps performance.
Gomes et al. (2022) focus on developing a structured set of Key Performance Indicators (KPIs) to evaluate the performance of DevOps teams. Based on a systematic review of the literature, they identified and organized KPIs into key dimensions such as operational efficiency, collaboration, automation, and continuous delivery. Their goal was to help organizations assess DevOps practices more effectively and align performance measurement with business objectives. This work provides a practical framework that can guide organizations in evaluating and improving the effectiveness of their DevOps teams, but needs to be validated in an empirical setting.
In another DevOps performance measurement study, Williams et al. (2025) examined basic DevOps metrics and Key Performance Indicators (KPIs) to measure the effectiveness, speed, and reliability of DevOps practices. In this study, the researchers examined deployment frequency, lead time for changes, mean time to repair, change failure rate, also known as DORA (n.d.) metrics, as well as KPIs such as customer satisfaction, team collaboration, and infrastructure automation levels. They suggest that using both quantitative and qualitative metrics together, DevOps performance can be aligned with the organization’s business goals with a balanced approach.
Plant et al. (2022) present the development and empirical validation of a capability measurement instrument specifically designed for DevOps teams. Through a design science research methodology, the study identifies and structures key capabilities required for effective DevOps performance and translates these into measurable constructs. The resulting instrument is validated through expert evaluations and a survey administered to DevOps practitioners, demonstrating its reliability and practical relevance. This work contributes to the DevOps field by offering a systematic and evidence-based tool to assess and enhance team capabilities, thereby supporting continuous improvement and strategic alignment in DevOps environments.
Jayakody and Wijayanayake (2023), in their study, examined the Critical Success Factors (CSF) for DevOps adoption by stating the benefits and difficulties of DevOps adoption and analyzed the use of DevOps principles and principles. They used the systematic literature review method while determining the Critical Success Factors and verified the results with interviews with DevOps experts. At the end of the study, they presented a conceptual model output in which they grouped the Critical Success Factors they determined under four main headings such as collaborative culture, DevOps practices, proficient DevOps team, and metrics and measurement.
Shahin et al. (2017) highlighted in their paper that DevOps adoption helps organizations improve skills, form the right teams, and investigate organizational processes, practices, and tool support. It is emphasized that continuous Delivery/Deployment (CD) may require a new way of working and changes in team structures and responsibilities. Furthermore, it is argued that CD practices demand tighter and stronger collaboration and integration among teams and team members (Shahin et al., 2017). They conducted an empirical investigation of team organization, collaboration, and responsibility from the perspective of DevOps adoption by conducting a mixed-method study consisting of interviews and surveys with software practitioners from 19 organizations and 93 practitioners. They conclude that there are four common patterns for organizing Dev and Ops teams to effectively initiate and adopt CD practices. The participants shared that team co-location, rapid feedback, joint work, shared responsibility, collaboration tools, awareness, transparency, empowering, and engaging operations personnel increased collaboration among teams and team members in the CD adoption path. They highlighted that after DevOps adoption, their responsibilities changed, especially in terms of their skills, new CD-related solutions, and task prioritization. They also found that adopting CD enhances the relationship between responsibilities and skill sets in both negative and positive ways.
In another research study, Leite et al. (2020) focused on DevOps Team structure patterns in their paper and conducted 20 semi-structured interviews with 27 IT professionals. They used Grounded Theory (Glaser and Strauss, 1999) as a methodology for analyzing data and concluded with four organizational structures. Leite et al. (2021) mainly focus on team structures as well as types of DevOps organizational structures (Leite et al., 2023). During the interview stage, they identified the core and supplementary properties of each team structure type. Additionally, they used “Lead Time,” “Deployment Frequency” and “Mean Time To Repair” as three software delivery metrics (Leite et al., 2021) to find out organizational structure differences. In previous studies, Leite et al. concluded in their study that while “Platform team” is better than other team structures for achieving continues delivery, “Siloed Departments” closer to less-than-high performance organizations. Additionally, they could not find any relation between delivery performance and “Classical DevOps” and “Cross Functional Teams” (Leite et al., 2021). In their follow-up study (Leite et al., 2023), the authors focused on the rationale behind the selection of different types of DevOps team structure and the management of drawbacks for each type. In this study, 68 IT professionals from 54 organizations were interviewed. They used “Grounded Theory” once again to build their theory. Indirectly, they similarly addressed collaboration, responsibility, and skills as constructs in their studies. They claimed that they found the rationale for different types of DevOps team structure adoption by organizations, such as company size, to overcome delivery issues, compliance with organizational standards, or resource assignment requirements. They also claimed that they found the disadvantages of each type of team structure and the solutions that are applied by the organizations for remediations.
Yet another study conducted by Lopez-Fernandez et al. (2021) focuses on DevOps team structure taxonomy. They conducted an exploratory study using semi-structured interviews with 31 multinational software-intensive companies, attending industrial workshops, and visiting organizational facilities. Similar to others, they used “Grounded Theory” (Glaser and Strauss, 1999) as a qualitative research method to explore the structure and characteristics of teams and statistical analysis to discover their implications in software delivery performance. While describing a taxonomy of team structure patterns, they used the following six constructs: collaboration frequency, product ownership sharing, autonomy, leadership management, organizational silo, and cultural silo. They also used “Lead Time,” “Deployment Frequency” and “Mean Time to Repair” as three software delivery metrics same as others to find out the implications on software delivery performance. They concluded with four different types of DevOps team structures similar with Shahin et al. (2017), Leite et al. (2020), Leite et al. (2021), and Leite et al. (2023) and claim that “Full cross-functional DevOps team” performs better than “Interdepartmental Dev and Ops collaboration” and “Interdepartmental Dev-Ops team.” They also found that “Boosted cross-functional DevOps team” and “Full cross-functional DevOps team” have better software delivery performance (Lopez-Fernandez et al., 2021).
Díaz et al. (2024) address the need for a unified understanding of DevOps team structures within software-producing organizations in the article “Harmonizing DevOps Taxonomies—A Grounded Theory Study.” They emphasize that if companies improve their software development and deployment process, DevOps becomes essential and requires significant cultural and organizational changes. The researchers sought to enhance the understanding of the organizational structure and characteristics of teams implementing DevOps by synthesizing existing knowledge. The researchers conducted an empirical investigation to synthesize existing knowledge on team taxonomies in order to facilitate a systematic and structured DevOps adoption. The grounded theory (Glaser and Strauss, 1999) approach and Inter-Coder Agreement (ICA) were both used as research methods in the study. In addition to these two methods, the researchers analyze existing studies on DevOps teams and taxonomies to gain necessary knowledge about the subject. In conclusion, the authors presented a theory of DevOps taxonomies, asserting its nature as both substantive and analytic. Additionally, they provided a public repository containing pertinent data related to the study.
3 Research methodology
Existing studies (Shahin et al., 2017; Leite et al., 2020; Leite et al., 2021; Leite et al., 2023; Lopez-Fernandez et al., 2021; Díaz et al., 2024) employed qualitative methods together with grounded theory (Glaser and Strauss, 1999) to build and test their theories. Although these studies provide insights for developing our theoretical framework and identifying number of team formations in advance, we decided to test our theory by using quantitative methods and inferential statistical analysis by using known statistical tests such as Variance Analysis (ANOVA), t-test, and Chi-square. As elucidated in depth in subsequent sections, a set of questions was formulated to address the five performance metrics that constitute the focus of this study. These questions were published as a survey form via the Internet. Participants were recruited using “Snowball Effect” (Biernacki and Waldorf, 1981), “Targeted Advertising” (Thornton et al., 2016) and “Crowdsourcing via Open Calls” (Kosinski et al., 2015) methodologies to ensure expertise in DevOps profiles. Due to unknown population size, an a priori power analysis was conducted using G*Power 3.1.9.7 (Cohen, 1988) to estimate the required sample size for a one-way ANOVA comparing four independent groups. Assuming a large effect size (f = 0.40), an alpha level of 0.05, and statistical power of 0.80, the minimum required total sample size was determined to be 76 participants, with 19 individuals per group. This value served as a threshold for sample size, ensuring the study was adequately powered to detect substantial group differences (Faul et al., 2007). Although the number of participants exceeded the initially established sample size of 76 and reached a total of 104, the response count for one of the DevOps team groups (TeamType1) remained constant at 9. Consequently, the survey was concluded, and the study proceeded with data analysis and interpretation of the results.
The survey was concluded after participant enrollment reached a saturation point, subsequent to which data analysis and interpretation of findings were conducted.
3.1 Identifying metrics and framework
While we were identifying the examined metrics, we applied the predecessors’ papers again and found that both Lopez-Fernandez et al. (2021) as referring to DORA (n.d.) and Leite et al. (2021) used the following software delivery performance metrics in their research to compare the different types of DevOps team structure performance: “Lead Time,” “Deployment Frequency” and “Mean Time To Repair.” In addition to these three software delivery performance metrics, we propose to add two further metrics “Number of Incidents” and “Number of Failures/Service Interruption” in the model to measure applications or service quality and reliability. While the “Number of Failures/Service Interruptions” gives us only service outages, the “Number of Incidents” gives us any type of service degradation. We also see that DORA (n.d.) added a new performance metric, “Change failure percentage, “to measure the impact of service degradation requiring remediation. They preferred to use a single metric for all types of service deterioration and outages. However, we suggest that using the “Number of Incidents” and “Number of Failures/Service Interruption” metrics separately will provide a detailed performance comparison opportunity. Therefore, we propose a framework as shown in Figure 1.
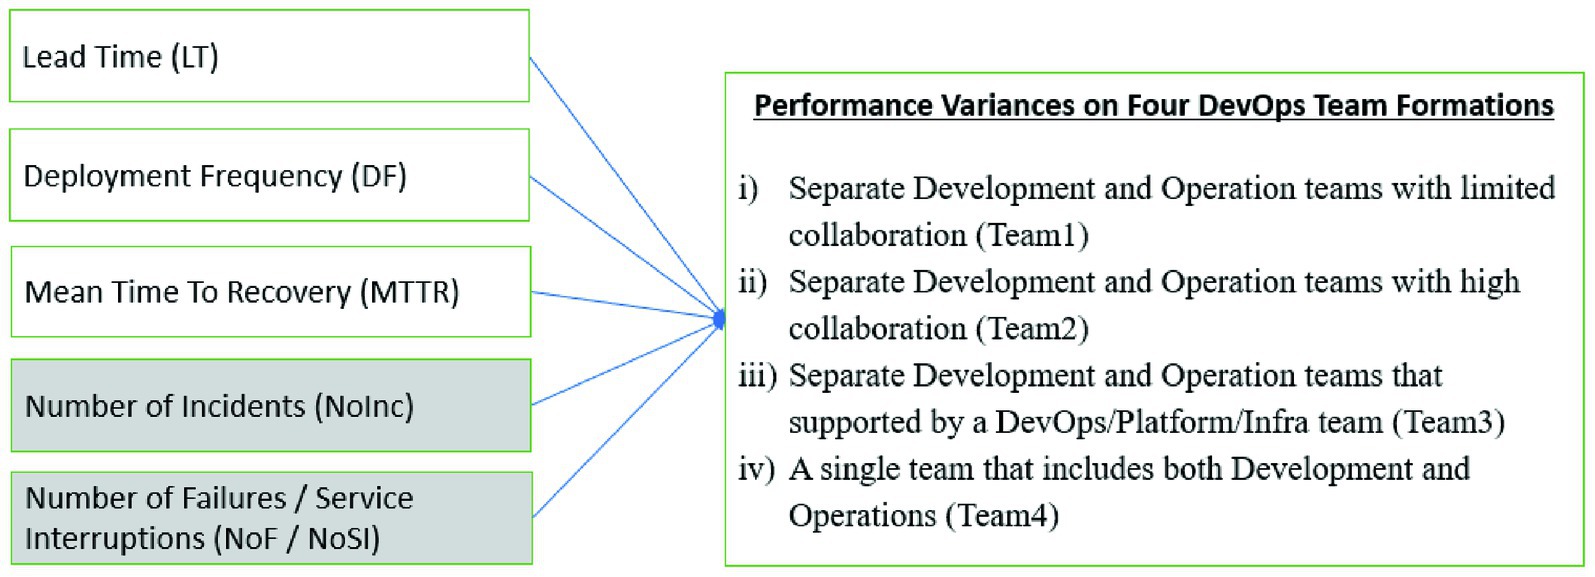
Figure 1. DevOps team performance metrics (the shaded metrics belong to this research).
Regarding DevOps formations, similar with other studies (Shahin et al., 2017; Leite et al., 2020; Leite et al., 2021; Leite et al., 2023; Lopez-Fernandez et al., 2021) we identify four types of DevOps team structures, based on the level of collaboration, support model and organizational relationships. The name of the four DevOps team structures and their definitions are listed as follows:
• Separate Development and Operations Teams with Limited Collaboration (TeamType1): Teams often perceive DevOps principles primarily as the implementation of continuous integration tools rather than as an initiative to enhance collaboration. Consequently, communication and collaboration between teams remain minimal. Developers and operations personnel engage in infrequent collaboration, occurring on a monthly or, at most, a weekly basis. Each group primarily focuses on its own tasks, leading to a mere transfer of responsibilities rather than active cooperation. Moreover, these teams lack autonomy, as responsibilities are delegated, and dependencies on other teams persist. This type of team structure has been identified in other studies under different terminologies, such as “Siloed Departments” (Leite et al., 2023) and “Interdepartmental Dev and Ops Collaboration” (Lopez-Fernandez et al., 2021).
• Separate Development and Operations Teams with High Collaboration (TeamType2): In this team structure, there is significant collaboration between developers and infrastructure teams. While Development and Operations function as a stable team, they may still belong to distinct departments. As a result, they might have a shared product manager, but often, they report to separate department managers with differing objectives. Task allocation remains clearly delineated between the Development and Operations teams. While organizational silos have been addressed, cultural silos continue to persist. However, collaboration extends beyond the mere transfer of tasks, as team members begin to share product ownership and gain increased autonomy. This team structure has been described in other studies using different terminologies, such as “A Classical DevOps Structure” (Leite et al., 2023) and “Interdepartmental Dev-Ops Team” (Lopez-Fernandez et al., 2021). An illustrative example of this team model is Google’s Site Reliability Engineering (SRE) approach (Beyer et al., 2016), wherein developers and SRE teams operate independently yet collaborate extensively to achieve shared objectives.
• Separate Development and Operations Teams Supported by a DevOps/Platform/Infrastructure Team (TeamType3): In this model, Development and Operations teams remain distinct but receive support from DevOps experts affiliated with a DevOps Center of Excellence or platform/infrastructure teams, particularly in large-scale enterprises. These supporting teams provide highly automated infrastructure services, ensuring the implementation of DevOps best practices. While Development and Operations teams continue to function separately, they collaborate closely on a daily basis and possess a moderate to high degree of autonomy. This team structure has been referred to in other studies as a “Platform Team” (Leite et al., 2023) and a “Boosted Cross-Functional DevOps Team” (Lopez-Fernandez et al., 2021).
• A Single Team Integrating Both Development and Operations (TeamType4): This model consists of a self-sufficient team that encompasses both development and operations expertise, enabling end-to-end product development. These teams operate under a single manager and collectively assume ownership of the product or service they deliver. Working closely together on a daily basis, they exhibit a medium-to-high level of autonomy. This team structure has been described in prior research as a “Cross-Functional Team” (Leite et al., 2023) and a “Full Cross-Functional DevOps Team” (Lopez-Fernandez et al., 2021). As highlighted by Leite et al. (2023) in their paper, this approach aligns with Amazon’s principle of “You built it, you run it” (Gray, 2006) and the concept of “autonomous squads” employed at Spotify (Kniberg, 2014).
We also added the “Other” option to the relevant survey questions if the participants wanted to add different options. There is only one participant used the “Other” option with adding “We have almost every kind of these options” comment. Therefore, we excluded that participant from the analysis as an outlier. We intentionally avoided naming DevOps team structure types because naming conventions can be variable and named differently by company. Instead, we define DevOps team structures based on the level of collaboration, support model and organizational relationships.
3.2 Data gathering
We used similar questions with the predecessors who were studied on the same subject such as Lopez-Fernandez et al. (2021), Leite et al. (2020), Leite et al. (2021), Leite et al. (2023), and Shahin et al. (2017). We published the survey through Google Forms1 and all questions were marked as mandatory. In addition to the 9 demographic questions, 14 questions were related performance metrics. In the survey, we had 22 multiple-choice and 1 multiple-select questions. We also added an “Other” option to some questions in case participants wanted to add their input. The survey was completed anonymously, and we did not ask for any personal or company-related information from participants except for an email address that was not mandatory and asked only if they wanted to obtain the survey results.
The process of identifying and accessing survey participants presents significant challenges. The use of social media platforms for survey research offers methodological advantages and innovative approaches such as “snowball effect” (Biernacki and Waldorf, 1981), “targeted advertising” (Thornton et al., 2016), “random sampling within groups” (Brickman Bhutta, 2012), “network-based sampling” (Heckathorn, 1997) and “Crowdsourcing via Open Calls” (Kosinski et al., 2015). These methods facilitate the process of reaching the target audience, defining participant demographics, and enhancing survey participation rates.
Initially, we decided to use “snowball effect” (Biernacki and Waldorf, 1981) method and shared the survey with our peers’ network who are DevOps experts and work for global technology companies, telecommunications service providers, and financial institutions. However, after 30 days publishing the survey, the total number of participants was 19. We decided to use “Crowdsourcing via Open Calls” (Kosinski et al., 2015) method. By using this method, we post open calls for survey on social media such as LinkedIn and Facebook DevOps groups. Similar to Shahin et al. (2017), this method also failed, and we did not obtain any additional responses from those social media groups. Finally, we tried yet another method which is “targeted advertising” (Thornton et al., 2016) and searched DevOps profiles from different countries globally on LinkedIn and sent connection requests for each. Once they accepted, we sent a message, explained the research goals, and asked them to participate in the survey. We sent 380 messages and received 122 positive responses (32.1% success rate in total messages) that they would participate in, but we only obtained 105 (69.7% success rate in total response) participants in the survey2.
After excluding the outlier record who selected the “Other” option for DevOps team structure, total number of observations became 104.
4 Statistical analyzing and the results
We used the IBM SPSS Statistics tool and generated the results based on appropriate statistical methods, such as Variance Analysis (ANOVA), t-test, and Chi-square test, based on the number of variables and conditions.
To compare DevOps team structures by their performance, 14 questions were being asked under the five performance-related metrics identified in the framework.
• Lead Time (LT)
• Deployment Frequency (DF)
• Mean Time To Repair/Recovery (MTTR)
• Number of Incidents (NoI)
• Number of Failures/Service Interruptions (NoF/NoSI)
To be able to examine the temporal aspect of performance for RQ1 and RQ2, we not only asked the participants to provide values for these five software delivery performance metrics after DevOps adoption but also asked them to provide the same values before DevOps adoption. For RQ3, we also believe that due to some specific parameters such as the size and complexity of the company or application, high or low values given to these performance metrics may not reflect the actual performance of the teams. Thus, the participants are being asked to provide the percentage of their goal achievement for these performance criteria.
The relevant descriptive statistics for demographics are presented in Table 2.
a. The first performance-related metric concerns Lead Time (LT) when the request was made and ends when it was fulfilled. In this regard, the average LT “before and after moving DevOps” being asked to participants. We use a Paired Samples T test for RQ1 to test whether there is a significant difference between the average LT before and after DevOps adoption.
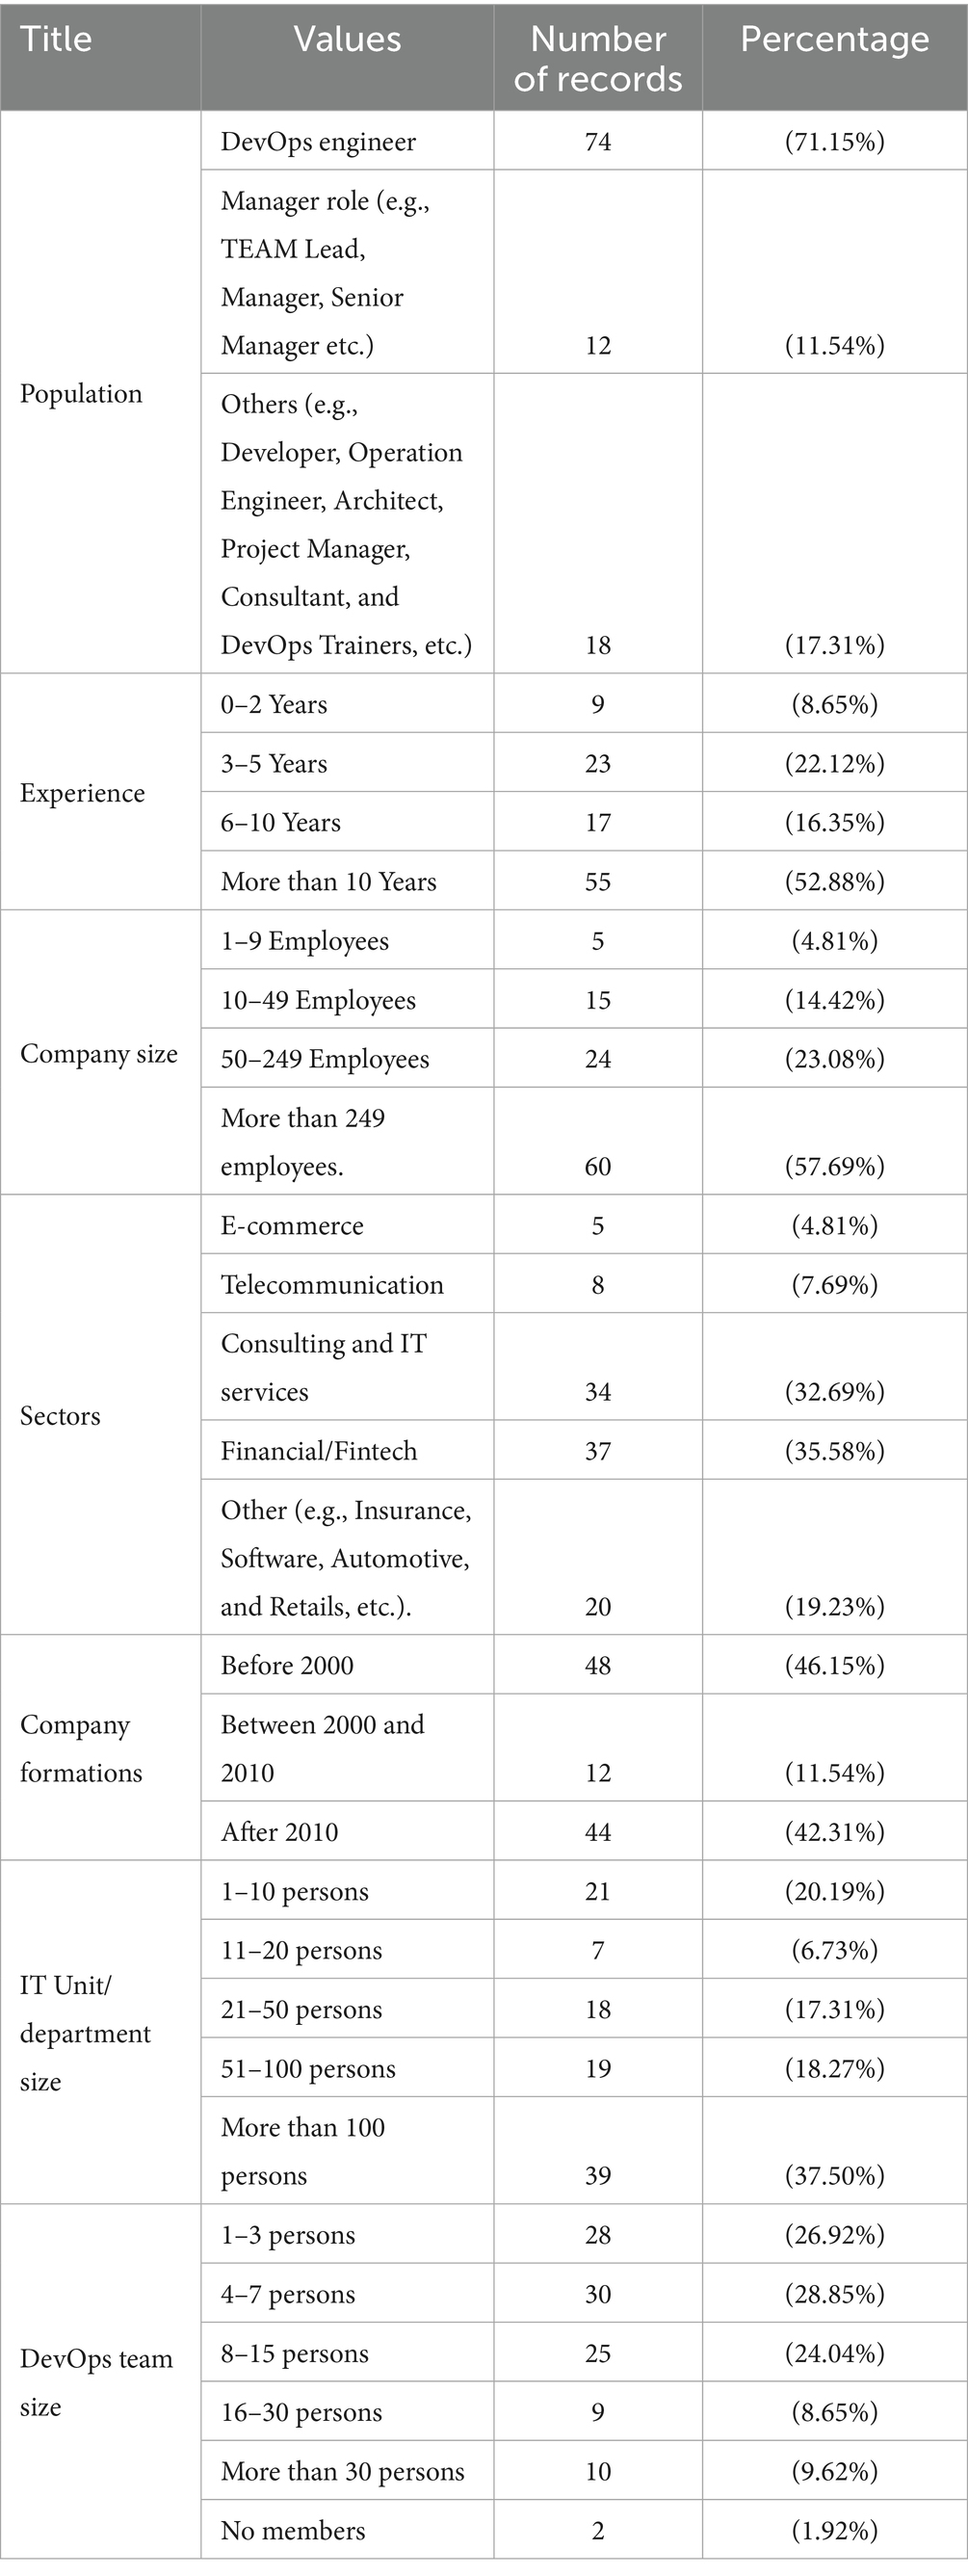
Table 2. Demographics of survey respondents.
To understand whether implementing DevOps affects Lead Time, we develop two hypotheses. The null hypothesis (H0) assumes that the average Lead Time before and after adopting DevOps remains the same, meaning there is no effect. On the other hand, the alternative hypothesis (H1) suggests that the average Lead Time changes after DevOps is introduced, indicating a real impact. We then use statistical tests to see which hypothesis the data supports, helping us understand the influence of DevOps on team performance. The hypotheses for all four teams are as follows:
• H0: The mean values of the pre- and post-DevOps Lead Time are the same.
• H1: The mean values of the pre- and post-DevOps Lead Time are different.
The result in Table 3 shows that the significance values for TeamType2, TeamType3 and TeamType4 are less than the confidence level value (0.05); therefore, we reject the null hypothesis (H0) for these 3 teams, and conclude that there is a statistically significant difference for TeamType2, TeamType3 and TeamType4 Before and After DevOps for LT performance metric.
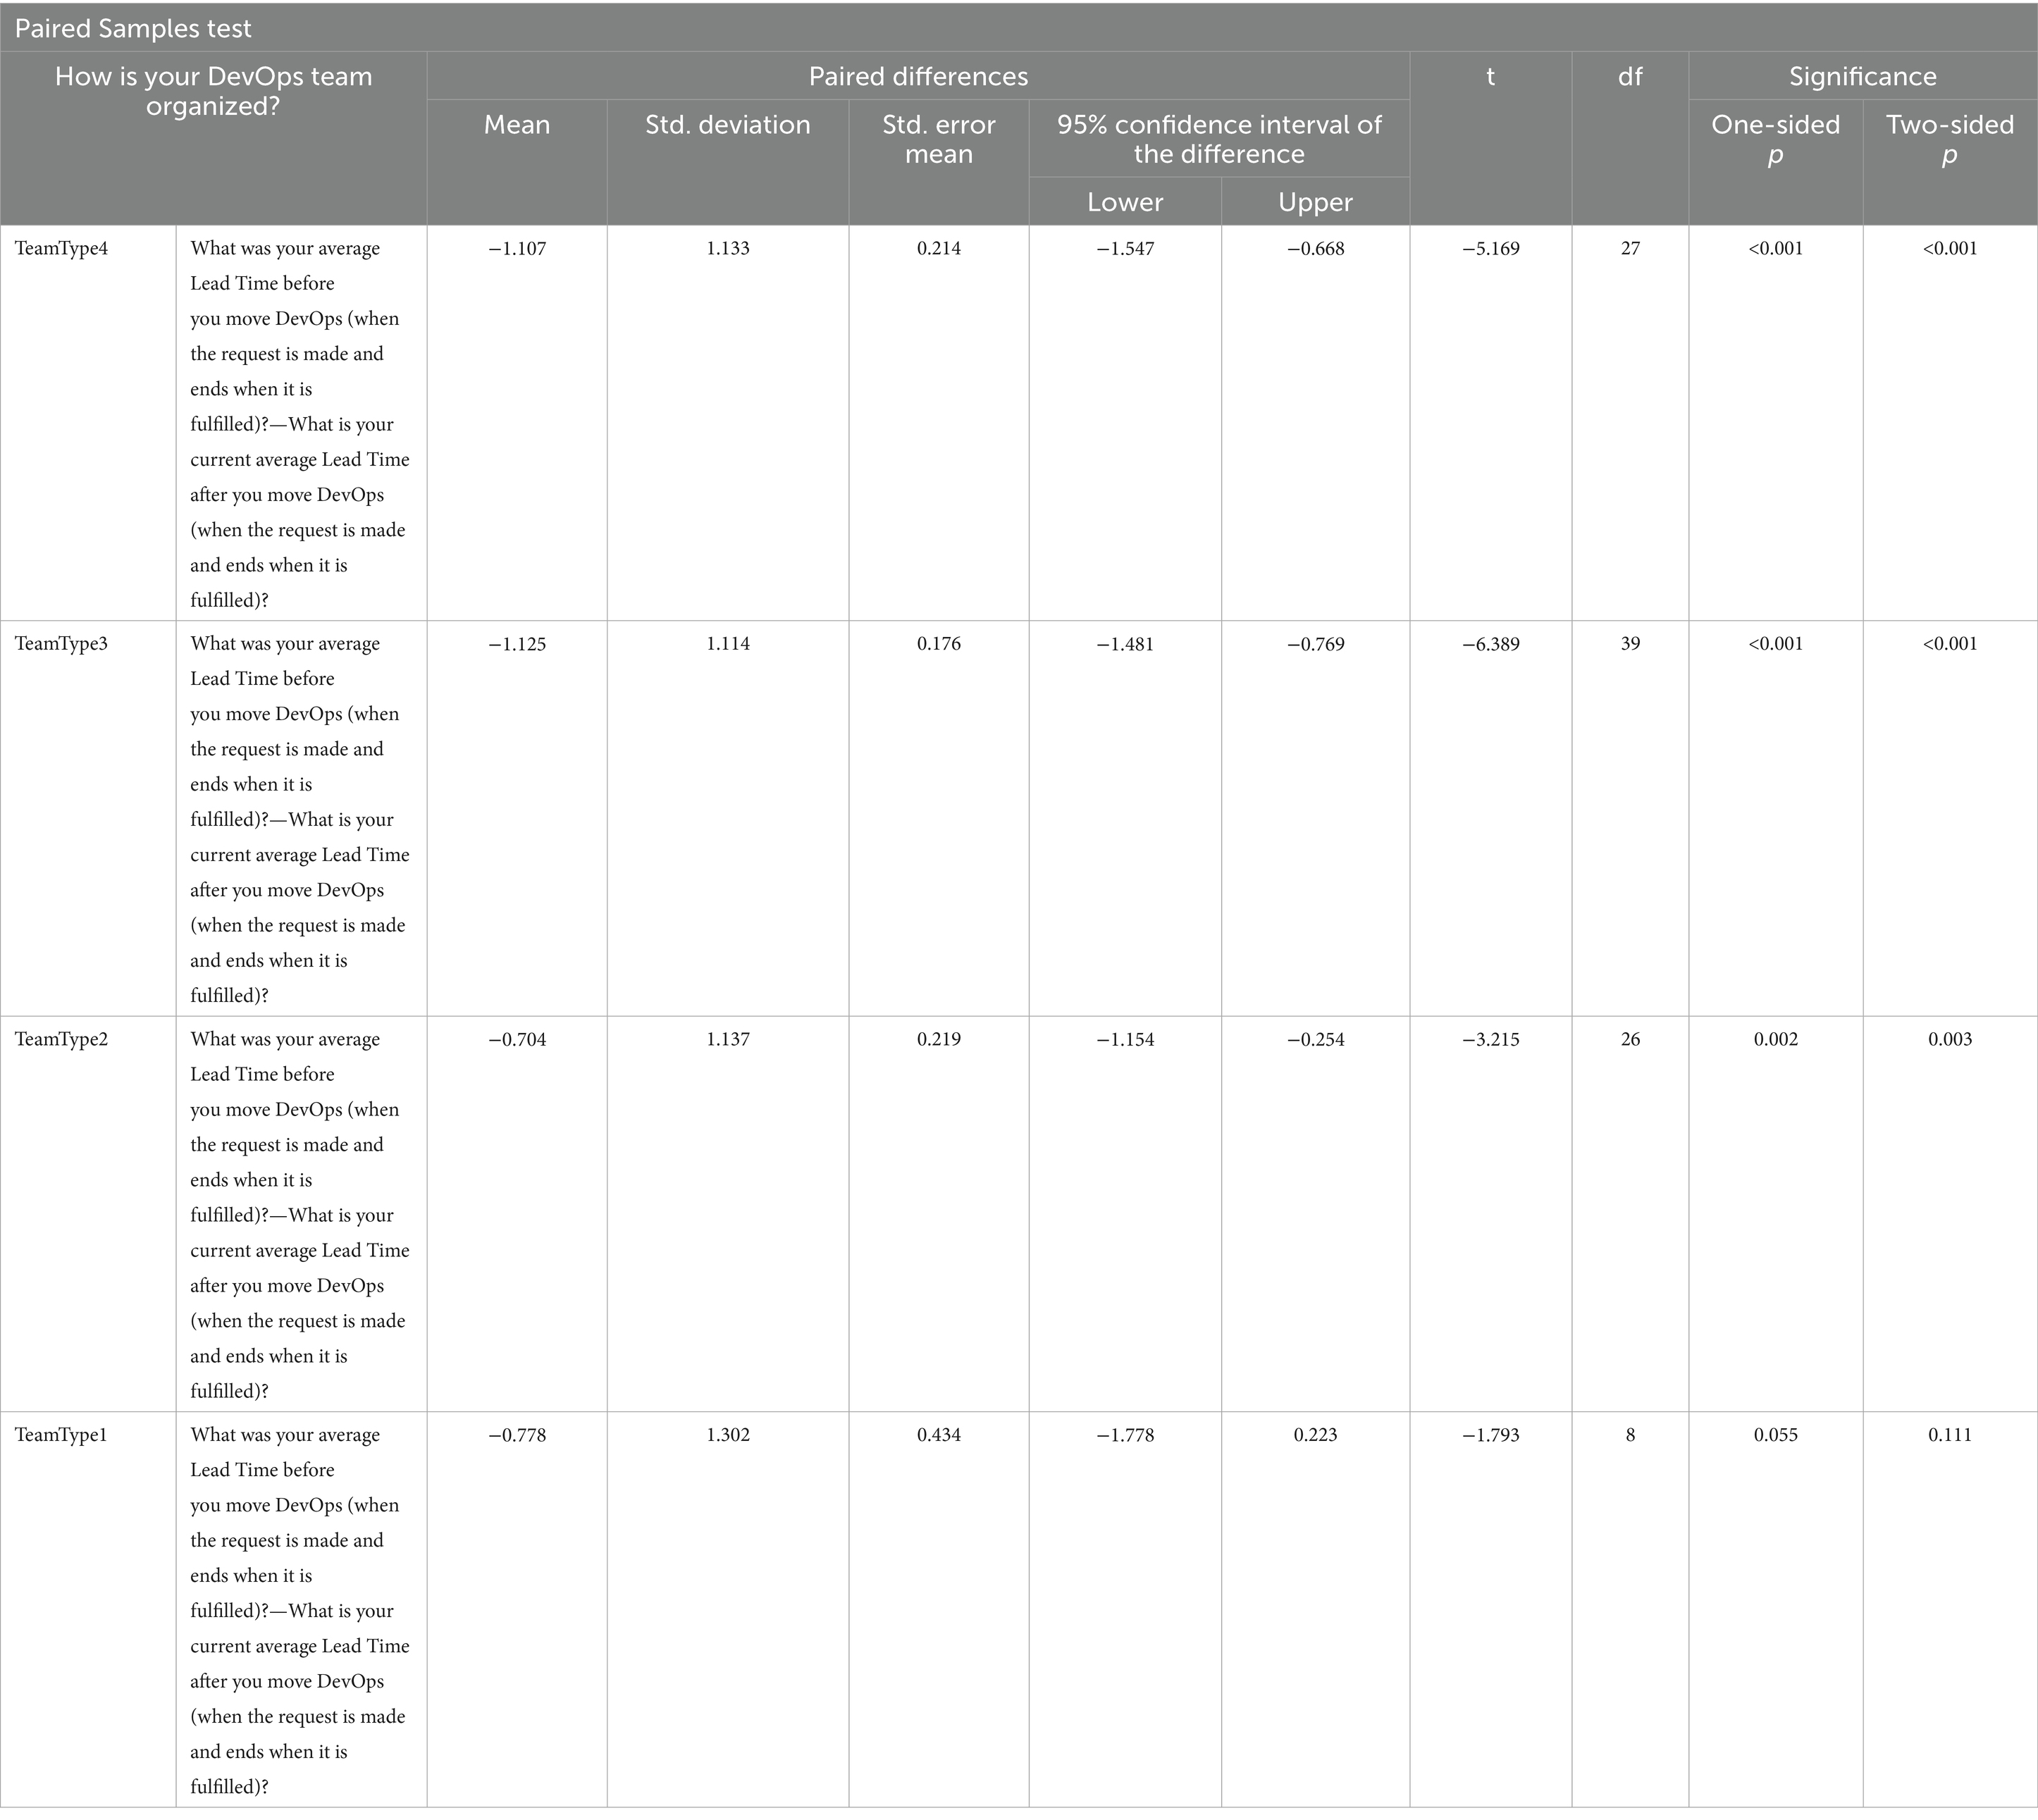
Table 3. Paired Sampled T tests for LT.
For TeamType1, the significance value of TeamType1 in Table 3 is 0.111, which is greater than the confidence level value of 0.05; therefore, we accept the null hypothesis. In this case, we say that there is no statistically significant difference between Before and After DevOps for TeamType1 from LT performance metric perspective.
For RQ2, when we can compare the mean values in Table 3, we see that TeamType3 has the greatest value which is −1.125 and we can state that TeamType3 is the best performer among the all four DevOps team formations from LT perspective after DevOps was adopted.
For RQ3, we will assess whether there are statistically significant differences in LT goal achievement percentage between the four DevOps groups. To compare the groups, we use variance analysis (ANOVA).
Descriptive statistics in Table 4 show LT goal means are close; therefore, we must statistically test if there is a meaningful difference.
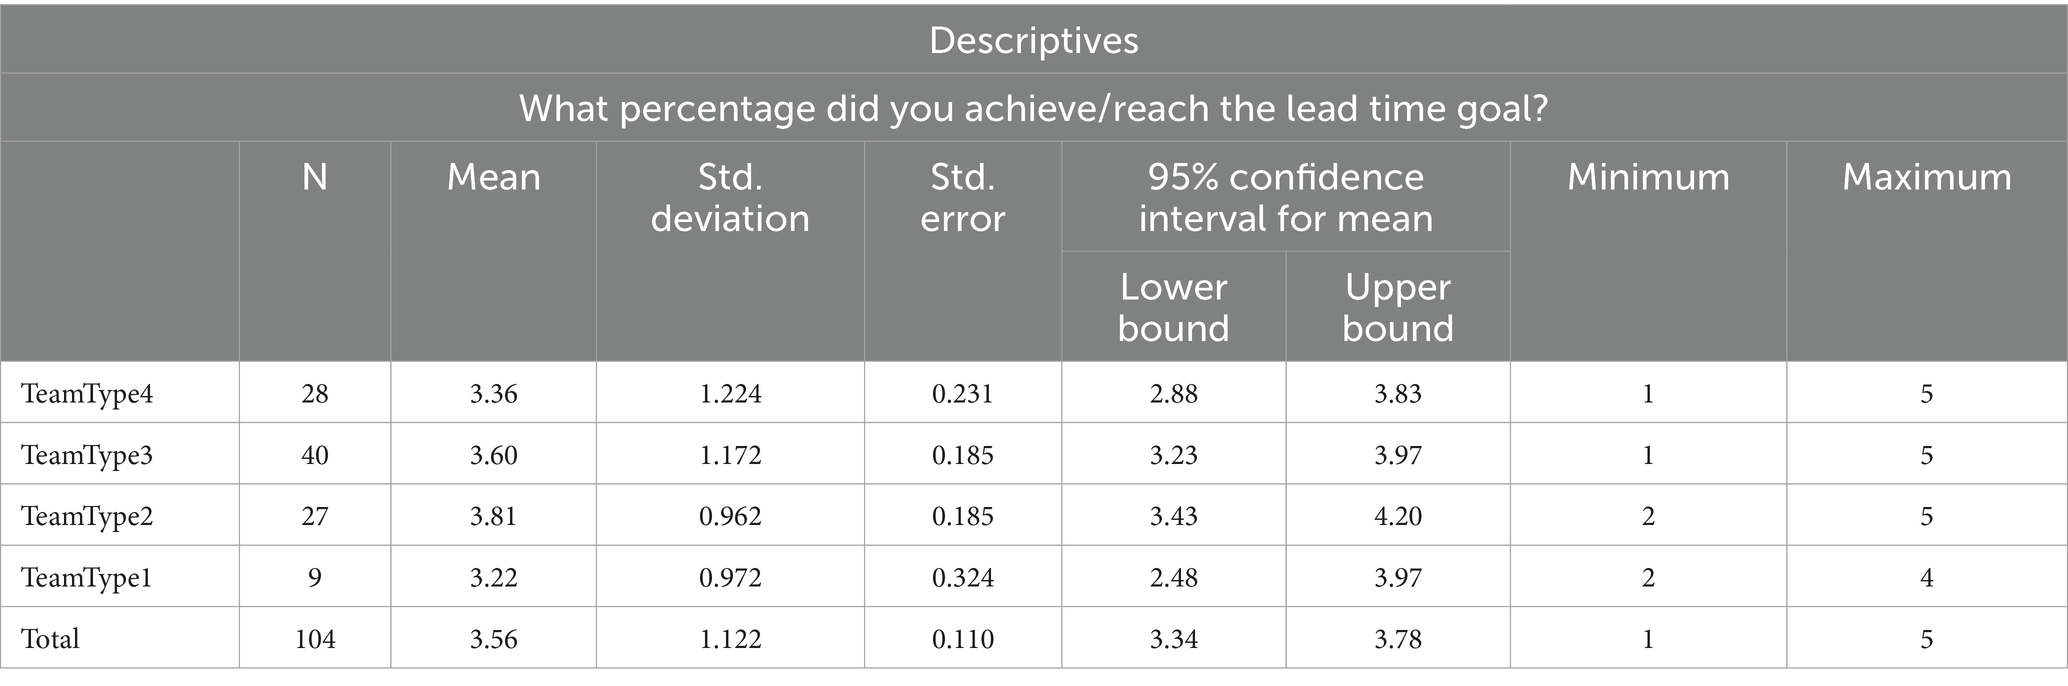
Table 4. Descriptive statistics for lead time.
ANOVA Hypothesis testing begins by testing if group variances are equal, using the Levene test. The hypotheses are:
• H0: The group variances are equal.
• H1: At least one group variance is different.
The significance value of 0.399 in Table 5 is greater than the significance level of 0.05. Thus, we accept the null hypothesis and state that the group variances are equal.
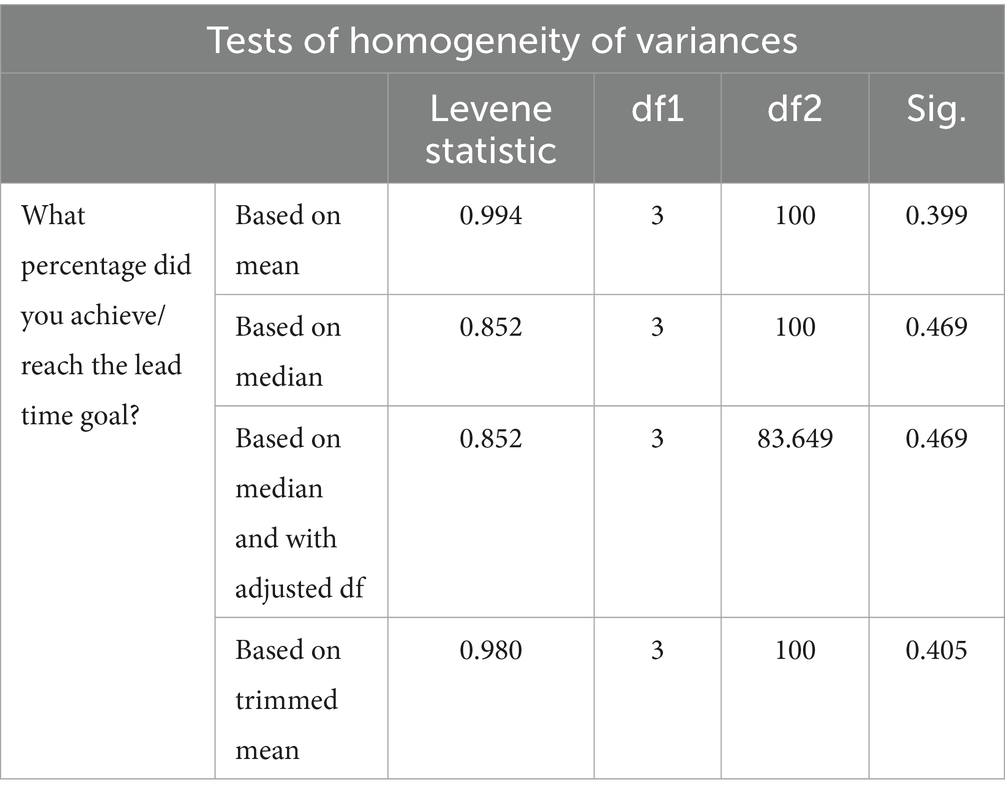
Table 5. Tests of homogeneity of variances for LT.
In this case, we ensured homogeneity assumptions; therefore, we use ANOVA to test group mean differentiation. The hypotheses are as follows:
• H0: Groups’ LT goal achievement percentage means are equal.
• H1: At least one of the groups’ LT goal achievement percentages is different.
The significance value of 0.370 in Table 6 is greater than the confidence level of 0.05. Therefore, we accept the null hypothesis and state that there is no statistical difference between the group Lead Time goal achievement percentage means. There is no significant performance difference between DevOps team formations from LT performance metric perspective.
a. The second performance-related test concerns Deployment Frequency (DF). We asked the participants to provide the average DF before and after moving DevOps. We use a Paired Samples T test for RQ1 to test whether there is a significant difference between the average DF before and after DevOps.
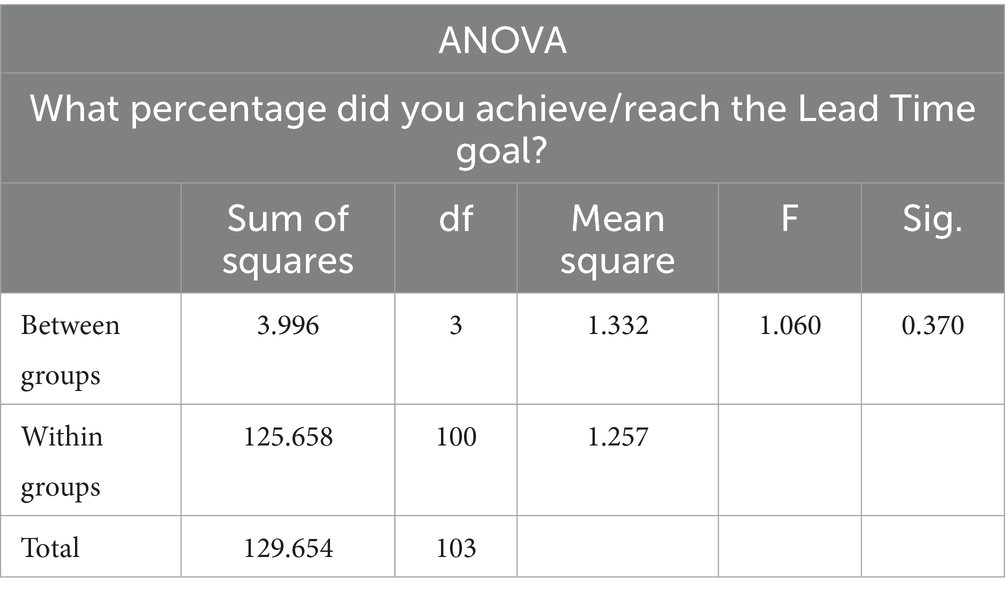
Table 6. ANOVA for LT.
The hypotheses for all four teams are as follows:
• H0: Before and After DevOps DF means are equal.
• H1: Before and After DevOps DF means are not equal.
The result in Table 7 shows that the significance values for TeamType2, TeamType3 and TeamType4 are less than the confidence level value (0.05); therefore, we reject the null hypothesis (H0) for them and conclude that there is a statistically significant difference for TeamType2, TeamType3 and TeamType4 Before and After DevOps for DF performance metric.
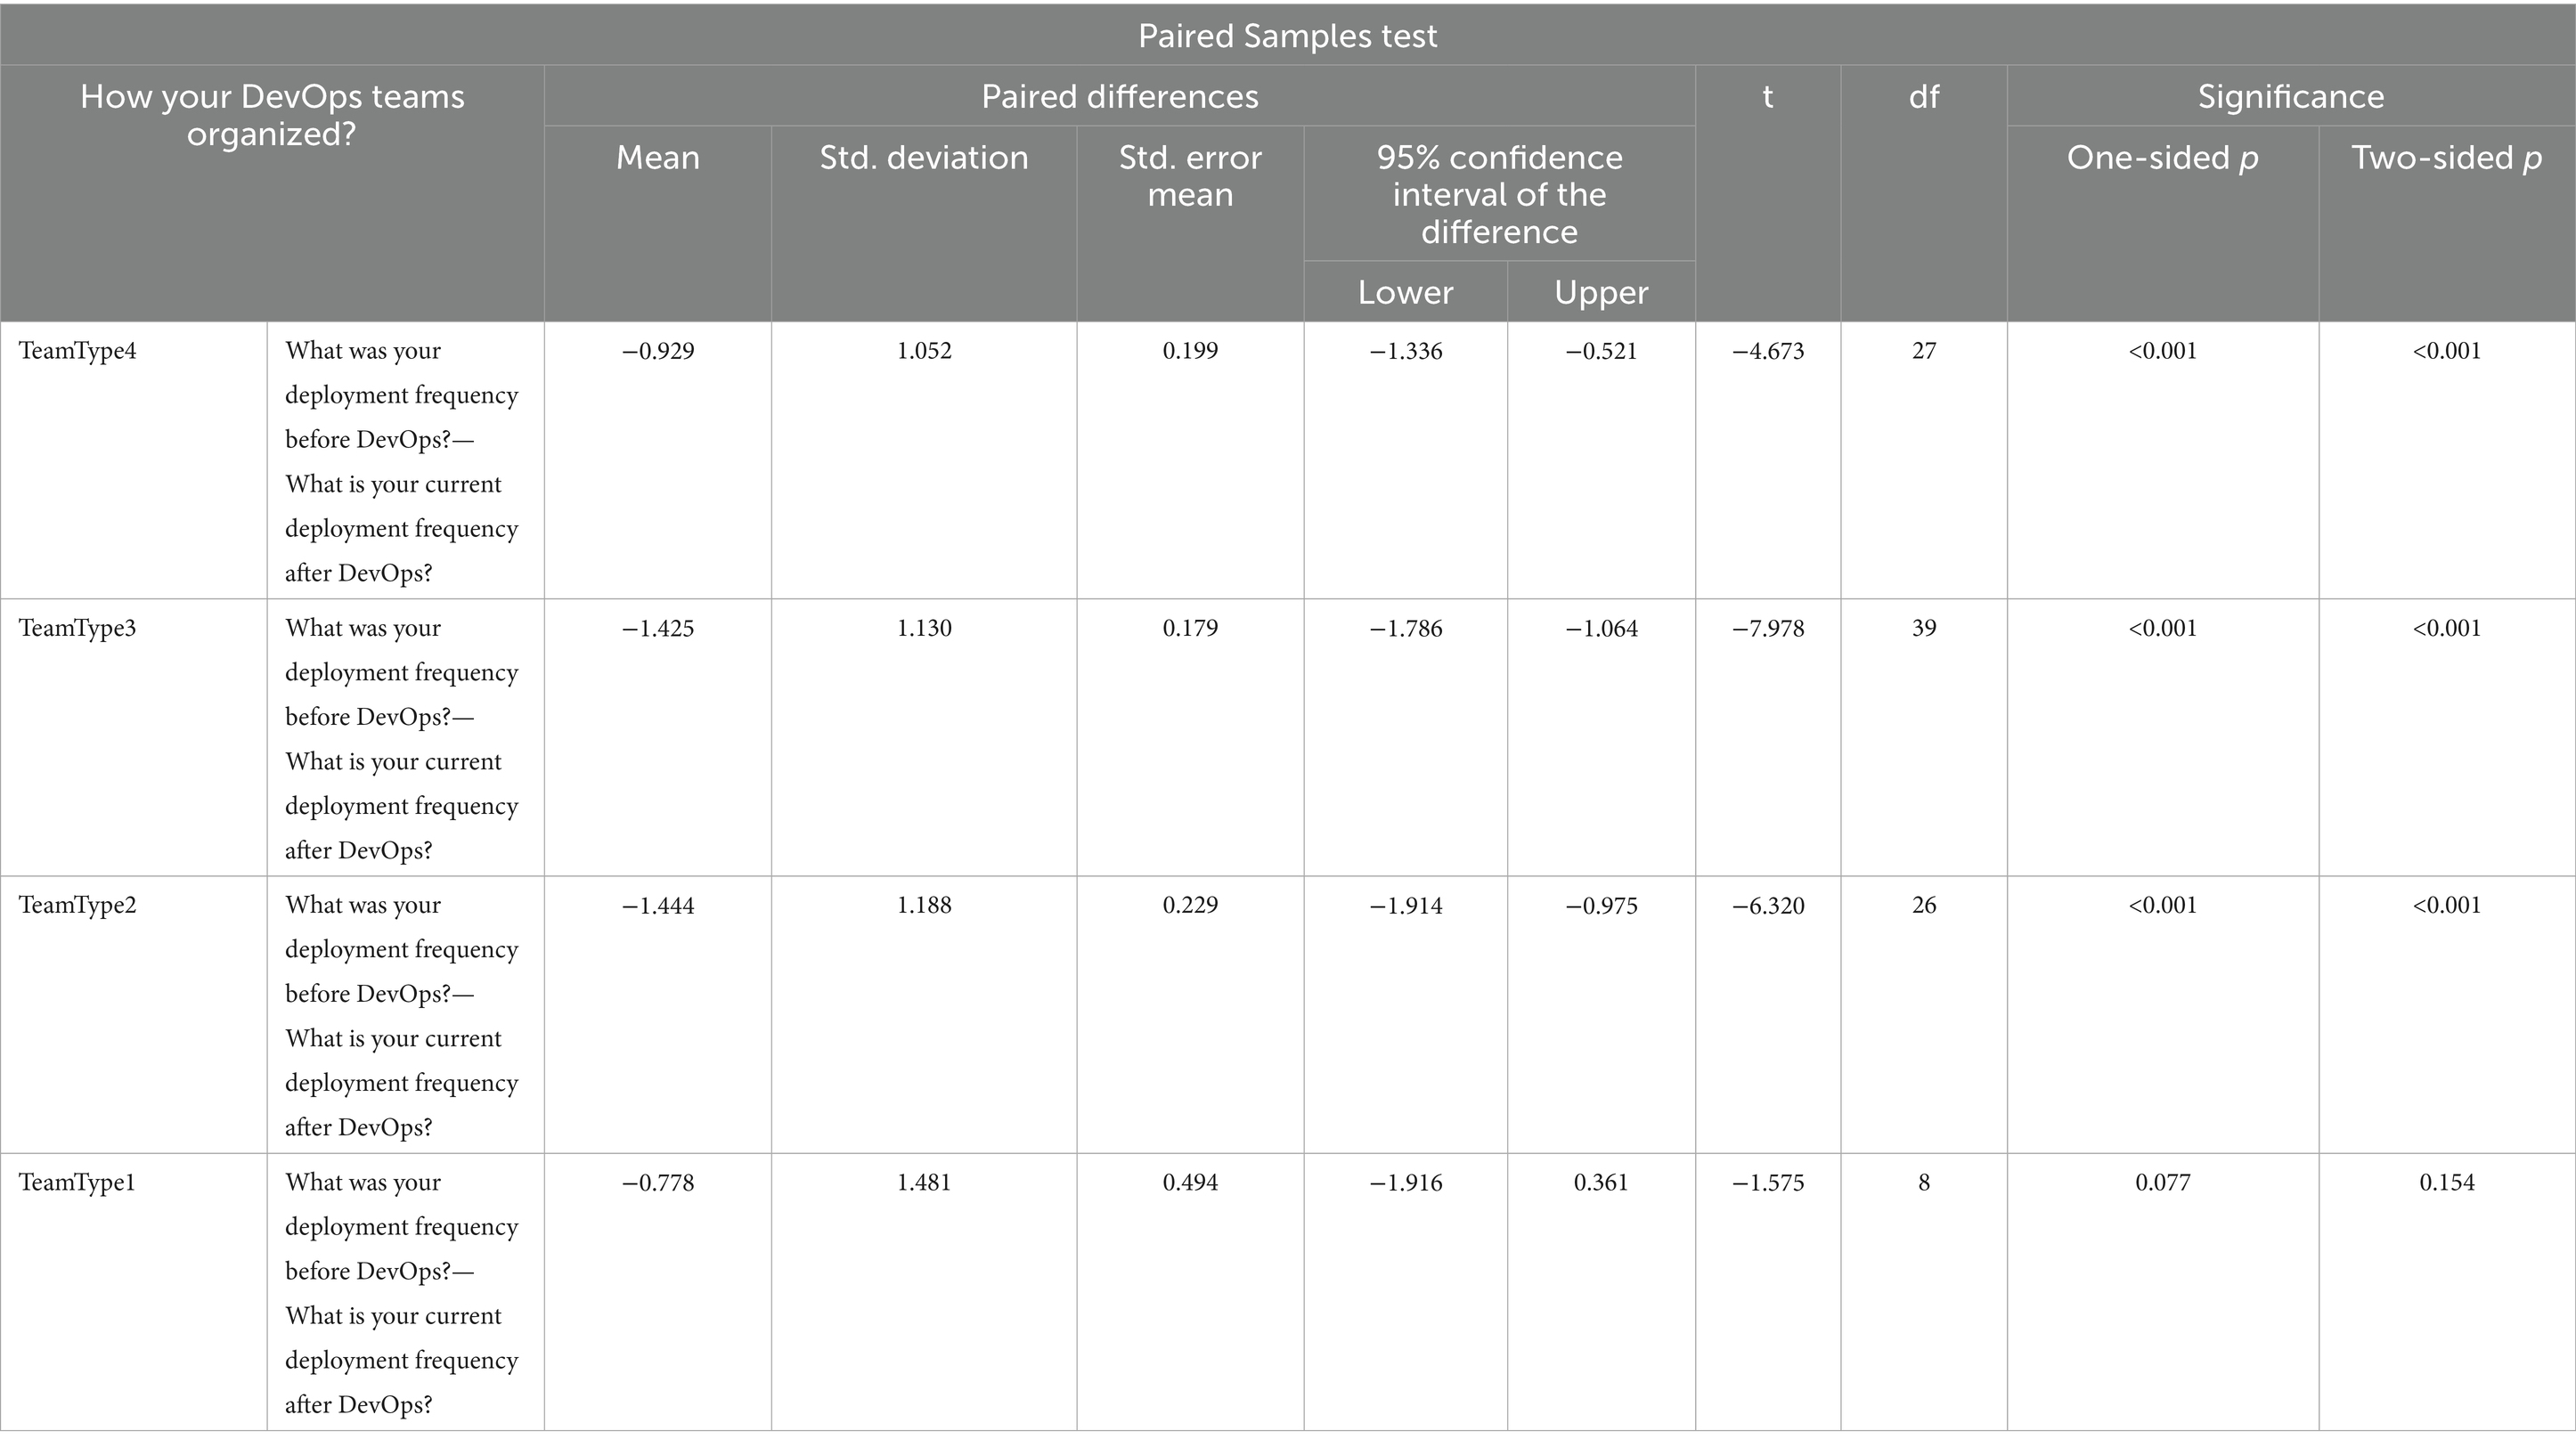
Table 7. Paired Sampled T tests for question DF.
For TeamType1, the significance value of TeamType1 in Table 7 is 0.154, which is greater than the confidence level value of 0.05; therefore, we accept the null hypothesis. In this case, we say that there is no statistically significant difference between Before and After DevOps for TeamType1 from DF performance metric perspective.
For RQ2, when we can compare the mean values in Table 7, we see that TeamType2 has the greatest value which is −1.444 and we can state that TeamType2 is the best performer among the all four DevOps team formations from DF perspective after DevOps was adopted.
To evaluate the goal achievement percentage between DevOps groups from a performance perspective for RQ3, we use variance analysis (ANOVA). This will determine whether there are statistically significant differences between the groups.
Table 8 shows that the DF goal means for each DevOps organization structure appear similar, but we must statistically test if the differences are significant.
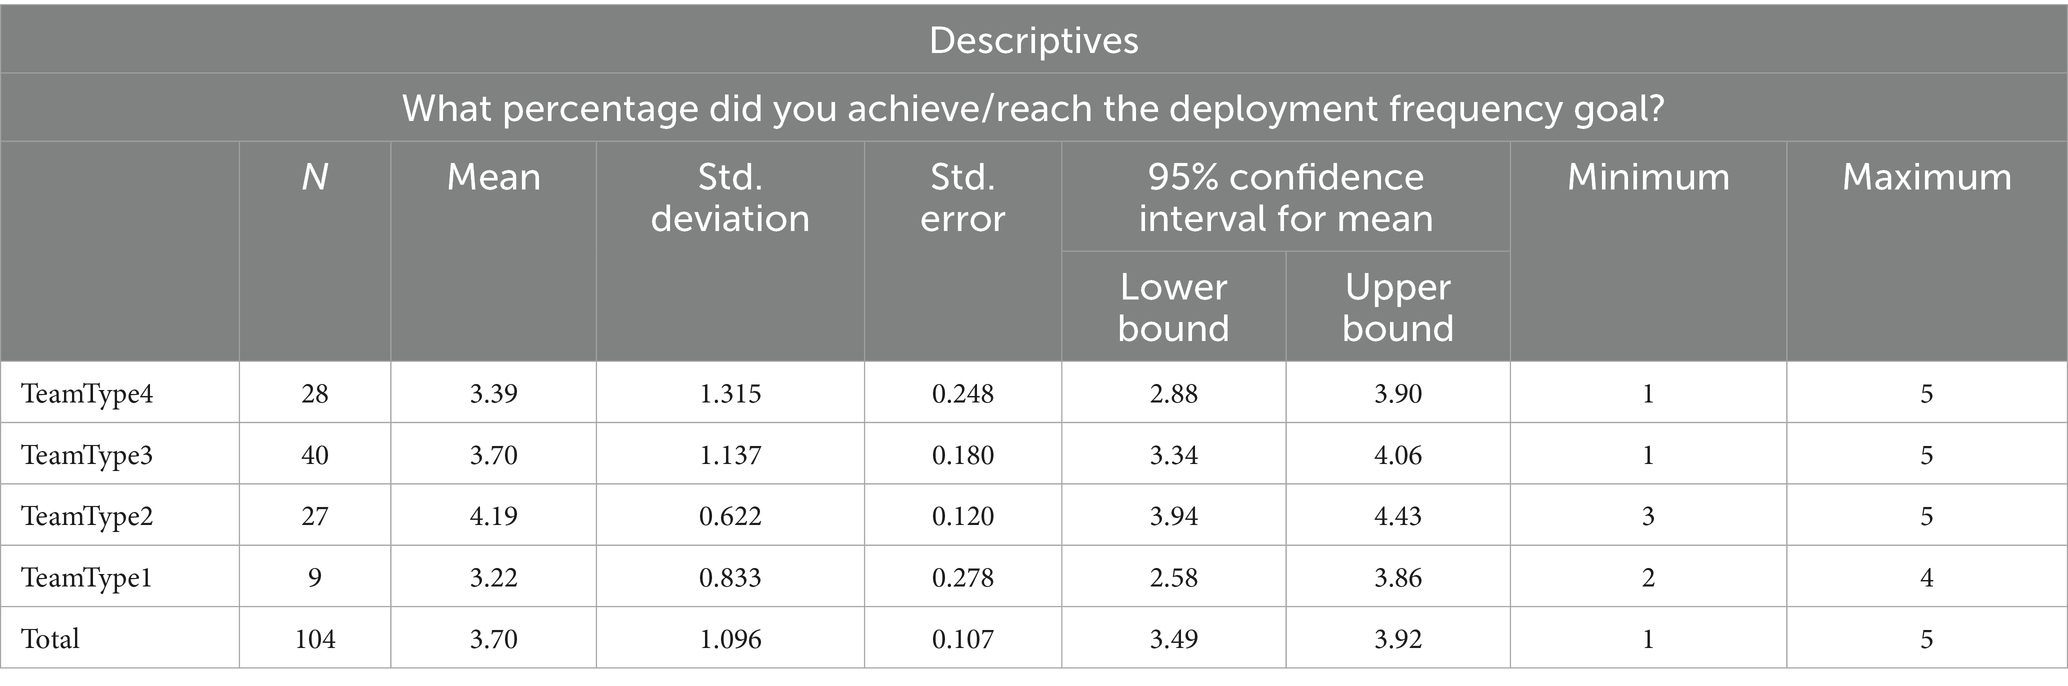
Table 8. Descriptive statistics for DF.
As the first step in the ANOVA test, we again use the Levene test to test whether the group variances are equal. The hypotheses are as follows:
• H0: The group variances are equal.
• H1: At least one group variance is different.
The significance value of 0.005 in Table 9 is less than the confidence level value of 0.05; therefore, we reject the null hypothesis and say that the group variances are not equal. Because of the variance difference, the variance homogeneity assumption is rejected and the ANOVA test should not be used directly. We use the Brown-Welch test to determine whether group means are equal.
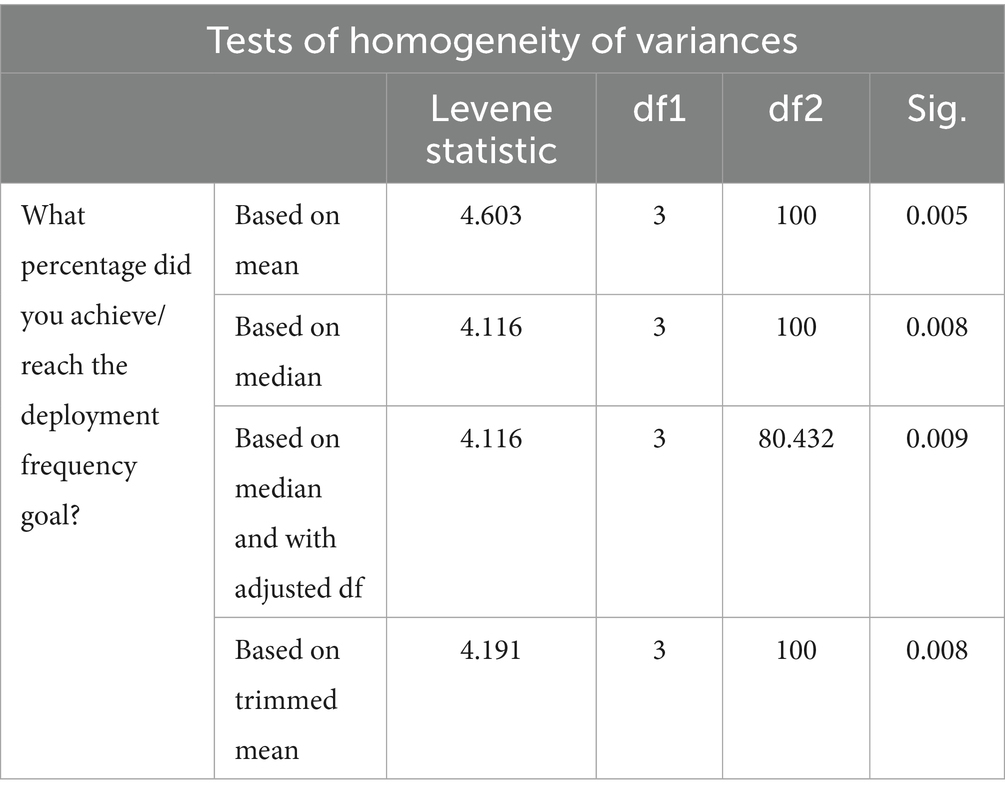
Table 9. Tests of homogeneity of variances for DF.
The hypotheses are as follows:
• H0: Groups DF goal achievement percentage means are equal.
• H1: At least one of the groups’ DF goal achievement percentages is different.
The significance value of 0.004 in Table 10 is less than the confidence level of 0.05; therefore, we reject the null hypothesis and say that there is a statistical difference between the group DF goal achievement percentage means. DevOps organization structure types provide a significant difference in DF goal achievement. In this case, we need to examine the Post hoc test Tamhane in Table 11 to identify the difference.
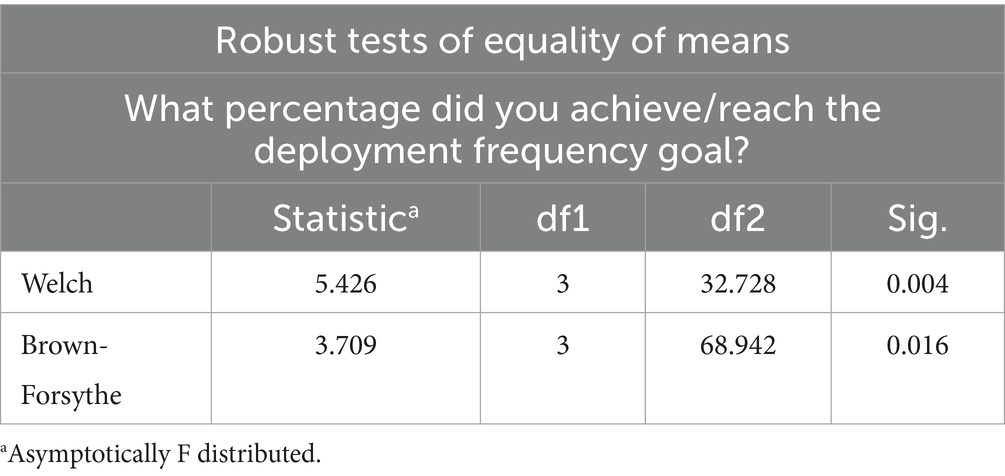
Table 10. Brown-Welch test for DF.
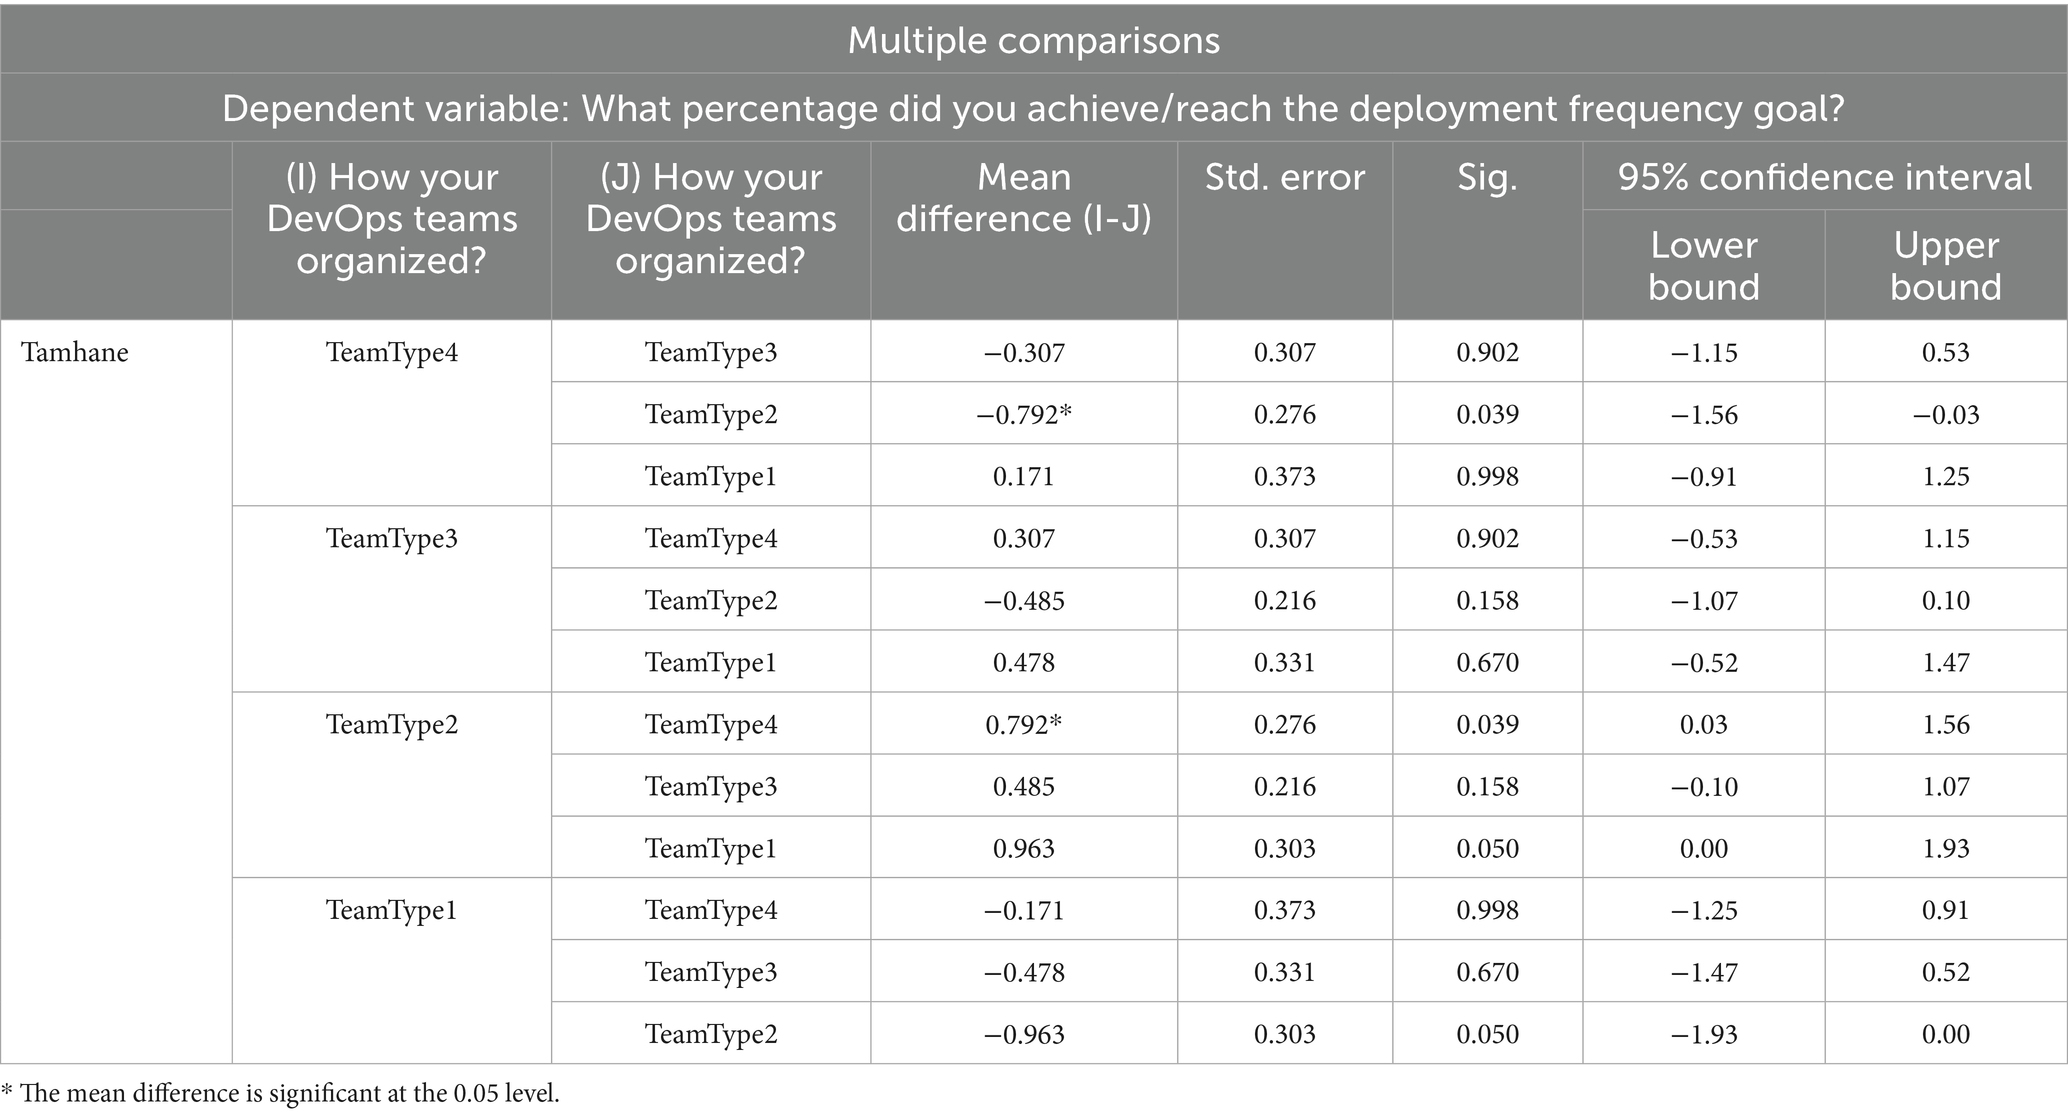
Table 11. The post hoc test Tamhane for DF.
Post hoc tests revealed that one group differed from the others. The hypothesis for TeamType2 is as follows:
• H0: DF goal achievement percentage mean for TeamType2 is equal to DF goal achievement percentage mean for TeamType4.
• H1: DF goal achievement percentage means are not equal between TeamType2 and TeamType4.
The significance value of 0.039 in Table 11 is less than the confidence level 0.05, indicating that the group means are not equal. There is a significant difference between TeamType2 and TeamType4, and TeamType2 (Mean is 4.19) performs better than TeamType4 (Mean is 3.39). However, when the same method is applied to other groups with a 0.005 confidence level, the Post hoc Tamhane test revealed no significant differences, and suggesting equal group means.
a. The next performance test measures Mean Time To Repair/Recovery (MTTR). We asked participants to provide MTTR before and after DevOps and use Paired Samples T test for RQ1 to determine if there is a significant difference between the two.
The hypotheses for all four teams are as follows:
• H0: Before and After DevOps MTTR means are equal.
• H1: Before and After DevOps MTTR means are not equal.
The result in Table 12 shows that the significance values for all four DevOps team structures are less than the confidence level value (0.05); therefore, we reject the null hypothesis (H0) for all and conclude that there is a statistically significant difference Before and After DevOps for MTTR performance metric.

Table 12. Paired Sampled T tests for MTTR.
For RQ2, when we can compare the mean values in Table 12, we see that TeamType4 has the greatest value which is −1.036 and we can state that TeamType4 is the best performer among the all four DevOps team formations from MTTR perspective after DevOps was adopted.
For RQ3, we will assess whether there are significant differences in the application repair/recovery SLA (MTTR) goal achievement percentage among the four DevOps groups. To compare the groups, we use variance analysis (ANOVA).
The MTTR goal means in Table 13 for each DevOps organization structure are similar, but we need to determine whether the differences are statistically significant.
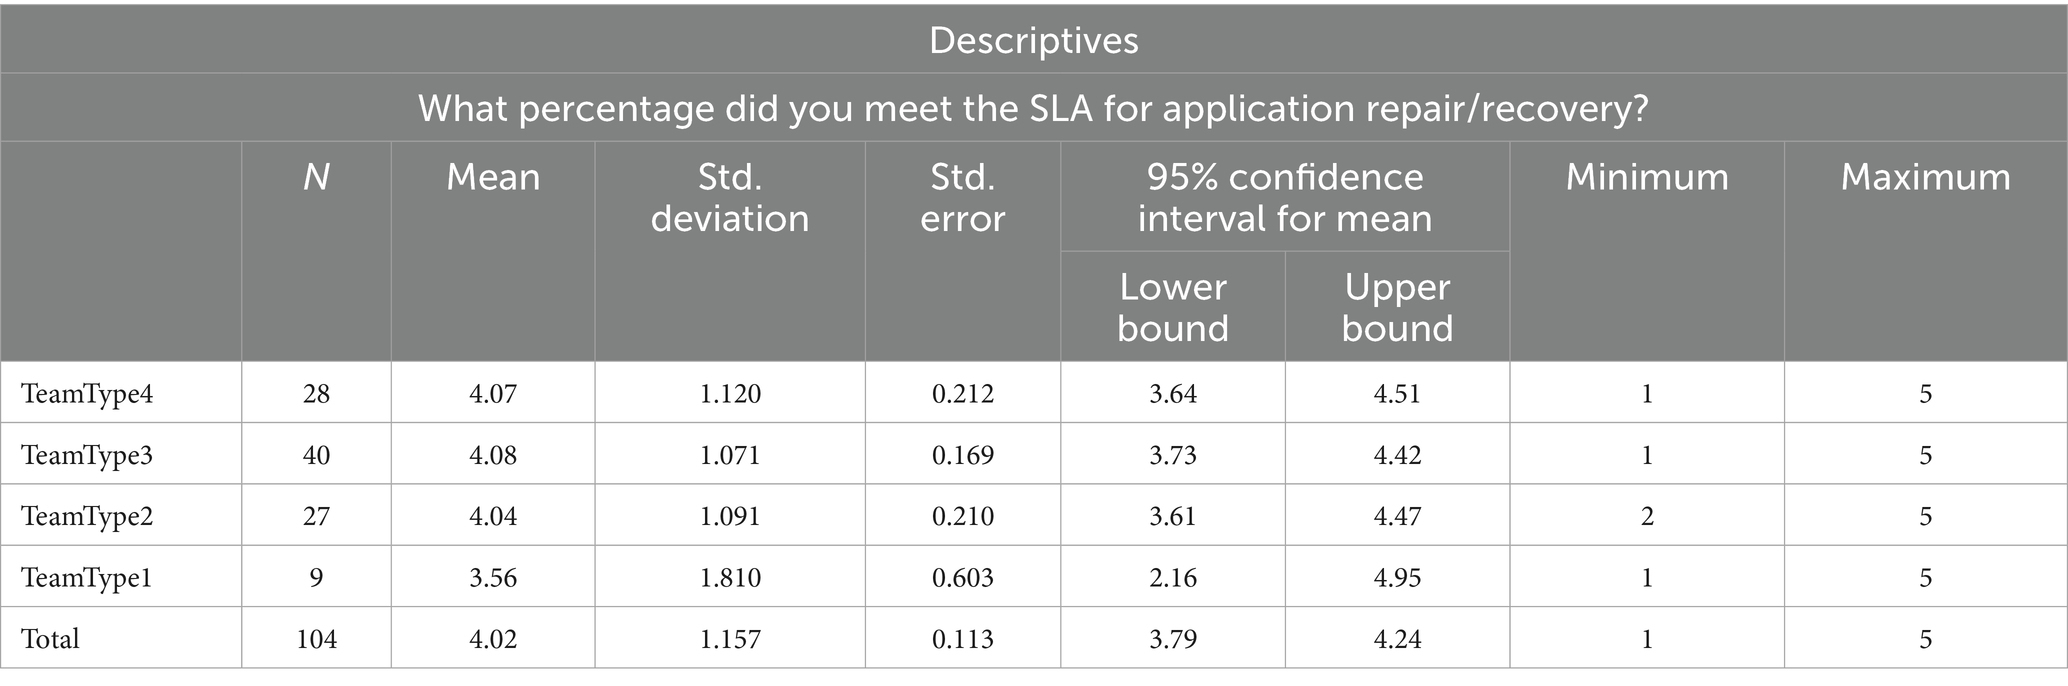
Table 13. Descriptive statistics for MTTR.
Once again, we use Levene’s test to determine whether the group variances are equal as the first step in the ANOVA Hypothesis testing. The hypotheses are as follows:
• H0: The group variances are equal.
• H1: At least one group variance is different.
The significance value of 0.017 in Table 14 is less than the confidence value of 0.005. Consequently, we reject the null hypothesis and state that group variances are not equal.
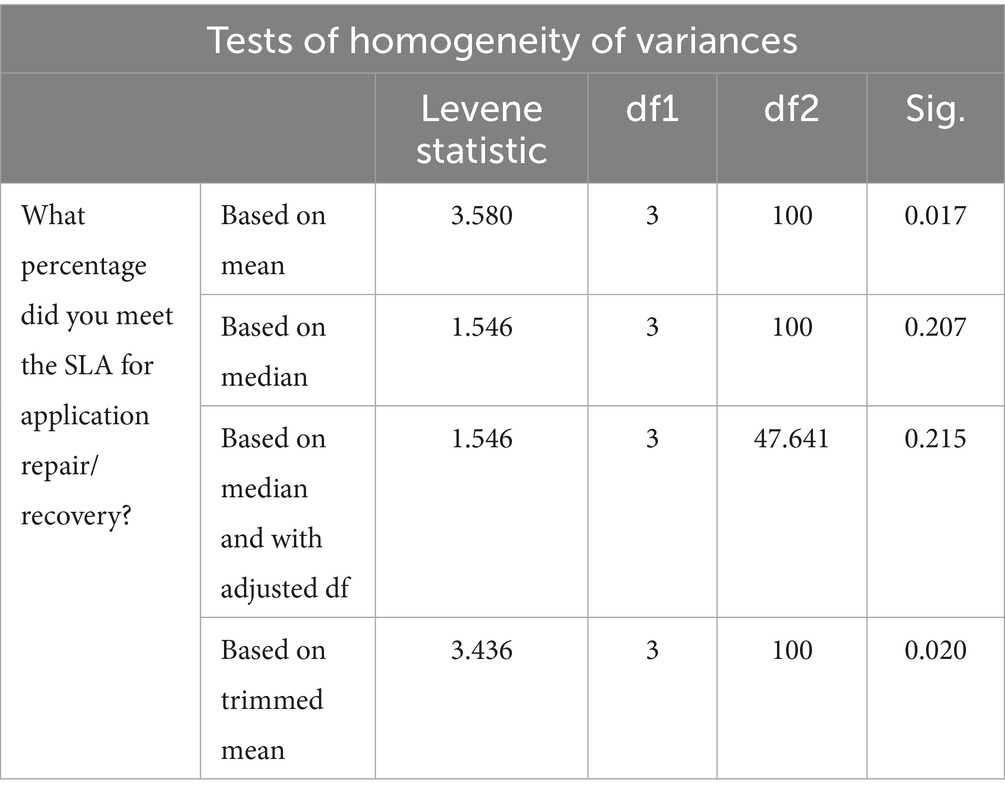
Table 14. Tests of homogeneity of variances for MTTR.
As the variance homogeneity assumption is rejected, the ANOVA test should not be used directly. Instead, we use the Brown-Welch Test to determine whether the group means are equal.
The hypotheses are as follows:
• H0: Group application repair/recovery SLA (MTTR) goal means are equal.
• H1: At least one of the group application repair/recovery SLA (MTTR) goal means is different.
The significance value of 0.878 in Table 15 is greater than the confidence level of 0.05. Therefore, we accept the null hypothesis and state that there is no statistical difference between group application repair/recovery SLA (MTTR) goal means. There is no significant performance difference between DevOps team formations from MTTR performance metric perspective. DevOps organization structure types do not provide a significant difference in application repair/recovery SLA (MTTR) goal achievement.
a. We test the Number of Incidents (NoI) using a Paired Samples T test for RQ1 to determine if there is a significant difference in the average DevOps incidents before and after.
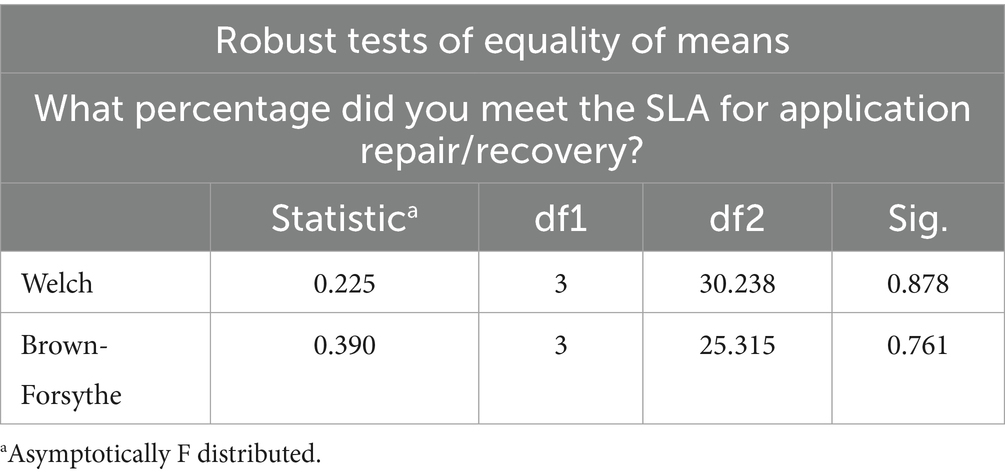
Table 15. Brown-Welch test for MTTR.
The hypotheses for all four teams are as follows:
• H0: Before and After DevOps NoI means are equal.
• H1: Before and After DevOps NoI means are not equal.
The result in Table 16 shows that the significance values for TeamType2, TeamType3 and TeamType4 are less than the confidence level value (0.05); therefore, we reject the null hypothesis (H0) for TeamType2, TeamType3 and TeamType4, and conclude that there is a statistically significant difference Before and After DevOps for NoI performance metric.
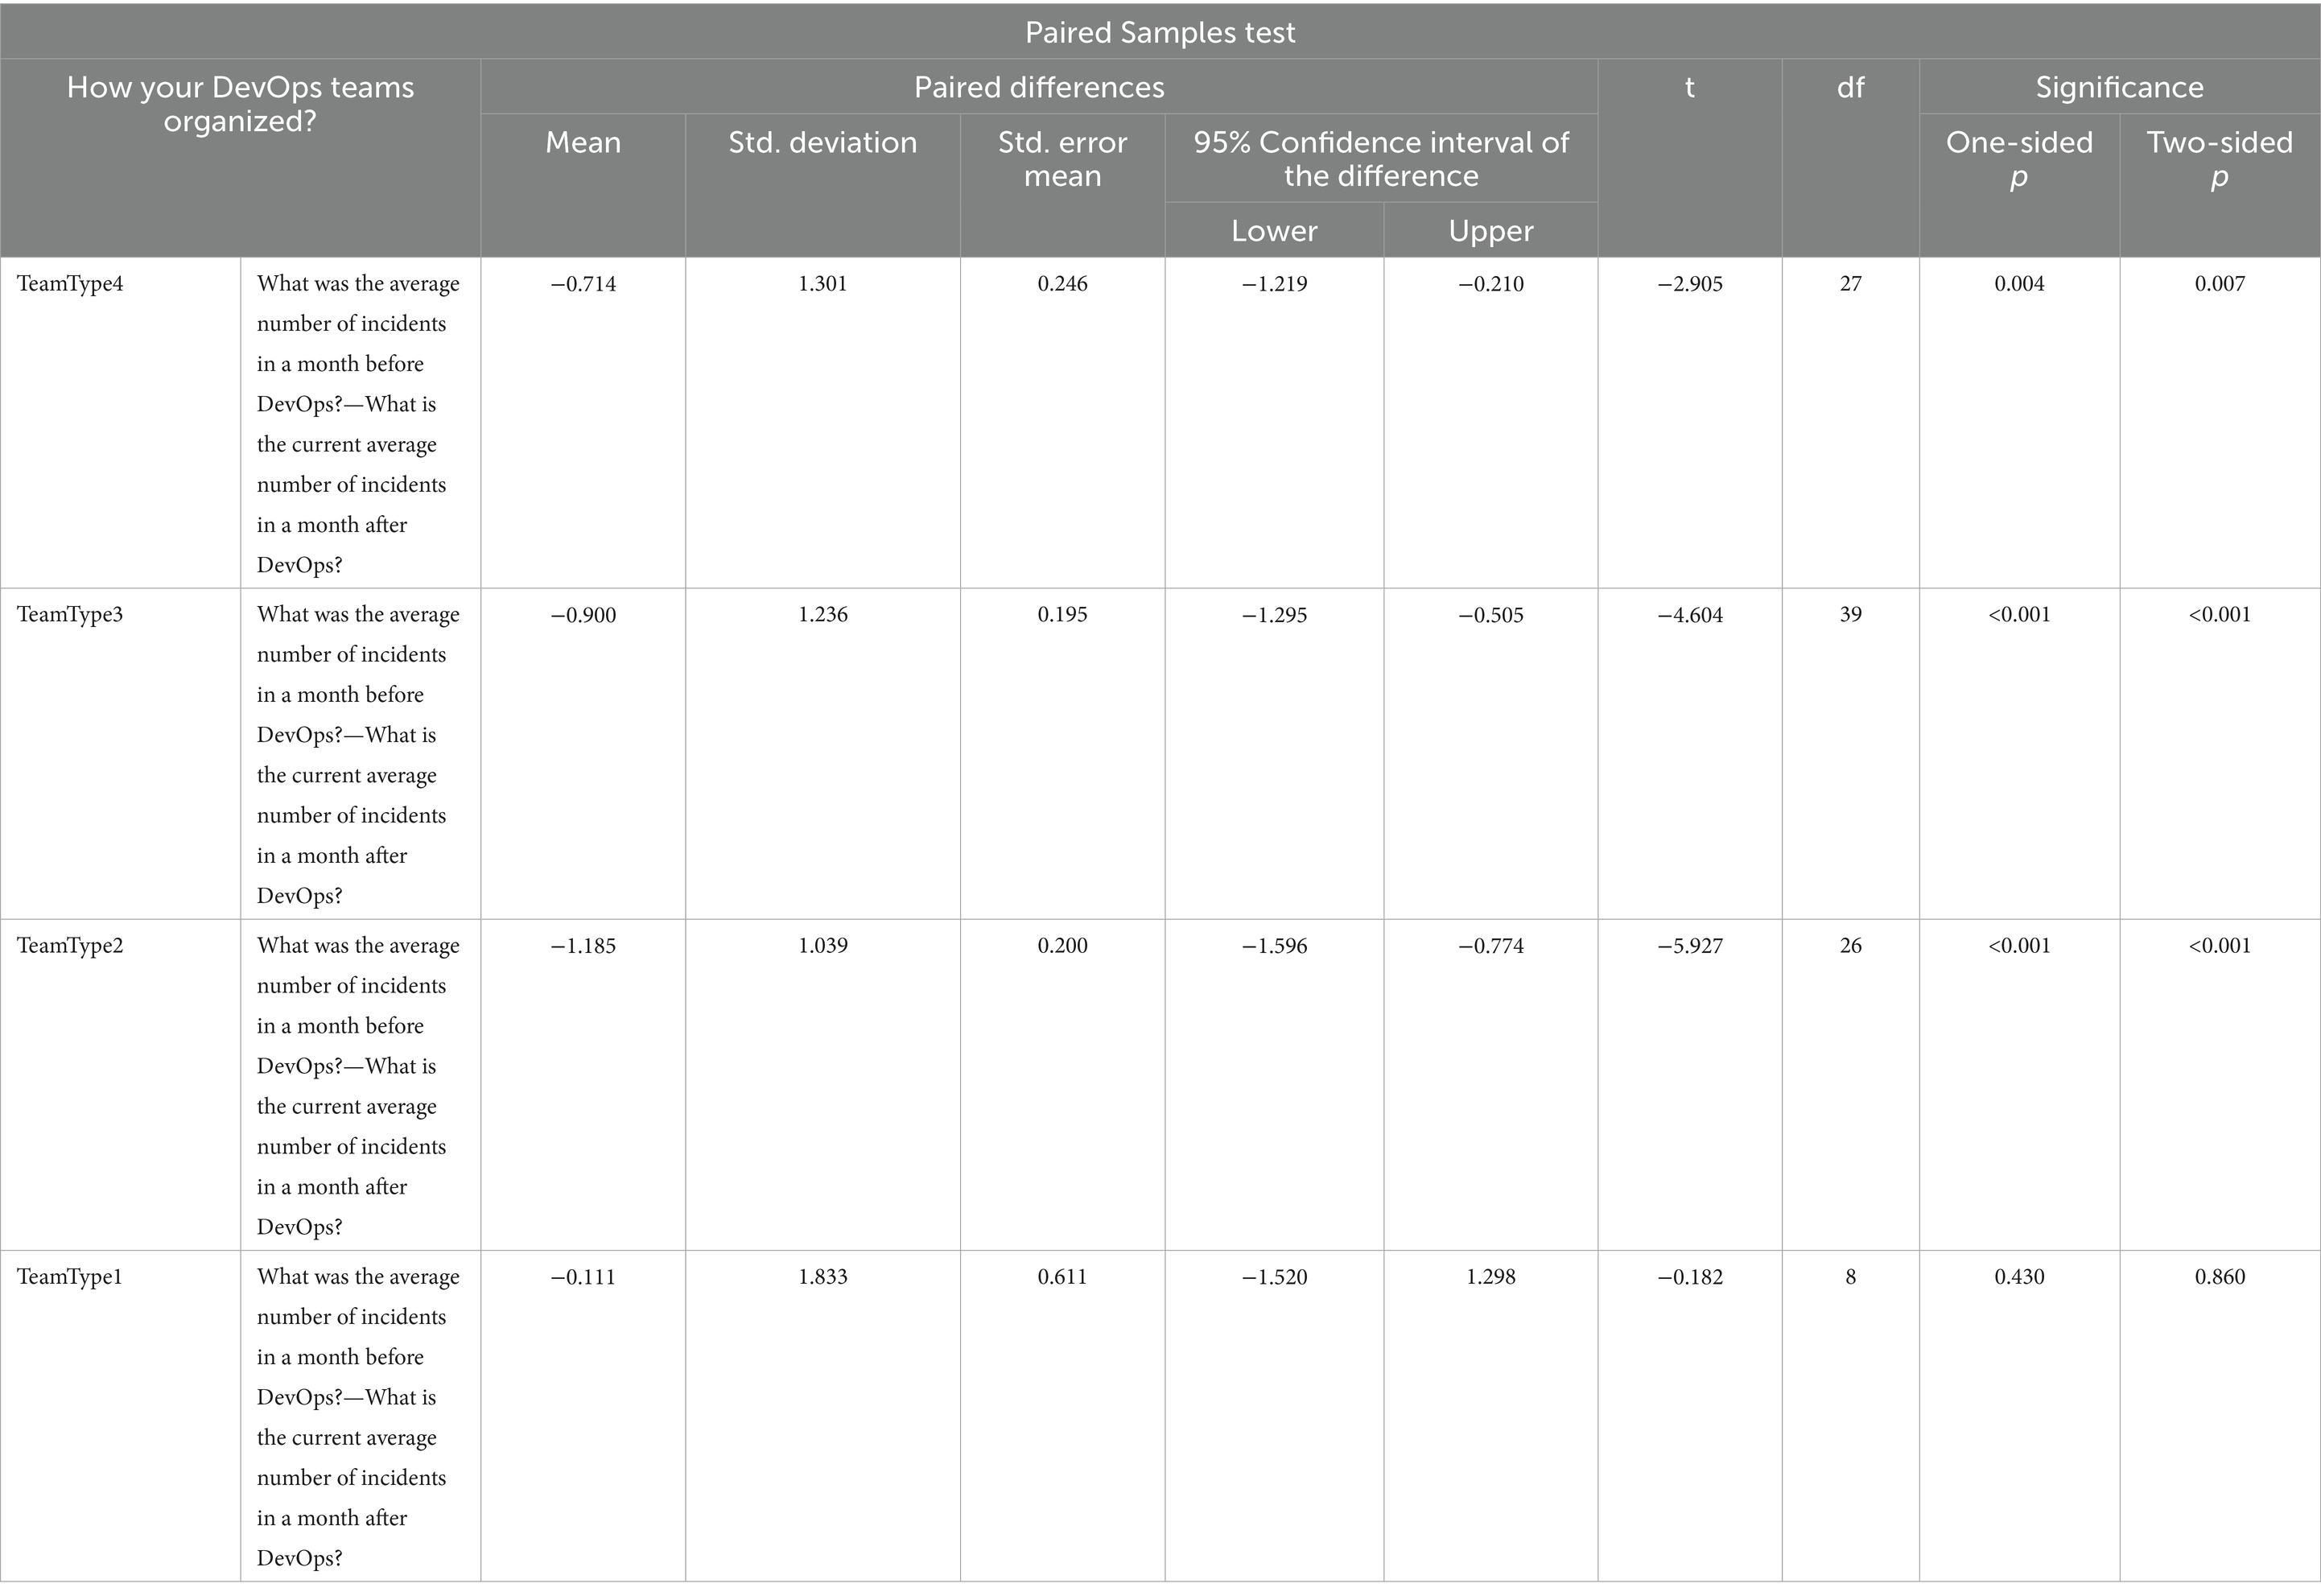
Table 16. Paired Sampled T tests for NoI.
For TeamType1, the significance value of TeamType1 in Table 16 is 0.860, which is greater than the confidence level value of 0.05; therefore, we accept the null hypothesis. In this case, we say that there is no statistically significant difference between Before and After DevOps for TeamType1 from NoI performance metric perspective.
For RQ2, when we can compare the mean values in Table 16, we see that TeamType4 has the greatest value which is −1.185 and we can state that TeamType4 is the best performer among the all four DevOps team formations from MTTR perspective after DevOps was adopted.
a. To test the Number of Failures/Service Interruptions (NoF/NoSI), we use the Paired Samples T test for RQ1 to determine if there is a significant difference in the average NoF/NoSI before and after DevOps.
The hypotheses for all four teams are as follows:
• H0: Before and After DevOps NoF/NoSI means are equal.
• H1: Before and After DevOps NoF/NoSI means are not equal.
The result in Table 17 shows that the significance values for TeamType2, TeamType3 and TeamType4 are less than the confidence level value (0.05); therefore, we reject the null hypothesis (H0) for them and conclude that there is a statistically significant difference for TeamType2, TeamType3 and TeamType4 Before and After DevOps from NoF/NoSI performance metric perspective.
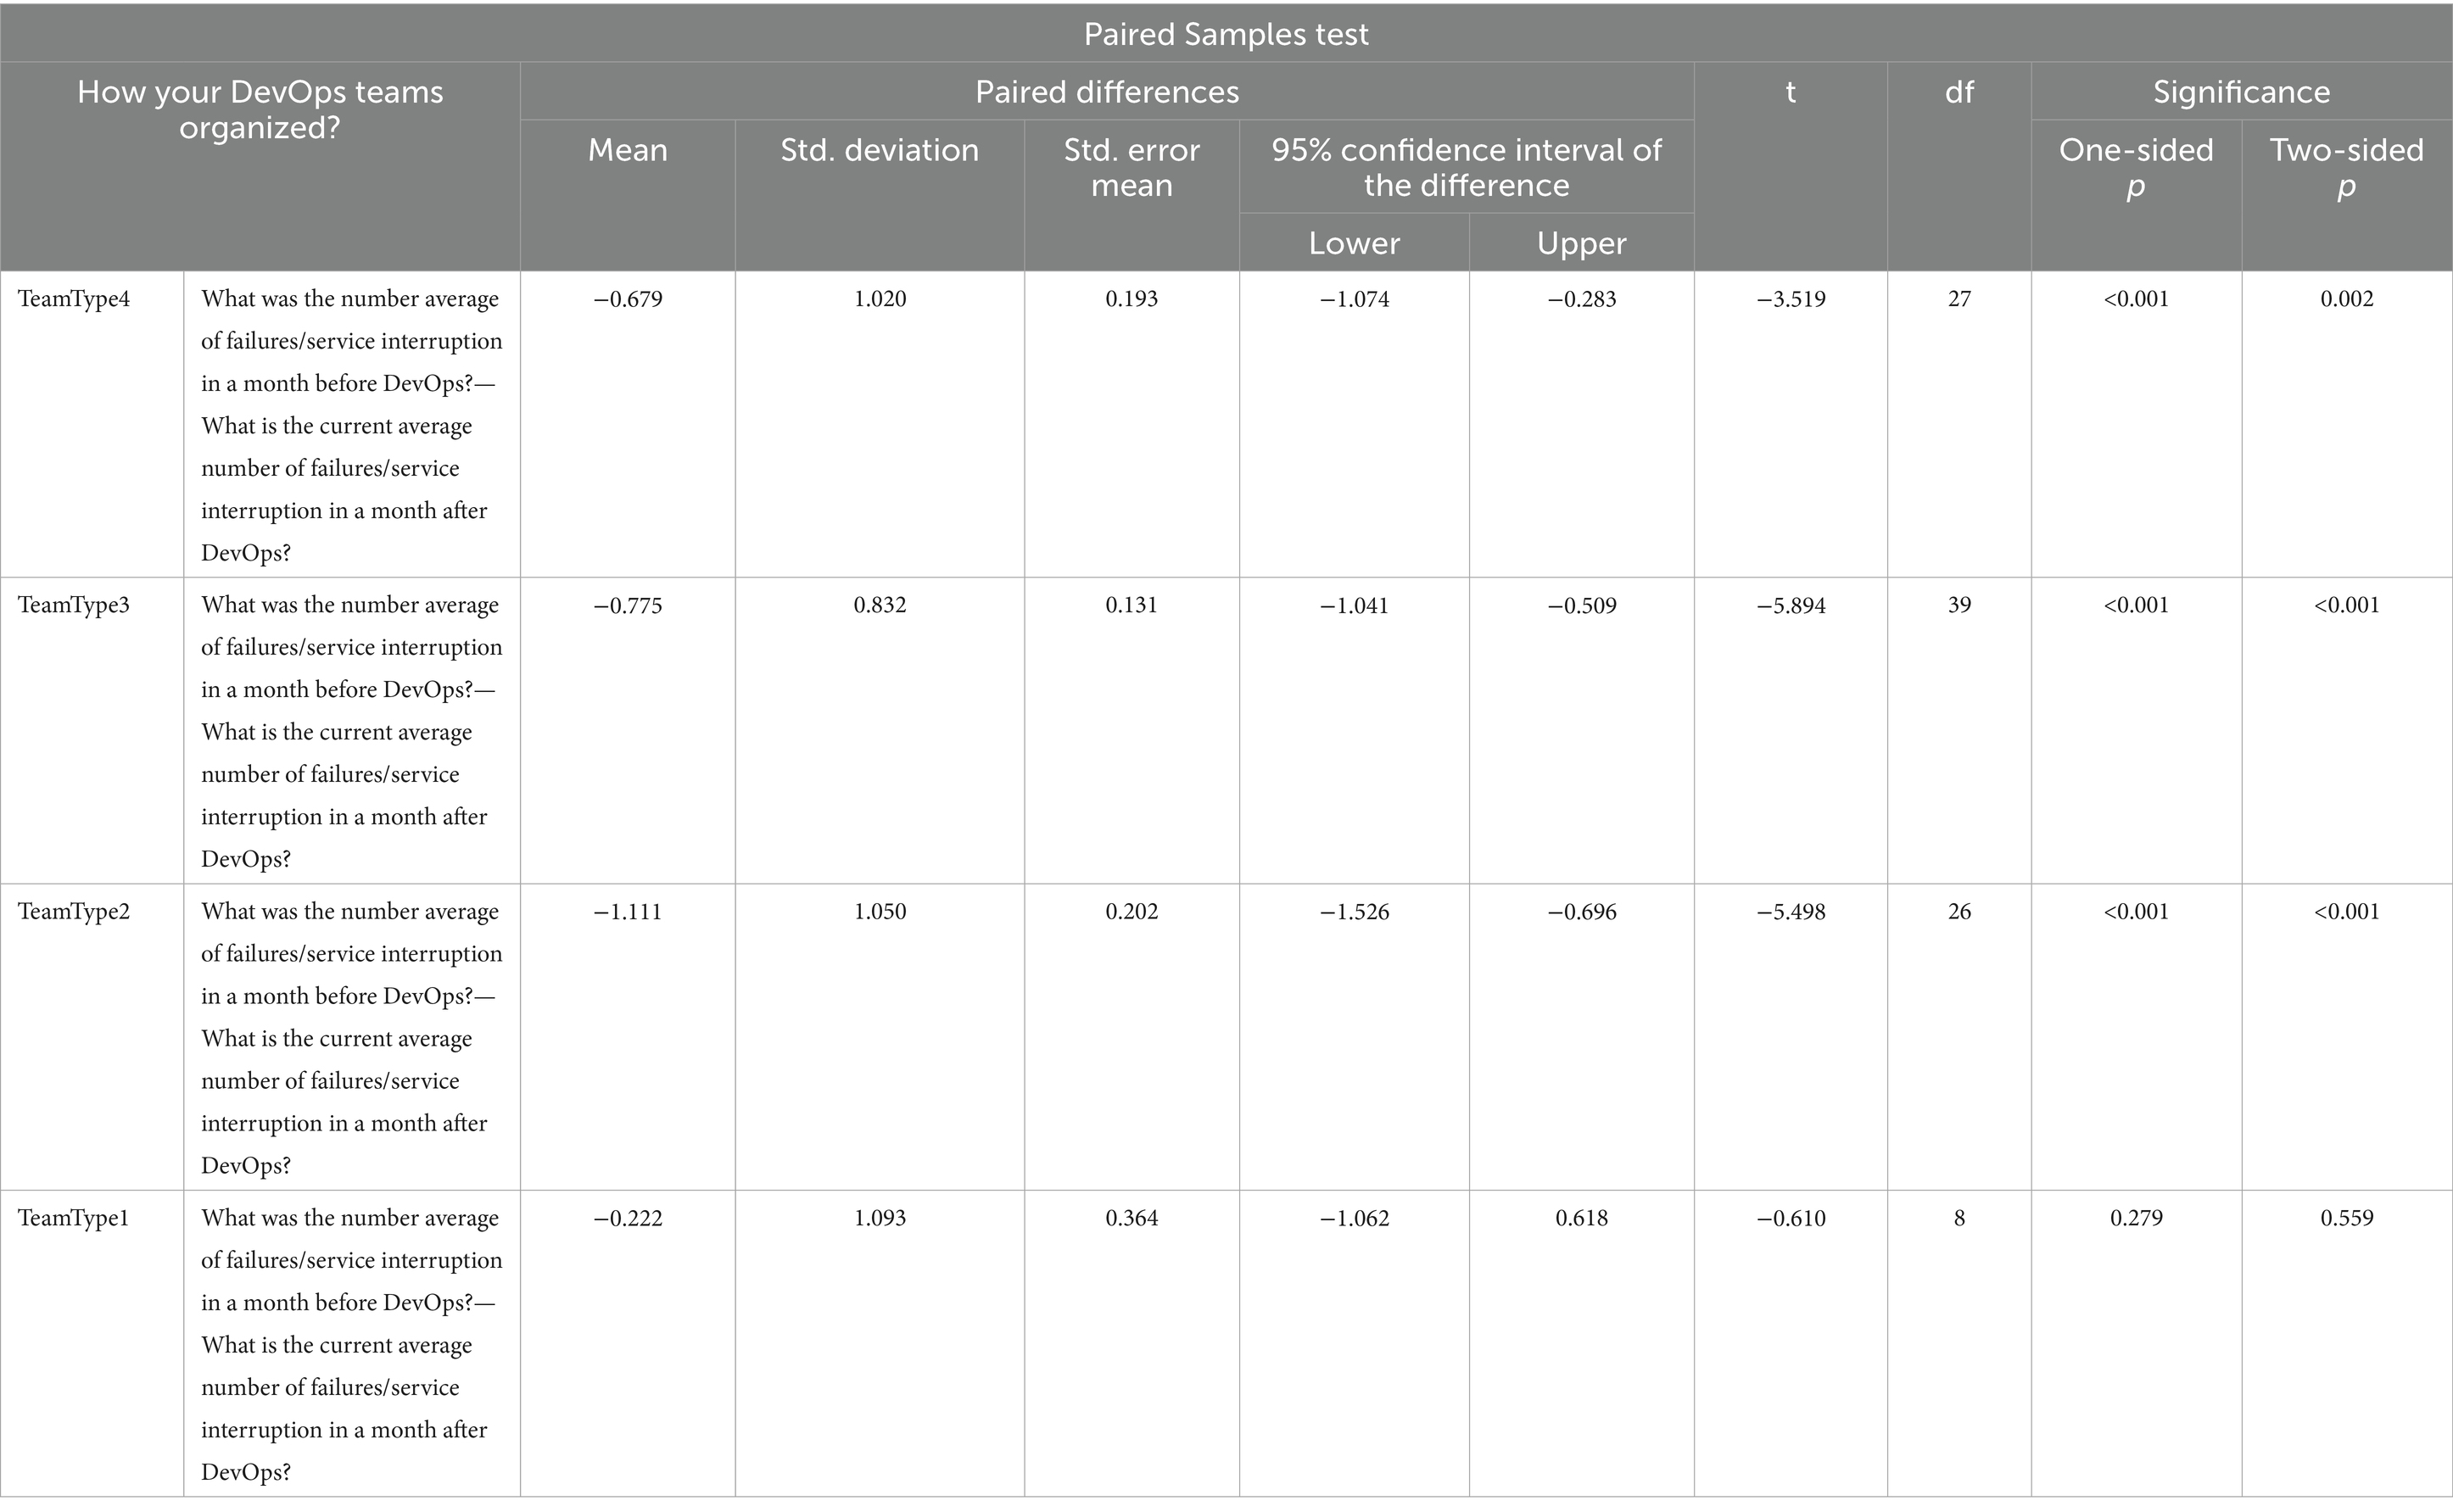
Table 17. Paired Sampled T tests for NoF/NoSI.
For TeamType1, the significance value of TeamType1 in Table 17 is 0.559, which is greater than the confidence level value of 0.05; therefore, we accept the null hypothesis. In this case, we say that there is no statistically significant difference between Before and After DevOps for TeamType1 from NoF/NoSI performance metric perspective.
For RQ2, when we can compare the mean values in Table 17, we see that TeamType2 has the greatest value which is −1.111 and we can state that TeamType2 is the best performer among the all four DevOps team formations from NoF/NoSI perspective after DevOps was adopted.
For RQ3, we will assess whether there are statistically significant differences in (NoF/NoSI) the application availability Service Level Agreement (SLA) goal achievement percentage between four DevOps groups. To compare groups, we use variance analysis (ANOVA).
The application availability SLA goal from NoF/NoSI perspective in Table 18 for each DevOps organizational structure is similar, but we need to test whether the difference is statistically significant.
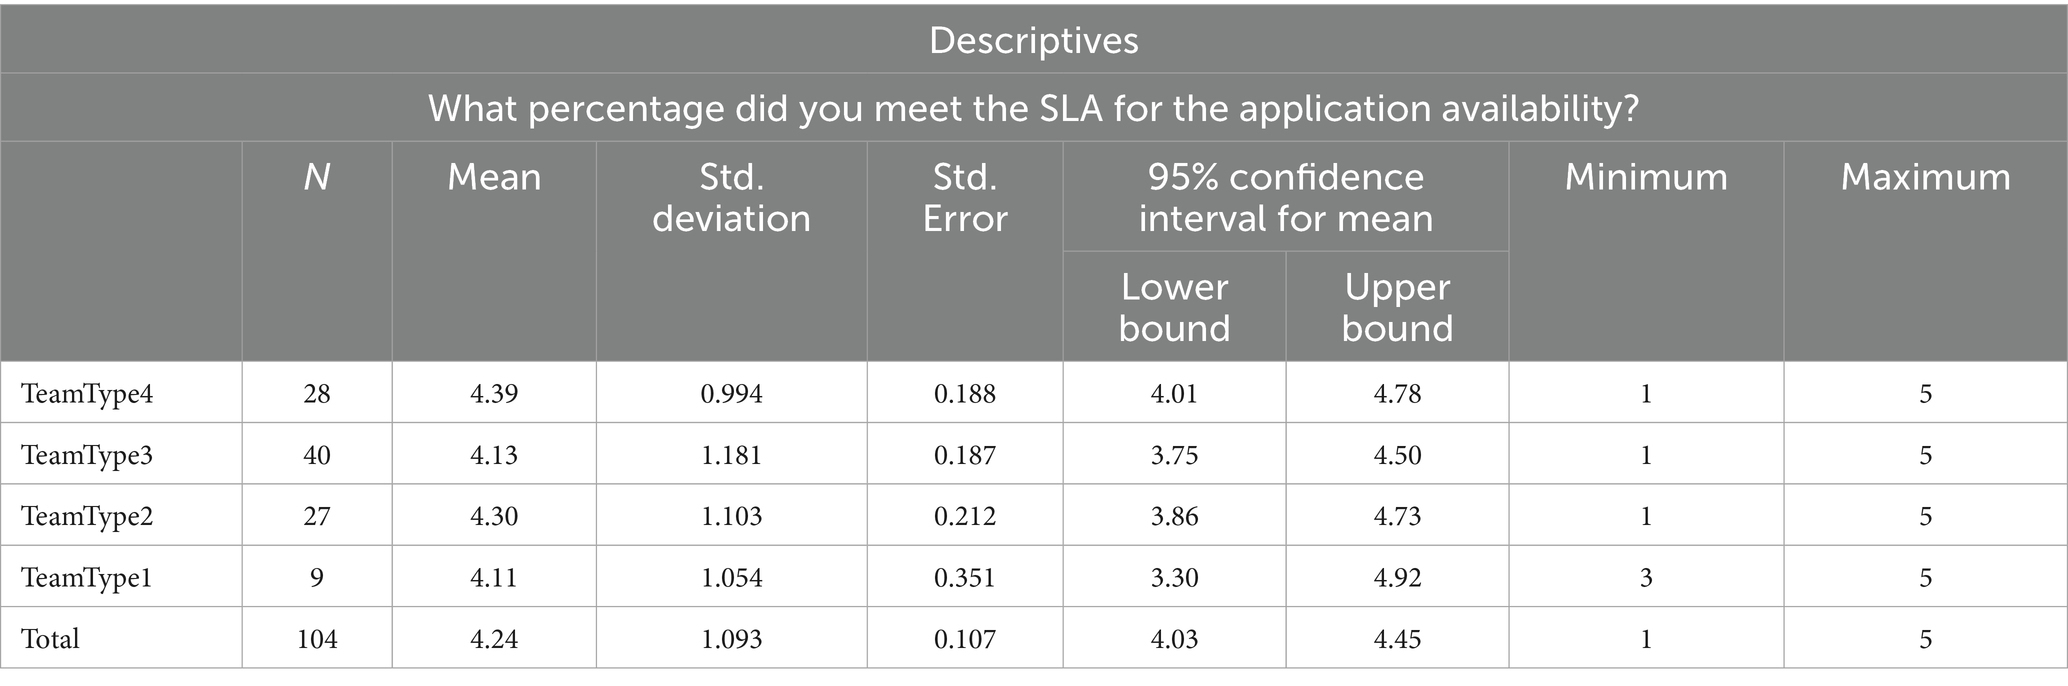
Table 18. Descriptive statistics for NoF/NoSI.
As the first step of ANOVA Hypothesis, we use Levene’s test to determine whether the group variances are equal. The hypotheses are as follows:
• H0: The group variances are equal.
• H1: At least one group variance is different.
The significance value of 0.660 in Table 19 is greater than the confidence value of 0.05; therefore, we accept the null hypothesis and state that the group variances are equal.
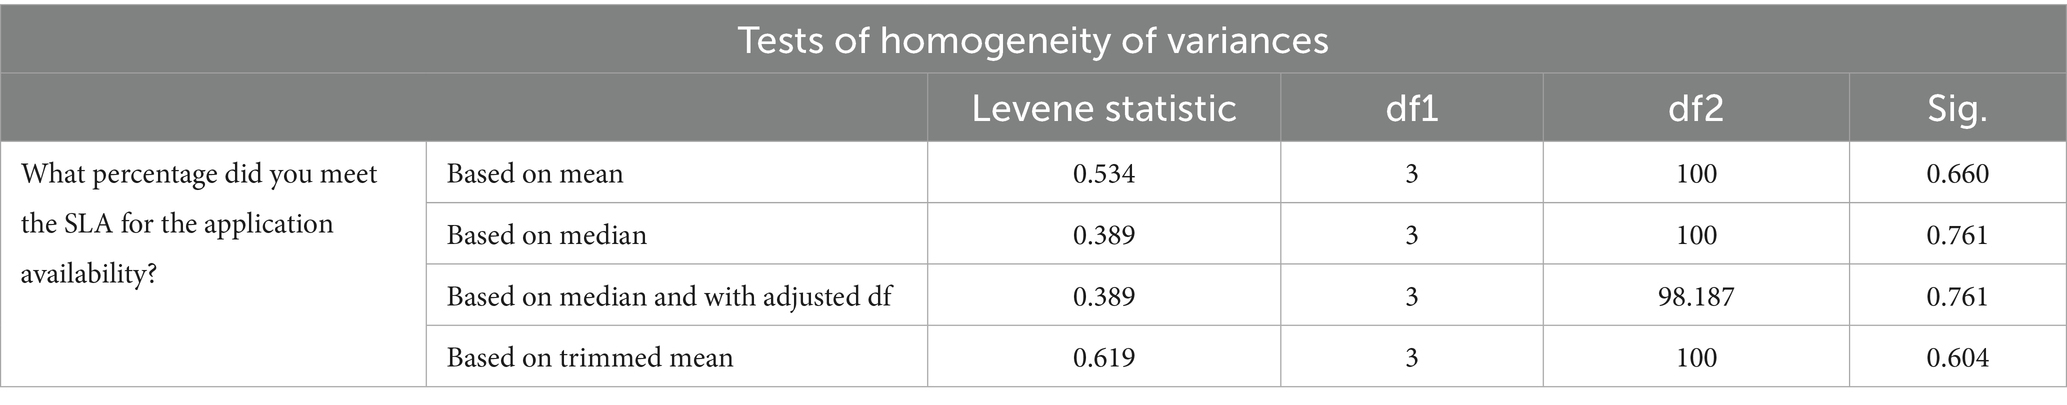
Table 19. Tests of homogeneity of variances for NoF/NoSI.
As we ensured the homogeneity assumptions, we use ANOVA directly and test the groups’ means of differentiation.
The hypotheses are as follows:
• H0: Groups (NoF/NoSI) the application availability SLA goal achievement percentage means are equal.
• H1: At least one of the groups (NoF/NoSI) the application availability SLA goal achievement percentage mean is different.
The significance value of 0.761 in Table 20 is less than the confidence level of 0.05, so we accept the null hypothesis and say that there is no statistical difference between groups in (NoF/NoSI) the application availability SLA goal achievement percentage. DevOps organization structure types do not provide a significant difference for (NoF/NoSI) the application availability SLA goal achievement.
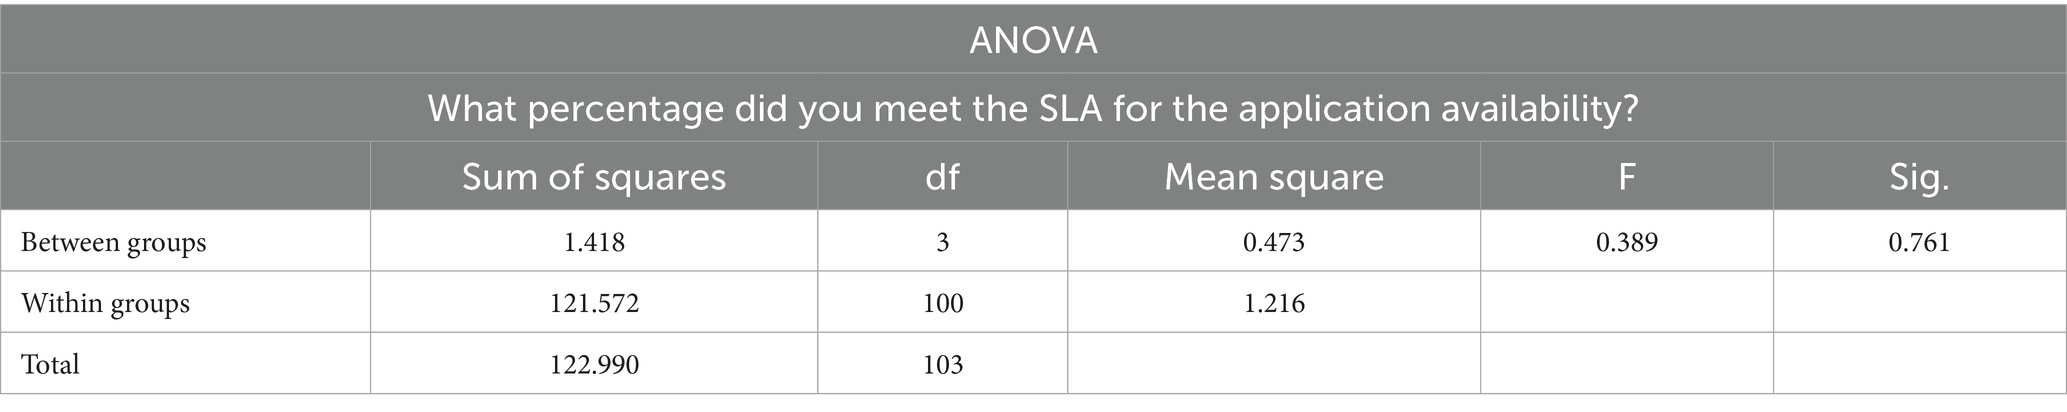
Table 20. Tests of homogeneity of variances for NoF/NoSI.
5 Limitations
Our study is limited to comparing four different types of DevOps formations based on five different performance metrics. We also tested whether DevOps adoption makes any differences by examining the same performance metrics values before and after DevOps adoption. Due to the scope of our survey questions, we did not go deep into the other rationales behind our topic such as why there are different types of DevOps team formations and why companies are selecting any of them. We believe that these questions call for new promising research topics.
6 Discussion
In this study, we examine DevOps team structures and determine their performance differences and propose the framework of Formation-Performance of DevOps teams. To measure the difference between Pre-DevOps and Post-DevOps and find the best performer among the four DevOps team formations, we identified the following five performance metrics: “Lead Time (LT), Deployment Frequency (DF), Mean Time to Recovery (MTTR), Number of Incidents (NoI) and Number of Failures/Service Interruptions (NoF/NoSI).” The four different DevOps team formations that we identified are follows: “Separate Development and Operation teams with limited collaboration (TeamType1),” “Separate Development and Operation teams with high collaboration (TeamType2),” “Separate Development and Operation teams that are supported by a DevOps/Platform/Infra team (TeamType3),” and “A single team that includes both Development and Operations (TeamType4).” We intentionally avoided naming DevOps team structure types because naming conventions can be variable and named differently by company. Instead, we define DevOps team structures based on the level of collaboration and organizational relationships.
A quantitative survey was conducted to evaluate performance changes of four distinct DevOps team types before and after DevOps adoption across five key metrics. Initial recruitment through snowball sampling (Biernacki and Waldorf, 1981) and open-call crowdsourcing (Kosinski et al., 2015) yielded limited responses. To improve participation, targeted advertising (Thornton et al., 2016) through LinkedIn outreach was employed. While identifying potential participants, we did not apply any specific filters such as experience level, industry sector, country, gender, or age; the only selection criterion was that the profile indicated expertise or involvement in DevOps. This approach resulted in 105 completed responses from 380 outreach attempts, achieving a 32.1% initial response rate and a 69.7% completion rate.
In Section 4, we reported whether the differences in performance metrics before and after DevOps adoption were statistically significant. In this section, we further assess the significance of those findings with the 95% Confidence Intervals (CI) by presenting the actual effect sizes based on the differences between pre- and post-DevOps mean values as shown in Table 21.
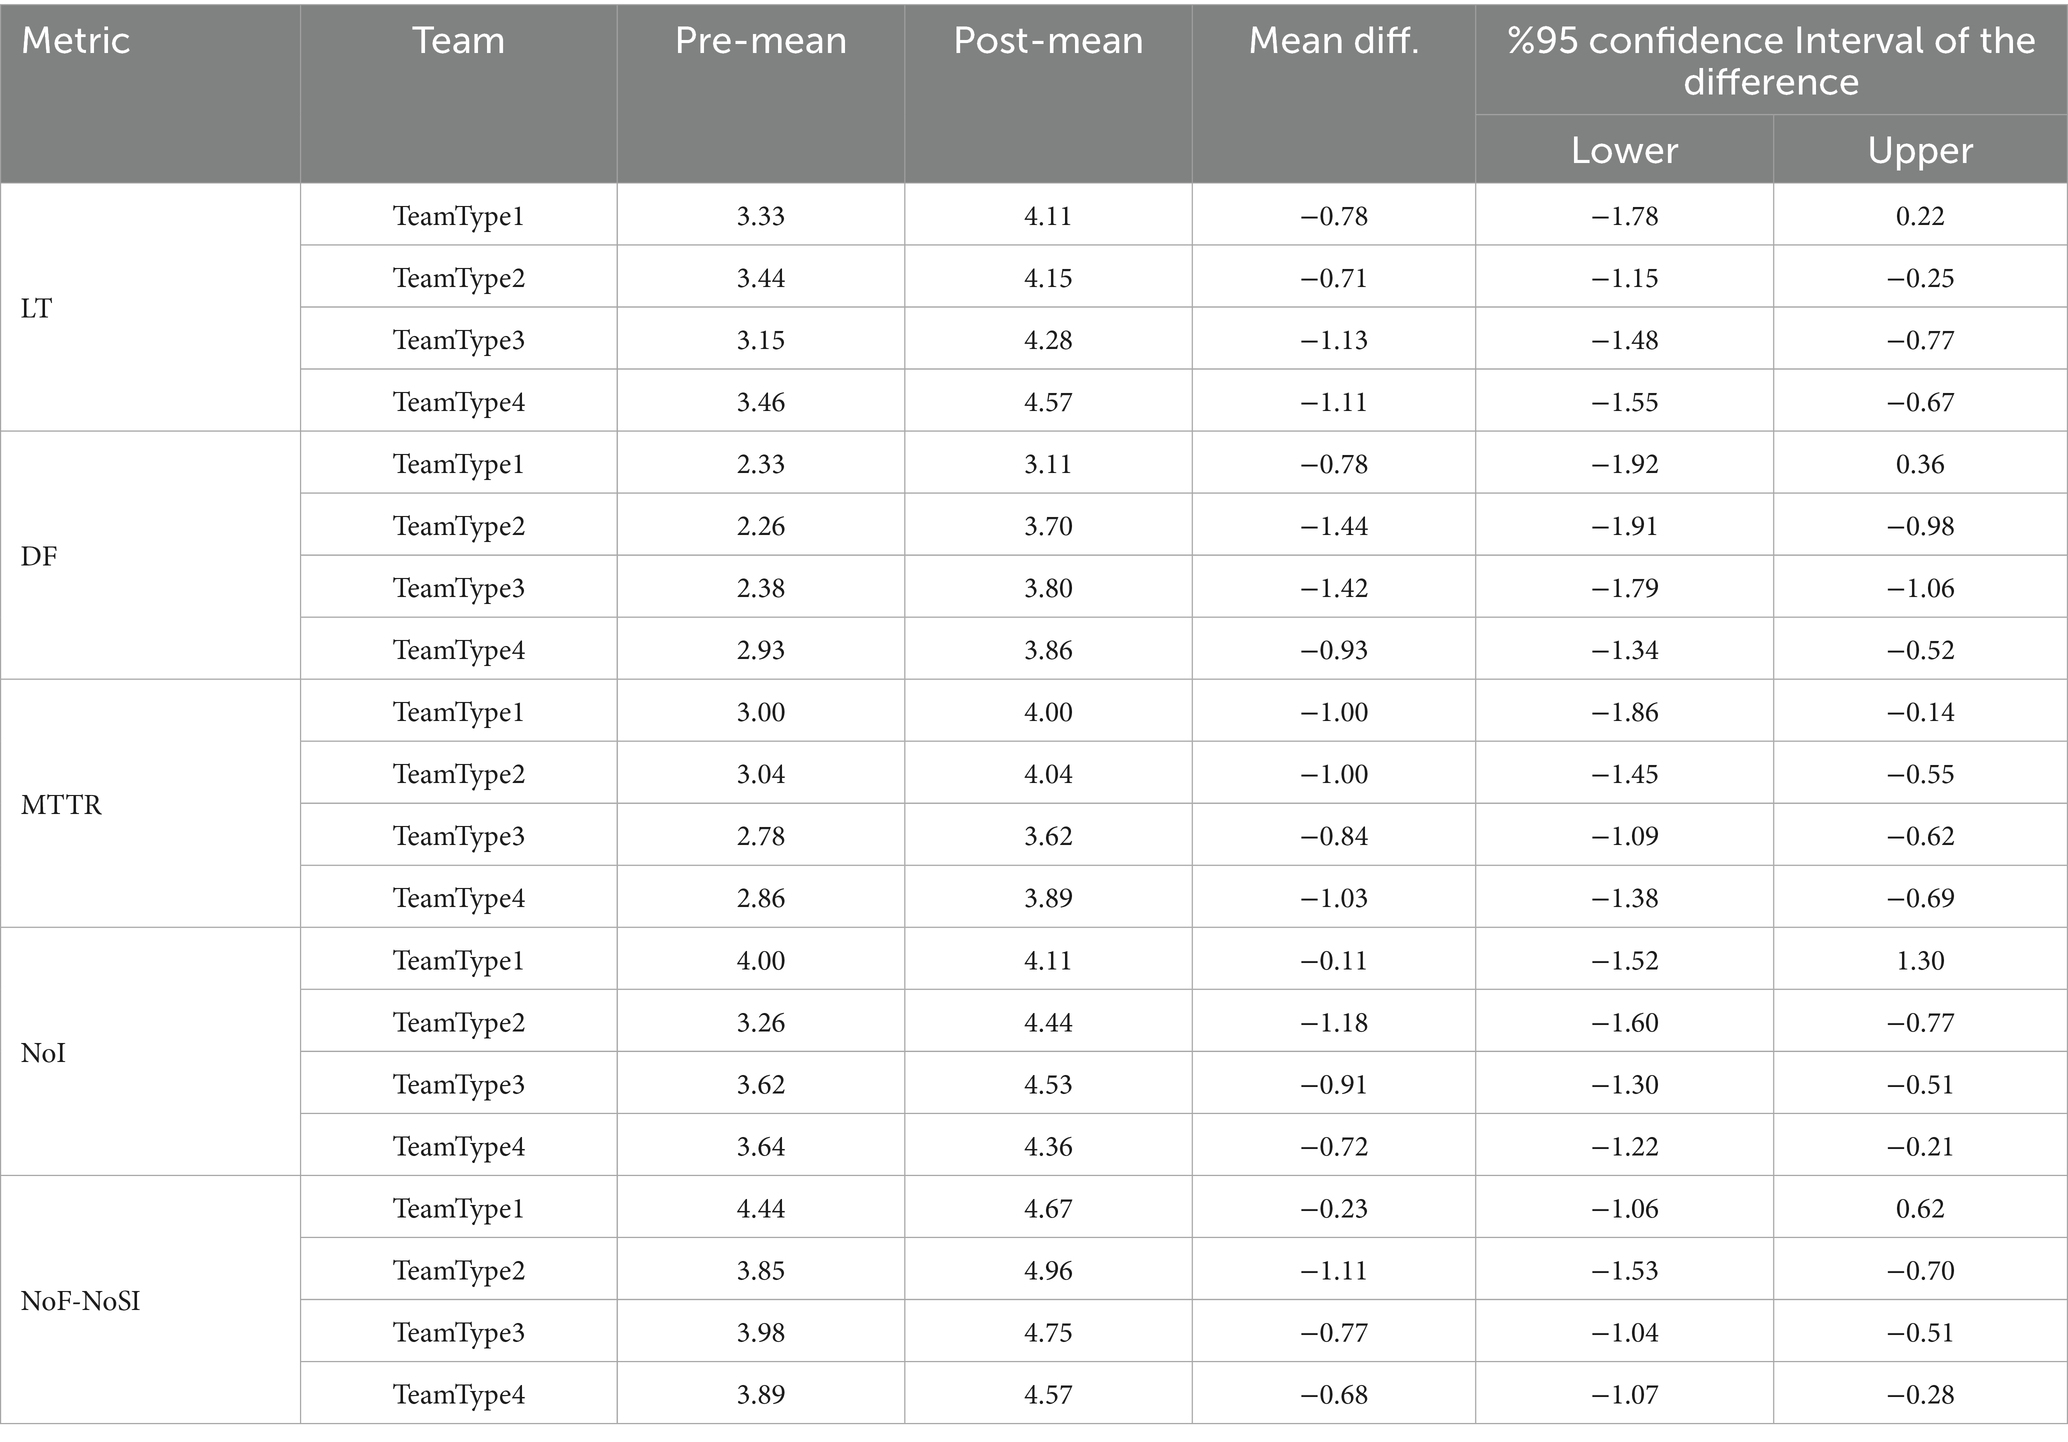
Table 21. Actual effect.
In the paired samples tests for each performance metric, the results include the lower and upper bounds of the 95% CI for the mean difference. If the CI does not include zero, it indicates statistical significance—providing evidence that the observed difference is unlikely to have occurred by chance. Furthermore, if the entire interval lies below zero, it suggests a statistically significant improvement in that performance metric. Upon examining these intervals in Table 21, we find strong evidence of real performance improvements for all DevOps team formations except TeamType1. For TeamType1, only the MTTR metric shows a confidence interval that excludes zero, suggesting a statistically significant positive effect; the remaining metrics include zero in their intervals, indicating no significant difference. These findings are consistent with the statistical results discussed in Section 4.
To better understand the magnitude of these effects, we also calculated Cohen’s d values (Cohen, 1988), which represent standardized effect sizes. These values are obtained by dividing the mean difference by the standard deviation and are summarized in Table 22. Cohen’s d provides an estimate of the significance of the observed differences, complementing the p-values reported earlier. Unlike p-values, which merely indicate whether an effect exists, Cohen’s d quantifies how substantial that effect is. Its scale-independent nature allows for meaningful comparisons across different metrics and studies, and it is widely used in meta-analyses to synthesize empirical results. The interpretation of Cohen’s d values follows commonly accepted benchmarks (presented in Table 23).
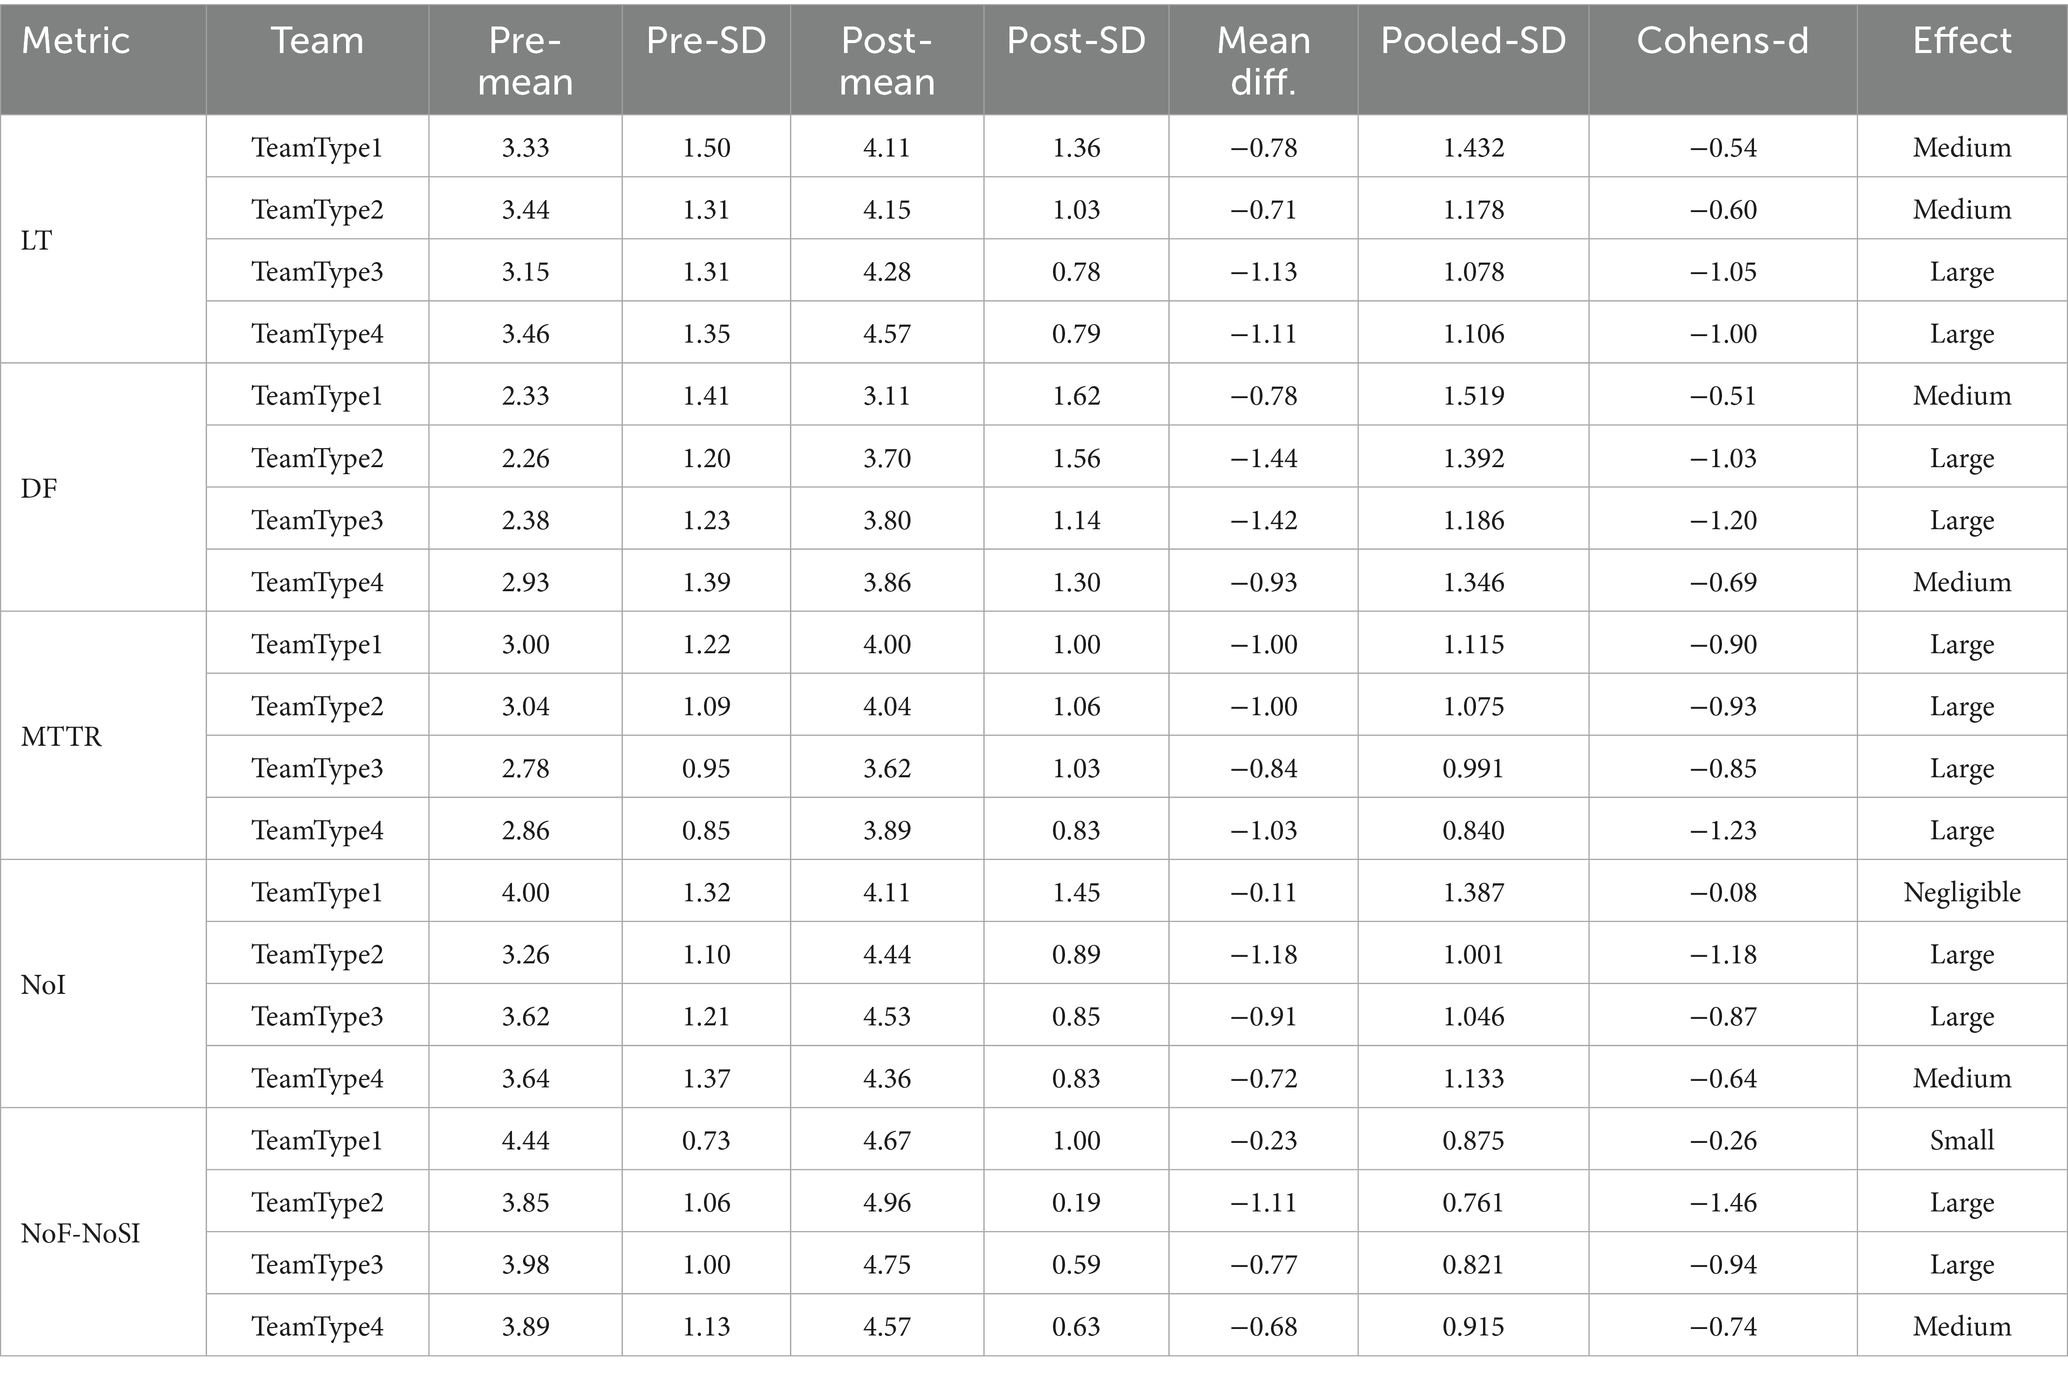
Table 22. Standardized effect size.
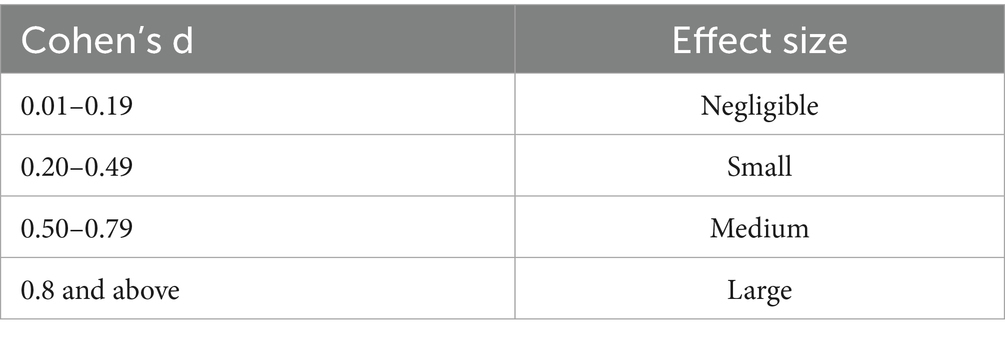
Table 23. Cohen’s effect size guidelines.
Based on the values in Table 22 and the classification above, the standardized effect sizes for each team type and performance metric are summarized as follows:
• Lead Time (LT): TeamType3 and TeamType4 exhibit “Large” effects, while TeamType1 and TeamType2 show “Medium” effects.
• Deployment Frequency (DF): TeamType2, TeamType3 show “Large” effects; TeamType1 and TeamType4 have “Medium” effect.
• Mean Time to Recovery (MTTR): All team types demonstrate “Large” effects.
• Number of Incidents (NoI): TeamType2 and TeamType3 shows a “Large” effect; TeamType4 exhibits “Medium” effects; TeamType1’s effect is “Negligible.”
• Number of Failures/Service Interruptions (NoF/NoSI): TeamType2 and TeamType3 show “Large” effects, TeamType4 a “Medium” effect, and TeamType1 a “Small” effect.
These results highlight that, while most team formations benefited significantly from DevOps adoption, the extent of improvement varies across metrics and team types, with TeamType1 generally showing weaker or negligible improvements. Figure 2 presents violin plots comparing pre- and post-DevOps values for five key performance metrics—Lead Time (LT), Deployment Frequency (DF), Mean Time to Recovery (MTTR), Number of Incidents (NoI), and Number of Failures/Service Interruption (NoF-NoSI)—across DevOps team types. Each plot illustrates the distribution and central tendencies before and after DevOps adoption.
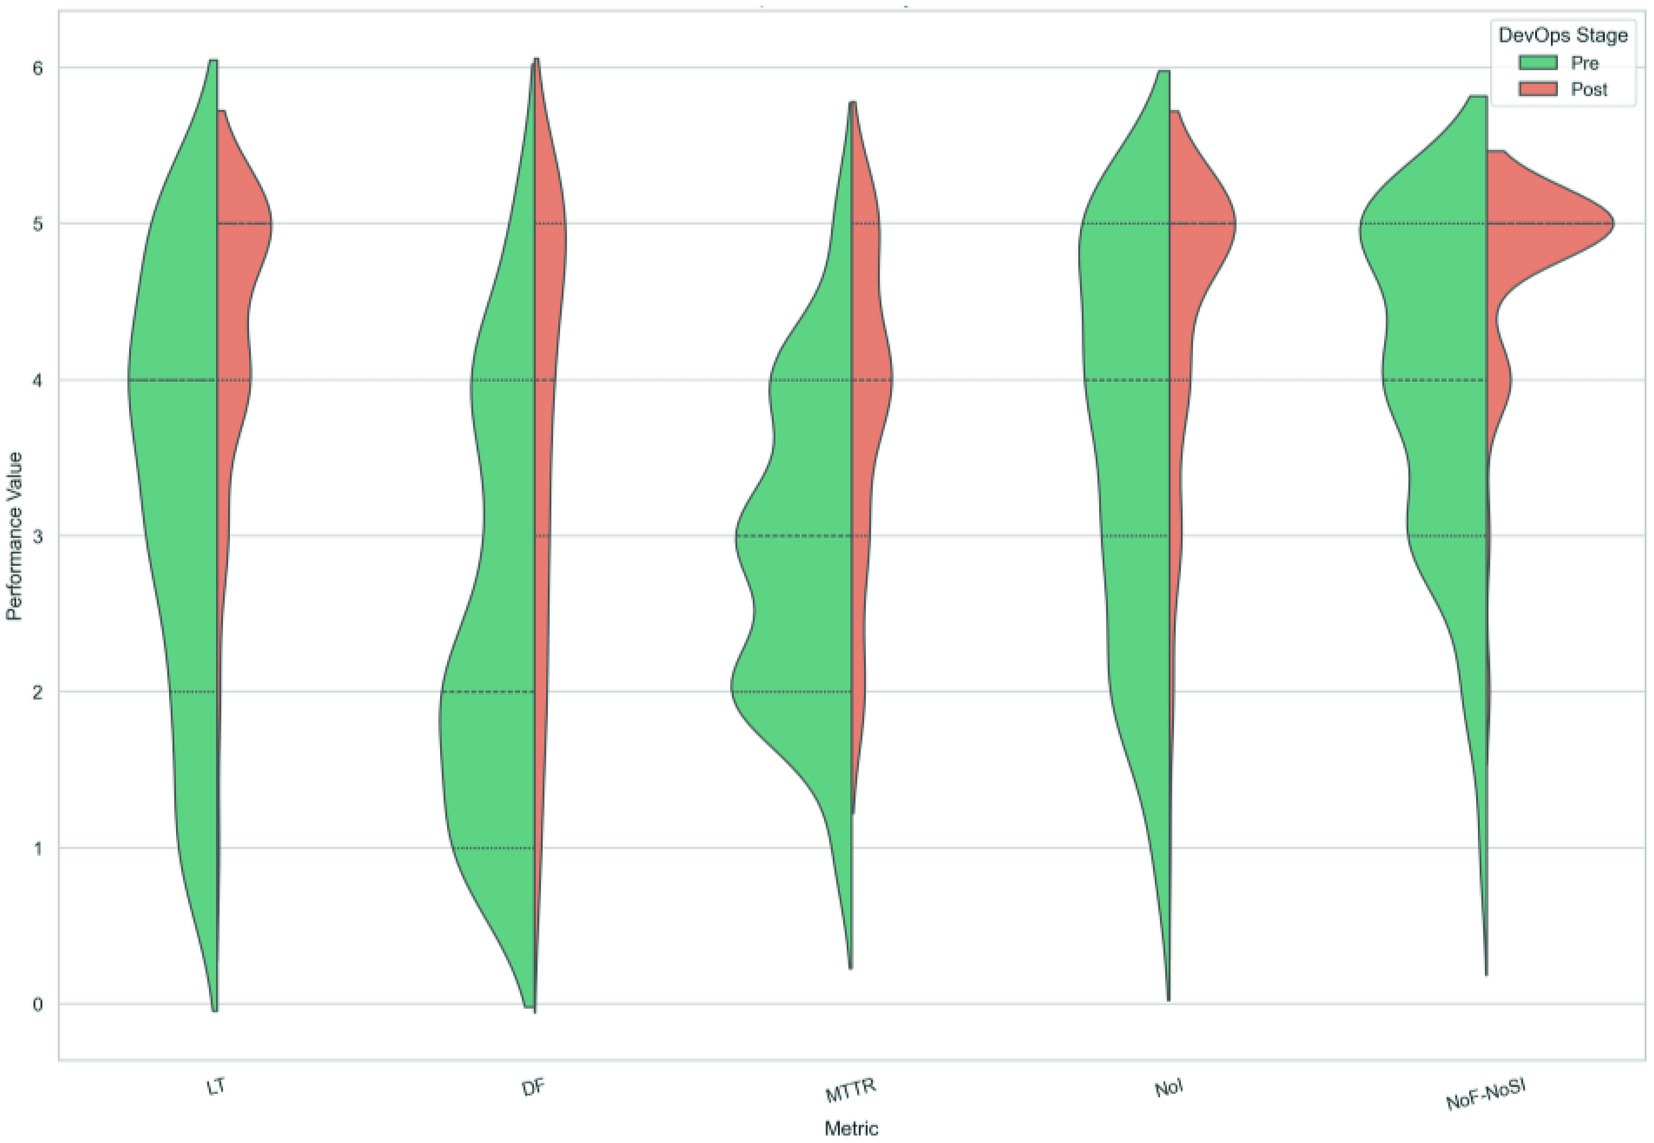
Figure 2. DevOps performance metrics: violin plots and effect size analysis based on Cohen’s d values.
Based on our test results, we found that there is a statistically significant difference between Before and After DevOps for all teams except TeamType1 for the LT, DF, NoI, and NoF/NoSI performance metrics, and they perform better after moving to DevOps. This suggests that adopting the DevOps approach increases the performance of the team and efficiency for all types of DevOps team formations except TeamType1. This conclusion also addresses our first research question (RQ1).
We also identify that while TeamType3 is slightly better than the others from the LT perspective, TeamType2 is slightly better than the others from the DF, NoI, and NoF/NoSI perspectives. For MTTR test, we found that there is a statistically significant difference between Before and After for all DevOps groups and perform better after moving to DevOps. TeamType4 is the best performer for this metric. The Pre-DevOps and Post-DevOps adoption performance results of the four teams are summarized in Table III. From our second research question perspective (RQ2), we found that TeamType2 performs better for 3 performance metrics out of 5 as shown in Table 24. Hence, we can conclude that TeamType2 is the best performer among the four DevOps Team formations in terms of DevOps adoption.
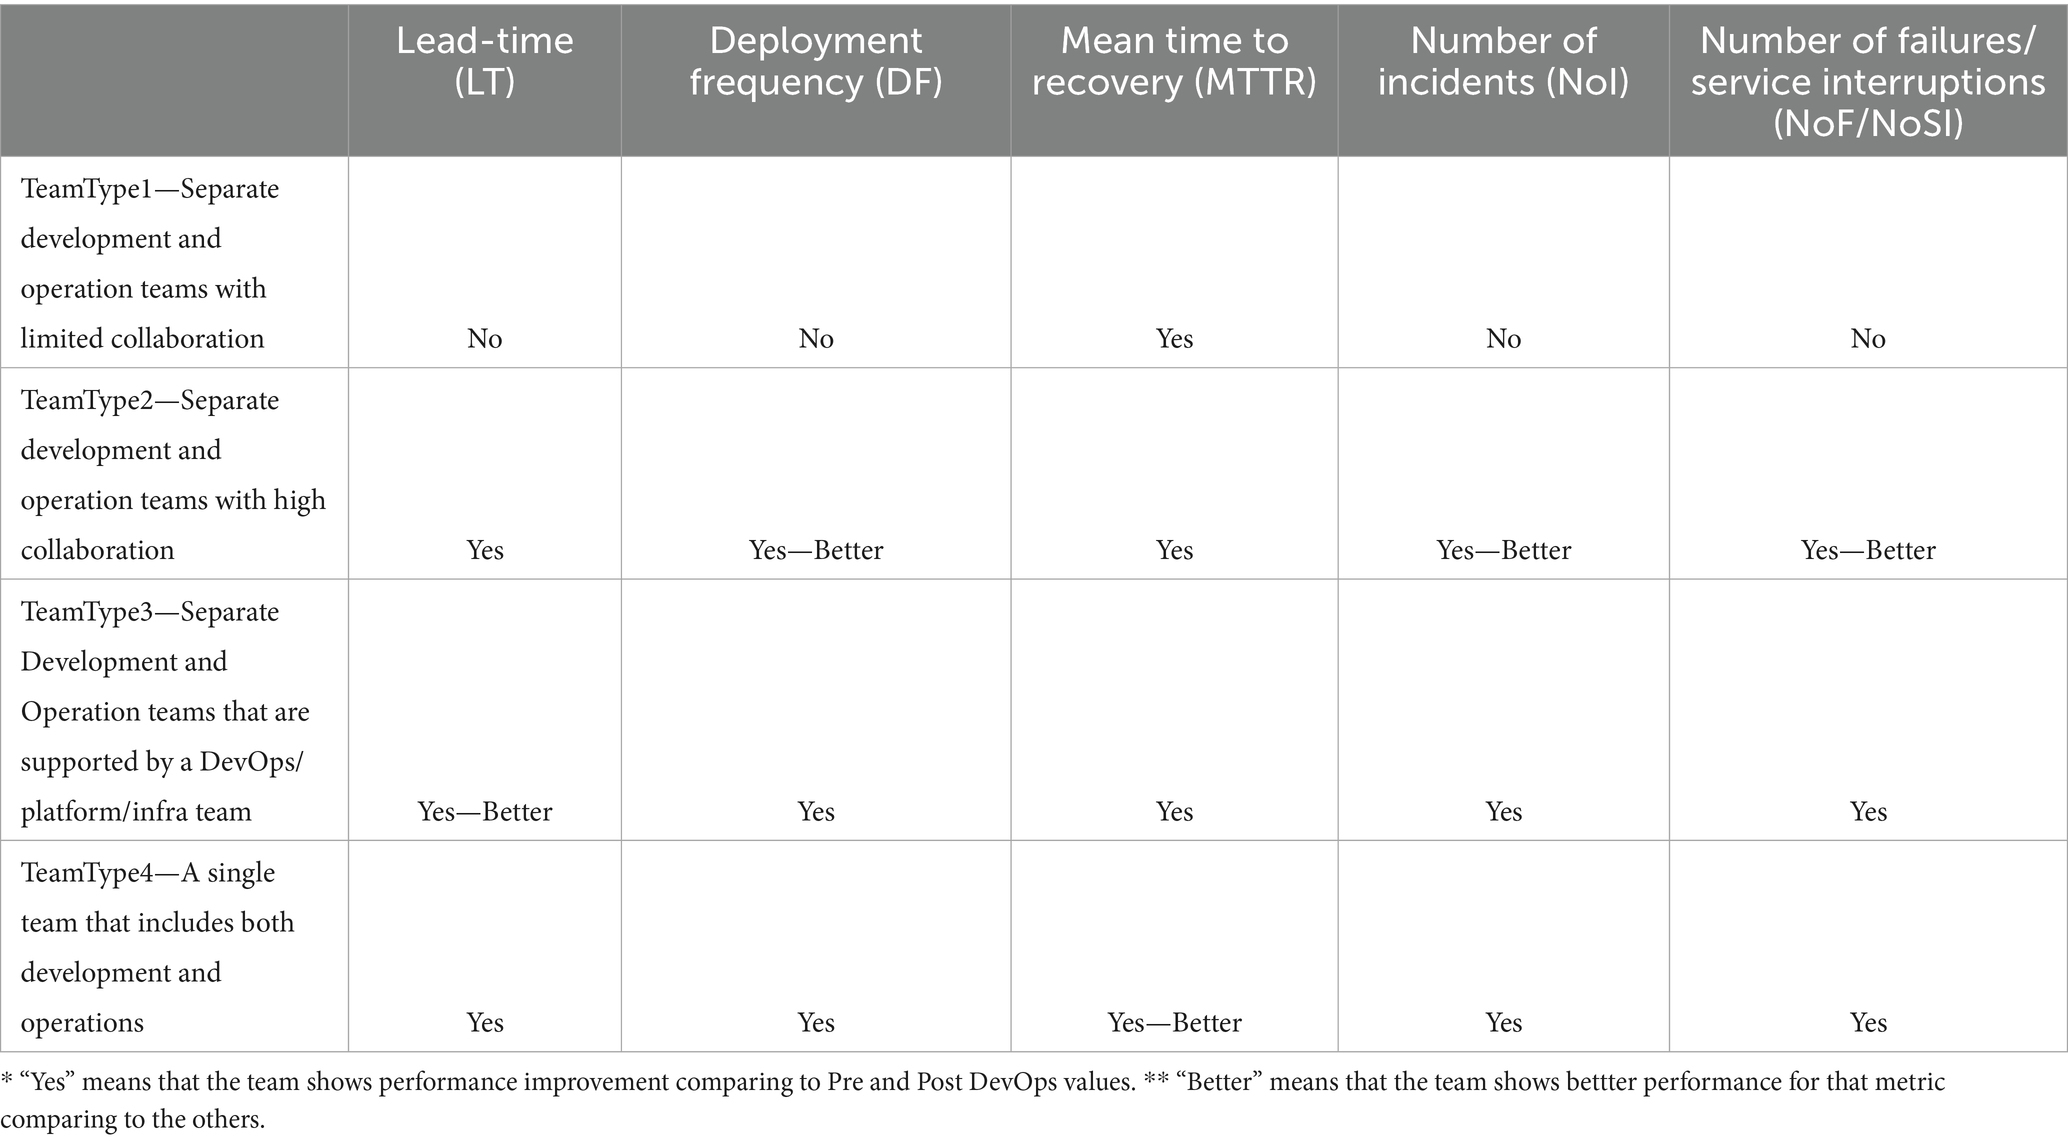
Table 24. DevOps adoption team performance comparison.
To address our last research question (RQ3), we found that DevOps organization structure types do not provide a significant difference for LT, NoF/NoSI, and MTTR from the goal achievement perspective. However, there is a statistical difference between TeamType2 and TeamType4 from the DF metric and TeamType2 is better than TeamType4. The performance comparisons of DevOps teams are summarized in Table 25.
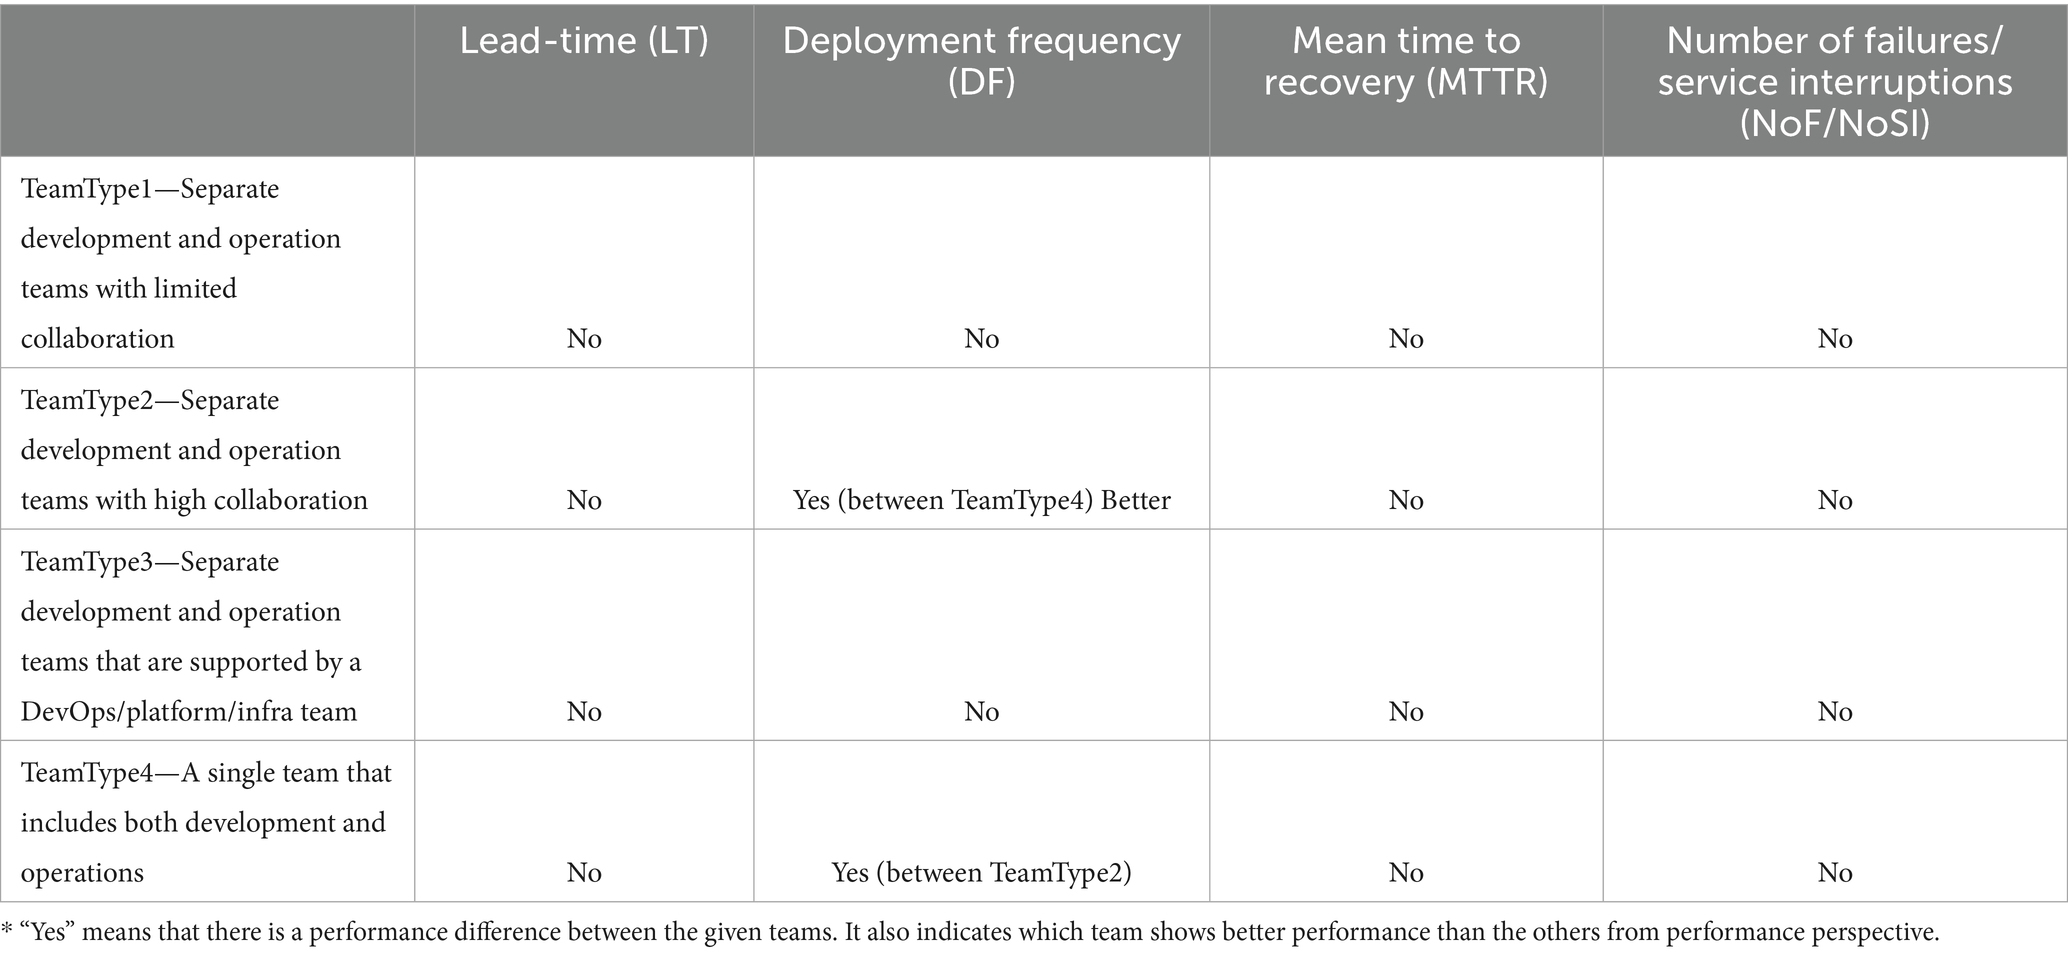
Table 25. DevOps team performance comparison.
7 Conclusion
In conclusion, we show that DevOps adoption makes a significant difference no matter which DevOps formation type is realized except TeamType1. Regarding TeamType1, DevOps adoption only makes a difference in the Mean Time To Repair/Recovery (MTTR) performance metric. While TeamType3’s Lead Time (LT) performance and TeamType4’s MTTR performance are better than the others, TeamType2’s Deployment Frequency (DF), Number of Incident (NoI) and Number of Failures/Service Interruptions (NoF/NoSI) performance metrics are better than the other teams. However, after DevOps adoption, there is no performance difference in LT, MTTR and NoF/NoSI performance metrics among these four DevOps team types. From the DF perspective, there is only a performance difference between TeamType2 and TeamType4, and TeamType2 is better than TeamType4.
In the present study, we focus only on the performance differences of the four types of DevOps team structures. One needs to articulate the reasons behind the different type of DevOps team formations and selection which can bring out new insights for future study for researchers and practitioners.
Data availability statement
The datasets presented in this study can be found in online repositories. The names of the repository/repositories and accession number(s) can be found in the article: https://docs.google.com/spreadsheets/d/16Cig8KReHwY6ZKWtICdNZDptIUY1we-n/edit?usp=drive_link&ouid=105145312824009983722&rtpof=true&sd=true.
Ethics statement
Written informed consent was not obtained from the individual(s) for the publication of any potentially identifiable images or data included in this article because the survey was completed anonymously, and we did not ask for any personal or company-related information from participants except for an email address that was not mandatory and asked only if they wanted to obtain the survey results.
Author contributions
HK: Conceptualization, Formal analysis, Investigation, Methodology, Writing – original draft, Writing – review & editing. MA: Supervision, Writing – review & editing.
Funding
The author(s) declare that no financial support was received for the research and/or publication of this article.
Conflict of interest
The authors declare that the research was conducted in the absence of any commercial or financial relationships that could be construed as a potential conflict of interest.
Generative AI statement
The authors declare that Gen AI was used in the creation of this manuscript. Used to improve readability.
Any alternative text (alt text) provided alongside figures in this article has been generated by Frontiers with the support of artificial intelligence and reasonable efforts have been made to ensure accuracy, including review by the authors wherever possible. If you identify any issues, please contact us.
Publisher’s note
All claims expressed in this article are solely those of the authors and do not necessarily represent those of their affiliated organizations, or those of the publisher, the editors and the reviewers. Any product that may be evaluated in this article, or claim that may be made by its manufacturer, is not guaranteed or endorsed by the publisher.
Footnotes
1. ^.https://drive.google.com/file/d/1R27WeYrOuUcawXG9NiEvOMf0DpTNsPq_/view?usp=drive_link
2. ^https://docs.google.com/spreadsheets/d/16Cig8KReHwY6ZKWtICdNZDptIUY1we-n/edit?usp=drive_link&ouid=105145312824009983722&rtpof=true&sd=true
References
Beyer, B., Jones, C., Petoff, J., and Murphy, N. R. (2016). Site reliability engineering: how Google runs production systems. Sebastopol, CA: O’Reilly Media.
Biernacki, P., and Waldorf, D. (1981). Snowball sampling—problems and techniques of chain referral sampling. Sociol. Methods Res. 10, 141–163. doi: 10.1177/004912418101000205
Brickman Bhutta, C. (2012). Not by the book: Facebook as a sampling frame. Sociol. Methods Res. 41, 57–88. doi: 10.1177/0049124112440795
Cohen, J. (1988). Statistical power analysis for the behavioral sciences. 2nd Edn. London: Routledge.
Debois, P. (2008) Agile infrastructure and operations: How infra-gile are you? In Agile 2008 conference, pp. 202–207.
Díaz, J., López-Fernández, D., Pérez, J., and González-Prieto, Á. (2021). Why are many businesses instilling a DevOps culture into their organization? Empir. Softw. Eng. 26:25. doi: 10.1007/s10664-020-09919-3
Díaz, J., Pérez, J., Alves, I., Kon, F., Leite, L., Meirelles, P., et al. (2024). Harmonizing devOps taxonomies — a grounded theory study. J. Syst. Softw. 208:111908. doi: 10.1016/j.jss.2023.111908
DORA DORA’s software delivery metrics: the four keys. Available online at: https://dora.dev/guides/dora-metrics-four-keys/ (Accessed September 01, 2022).
Faul, F., Erdfelder, E., Lang, A. G., and Buchner, A. (2007). G*power 3: a flexible statistical power analysis program for the social, behavioral, and biomedical sciences. Behav. Res. Methods 39, 175–191. doi: 10.3758/BF03193146
Glaser, B., and Strauss, A. (1999). The discovery of grounded theory: Strategies for qualitative research. New Jersey: Aldine Transaction.
Gomes, M., Pereira, R., Silva, M., Braga de Vsconcelos, J., and Rocha, Á. (2022). KPI’s for Evaluation of DevOps Teams. doi: 10.1007/978-3-031-04829-6_13
Heckathorn, D. D. (1997). Respondent-driven sampling: a new approach to the study of hidden populations. Soc. Probl. 44, 174–199. doi: 10.2307/3096941
Jayakody, V., and Wijayanayake, J. (2023). Critical success factors for DevOps adoption in information systems development. Int. J. Inf. Syst. Proj. Manag. 11:Article 5.
Kim, G., Humble, J., Debois, P., and Willis, J. The DevOps handbook: how to create world-class agility, reliability, and security in technology organizations. Portland, Oregon: IT Revolution (2016)
Kniberg, H. Spotify engineering culture (part 1), (2014) Available online at: https://labs.spotify.com/2014/03/27/spotify-engineering-culture-part-1 (Accessed September 01, 2023).
Kosinski, M., Matz, S. C., Gosling, S. D., Popov, V., and Stillwell, D. (2015). Facebook as a research tool for the social sciences: opportunities, challenges, ethical considerations, and practical guidelines. Am. Psychol. 70, 543–556. doi: 10.1037/a0039210
Leite, L., Kon, F., Pinto, G., and Meirelles, P. "Building a theory of software teams Organization in a Continuous Delivery Context," IEEE/ACM 42nd international conference on software engineering: Companion proceedings (ICSE-companion), Seoul, Korea (south), (2020), pp. 296–297.
Leite, L., Lago, N., Melo, C., Kon, C., and Meirelles, P. (2023). A theory of organizational structures for development and infrastructure professionals. IEEE Trans. Softw. Eng. 49, 1898–1911. doi: 10.1109/TSE.2022.3199169
Leite, L., Pinto, G., Kon, F., and Meirelles, P. (2021). The organization of software teams in the quest for continuous delivery: a grounded theory approach. Inf. Softw. Technol. 139:106672. doi: 10.1016/j.infsof.2021.106672
Leite, L., Rocha, C., Kon, F., Milojicic, D., and Meirelles, P. (2019). A survey of DevOps concepts and challenges. ACM Comput. Surv. 52:127. doi: 10.1145/3359981
López-Fernández, D., Díaz, J., García, J., Pérez, J., and González-Prieto, Á. (2022). “DevOps Team Structures: Characterization and Implications,” in IEEE Transactions on Software Engineering. 48, 3716–3736. doi: 10.1109/TSE.2021.3102982
Lwakatare, L. E., Kuvaja, P., and Oivo, M. (2016a). An exploratory study of DevOps: extending the dimensions of DevOps with practices. Rome, Italy: The Eleventh International Conference on Software Engineering Advances (ICSEA).
Lwakatare, L. E., Kuvaja, P., and Oivo, M. (2016b). “Relationship of DevOps to agile, lean and continuous deployment,” in Product-focused software process improvement. PROFES 2016. eds. P. Abrahamsson, A. Jedlitschka, A. Nguyen Duc, M. Felderer, S. Amasaki, and T. Mikkonen (Springer, Cham: Lecture Notes in Computer Science), 10027. doi: 10.1007/978-3-319-49094-6_27
Muñoz, M., Mejia, J., and Laporte, C. Y. (2019). “Reinforcing Very Small Entities Using Agile Methodologies with the ISO/IEC 29110” in Trends and applications in software engineering, CIMPS 2018. Advances in intelligent systems and computing. eds. J. Mejia, M. Muñoz, Á. Rocha, A. Peña, and M. Pérez-Cisneros (Cham: Springer).
Muñoz, M., Negrete, M., and Arcilla-Cobián, M. (2021). Using a platform based on the basic profile of ISO/IEC 29110 to reinforce DevOps environments. JUCS 27, 91–110. doi: 10.3897/jucs.65080
Plant, O., Hillegersberg, J., and Aldea, A. (2022). Design and validation of a capability measurement instrument for DevOps teams. Agile Processes in Software Engineering and Extreme Programming, 23rd International Conference on Agile Software Development.
Rossi, S. (2012). “Model checking adaptive multilevel service compositions” in Formal aspects of component software. FACS 2010. eds. L. S. Barbosa and M. Lumpe (Berlin, Heidelberg: Springer).
Senapathi, M., Buchan, J., and Osman, H. (2018). “DevOps capabilities, practices, and challenges: Insights from a case study,” in Proceedings of the 22nd international conference on Evaluation and Assessment in Software Engineering 2018 (EASE ‘18). New York, NY, USA: Association for Computing Machinery, 57–67. doi: 10.1145/3210459.3210465
Shahin, M., Zahedi, M., Ali Babar, M., and Zhu, L. (2017). “Adopting continuous delivery and deployment: impacts on team structures, collaboration and responsibilities” in Proceedings of 21st international conference on evaluation and assessment in software engineering, Karlskrona Sweden, (June 15 16, 2017 EASE 17).
Thornton, L., Batterham, P. J., Fassnacht, D. B., Kay-Lambkin, F., Calear, A. L., and Hunt, S. (2016). Recruiting for health, medical or psychosocial research using Facebook: systematic review. Internet Interv. 4, 72–81. doi: 10.1016/j.invent.2016.02.001
Williams, F., Nancy, J., Andrewson, S., and Richard, H. (2025). Measuring DevOps success: Key metrics and KPIs. Available at: https://www.researchgate.net/publication/391240883_Measuring_DevOps_Success_Key_Metrics_and_KPIs
Keywords: DevOps, team structure, performance comparison, DevOps taxonomy, DevOps formations
Citation: Korkmaz HE and Aydin MN (2025) An empirical study on performance comparisons of different types of DevOps team formations. Front. Comput. Sci. 7:1554299. doi: 10.3389/fcomp.2025.1554299
Edited by:
Martin Shepperd, Brunel University London, United KingdomReviewed by:
Sabina Rossi, Ca' Foscari University of Venice, ItalyLindung Parningotan Manik, National Research and Innovation Agency (BRIN), Indonesia
Copyright © 2025 Korkmaz and Aydin. This is an open-access article distributed under the terms of the Creative Commons Attribution License (CC BY). The use, distribution or reproduction in other forums is permitted, provided the original author(s) and the copyright owner(s) are credited and that the original publication in this journal is cited, in accordance with accepted academic practice. No use, distribution or reproduction is permitted which does not comply with these terms.
*Correspondence: Halil Ergun Korkmaz, aGFsaWxlcmd1bi5rb3JrbWF6QGdtYWlsLmNvbQ==