 Kurunandan Jain*
 Krishnashree Achuthan
- Center for Cyber Security Systems and Networks, Amrita Vishwa Vidyapeetham, Amritapuri-Campus, Kollam, Kerala, India
The proliferation of misinformation on social media threatens public trust, public health, and democratic processes. We propose three models that analyze fake news propagation and evaluate intervention strategies. Grounded in epidemiological dynamics, the models include: (1) a baseline Awareness Spread Model (ASM), (2) an Extended Model with fact-checking (EM), and (3) a Generative AI-Influenced Spread model (GIFS). Each incorporates user behavior, platform-specific dynamics, and cognitive biases such as confirmation bias and emotional contagion. We simulate six distinct scenarios: (1) Accurate Content Environment, (2) Peer Network Dynamics, (3) Emotional Engagement, (4) Belief Alignment, (5) Source Trust, and (6) Platform Intervention. All models converge to a single, stable equilibrium. Sensitivity analysis across key parameters confirms model robustness and generalizability. In the ASM, forwarding rates were lowest in scenarios 1, 4, and 6 (1.47%, 3.41%, 2.95%) and significantly higher in 2, 3, and 5 (19.67%, 56.52%, 29.47%). The EM showed that fact-checking reduced spread to as low as 0.73%, with scenario-based variation from 1.16 to 17.47%. The GIFS model revealed that generative AI amplified spread by 5.7%–37.8%, depending on context. ASM highlights the importance of awareness; EM demonstrates the effectiveness of fact-checking mechanisms; GIFS underscores the amplifying impact of generative AI tools. Early intervention, coupled with targeted platform moderation (scenarios 1, 4, 6), consistently yields the lowest misinformation spread, while emotionally resonant content (scenario 3) consistently drives the highest propagation.
1 Introduction
The rapid growth of social media has fundamentally reshaped how information is shared, allowing billions of users to exchange content instantaneously. However, this ease of sharing has also made it easier for misinformation, disinformation, and fake news to spread rapidly, causing significant societal challenges (Clayton et al., 2020). The unchecked spread of misinformation can undermine trust in public institutions, manipulate electoral outcomes, and create public hysteria, underscoring the pressing need for effective models to understand and control the dissemination of false information (Lazer et al., 2018).
Research suggests that false news is about 70% more likely to be shared than true news and spreads faster across social platforms (Vosoughi et al., 2018). Such misinformation can degrade trust in public institutions, influence election results, and incite widespread panic, emphasizing the urgent need for effective methods to comprehend and limit its spread (Pennycook et al., 2020). Misinformation has affected not only political scenarios but also public health. During the COVID-19 pandemic, misinformation regarding vaccines and the virus itself led to widespread confusion and hesitancy across various communities (Islam et al., 2020). The World Health Organization (WHO) called this phenomenon an “infodemic,” where excessive, often conflicting information made it difficult for people to identify accurate guidance. This clearly demonstrates the importance of proactive steps to mitigate the spread of fake information on social media (Walter et al., 2019).
Adding to this challenge, the rise of generative AI (Gen AI) technologies has introduced a new dimension to the misinformation landscape. Generative AI models, such as large language models and neural networks, are increasingly capable of producing highly realistic text, images, and videos that can be indistinguishable from authentic content. Recent research suggests that AI-generated content is becoming ubiquitous, with predictions indicating a substantial increase in its use across domains, including misinformation dissemination (Alkaissi and McFarlane, 2023; Raman et al., 2024). This trend raises concerns not only about the spread of misinformation but also about the feedback loop that could occur if generative AI systems train on datasets polluted by misinformation. This cyclical issue has been highlighted in studies exploring the risks of embedding inaccuracies into AI models through biased data (Cotton et al., 2023). Such challenges underscore the pressing need for models to account for these novel dynamics in the spread of misinformation.
Differential equations have proven to be powerful tools for studying the dynamics of information spread, drawing parallels with epidemiological models used to describe the transmission of infectious diseases (Bettencourt et al., 2006). In this context, each state variable represents a subset of the user population at different stages of interaction with misinformation—such as susceptibility, exposure, and active forwarding. This approach allows for a granular understanding of how misinformation propagates and identifies points where intervention might alter the trajectory of its spread.
In order to comprehend how fake news propagates on social media platforms, our study looks at six different scenarios (Figure 1 highlights these scenarios):
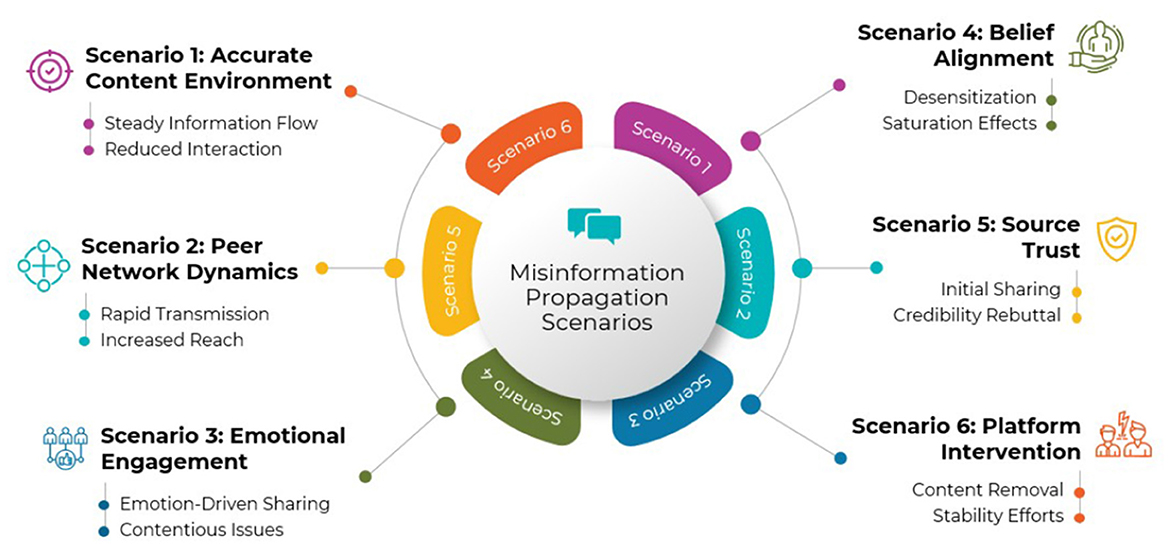
Figure 1. This figure summarizes the six distinct scenarios explored in the models, representing real-world conditions of misinformation spread. Each scenario varies key factors such as infection rate, emotional content, user susceptibility, platform intervention, and confirmation bias. Examples include low-virality factual content (scenario 1), emotionally charged viral misinformation (scenario 3), and platform-moderated environments (scenario 6). These scenarios provide a comparative framework for analyzing user dynamics and intervention effects.
1) Scenario 1: News aligns with accurate content and provides minimal opportunity for disinformation. A steady information environment emerges as users are less likely to interact with or share credible content.
2) Scenario 2: Close-knit networks encourage the sharing of misinformation. In this scenario, inaccurate or deceptive information is quickly transmitted due to the dynamics of peer networks, amplifying its reach (Friggeri et al., 2014).
3) Scenario 3: News aligns with audience needs and context, evoking strong emotions like fear, joy, or outrage. False information that stirs up such feelings or touches on contentious issues tends to propagate more quickly, as users are more likely to engage and share it (Brady et al., 2017).
4) Scenario 4: Users amplify only the news that aligns with their beliefs, but repeated exposure to the same content can lead to desensitization. Over time, this saturation reduces the likelihood of further sharing, thereby slowing the spread of misinformation (Pennycook et al., 2018).
5) Scenario 5: Trust in the source of the message plays a significant role in the spread of misinformation. Users may widely share misleading content that appears genuine before its credibility is refuted (Stewart, 2021).
6) Scenario 6: Social media companies use early intervention techniques like removing or flagging inaccurate content. By taking these steps, misinformation can be considerably less likely to propagate, and a more stable information environment can be fostered (Wang et al., 2021).
Each scenario is characterized by corresponding probabilities that influence user behavior and engagement with the content. For example, emotionally charged or highly credible but false information tends to spread more aggressively, while early moderation efforts can reduce transmission rates and lead to stability (Pennycook and Rand, 2019).
With this in mind, this paper presents three models to understand the spread of misinformation. The first model, ASM, examines news circulation on a single platform by categorizing users into five groups, capturing diverse behavioral responses to false information (Shao et al., 2017).
The second model, EM, builds on this by adding fact-checkers, reflecting social media initiatives to verify information through community-driven or third-party methods (Pennycook and Rand, 2019). Fact-checking has been shown to effectively mitigate misinformation spread (Zollo et al., 2017). Additionally, the EM incorporates confirmation bias and considers interactions across two social media platforms.
In the third model, referred to as GIFS, the ASM framework is extended by introducing a new variable M(t) that captures the activity level of a generative AI system generating misinformation. This AI activity evolves dynamically based on user behavior—specifically, the number of users currently forwarding misinformation (F and Ac)—thereby forming a feedback loop where user engagement influences the AI's adaptation rate. The AI, in turn, affects the rates of transition from susceptible (S) to exposed (E) users, and from exposed to forwarding (F) users, modulated through parameters α1 and α2(t).
This work holds practical implications for platform developers and policymakers. Understanding how different scenarios affect the spread of misinformation can guide the implementation of more responsive moderation tools, the timing of fact-checking alerts, and user education efforts (Lewandowsky et al., 2017; Tambuscio et al., 2015). By focusing on scenario-based modeling, this study bridges the gap between general models of information dissemination and real-world complexity, providing a versatile framework that can be adapted as new data and user behavior patterns emerge.
In addressing the challenges of misinformation, researchers have identified key obstacles, including the rapid evolution of false narratives, the difficulty in measuring the impact of interventions, and the need for interdisciplinary approaches to develop effective solutions. One promising strategy is the concept of “inoculation,” where individuals are preemptively exposed to weakened forms of misinformation, enabling them to build cognitive resistance against false information (Linden et al., 2017). This proactive approach has shown potential in enhancing public resilience to misinformation, complementing reactive measures like fact-checking (Lewandowsky et al., 2012).
By incorporating these insights into our modeling approach, we aim to provide a comprehensive framework that not only analyzes the spread of misinformation but also evaluates the effectiveness of various intervention strategies. This holistic perspective is essential for developing robust solutions to the multifaceted problem of misinformation in the digital age.
The structure of this paper is as follows: Section 2 summarizes the related works, Section 3 presents the model formulation, Section 4 focuses on the results and discussion, Section 5 conducts a sensitivity analysis, Section 6 discusses the implications of the results, Section 7 outlines the limitations and future work, and finally, Section 8 concludes the paper.
2 Related works
Given the intrinsic characteristics of misinformation dissemination, many studies have drawn parallels between the propagation of misinformation and infectious diseases, leading to the adoption of epidemiological models for analysis. These models provide symbolic representations of the key parameters influencing the evolution of phenomena, such as diseases or, in this case, misinformation.
Epidemiological models can be broadly classified into two categories: deterministic (or compartmental) models and stochastic models. Deterministic models, originally developed to study specific diseases like measles and tuberculosis, divide populations into compartments representing distinct epidemic stages. Transitions between these compartments are governed by deterministic rules and expressed as derivatives, typically formulated using differential equations. In the context of misinformation, deterministic models allow researchers to track the spread of misinformation through predefined stages such as susceptibility, exposure, and propagation, providing a structured framework for analysis (Breda et al., 2012).
Stochastic models, on the other hand, account for random variations and uncertainties in the diffusion process. These models estimate probabilities of state transitions, dynamically managing the variability of input data to offer a more nuanced representation of real-world phenomena (Britton, 2010). The opportunity to estimate probability distributions of outcomes makes stochastic models especially useful for capturing the unpredictable nature of user behavior in misinformation spread, such as sudden surges in sharing due to emotionally charged or controversial content.
Building on these foundational principles, recent studies have adapted classical epidemiological models to misinformation. For instance, Deters et al. (2019) employed the Susceptible-Infected-Recovered (SIR) framework to analyze how rumors circulate within communities, focusing on the interactions among susceptible individuals, those infected by misinformation, and those who recover by recognizing misinformation as false.
Mathematical frameworks based on epidemiological principles have been widely used to model the dissemination of ideas and information. One approach adapts the classic SIR model to represent individuals as susceptible (unaware of the idea), infected (aware and sharing the idea), or recovered (no longer spreading the idea), incorporating parameters such as transmission and recovery rates to quantify how ideas propagate through populations (Bettencourt et al., 2006). The effectiveness of such models in capturing real-world information dynamics has been demonstrated, revealing key factors that influence the reach and longevity of ideas in social networks.
Building on this foundation, extensions to traditional epidemiological models have introduced additional complexity to better represent the nuances of information spread. One such refinement incorporates a “hesitated” state, representing individuals who are uncertain about the veracity of a rumor and delay its dissemination (Zhu and Ma, 2019). Analysis of this model highlights how network heterogeneity and dynamic social connections shape rumor propagation, offering insights into conditions under which misinformation either fades out or becomes widespread.
Further modifications address the role of intermediate decision-making states in online information diffusion. A proposed model introduces a contacted state, capturing individuals who have encountered the information but have not yet decided whether to spread it (Xiong et al., 2012). This refinement accounts for the delays in user engagement typical of digital communication environments and provides a more realistic representation of how content spreads across microblogging platforms.
Building on these foundations, recent works have further expanded epidemiological approaches by introducing verification, adaptive social intelligence, and machine learning-driven interventions. For example, Maleki et al. (2021) proposed an epidemiological framework to analyze misinformation spread during the Black Lives Matter movement, demonstrating how protest-driven narratives dynamically altered transmission rates.
In another study, (Raponi et al. 2022) provided a comprehensive review of epidemic models applied to fake news propagation, identifying gaps in empirical validation and calling for integrated models that combine network structure, user psychology, and intervention strategies.
Govindankutty and Gopalan (2024) introduced a socially intelligent epidemic model, incorporating adaptive behavioral feedback loops where user awareness dynamically reduced infection probabilities. Their findings suggest that decentralized social intelligence mechanisms can suppress misinformation without centralized moderation.
Similarly, (Ojha et al. 2023) proposed an SEIVR (Susceptible, Exposed, Infected, Verified, Recovered) model to analyze and control the spread of fake information on online social networks. This model emphasizes the importance of verification mechanisms by introducing a verified state, where users authenticate content before sharing it. The study derives the basic reproduction number R0 to measure the potential spread of fake information and employs Lyapunov functions to assess global stability. By focusing on control strategies such as user verification and malicious user removal, this work complements other epidemiological approaches by prioritizing systemic stability and proactive interventions to mitigate the propagation of misinformation.
Extending beyond classical epidemic models, (Jiang et al. 2025) proposed an epidemiology-informed neural network for rumor detection. By embedding epidemic-inspired structural and temporal features into a deep learning framework, their model achieved robust misinformation detection, outperforming traditional classifiers, particularly under adversarial conditions.
Another approach seeks to mitigate misinformation impact by incorporating mechanisms that influence the persistence of rumors. By introducing a direct transition from uninformed individuals to those who suppress the spread of misinformation, one model effectively reduces the overall influence of a rumor (Zhao et al., 2012). Additionally, the inclusion of a hibernator group—individuals who temporarily forget and later recall the rumor—demonstrates how memory effects can prolong or suppress misinformation dynamics. A summary of these related works is presented in Table 1.
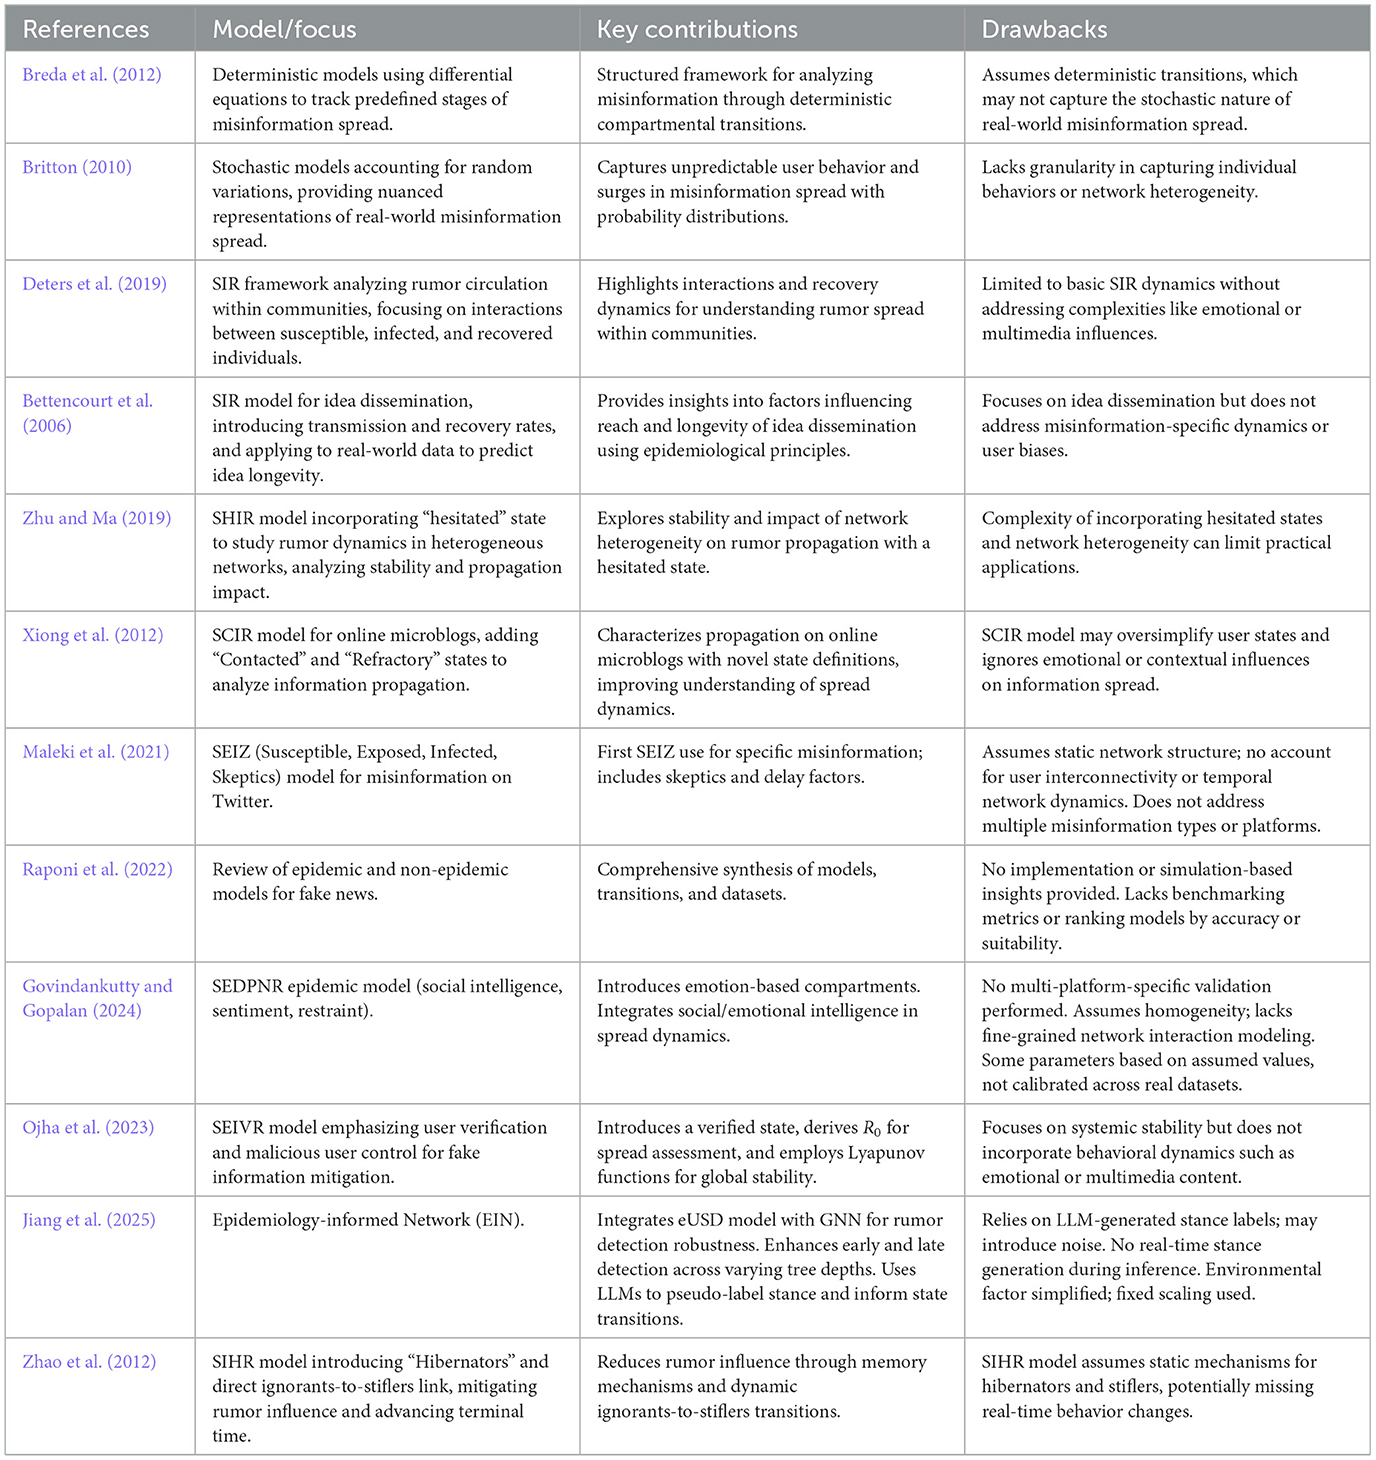
Table 1. Summary of related works on misinformation models with drawbacks.
Despite the significant body of work modeling the spread of misinformation using differential equations, none of the existing models fully capture the nuanced mechanisms introduced in our approach. While prior models, such as the Susceptible-Infected-Recovered (SIR) framework and its variants, provide useful abstractions, they typically rely on basic compartments that overlook platform-specific dynamics, user psychology, and adaptive interactions with external forces. Existing awareness-based epidemic models incorporate user heterogeneity or behavioral factors in limited ways but do not explicitly model the decision divergence between users who stop forwarding vs. those who persist despite warnings, nor do they simulate feedback effects from external misinformation sources adapting in real-time.
Our modeling framework addresses key limitations in existing misinformation models by incrementally introducing behavioral, structural, and algorithmic dynamics. The ASM model extends standard epidemiological formulations by distinguishing between two types of user awareness: those who stop forwarding after realizing misinformation has circulated widely (As), and those who continue forwarding despite this awareness (Ac). This separation enables the model to capture both stabilizing and destabilizing effects of awareness—an aspect missing in prior models that treat awareness as a single state. In addition, ASM incorporates a reinfection mechanism, allowing previously aware users to re-enter the susceptible pool, reflecting real-world behaviors such as forgetting prior warnings or re-engaging with misinformation after a period of disengagement.
Building on ASM, the EM model introduces platform-specific transmission dynamics, psychological factors such as confirmation bias, and an explicit fact-checking mechanism. Users in EM can transition to a verified state following fact-check interventions. By accounting for both structural heterogeneity across platforms and behavioral amplification mechanisms, EM enables a more detailed simulation of how misinformation spreads and how countermeasures perform under varied conditions. These features are typically absent in prior models that assume homogeneous network structures and do not explicitly model user verification.
The GIFS model introduces an external, adaptive misinformation generator that responds dynamically to user forwarding behavior. Represented by a new variable M(t), the generative AI system increases or decreases its misinformation output based on the current number of forwarding users (F and Ac), forming a feedback loop between platform engagement and AI activity. This co-evolutionary mechanism captures the emergent risk posed by generative AI systems that learn from user data—an adversarial dynamic not addressed in classical or behaviorally extended misinformation models.
Together, ASM, EM, and GIFS form a unified modeling framework that incorporates user behavior, platform-specific effects, and generative AI feedback. To our knowledge, no prior model simultaneously integrates awareness bifurcation, platform heterogeneity, fact-checking interventions, and an adaptive AI-driven misinformation process within an epidemiological framework. This structure allows for multiscale analysis and provides a more realistic and flexible tool for evaluating interventions at the user, platform, and algorithmic levels.
3 Model formulation
In this section, we focus on developing a new propagation model for fake news dissemination that incorporates the impact of user awareness and platform-specific behaviors. We describe three models, with the total user population set as N in each model.
The ASM focuses on the spread of misinformation within a single social media platform, assuming users can be divided into five distinct categories: (1) susceptible users, who are potential targets for receiving misinformation, (2) exposed users, who have encountered the misinformation but haven't shared it yet, (3) forwarding users, who actively spread the misinformation without having seen the “forwarded many times” label, (4) aware users who stop forwarding after seeing this warning, and (5) aware users who continue to forward despite the warning. This classification allows us to capture how different user responses affect the spread dynamics within a controlled environment where only basic user awareness mechanisms are in place.
The EM extends this framework by adding a sixth category of users: fact-checking users who assess the credibility of the news before sharing and refrain from forwarding if it is identified as fake. This additional category enables the model to account for more complex behaviors influenced by platform-specific features, psychological factors, and individual verification efforts, offering a richer view of how misinformation dissemination may vary across different social contexts and user tendencies. The inclusion of fact-checking users simulates the impact of targeted interventions and adds realism by incorporating behaviors seen on platforms with built-in misinformation checks. Furthermore, additional factors are added to the EM that affects network dynamics: confirmation bias and parameters for the second social media. These factors make the EM more realistic in terms of the spread of the misinformation.
The GIFS model extends the ASM framework by incorporating the influence of generative AI systems on the spread of misinformation. A new dynamic variable, M(t), is introduced to represent the activity of the AI, which evolves based on user behavior—specifically, the number of users actively forwarding misinformation (F and Ac). Unlike static models where misinformation originates from a fixed source, the GIFS model introduces an adaptive feedback mechanism, where the AI system increases or decreases its misinformation-generating activity in response to user engagement. This reflects real-world generative systems that are continuously fine-tuned based on user data and platform interactions. The AI activity, in turn, affects two critical transitions in the system: from susceptible users (S) to exposed users (E), and from exposed users to forwarding users (F), modulated by time-dependent influence coefficients. By incorporating this co-evolving relationship, the GIFS model allows us to study the impact of adversarial, AI-generated misinformation that adapts to user behavior over time—capturing a crucial threat vector absent in traditional and fact-checking-based models.
The study investigates how the number of users in each category changes over time across various scenarios. Systems of differential equations were formulated for the models, allowing us to explore the dynamics under six scenarios. These scenarios represent different contexts in which misinformation might spread, providing insight into how emotional resonance, platform interventions, and message credibility impact user behavior. To facilitate this analysis, we make several simplifying assumptions across the models. The total population size (N) is assumed to be constant and closed, with no user entry or exit. User interactions are modeled using deterministic or time-dependent parameters, and stochastic fluctuations in behavior are not explicitly considered. We also assume homogeneous mixing, meaning all users within a platform are equally likely to interact. Platform-specific features are incorporated only in the EM and GIFS models. Furthermore, the generative AI system in the GIFS model is assumed to respond solely to user forwarding behavior, without modeling external controls such as algorithmic moderation. These simplifications are intended to balance realism with analytical clarity, allowing for meaningful comparisons across the three models.
To assess the dynamics, for each model and scenario we explored whether the dynamics converge to a steady state where the number of users in each group remains constant or shows more complex behavior over time (e.g. oscillations in the number of users in the groups). Fixed points of the systems were calculated analytically, and a linear stability analysis was performed to determine if small perturbations around these points would result in the system returning to equilibrium or diverging. In addition, numerical simulations were conducted for the models across all six scenarios to visualize the temporal dynamics and validate the analytical results. These simulations provide a clear view of how misinformation might persist, or diminish offering a comprehensive understanding of the factors influencing its spread on social media. Furthermore, the numerical simulations serve as a tool for understanding how the number of users in each category evolves over time.
3.1 ASM model
The ASM assumes, that at a given time t the set of users (N) in a social platform consists of the following subsets:
• Susceptible users S(t): potential targets of the misinformation, who can be exposed to misinformation and potentially forward them;
• Exposed users E(t): users who are exposed to misinformation at time t;
• Forwarding users F(t): users, who are forwarding misinformation, but have not received the message “forwarded many times” yet;
• As(t): users who stopped forwarding either (1) because they received the message “forwarded many times” or (2) “naturally” (see the parameter δ below);
• Ac(t): users who received the message “forwarded many times” and continued to forward the misinformation.
At any given point t, the total number of users is equal to N:
The dynamics of the variables mentioned above is governed by the following set of equations:
where
• β is infection rate: the rate at which users see and forward the misinformation;
• ϵ is reintroduction rate: users who might see the misinformation again and get exposed after initially stopping;
• σ is the rate at which exposed users become forwarders;
• p is the stop forwarding probability: the proportion of users who stop forwarding when they receive the alert (reflecting both a behavioral decision and platform-enforced forwarding restrictions);
• γ is forwarded message alert rate: the rate at which users receive the forwarded message notification.
• δ is recovery rate: the rate at which users stop forwarding the misinformation naturally.
The parameters used for the ASM model across the six scenarios are presented in Table 2, with their empirical justification and supporting literature summarized in Table 3. Additionally, the model's transition dynamics are illustrated in Figure 2.
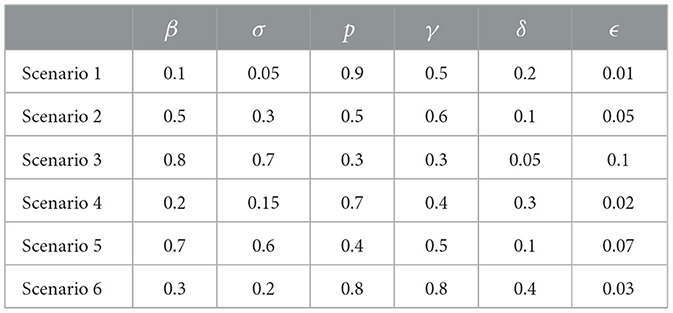
Table 2. Parameter values for ASM.
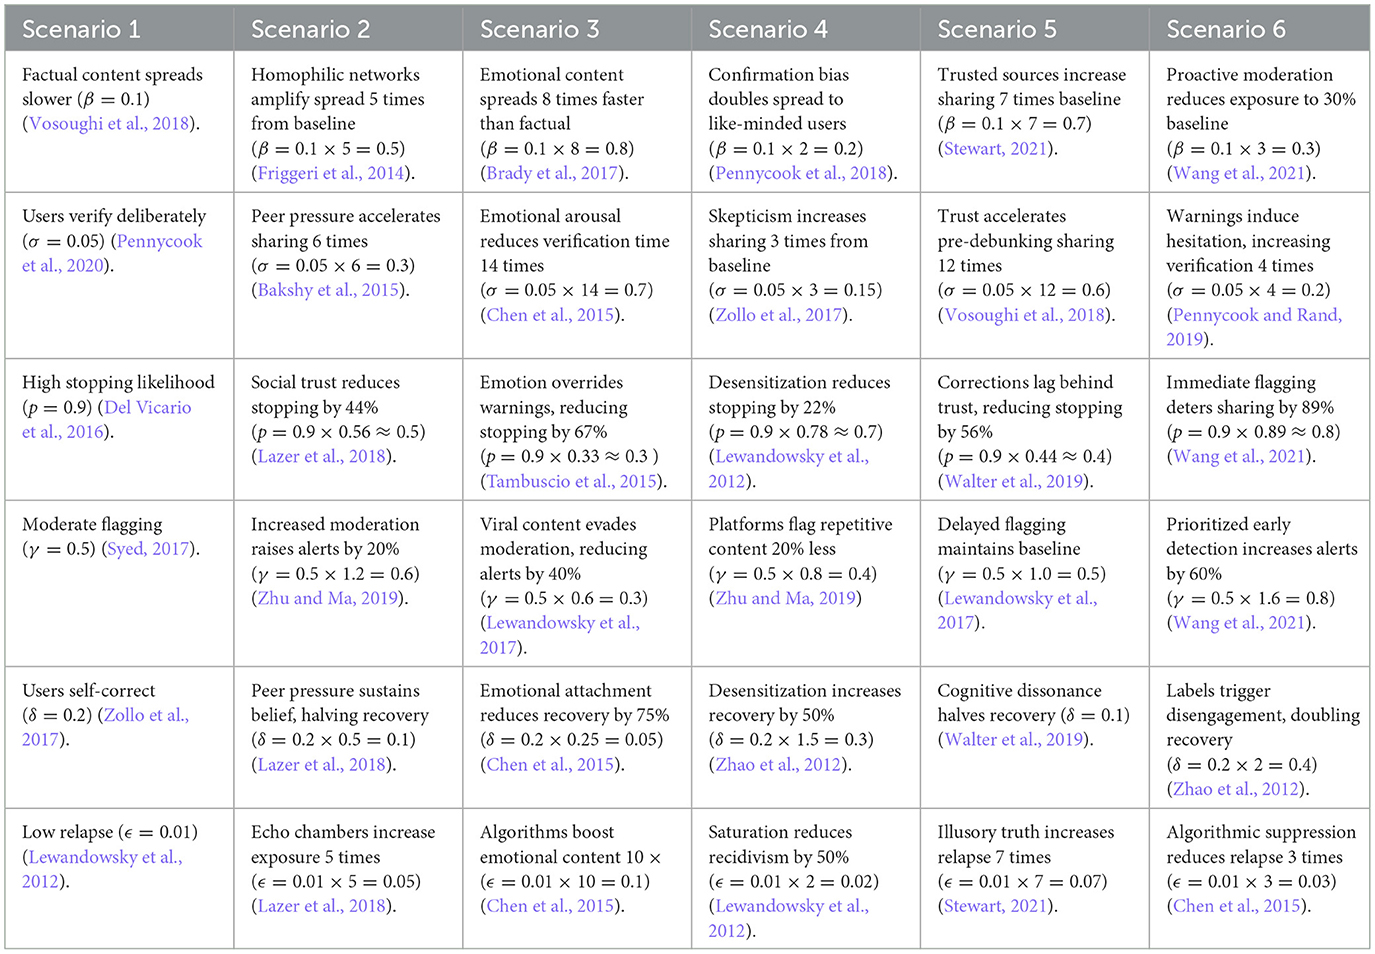
Table 3. Justification and supporting literature for parameter values in ASM model scenarios.
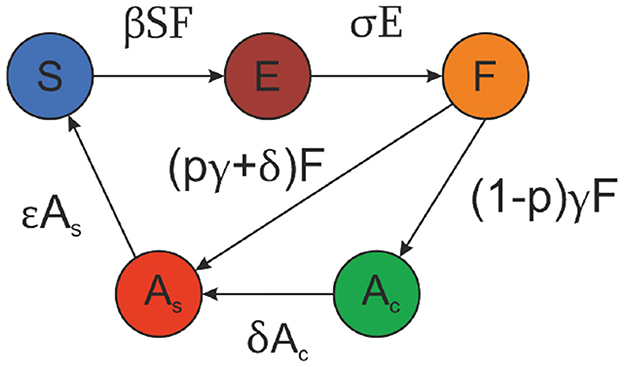
Figure 2. Transition diagram for the ASM model (Equations 2–6), showing transitions between five user states: susceptible (S), exposed (E), forwarding (F), aware-stopped (As), and aware-continuing (Ac). Arrows represent transition rates governed by parameters such as infection rate (β), exposure rate (σ), stop-forwarding probability (p), alert rate (γ), recovery rate (δ), and reintroduction rate (ϵ).
To parameterize the ASM model, we selected values for β, σ, p, γ, δ, and ϵ based on empirical findings from prior studies on misinformation diffusion and user behavior in social media environments. Scenario 1 serves as the baseline case, representing a setting where factual content spreads slowly, users are cautious in verifying information, and platform interventions are moderate. Specifically, we set the infection rate β = 0.1 in accordance with Vosoughi et al. (2018), who showed that true information spreads significantly more slowly than falsehoods. The exposure-to-forwarding rate σ = 0.05 captures hesitancy in sharing unverified content, consistent with the implied truth effect described by Pennycook et al. (2020). A high stop-forwarding probability p = 0.9 was selected based on findings from (Del Vicario et al. 2016), indicating that exposure to fact-checks and corrective cues significantly reduces propagation. The alert rate γ = 0.5 represents a moderate level of platform-generated warnings, in line with policy analyses by Syed (2017). The natural recovery rate δ = 0.2 reflects gradual user self-correction over time, as discussed by Alkaissi and McFarlane (2023). Lastly, the reintroduction rate ϵ = 0.01 models a low likelihood of relapse into misinformation, supported by findings on recirculation dynamics in moderated settings Pennycook and Rand, (2019).
For Scenarios 2 through 6, parameter values were derived by scaling the baseline values from Scenario 1 using empirically grounded multipliers obtained from the literature. These variations capture key contextual factors, including amplification through homophilic networks Friggeri et al., (2014), emotional salience (Brady et al., 2017), confirmation bias (Pennycook et al., 2018), trust in sources (Stewart, 2021), and content moderation interventions (Wang et al., 2021).
3.2 Extended model: impact of fact checking
The primary distinction between the ASM and EM lies in the additional complexities introduced in the EM to more accurately reflect real-world social media dynamics. The ASM provides a basic framework for misinformation propagation but does not account for several critical factors. It assumes a single social platform environment, ignoring variations in user behavior across different platforms that may influence the spread. Additionally, the ASM does not consider how users' beliefs and emotional responses affect the infection rate; it treats all users as equally likely to forward misinformation, regardless of their personal inclinations or the emotional appeal of the content. Finally, the ASM lacks a mechanism for users who actively fact-check information before sharing, which is a common behavior on platforms with robust misinformation controls. In contrast, the EM incorporates these elements, making it more robust and reflective of the varied factors that can influence misinformation dissemination in a diverse online environment.
For these reasons, first, a new variable is introduced: C(t) - fact-checked users who no longer spread misinformation:
where the new variables:
• β1 and β2: infection rate in different platforms (it is assumed, that only the infection rate differs between the platforms);
• βp - infection rate due to confirmation bias: users are more likely to forward misinformation if it aligns with their existing beliefs or emotions;
• θ - fact-checking rate: the rate at which users are fact-checked and stop forwarding;
• ϵC - the reintroduction of fact-checked users: describes how fact-checked users might become susceptible again.
The values for the parameters for the six scenarios in the Extended Model (EM) are presented in Table 4, with their empirical justification and supporting literature summarized in Table 5. The transition dynamics for the EM model are illustrated in Figure 3.
Table 4. Parameter values for EM.
Table 5. Empirical justification and supporting literature for parameter values in EM model scenarios.
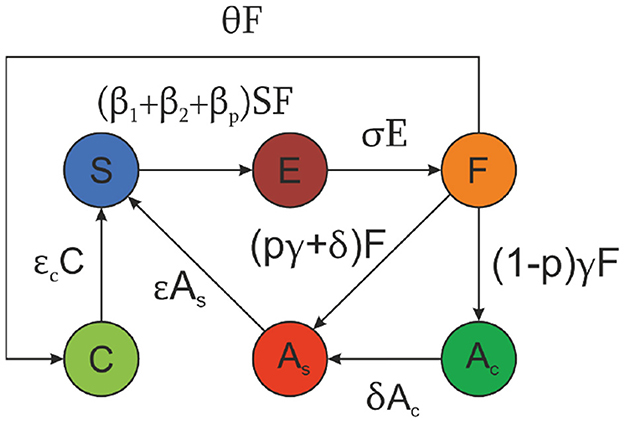
Figure 3. Transition diagram for EM model (Equations 7–12), showing transitions between six user states: susceptible (S), exposed (E), forwarding (F), aware-stopped (As), aware-continuing (Ac), and fact-checked users (C). Arrows represent transition rates including platform-specific infection rates (β1, β2), confirmation bias infection rate (βp), fact-checking rate (θ), and reintroduction of fact-checked users (ϵC), alongside other parameters as in the ASM model.
To parameterize the EM model, we selected values for β1, β2, βp, ϵc, and θ based on empirical findings from prior research on misinformation diffusion, user behavior across multiple platforms, and platform-specific interventions. Scenario 1 serves as the baseline case, representing an environment where factual content spreads slowly across both platforms, users exhibit cautious verification behavior, and platform interventions are moderate. The infection rates were set at β1 = 0.05 and β2 = 0.02, reflecting differences in platform characteristics: β1 captures a platform with more open network structures (e.g., Twitter-like platforms with broader sharing), while β2 reflects a more moderated or closed platform (e.g., WhatsApp-like networks with peer-group sharing), resulting in a lower spread rate for misinformation on the latter. This platform-specific heterogeneity in diffusion aligns with observations by Vosoughi et al. (2018) and Syed (2017).
We set the confirmation bias amplification parameter at βp = 0.01 to reflect minimal reinforcement of belief-congruent information in a factual content-dominated setting, consistent with findings by Pennycook et al. (2018). The reintroduction rate for fact-checked users was set at ϵc = 0.005, modeling a very low probability of misinformation resurfacing among corrected users, supported by Pennycook and Rand (2019). The fact-checking rate θ = 0.1 represents a baseline level of fact-checking engagement, reflecting underutilized fact-checking mechanisms typical of low-moderation environments (Walter et al., 2019).
The parameters for the remaining scenarios were derived by scaling the baseline values of Scenario 1 using empirically informed multipliers from prior studies. Each adjustment reflects differences in network structures, algorithmic amplification, emotional content, user trust, and intervention strategies across platforms. Specifically, higher values of β1 and β2 in Scenarios 2–6 represent increased diffusion due to homophilic clustering, algorithmic recommendation, or emotionally salient content, with empirical evidence showing that spread rates vary significantly across platforms depending on moderation policies and network openness (Friggeri et al., 2014; Bakshy et al., 2015; Brady et al., 2017). The separation between β1 and β2 values in each scenario captures this heterogeneity: for instance, platforms with stricter content controls exhibit lower β2, while platforms with algorithmic amplification or weaker moderation exhibit higher β1. Similarly, increases in βp, ϵc, and θ reflect environments with stronger belief reinforcement, higher re-exposure risks, and more active fact-checking interventions, as documented in empirical studies (Pennycook et al., 2018; Chen et al., 2015; Pennycook and Rand, 2019; Walter et al., 2019).
3.2.1 GIFS model
To investigate the influence of Gen AI on the spread of the misinformation, the ASM (Equations 2–6) was extended and a new variable M introduced to model the user-depended activity of the AI. The Gen AI is assumed not to have any information about the total number of users, but the number of users who shared the misinformation (F and Ac). The temporal evolution of M is given by:
where τ corresponds to the time constant affecting the rate of change in the activity of Gen AI, and ρ is the decay parameter. The Gen AI is thought to affect the transition from susceptible (S) to exposed (E), and from exposed to forwarding (F) users. Thus, the Equations 2–4 are rewritten as:
where α1 is the infection rate mediated by the Gen AI between susceptible and forwarding users. α2(t) is the time-dependent coefficient modeling the adaptation of the Gen AI and is governed by the following function:
where a corresponds to the maximal influence by the Gen AI and k influences how fast the Gen AI learns. The expressions of rate of change for F, As and Ac are the same as given by Equations 4–6.
The choice of an exponential saturation function for α2(t) reflects a realistic modeling of how generative AI systems adapt over time based on user behavior. Initially, when little user engagement data is available, the AI's influence is negligible, consistent with α2(0) = 0. As time progresses and the AI observes more instances of misinformation being forwarded (i.e., higher values of F and Ac), its influence increases, but at a decreasing rate. This captures the natural learning curve of generative systems, which typically exhibit rapid adaptation early on, followed by saturation as they converge on optimal behavior. The parameter k controls how quickly this adaptation occurs—larger values of k represent faster learning, while smaller values yield more gradual influence growth. The use of this function thus introduces a dynamic, nonlinear feedback mechanism that mirrors the evolving impact of AI-generated misinformation in response to user activity on the platform.
The transition diagram of the GIFS model is similar to the one of EM (Figure 3) with an additional term for transition from S to E (α1MS), and from E to F (α2ME).
To investigate the effect of Gen AI, unless otherwise noted, the following parameters were set to be the same for all 6 scenarios: τ = 10, ρ = 1, α1 = 0. The feedback delay τ = 10 reflects the non-instantaneous retraining cycles of generative AI systems in real-world deployment (Zellers et al., 2019). The decay rate ρ = 1 assumes a balanced forgetting rate in AI models adapting to new data streams (Chesney and Citron, 2019). We set α1 = 0 to model the assumption that Gen AI does not directly increase exposure among previously unexposed users, consistent with visibility constraints and platform-level moderation (Marchal et al., 2019). Finally, a and k capture the modest but measurable influence of AI-generated misinformation on increasing forwarding behavior (Li and Yang, 2024), and were treated as sweep parameters and were varied within a predefined range during numerical simulations. For the stability analysis a = 0.01 and k = 1 were used for each of the 6 scenarios. All other parameters were set to the same values as for ASM model (see Table 2).
4 Results and discussion
To confirm the stability of the fictitious news-spread, we conducted numerical simulation experiments and local stability analyses of the three models for all 6 scenarios. The results are presented in this section.
4.1 Stability analysis
Stability analysis is a mathematical technique used to determine whether a system will return to an equilibrium state after small disturbances or whether it will diverge, leading to potentially uncontrolled behavior (Bellman, 2008). In the context of misinformation propagation, stability analysis allows us to assess if the spread of misinformation will naturally die out over time or if it will persist and amplify. By examining the equilibrium points of the differential equations that represent our models, stability analysis helps identify conditions under which the number of users in each state (susceptible, exposed, forwarding, aware, and fact-checking) remains constant or fluctuates within predictable limits. This insight is critical for understanding whether the misinformation will eventually fade or if it requires intervention to prevent widespread dissemination.
The main mathematics of the stability analysis for the presented models can be found in the Appendix 8. We are able to show that the models have only one fixed point under the constraint given by the Equation 1, and the fixed point is stable for the 6 scenarios of interest.
4.1.1 ASM
Suppose (S*, E*, F*, , ) is a fixed point of the Equations 2–6. By definition, at the fixed point, the derivatives in Equations 2–6. One can rearrange terms in the resulting equations to (1) derive a single equation for F* in terms of total user population N, the infection rate β, the reintroduction rate ϵ the transition rate from exposed to forwarding users, σ the alert rate for forwarded messages, γ and the recovery rate δ; (2) express all other coordinates of the fixed point in terms of F*:
We are now ready to calculate the fixed points of the system. Determining the fixed points allows us to identify the equilibrium states, where the number of users in each category (e.g., susceptible, exposed, forwarding, aware) remains constant over time. These equilibrium points represent scenarios where misinformation either ceases to spread, stabilizes at a persistent level, or continues to propagate indefinitely.
Table 6 shows the analytically calculated fixed points for the 6 scenarios. The fixed point depends only on the chosen parameters, provided. Notably, from Equations 18–21, E* and exhibit similar dependencies on F*: both are directly proportional to F* with a proportionality coefficient of δ+γ, representing the recovery rate and the “forwarded many times” alert rate, respectively. Conversely, E* and are inversely proportional to F*, with coefficients σ (the exposure rate) and ϵ (the reintroduction rate), respectively. Additionally, the number of susceptible users at the steady state depends solely on the chosen parameters.
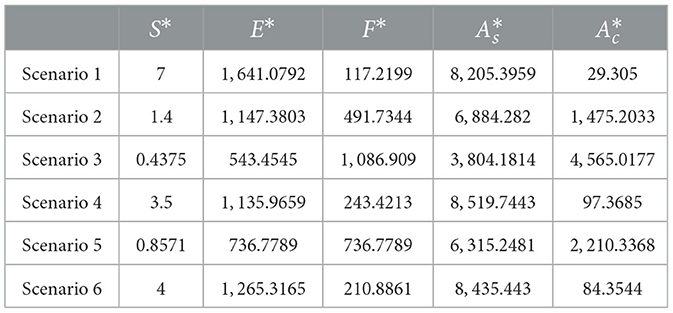
Table 6. Analytical solutions for ASM fixed points across six scenarios, rounded to four decimal places.
To assess the stability of the fixed points in our model, we analyze the system's Jacobian matrix. This involves calculating the eigenvalues of the Jacobian matrix to determine whether the fixed points are stable or unstable. Stability is established if all eigenvalues have negative real parts; conversely, if any eigenvalue has a positive real part, the system is unstable at that fixed point.
The detailed calculations of the Jacobian matrix are provided in the Appendix 8. Here, we present the final result of that calculation:
In order to find the eigenvalues, one must solve the characteristic equation which is given by:
where λ is the eigenvalue and I is the identity matrix.
Here we let J* be the matrix, where S* and F* are substituted into S(t) and F(t) respectively.
By substituting the parameter values provided in Table 2 and the analytically derived values for the fixed points, the eigenvalues of the dynamical system were calculated as described by Equation 24. While this process can sometimes be challenging, in our case, the calculation was performed using the MATLAB command “eig” (The MathWorks, Inc., 2024). It can be seen that one of the 5 eigenvalues is 0. The other four eigenvalues exhibited a complex structure and are not shown here. Instead, the values for each eigenvalue were found individually for each scenario. The results are displayed in Table 7.
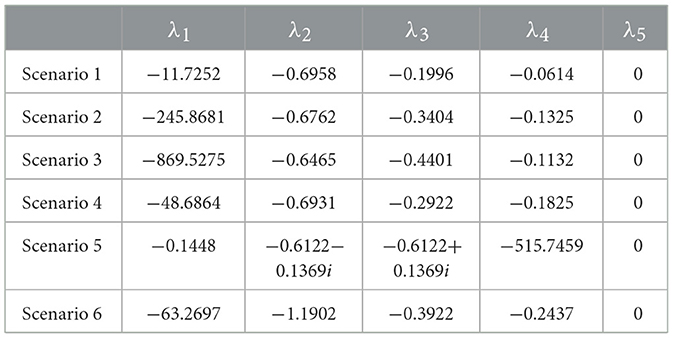
Table 7. Eigenvalues for ASM across six scenarios, rounded to four decimal places.
The dynamical system was designed so that the total number of users remains constant over time, which guarantees that one eigenvalue equals 0. Mathematically, the rank of the matrix J is 4, meaning the number of non-zero eigenvalues cannot exceed the rank. From the results in Table 7, we observe that all other eigenvalues are negative, confirming that the fixed point for each scenario is stable.
In the context of our model, we conclude that even if the system experiences slight perturbations, it will naturally return to its fixed point over time. The stability of the fixed points indicates that the spread of misinformation will either stabilize at a persistent level or diminish over time, depending on the scenario. Importantly, this stability ensures that no uncontrolled growth, divergence, or oscillations occur in user states.
Additionally, the stability of the system enables effective interventions, such as increasing user awareness, implementing fact-checking mechanisms, or enhancing moderation efforts. These interventions can shift the system to a new equilibrium, demonstrating that targeted measures can significantly alter the dynamics of misinformation propagation and mitigate its impact. The predictable behavior of the model around the fixed points is crucial for understanding how user actions—such as refraining from forwarding or engaging in fact-checking—affect the long-term outcomes of misinformation dissemination.
In summary, the stability of all eigenvalues confirms that the model represents a controllable system, where the dynamics of misinformation can reach equilibrium. This provides a robust framework for analyzing and designing effective intervention strategies to address the spread of misinformation.
4.1.2 EM
. We would like to perform the same analysis above for the EM and determine the stability of the system. The full details of the calculation can be found in the Appendix 8. Following the same logic we are able to show that, similar to the model one, the model two has only one fixed point under the constraint given by Equation 1. Therefore, we express S*, E*, , and C* in terms of F*, where the asterisk symbol (*) is used to denote for the fixed point:
Just like in the ASM, using Equations 7–12 and the definition of the fixed point, one can derive a single equation for F* in terms of the total user population N, the infection rate β, the reintroduction rate ϵ the transition rate from exposed to forwarding users, σ the alert rate for forwarded messages, γ and the recovery rate δ. Additionally, β1 and β2 represent the infection rates on different platforms, βp denotes the infection rate due to confirmation bias, θ is the fact-checking rate and ϵc accounts for the reintroduction of fact-checked users.
This equation is given by:
where
Using the parameters provided in Table 4 we can calculate the fixed points for each of the variables, Table 8 shows the analytically calculated fixed points for the 6 scenarios.
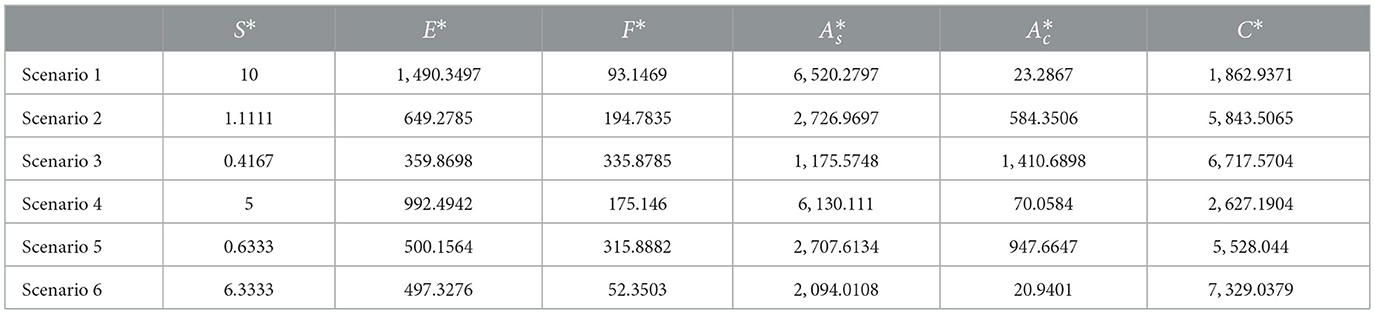
Table 8. Analytical solutions for EM fixed points across six scenarios, rounded to four decimal places.
The Jacobian matrix for the EM is presented below (refer to the Appendix 8 for full details):
The eigenvalues for each of the six scenarios are shown in Table 9. Similar to ASM, one of the eigenvalues is 0, as the rank of the Jacobian matrix is 5. Since the real parts of all other eigenvalues are negative, the fixed point is stable for every scenario analyzed.
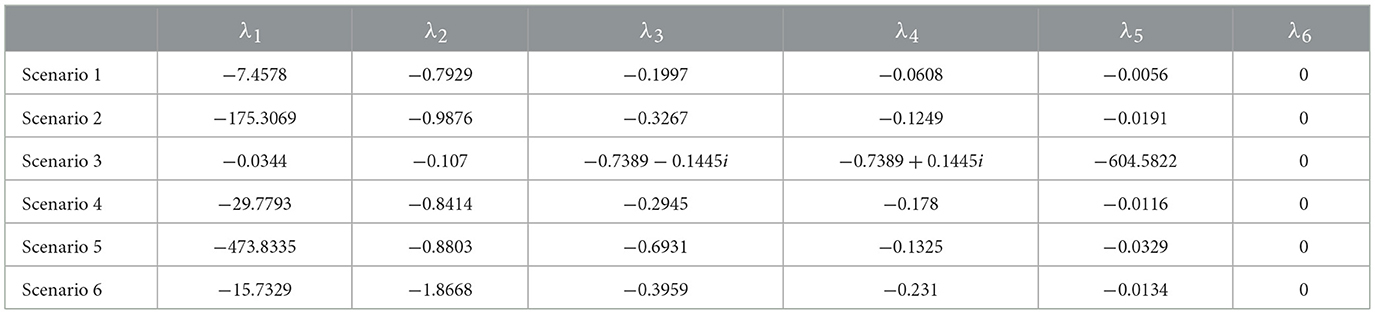
Table 9. Eigenvalues for EM across six scenarios, rounded to four decimal places.
4.1.3 GIFS
Appendix 8 provides analytical derivation for the expressions of M*, S*, E*, F*, and in terms of , where asterisk denotes fixed point. Using the constraint in Equation 1 numerical values for were calculated using the “sympy” python library.
To assess the stability of the fixed points, considering that , the Jacobian matrix of the GIFS model was calculated:
Corresponding fixed points were substituted into S(t), M(t), F(t) and E(t), and eigenvalues of the Jacobian matrix were calculated, as previously.
In contrast to the previous models, two fixed points were found for each scenario. However, one of the fixed points contained negative values for at least . These fixed points turned out to be unstable. Thus, neither initial conditions, nor temporal dynamics will lead to the convergence of the system to such fixed points. The second fixed point always contained meaningful values for the variables and was stable. The analytically calculated values for the stable fixed points and corresponding eigenvalues are given in Tables 10, 11, correspondingly. The same values for unstable fixed points are provided in Tables 12, 13.
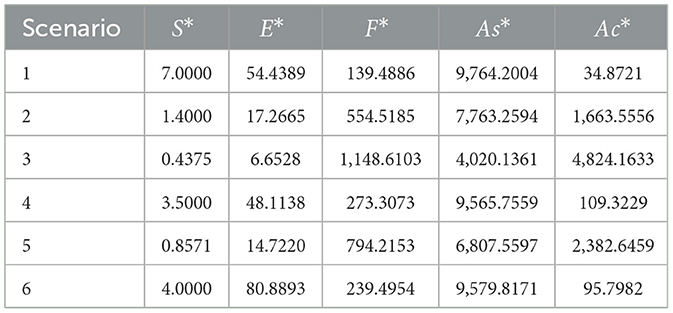
Table 10. Analytical solutions for the stable fixed points of GIFS under six scenarios, rounded to four decimal places.
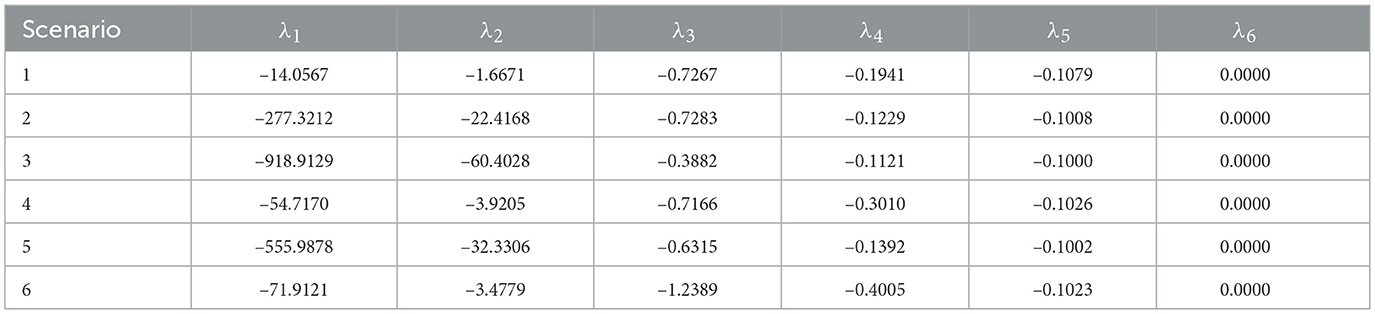
Table 11. Eigenvalues corresponding to the stable fixed points of GIFS under six scenarios, rounded to four decimal places.
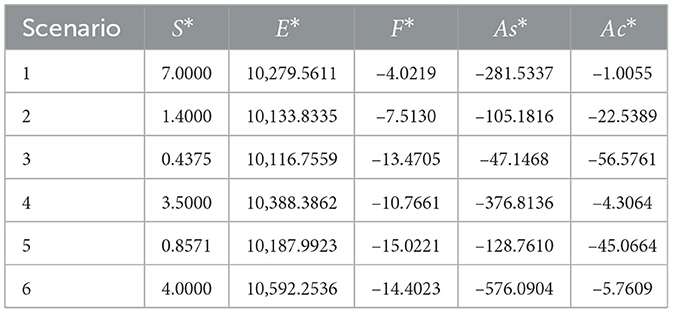
Table 12. Analytical solutions for the unstable fixed points of GIFS under six scenarios, rounded to four decimal places.
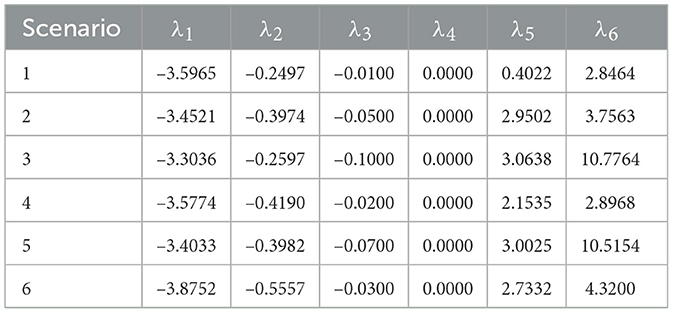
Table 13. Eigenvalues corresponding to the unstable fixed points of GIFS under six scenarios, rounded to four decimal places.
4.2 Numerical simulations
In the previous section, the fixed point of the dynamical system was calculated analytically, and it was demonstrated that the fixed point is stable across the six scenarios analyzed.
This section presents the results of the numerical solutions. The system of differential equations was solved using MATLAB's ode45 function (The MathWorks, Inc., 2024), a versatile solver based on a variable-step Runge-Kutta method that is well-suited for solving non-stiff differential equations (Butcher, 2008). To avoid artificial oscillations around the fixed point caused by large step sizes, the maximum step size was set to 0.001, ensuring precise convergence.
The initial conditions for the variables were chosen as follows: S(0) = 9999, E(0) = 1, and F(0) = As(0) = Ac(0) = 0. Additionally, for the EM C(0) = 0, and for GIFS M(0) = 0. These initial conditions were selected to reflect a realistic starting scenario where the majority of the population is initially susceptible S(0), one user is exposed E(0), and no users are actively forwarding or aware of the misinformation. This setup allows us to model the early stages of misinformation propagation and observe how the dynamics evolve over time. It should be noted, that for the considered 6 scenarios the final state of the dynamical system does not depend on the initial conditions.
In the following, the results based on numerical simulations are presented for the proposed three models.
4.2.1 ASM
Table 14 shows the values to which the variables converged at t = 1, 000. Additionally, Table 15 provides the times t at which all variables converged to the analytically calculated values presented in Table 6, defined by an absolute difference of less than 10−6. This comparison validates the accuracy of the numerical solutions and confirms their alignment with the analytical results.
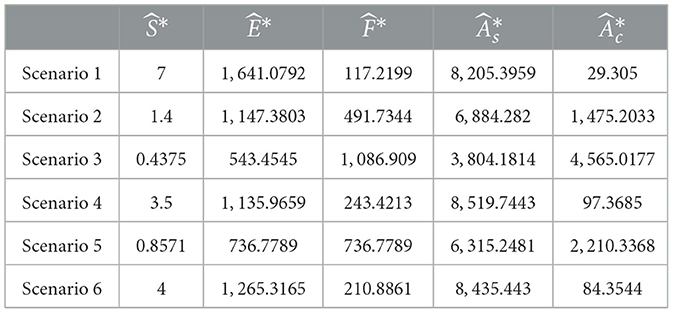
Table 14. Numerical solutions for ASM fixed points across six scenarios with tf = 10, 000, rounded to four decimal places.

Table 15. Time t at which all variables in ASM converged to the analytically calculated values presented in Table 6 (absolute difference 10−6).
The temporal evolution of the variables in Equations 2–6 is illustrated in Figure 4. The final values to which these variables converge depend on the selected parameters.
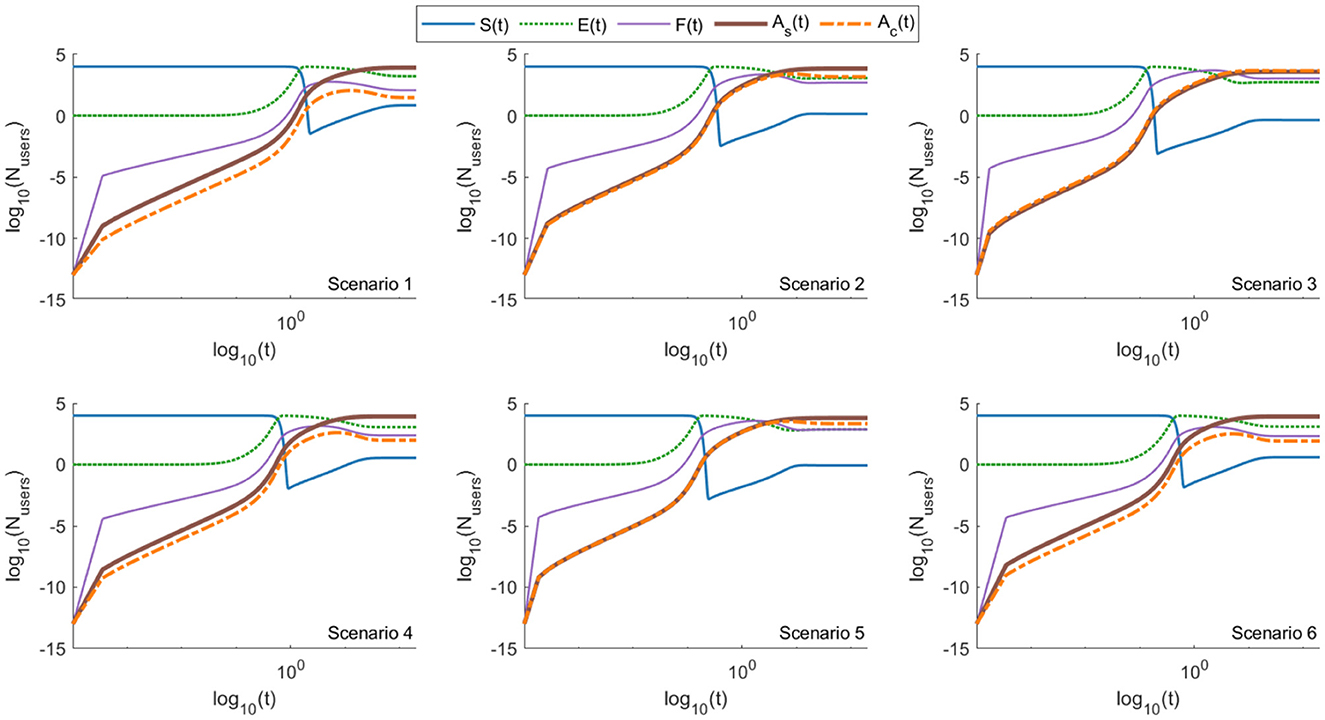
Figure 4. Log–log plot of the ASM model (Equations 2–6), showing the evolution of five user compartments—susceptible (S), exposed (E), forwarding (F), aware-but-forwarding (Ac), and aware-and-stopped (As)—across six distinct scenarios. All scenarios exhibit rapid exposure and an early rise in forwarding behavior. Scenario 3 (emotional engagement) shows the highest and most sustained forwarding (see also Table 14), driven by emotionally resonant content. Scenarios 2 (peer network dynamics) and 5 (source trust) also exhibit elevated forwarding due to peer reinforcement and perceived credibility. In contrast, scenarios 1 (accurate content), 4 (belief misalignment), and 6 (platform intervention) show limited spread, highlighting the mitigating effects of factual content, cognitive dissonance, and moderation. Over time, a gradual shift from Ac to As is observed, reflecting the delayed but eventual impact of user awareness.
Across all six scenarios, nearly all users are exposed to misinformation at an early stage, followed by an increase in the number of forwarding users. Forwarding behavior dominates only in scenario 3, highlighting the significant role of emotional or controversial misinformation. Interestingly, we can observe this transition from Ac (aware but continuing to forward) to As (aware and stopping forwarding) over time in the simulation outcomes. Behaviorally, this reflects the natural tendency for users who initially persist in forwarding misinformation to eventually cease this behavior. This cessation may result from cognitive fatigue, diminished emotional engagement, exposure to corrective information, or shifts in social norms. The recovery rate δ in our model operationalizes this behavioral attrition, ensuring that even initially resistant users may ultimately stop forwarding and thus contribute to stabilizing misinformation spread.
For scenarios 1, 4, and 6, only approximately 1.47%, 3.41%, and 2.95% of users continue forwarding messages () at the steady state. In comparison, the steady-state forwarding rates for scenarios 2, 3, and 5 are approximately an order of magnitude higher, at 19.67%, 56.52%, and 29.47%, respectively. These results emphasize the influence of parameters like emotional content and platform-specific dynamics on the propagation of misinformation.
4.2.2 EM
In order to model the spread of misinformation closer to the real-world scenario, more complexity was added to the EM. To refine the model, we introduced the following elements in EM: the model differs from ASM by introducing:
• A parameter for the second social media platform β2,
• A parameter to account for confirmation bias βp,
• A variable for fact-checked users C*.
The dynamics of the variables in the EM are illustrated in Figure 5. Table 16 presents the values to which the variables converged at t = 2, 000.
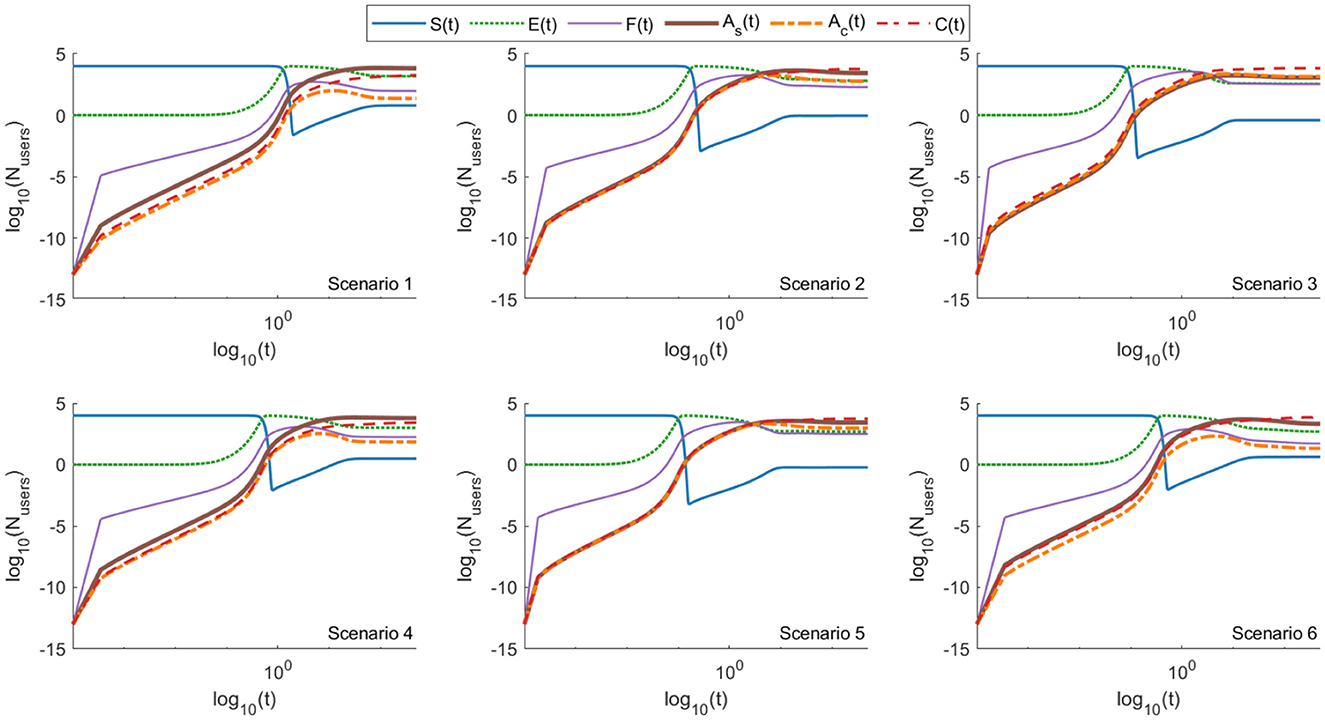
Figure 5. Log–log plots of the EM model (Equations 7–11) showing the evolution of six user compartments—susceptible (S), exposed (E), forwarding (F), aware-but-forwarding (Ac), aware-and-stopped (As), and fact-checked users (C)—across six distinct scenarios. As with the ASM model, early exposure to misinformation is rapid across all scenarios, followed by a rise in forwarding activity. However, unlike ASM, the EM model shows a notable decline in As over time, coinciding with a rise in C, indicating that users are increasingly diverted toward fact-checking rather than passive awareness. This highlights the impact of platform-based interventions and verification mechanisms. Scenario 3 (emotional engagement) again exhibits the highest prevalence of forwarding behavior, showing resistance even in the presence of fact-checking (see also Table 16). Scenarios 2 (peer networks) and 5 (source trust) maintain elevated forwarding, while scenarios 1 (factual content), 4 (belief misalignment), and 6 (moderation) result in lower misinformation spread. These trends emphasize the added resilience fact-checking provides in controlling propagation across most—but not all—contexts.
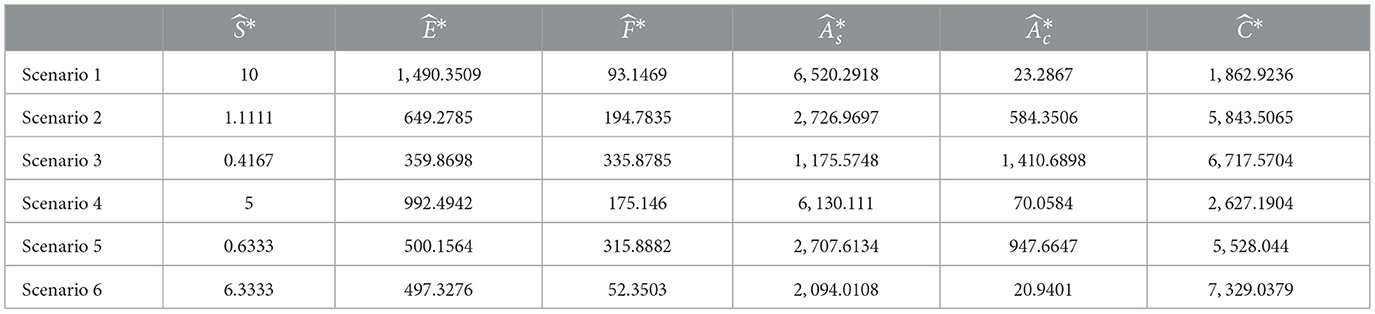
Table 16. Numerical solutions for EM fixed points across six scenarios with tf = 20, 000, rounded to 4 decimal places.
Unlike ASM, EM, the steady state is dominated by fact-checked users in nearly every scenario. The exceptions are scenarios 1 and 4, where the population is primarily composed of users who stopped forwarding misinformation. The relationships between other variables at the steady state appear similar across the two models (as shown in Figures 4, 5), but the total number of forwarding users () is lower in EM for all scenarios. Compared to the results above the fraction of forwarding users at the steady stare are: 1.16%, 7.79%, 17.47%, 2.45%, 12.64%, 0.73% for scenarios 1–6, respectively.
As in ASM, nearly all users are exposed to misinformation at an early stage, followed by an increase in the number of exposed and forwarding users. However, unlike ASM, EM shows a decline in the number of users who stopped forwarding messages after seeing the “forwarded many times” alert. This decline is accompanied by a rise in fact-checked users, highlighting the critical role of fact-checking and platform moderation in mitigating the spread of misinformation. Furthermore, similar to ASM, the population is dominated by forwarders of misinformation only in scenario 3.
4.2.3 GIFS
Results of the simulation for GIFS model is depicted in Figure 6. At the end of the simulation the variables converged to the analytically calculated ones (see Table 10, absolute difference < 10−6).
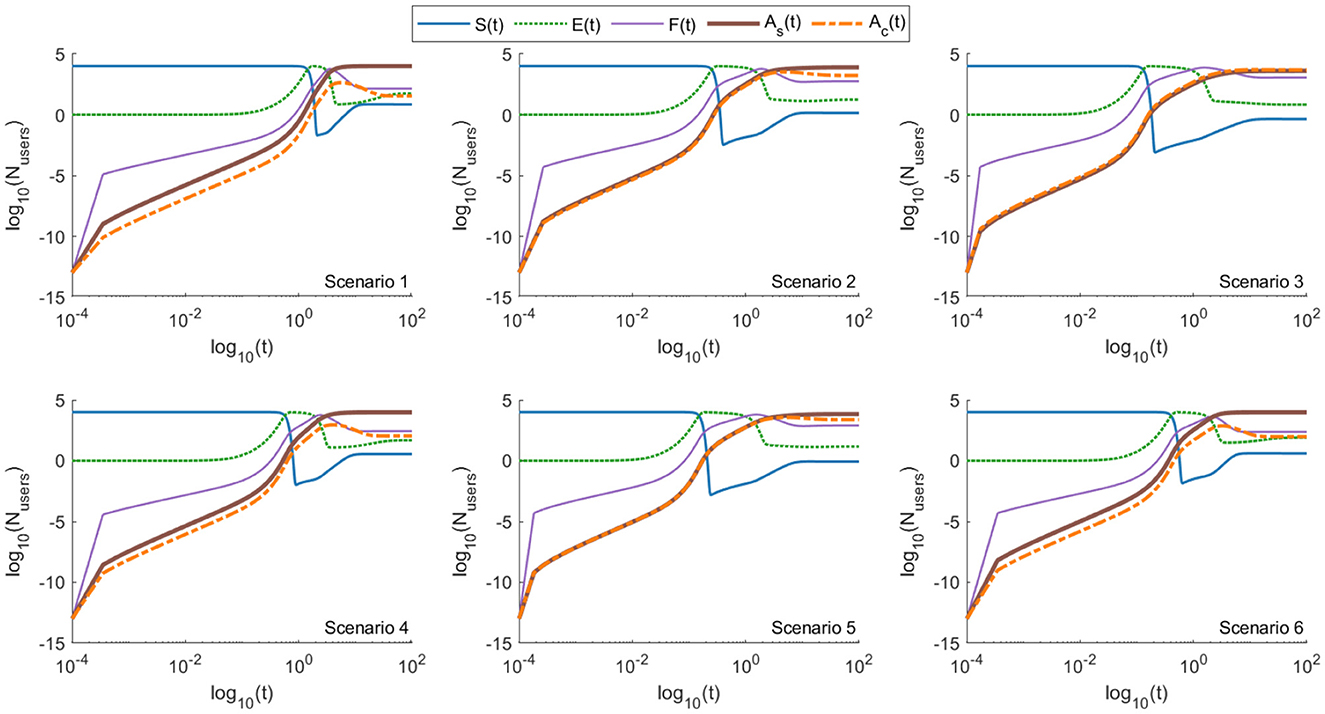
Figure 6. Log–log plots of the GIFS model (Equations 13–16) showing the evolution of seven user compartments—susceptible (S), exposed (E), forwarding (F), aware-but-forwarding (Ac), aware-and-stopped (As), fact-checked users (C), and generative AI activity (M)—across six distinct scenarios. Compared to the ASM and EM models, the inclusion of generative AI feedback in GIFS leads to higher steady-state values of both forwarding (F) and aware-but-forwarding (Ac) users in most scenarios (see also Table 10). This amplification effect is particularly notable in scenarios 2 (peer networks), 3 (emotional engagement), and 5 (trusted sources), where M(t) increases in response to user forwarding activity, creating a reinforcing feedback loop. The As compartment also rises, indicating that some users still disengage over time, but its growth is slower than in the previous models. Fact-checked users (C) are present but less dominant, as the influence of generative AI (M) accelerates both exposure and forwarding. These results illustrate the heightened risk and persistence of misinformation in the presence of adaptive, AI-driven content generation.
With the chosen parameters, the converged values for the forwarding users (F and Ac) were higher in case of GIFS model, than for ASM (Tables 6, 10). The increase was 37.8%, 12.8%, 5.7%, 12.3%, 7.8%, 13.6% for the scenarios 1-6, respectively. Similar trend is observed for the users who stopped forwarding misinformation (). Increase in the number of F*, , and is accompanied with the drastic reduction of the exposed users (E), with approximately 30-fold reduction for Scenario 1, and 67, 90, 23, 52, 15-fold reduction for Scenarios 2–6, respectively.
Much larger difference was observed in the maximal number of the users who forward the misinformation along the simulation (Table 17). Although the smallest (largest) values were observed for scenario 4 (scenario 3) in both models, in case of GIFS at least 60% of the users were forwarding the misinformation at some point, peaking at 88% for scenario 3, accounting for the relevant/emotional appeal.
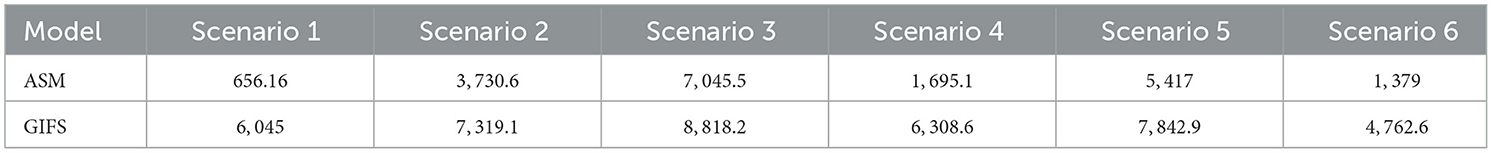
Table 17. Comparison of maximal number of fake-news forwarding users (F + Ac) in ASM and GIFS model.
Next, to investigate how the amplitude (a) and time constant (1/k) influence the number of forwarding users, all parameters were fixed as described above, and only a and k were varied. Larger k corresponds to the faster learning rate for the Gen AI. 100 linearly spaced values of a were chosen between 0 and 0.02. Values of k were selected using a logarithmic scale from 10−10 and 102.
The results are illustrated in Figures 7–10. Figures 7, 8 depict how the number of forwarding users at the stable state depends on the parameters a and k. Figures 9, 10 show the same dependency on the maximal number of forwarding users obtained during simulations. The color on the heatmaps depicts the number of forwarding users (F + Ac).
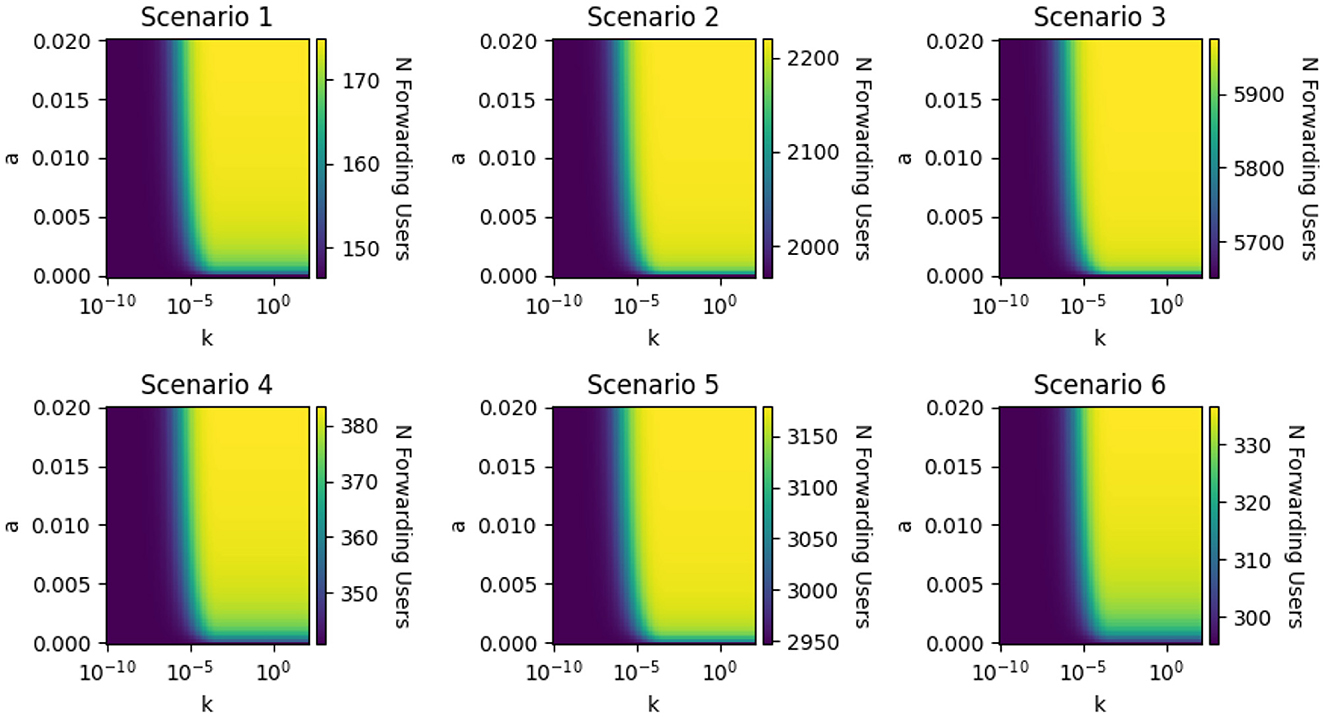
Figure 7. Sensitivity analysis of the GIFS model showing how the number of forwarding users at steady state varies with changes in the generative AI parameters: amplitude (a) and learning rate (k). All other parameters were held constant as defined in the main text. The amplitude a was varied linearly between 0 and 0.02, while k was varied logarithmically from 10−10 to 102 to capture a wide range of AI learning speeds. For each scenario, the plots reveal a consistent pattern: when a > 0, the number of forwarding users remains low for small values of k but increases sharply once k exceeds a critical threshold around 10−5. Additionally, for large k, increasing a further amplifies the number of users spreading misinformation. These results highlight the compounding effect of both faster AI adaptation and stronger influence strength on misinformation propagation across all six scenarios.
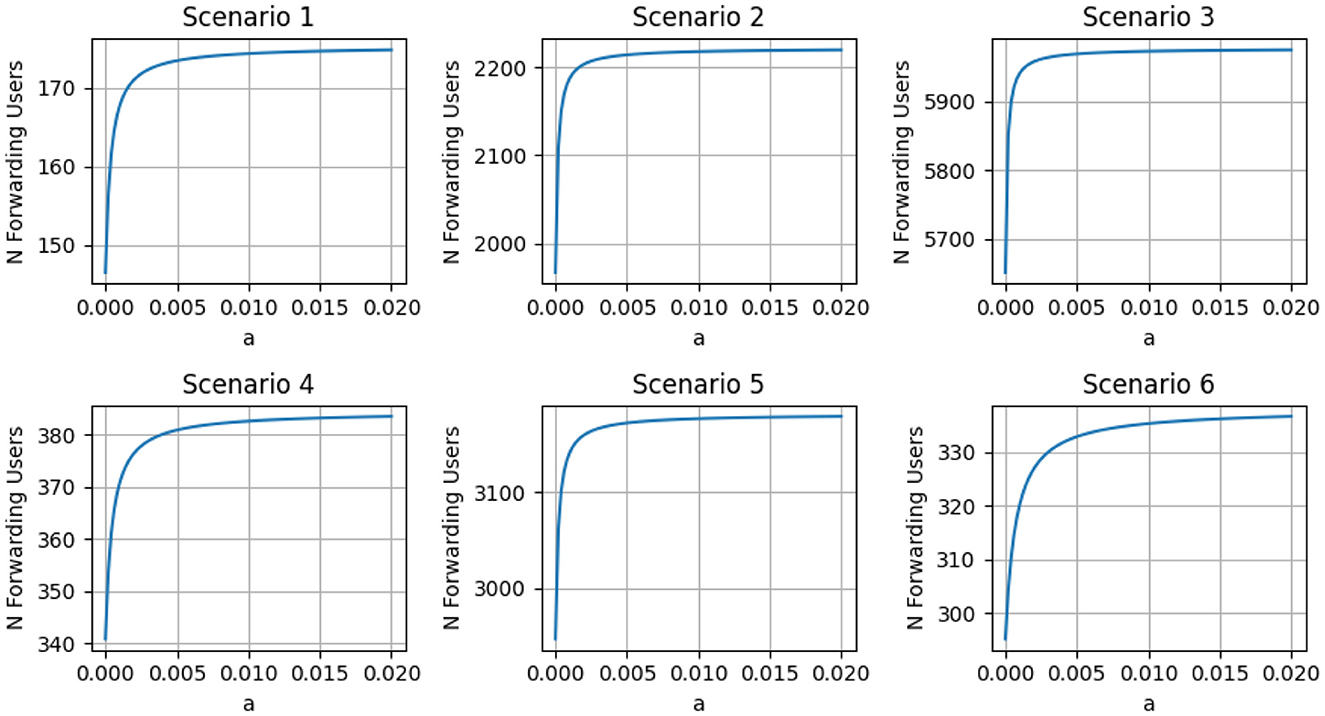
Figure 8. Effect of the generative AI amplitude parameter (a) on the number of forwarding users at steady state, with the AI learning rate fixed at k = 1. These plots correspond to the cross-section of results shown in Figure 7. For all six scenarios, increasing the parameter a leads to a higher number of forwarding users, illustrating the intensifying effect of stronger generative AI influence. Notably, Scenario 6—representing early platform moderation—shows the least steep increase, indicating that effective early interventions can significantly buffer the system against the amplifying effects of generative AI. This result reinforces the role of moderation in mitigating AI-driven misinformation spread, even when the AI influence is strong.
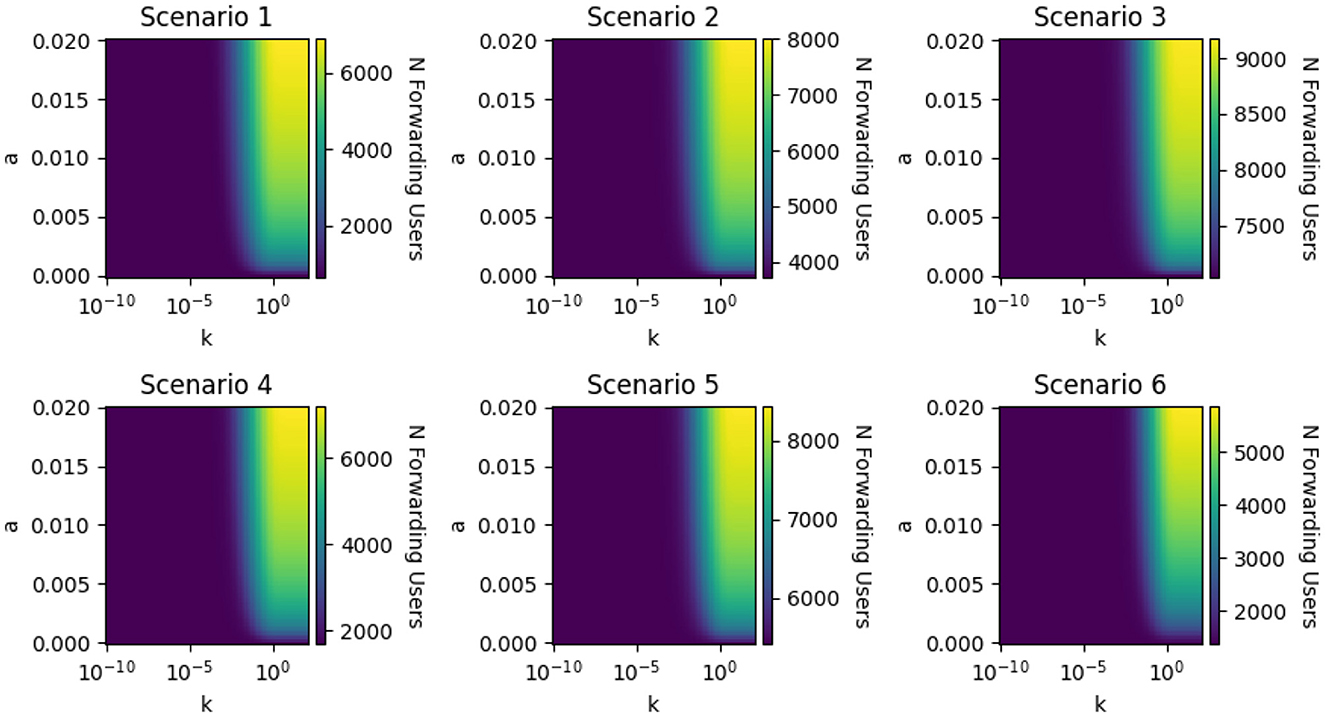
Figure 9. Effect of the generative AI parameters a (influence amplitude) and k (learning rate) on the peak number of forwarding users during the simulation. The heatmaps display the combined peak population of forwarding (F) and aware-but-forwarding (Ac) users across all six scenarios, with color intensity indicating the magnitude. As in the steady-state analysis (Figure 7), the number of forwarding users increases sharply for a > 0 once k exceeds a scenario-dependent critical threshold. However, the critical value of k required to affect the peak is several orders of magnitude larger than that for the steady state. This suggests that transient forwarding activity is less sensitive to slow AI adaptation, whereas the long-term (steady-state) behavior is more strongly influenced by even small learning rates.
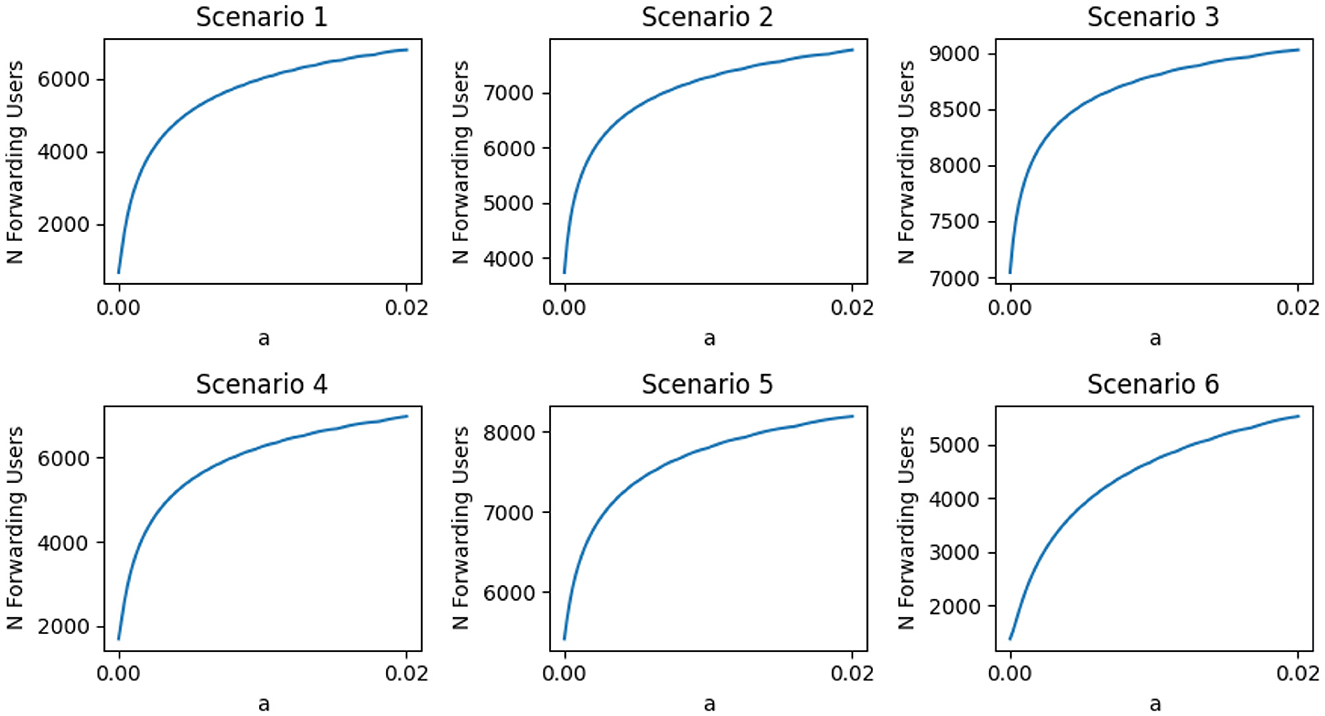
Figure 10. Effect of the generative AI amplitude parameter (a) on the peak number of forwarding users, with the learning rate fixed at k = 1. These plots correspond to the horizontal slice of the heatmaps shown in Figure 9. For all scenarios, increasing a leads to a rise in the peak number of users forwarding misinformation (F + Ac). The transient peak is less sensitive to small values of k compared to the steady state, as slower AI learning delays its influence during early stages. Consequently, the critical threshold of k that affects the peak is significantly higher than that affecting the steady-state behavior (as shown in Figure 7). Scenario 6 again shows the smallest increase, indicating that early platform moderation can also dampen transient spikes in misinformation spread.
For each scenario, for every a > 0 the number of fake-news forwarding users increases once k exceeds a critical value, on the order of 10−5. Similarly, for larger k, increasing a results in an increase in the forwarding users. Interestingly, Scenario 6 exhibits the least steep increase, as illustrated in Figure 8. Since Scenario 6 accounts for early platform moderation, this result underscores the importance of effective moderation measures.
Similar results were observed for the peak number of forwarding users within simulations, however, the critical value of k is several orders larger than one for the steady state. Since the peak corresponds to transient user activity, and lower values of k indicate a slower learning rate of the Gen AI, the steady state is more affected than the transient phase when the Gen AI learns more slowly.
Overall, the results indicate that generative AI models can amplify the spread of misinformation. Depending on the learning rate, they may influence either the steady state alone or both the steady state and the transient response.
4.3 Importance of fact-checked users: one social media without confirmation bias
It is evident from Section 4 that introducing fact-checking users significantly reduces the spread of misinformation. However, as in the EM, several layers of complexity are added, one cannot directly compare the above-mentioned results between EM and ASM to make a conclusion about the effect of the fact-checked users on the population dynamics.
In this section, we examine how the inclusion of fact-checking users impacts the steady-state solution, with that in mind β2 and βp were set to 0. The values for β1, ϵ, σ, p, γ, and δ were chosen to mach those in ASM, with β1 = β. This updated model enables us to examine how fact-checking users affect the spread of misinformation on a single platform.
Table 18 presents the analytically calculated fixed points for the six scenarios, derived using Equation 30. The corresponding eigenvalues of the Jacobian matrix for each scenario are provided in Table 19. As shown, all fixed points were found to be stable.
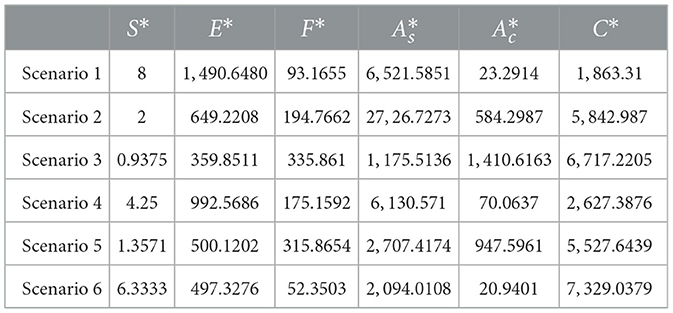
Table 18. Analytical solutions for the fixed point in case of one social media without confirmation bias.
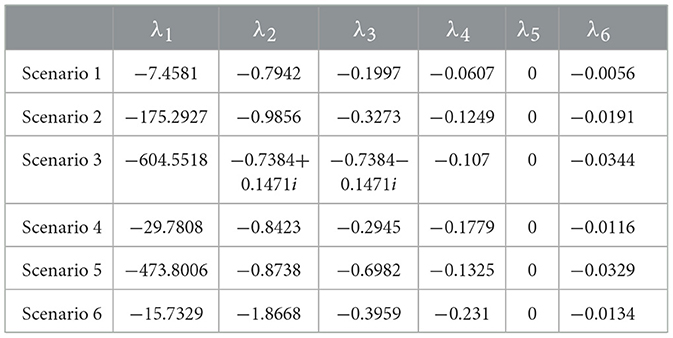
Table 19. Eigenvalues of Jacobi matrix corresponding to the different scenarios for fixed points in Table 18.
The numerically calculated values to which the variables converged are shown in Table 20, and the system's dynamics are visualized in Figure 11.
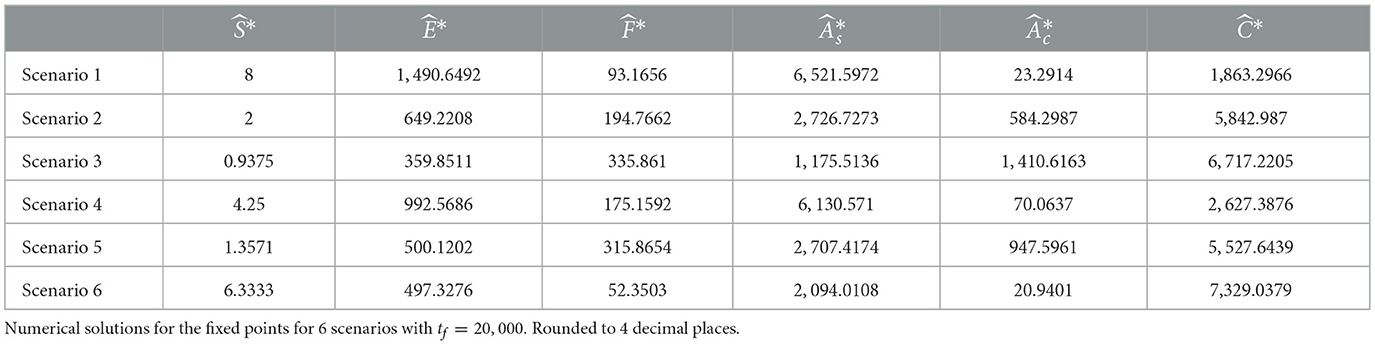
Table 20. Case of one social media without confirmation bias.
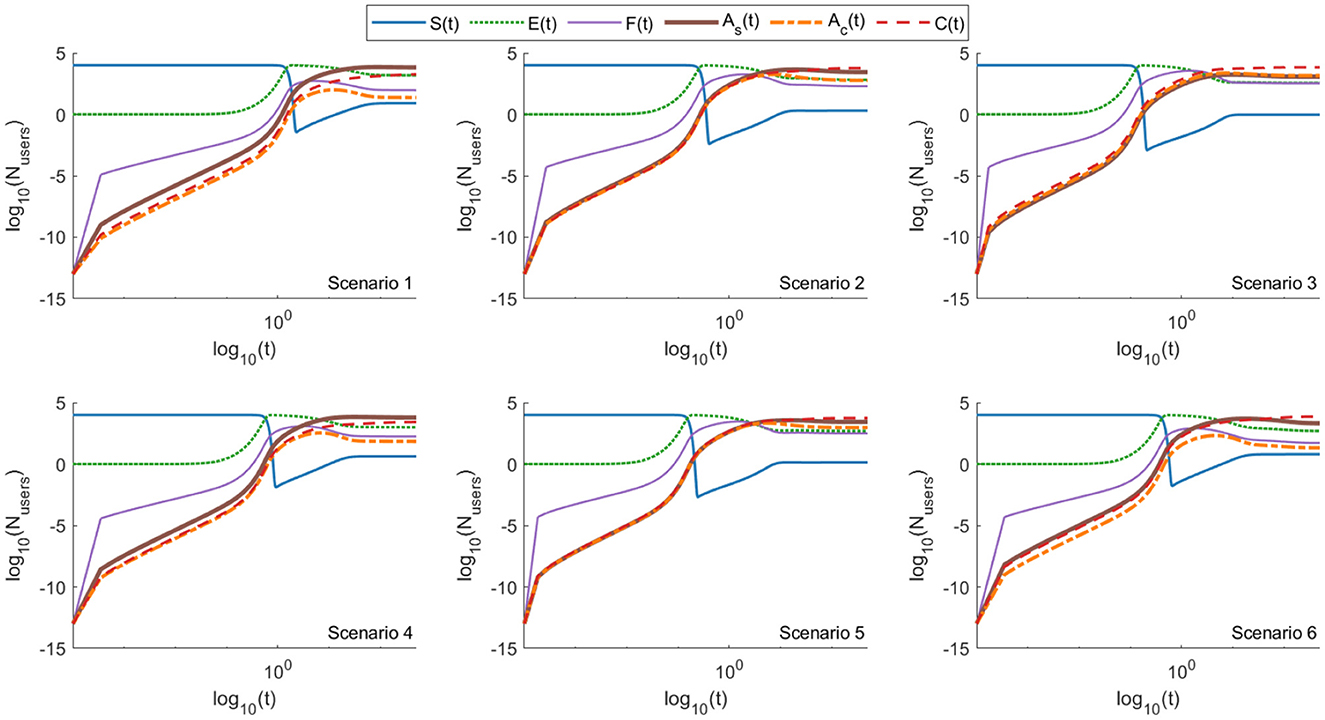
Figure 11. Log–log plots of the EM model (Equations 7–11) showing the evolution of six user compartments—susceptible (S), exposed (E), forwarding (F), aware-but-forwarding (Ac), aware-and-stopped (As), and fact-checked users (C)—across six scenarios, in a simplified setting involving only one social media platform and no confirmation bias. Compared to the baseline ASM model (Figure 4), this configuration results in a marked reduction in the total number of forwarding users (F + Ac) across all scenarios. The presence of fact-checking (C), even without platform heterogeneity or cognitive bias, contributes significantly to limiting the spread (see also Table 21). These findings emphasize the pivotal role of fact-checked users in suppressing misinformation and demonstrate that even modest verification efforts can meaningfully alter the dynamics of propagation when cognitive and structural amplification mechanisms are absent.
The fractions of total forwarding users () at the steady state for the six scenarios are as follows (1) 1.17%, (2) 7.79%, (3) 17.46%, (4) 2.45%, (5) 12.63%, (6) 0.73%. This demonstrates a considerable decrease in the fraction of total forwarding users for each scenario compared to ASM. Interestingly, the fraction of forwarding users among non-fact-checked users, calculated as:
is also smaller than those obtained in ASM: (1) 1.43%, (2) 18.74%, (3) 53.2%, (4) 3.33%, (5) 28.25%, (6) 2.74%.
These findings highlight the critical role of fact-checked users in reducing the spread of misinformation and demonstrate their significant impact on the overall dynamics of misinformation propagation.
4.3.1 Evaluating pathway contributions in the EM model
To further disentangle the roles of various misinformation pathways in the EM model, we conducted targeted simulations where specific exposure mechanisms were selectively deactivated. In particular:
• In one configuration, we set βp = 0, removing the confirmation bias effect while retaining both social media platforms.
• In another, we set β2 = 0, effectively eliminating the influence of the second social media platform, while maintaining exposure from the primary platform (β1) and confirmation bias (βp).
Figures 12, 13 illustrate the time evolution of all compartments under these two pathway-specific configurations. Tables 21, 22 summarize the steady-state compartment values across all six scenarios. The results reveal minimal differences compared to the full EM model, suggesting that the system is structurally robust even when individual pathways are disabled.
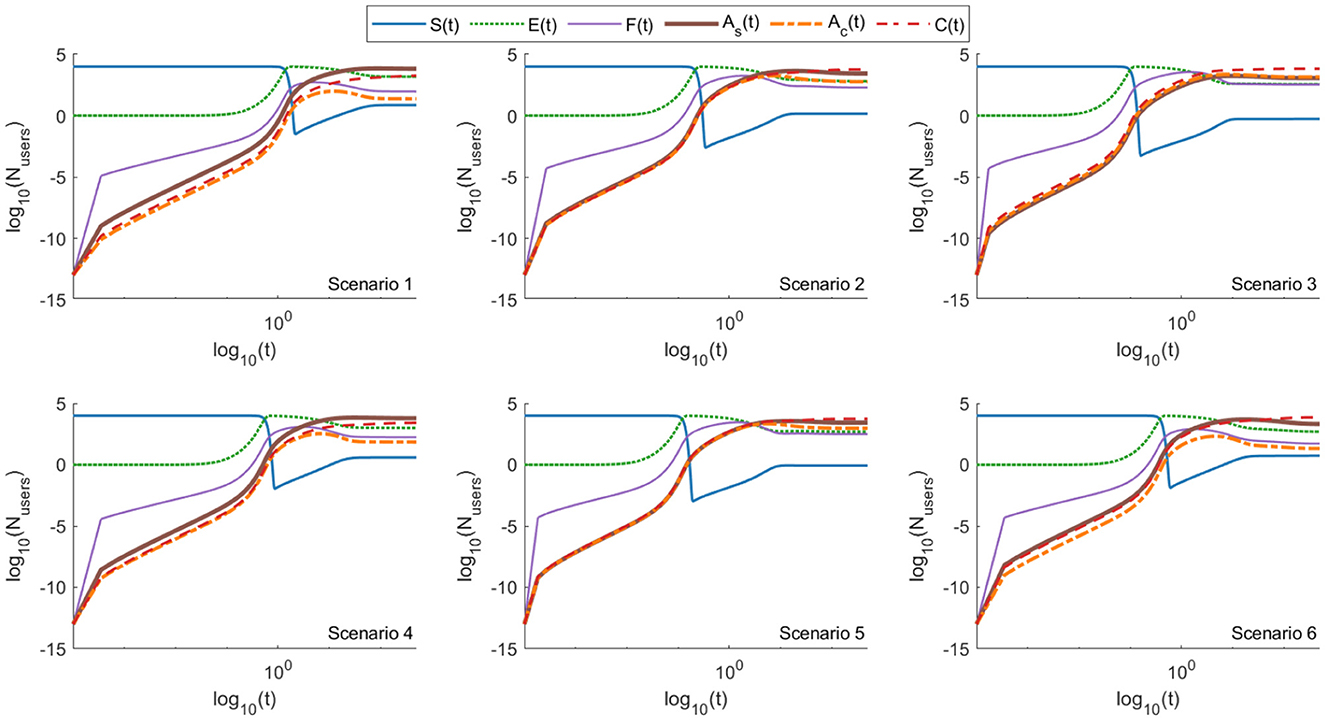
Figure 12. Log–log plots of the EM model (Equations 7–12) showing the evolution of six user compartments—susceptible (S), exposed (E), forwarding (F), aware-but-forwarding (Ac), aware-and-stopped (As), and fact-checked users (C)—across six distinct scenarios, simulated on two social media platforms with confirmation bias disabled (βp = 0 ). These results illustrate the temporal dynamics of all user states in a setting where cross-platform interactions remain but cognitive alignment is removed. Compared to the full EM model (Figure 5), the differences in system behavior are minimal, indicating that the model's structural dynamics are robust even when individual behavioral pathways like confirmation bias are omitted (see also Table 22). This suggests that multi-platform structure alone can sustain spread patterns similar to the full model, though at slightly reduced intensity.
Figure 13. Log–log plots of the EM model (Equations 7–12) showing the evolution of six user compartments—susceptible (S), exposed (E), forwarding (F), aware-but-forwarding (Ac), aware-and-stopped (As), and fact-checked users (C)—across six distinct scenarios, in a setting with a single social media platform and confirmation bias enabled. This configuration isolates the impact of cognitive alignment without multi-platform amplification. The results closely resemble those of the full EM model (Figure 5), with only minor reductions in the forwarding population. This indicates that confirmation bias alone can sustain misinformation spread patterns comparable to those produced by multi-platform dynamics, highlighting its significant role in the propagation process. The structural robustness of the system persists even with partial pathway removal.
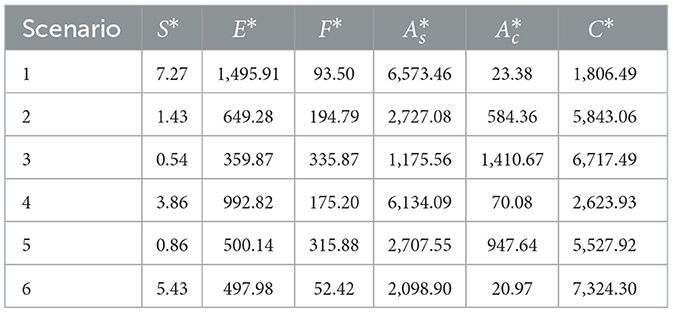
Table 21. Numerical solutions for the fixed point in case of two social media platforms without confirmation bias.
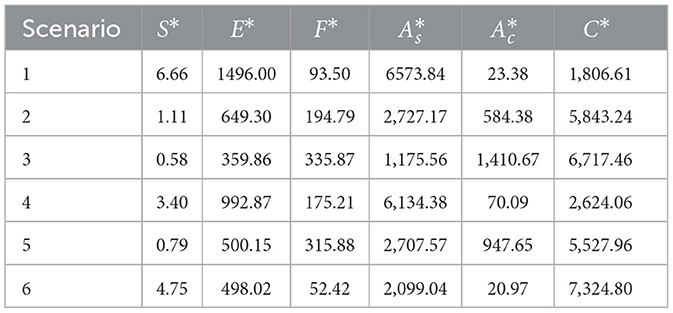
Table 22. Numerical solutions for the fixed point in case of social media platforms with confirmation bias.
Table 23 compares the forwarding user percentages () across all scenarios and EM configurations. Forwarding levels remain remarkably stable when β2 or βp is deactivated in isolation, implying functional redundancy in the misinformation exposure pathways.
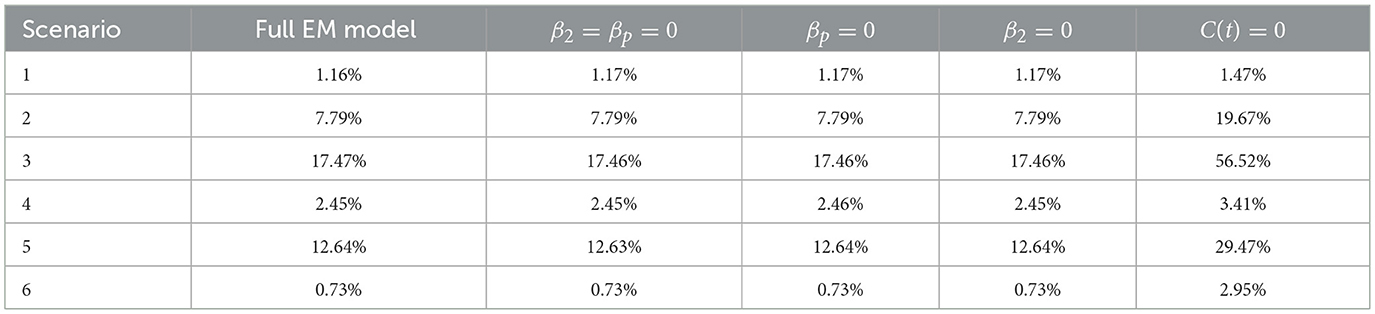
Table 23. Percentage of forwarding users across EM model variants for each scenario.
However, in a final simulation where the fact-checking user compartment C(t) was entirely removed—the percentage of forwarding users rose significantly across all scenarios. This contrast reinforces the crucial role of fact-checked users and platform intervention in mitigating spread of misinformation.
5 Sensitivity analysis
Sensitivity analysis is a crucial step in assessing the robustness of model predictions, particularly when key parameters are uncertain or derived from approximate estimates. It helps identify which parameters most significantly influence model outcomes and determines whether the conclusions drawn remain stable across a plausible range of input values (Saltelli et al., 2000).
Sensitivity analyses are generally classified as either local—where one parameter is varied at a time while holding others constant—or global, where all parameters are varied simultaneously to account for potential interactions and nonlinear effects. Given the complexity and interdependence of behavioral dynamics in the ASM, EM, and GIFS models, we adopted a global sensitivity analysis approach using a Monte Carlo simulation framework.
Although baseline parameters for each scenario were informed by the literature, many were empirically scaled to represent hypothetical or platform-specific behaviors. Because precise values are often unavailable, we defined plausible uncertainty ranges around each parameter by applying both ±10% and ±20% deviations from the scenario-specific baseline. These ranges are consistent with practices in epidemiological and complex systems modeling (Marino et al., 2008; Blower and Dowlatabadi, 1994).
For the ASM model, we performed global sensitivity analysis using Monte Carlo simulations. In each of the six defined scenarios, six core parameters (β, σ, p, γ, δ, ϵ) were independently sampled from uniform distributions within ±10% and ±20% of their baseline values. A total of 1000 simulations were run per scenario and perturbation level. For each sample, fixed points were computed analytically to determine the resulting compartment states, and the outcomes are summarized in Table 24.
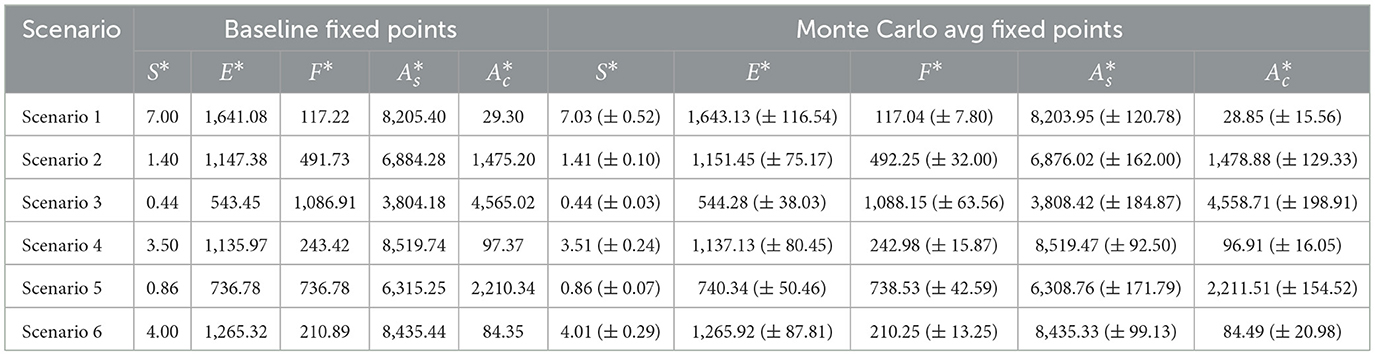
Table 24. Fixed points for ASM compartments in scenarios 1—6 (baseline vs. Monte Carlo averages, ±10% variation).
In addition to the fixed-point behavior, we analyzed the percentage of forwarding users as a central outcome metric, defined as the sum of F* and relative to total population N. Table 25 shows both the baseline forwarding percentage and the robust Monte Carlo estimates (mean and standard deviation) for each scenario.
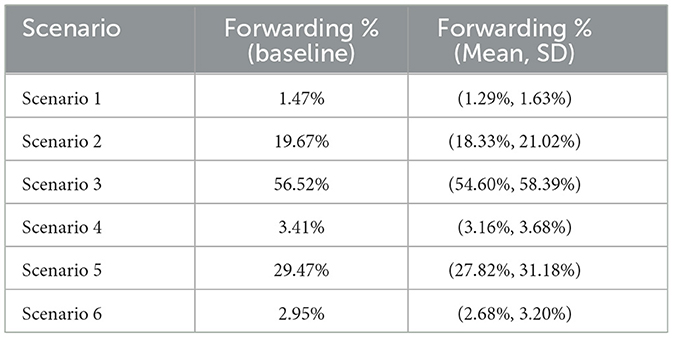
Table 25. Comparison of forwarding users percentage across scenarios (baseline vs. robust average from Monte Carlo).
Although violin plots for both ±10% and ±20% parameter variations are provided to visualize distributional effects under wider uncertainty, the numerical results in Tables 24, 25 report the ±10% variation case only. This is consistent with established practices in epidemiological modeling, where ±10% perturbations are often used to represent plausible uncertainty ranges (Marino et al., 2008).
Despite variations introduced through parameter perturbation, the underlying trend across scenarios remains consistent: scenarios characterized by greater emotional amplification or lower user moderation (such as Scenario 3 and Scenario 5) consistently lead to higher percentages of forwarding users. This finding is reinforced by the baseline forwarding rates across scenarios—Scenario 3 (53.2%) and Scenario 5 (28.25%) remain significantly higher than more moderated counterparts like Scenario 1 (1.43%) or Scenario 6 (2.74%). Even though scenarios such as 2, 3, and 5 exhibit broader standard deviations under global sensitivity analysis, the relative ordering of impact remains intact. This robustness suggests that structural features of each scenario—such as emotional salience or information friction—exert a dominant effect on misinformation spread, and these effects persist even in the presence of uncertainty in behavioral parameter values.
Just as we did for the ASM model, we conducted a global sensitivity analysis for the EM model using Monte Carlo simulations. The same protocol was applied: six key parameters for each scenario were perturbed by both ±10% and ±20%, and fixed points were computed analytically for each of the 1000 random samples per scenario. This allowed us to assess the robustness of equilibrium behaviors under realistic uncertainty bounds.
Table 26 presents the average fixed points of each compartment under ±10% variation, along with standard deviations. These reflect the stability of EM's core compartments under varying assumptions.
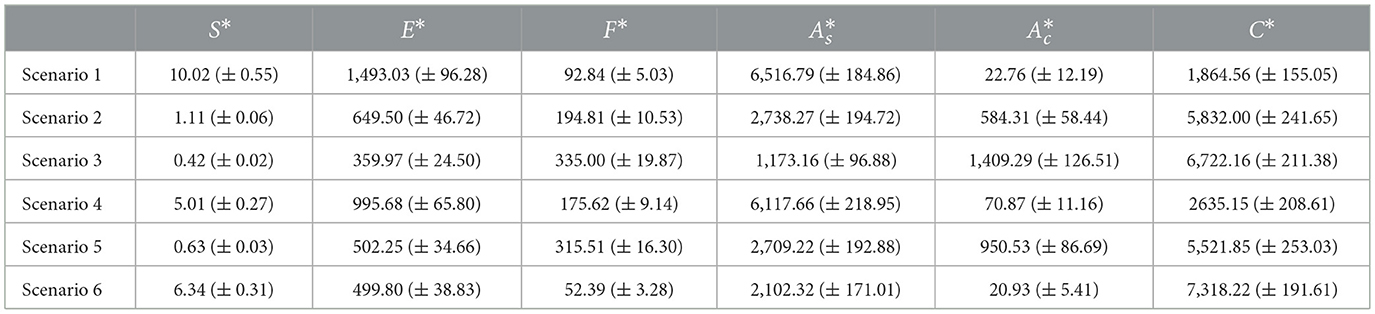
Table 26. Fixed points for EM compartments in scenarios 1—6 (baseline vs. Monte Carlo averages, ±10% variation).
Next, we assessed the percentage of forwarding users, defined as the sum of F* and relative to total population N. Table 27 shows the baseline values alongside the Monte Carlo mean and standard deviation for each scenario.
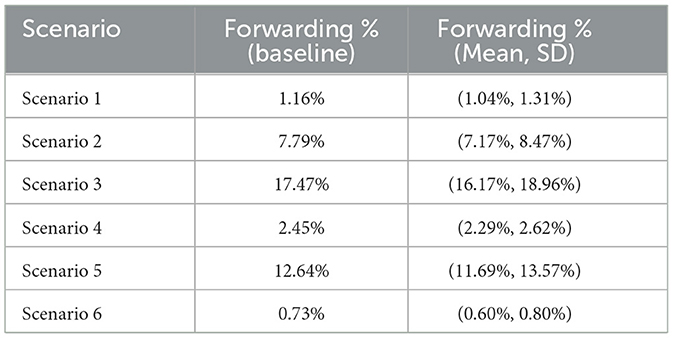
Table 27. Comparison of forwarding users percentage across scenarios in EM (baseline vs. Monte Carlo).
Figures 14, 15 displays the distribution of forwarding percentages across simulations for each scenario, under both ±10% and ±20% parameter variation.
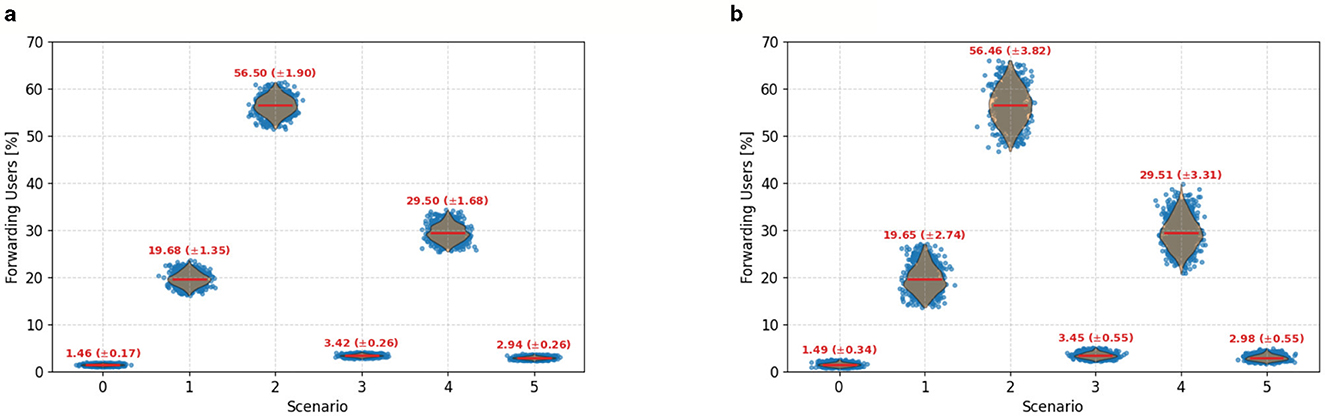
Figure 14. Violin plots showing the distribution of forwarding user percentages across 1,000 Monte Carlo simulations for each of the six ASM scenarios, conducted under global sensitivity analysis. (a) Corresponds to ±10% variation in model parameters, while (b) applies ±20% variation. Red lines indicate the mean and standard deviation for each scenario. Scenario 3 (emotional engagement) consistently shows the highest percentage of forwarding users, indicating high vulnerability to misinformation spread. In contrast, Scenarios 1 (factual content), 4 (belief misalignment), and 6 (platform moderation) demonstrate greater robustness and containment. Despite increasing parameter uncertainty, the overall trend across scenarios remains stable: scenarios driven by emotional amplification or limited moderation—such as Scenarios 3 and 5—consistently result in a higher spread of misinformation. This reinforces the reliability of scenario-specific insights even under parameter perturbation.
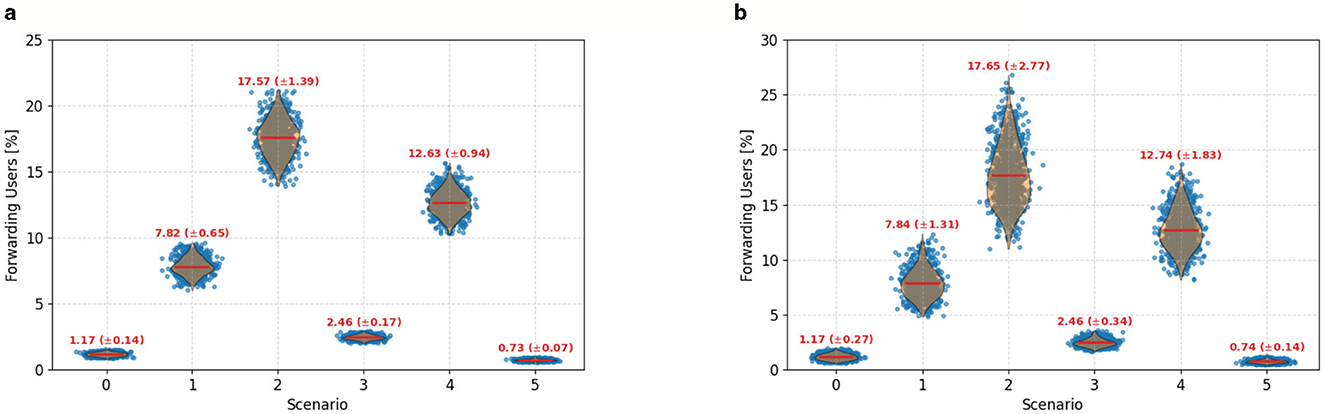
Figure 15. Violin plots showing the distribution of forwarding user percentages across 1,000 Monte Carlo simulations for each of the six EM scenarios, conducted under global sensitivity analysis. (a) Corresponds to ±10% variation in model parameters, while (b) applies ±20% variation. Red lines indicate the mean and standard deviation for each scenario. Scenarios 3 and 5, characterized by emotional resonance and minimal intervention, consistently yield the highest proportions of forwarding users, reflecting elevated susceptibility to misinformation propagation. Conversely, Scenario 6 (strong moderation and fact-checking) exhibits the most robust containment, maintaining low forwarding rates across uncertainty levels. Despite increased parameter variation, the relative performance of scenarios remains consistent, underscoring the reliability of their behavioral distinctions under uncertainty.
Unlike ASM, the EM model consistently reaches a steady state dominated by fact-checked users across most scenarios. Exceptions are seen in Scenarios 1 and 4, where the dominant compartment consists of users who have stopped forwarding misinformation. Although the structural relationships between compartments remain qualitatively similar to ASM (as illustrated in Figures 14, 15), the overall proportion of forwarding users () is lower in the EM model across all scenarios. At baseline, these values are: 1.16%, 7.79%, 17.47%, 2.45%, 12.64%, and 0.73% for Scenarios 1–6, respectively.
Monte Carlo analysis confirms that while broader parameter uncertainty increases variability, the overall scenario ranking by forwarding magnitude remains stable. The distribution widths for Scenarios 2, 3, and 5 indicate increased sensitivity, yet Scenario 3 continues to dominate in forwarding activity, similar to ASM. The EM dynamics further emphasize the importance of fact-checking: unlike ASM, the model exhibits a reduced number of users halting their forwarding behavior after alerts, and a corresponding increase in fact-checked users. This suggests that robust moderation mechanisms—not just user alerting—play a pivotal role in dampening misinformation spread, particularly in emotionally charged contexts such as Scenario 3.
Given these insights, we do not repeat the sensitivity analysis for additional EM variants where (1) β2 = βp = 0, (2) β2 = 0, or (3) βp = 0. While the structural dynamics of these reduced models remain consistent with the full EM framework, the absence of fact-checking and/or platform intervention consistently leads to slightly higher steady-state percentages of forwarding users (), as shown in Table 23. This reinforces the critical moderating influence of the β2 and βp pathways in dampening misinformation.
Moreover, since our Monte Carlo analysis of the full EM model demonstrated stable equilibrium behavior across perturbed parameter settings—and given that all EM variants yield near-identical forwarding outcomes—we expect these reduced variants to exhibit similar sensitivity patterns.
Given that the primary objective of the GIFS model was to investigate the influence of generative AI on misinformation spread, we did not conduct a separate global sensitivity analysis for GIFS. Unlike ASM or EM, where sensitivity analysis provides crucial insight into how behavioral parameters influence model stability, the results presented earlier already demonstrate a consistent amplification of forwarding users across all six scenarios under the GIFS framework. Importantly, the increase in fake-news forwarding users—triggered by exceeding a critical learning rate threshold (on the order of 10−5) and further intensified by rising emotional amplitude a—was observed systematically in each scenario. Therefore, while the sensitivity structure of GIFS could be explored in greater detail, doing so would likely not yield substantially new insights beyond those already derived. The results already indicate that generative AI's presence consistently leads to greater misinformation propagation, reaffirming the model's core finding across the full scenario space.
6 Discussion
The results of our paper highlight how crucial platform moderation and fact-checking tools are to halting the spread of false information on social media. The percentage of forwarding users at the steady state was considerably lower in both, ASM and EM models in situations where platform moderation steps in early (Scenario 6). This demonstrates how well early intervention techniques, such as content flagging and moderation, work to stop the spread of false information. These findings are consistent with other research showing that proactive moderation measures are essential for reducing the impact and reach of misleading material (Syed, 2017).
Furthermore, it was shown that the involvement of generative AI in the spread of misinformation might dramatically affect user behavior. The results show that the impact of generative AI on the number of forwarding users depends on the emotional amplitude and the AI's learning rate, represented by the parameters a and k, respectively. Moreover, depending on the value of the learning rate, the number of fake-news forwarding users may be minimally affected, influenced only at the steady state, or also significantly altered during the transient phase if the learning rate is sufficiently high.
When the learning rate of the generative AI is fast enough to alter the steady state but not sufficient to impact the transient response, the behavioral dynamics—combined with natural recovery mechanisms—may limit the AI's sustained influence, leading to saturation effects over time. Thus, while generative AI may accelerate the initial outbreak of misinformation, it may not maintain high forwarding rates indefinitely. This distinction between transient spikes and steady-state behavior underscores the urgency of early intervention, before AI-driven amplification peaks and becomes more difficult to control.
The findings also highlight how important fact-checking systems are. Compared to the ASM, the percentage of forwarding users dropped in all scenarios in the EM, which includes fact-checking users. This decrease demonstrates how fact-checking stabilizes user behavior by preventing false information from taking over. A more trustworthy information flow is ensured by fact-checking systems, which not only lower the overall number of forwarding users but also tip the population balance in favor of fact-checked people. These results corroborate earlier research showing how credibility verification can effectively reduce the spread of false information (Porter and Wood, 2021).
The disproportionate impact of contentious or emotionally charged misinformation, as seen in Scenario 3, is a significant finding of this study. In all models, this scenario had the largest percentage of forwarding users, demonstrating the potent influence of content that is contentious and emotionally charged in spreading false information. In line with earlier research showing that emotionally charged content tends to spread more broadly on social media sites, our findings support the necessity for focused interventions, such as giving moderation of highly emotional or divisive content top priority (Chen et al., 2015).
Lastly, the study emphasizes how useful user awareness tools like the “forwarded many times” signal are. This feature plays a dual role in mitigating misinformation: it not only raises user awareness to persuade individuals to cease sharing false information—especially when the content is less trustworthy or emotionally charged (e.g., Scenarios 1, 4, and 6)—but also introduces technical restrictions that directly reduce forwarding capacity. On platforms like WhatsApp, once a message is labeled as “forwarded many times,” users are limited to forwarding it to only one chat at a time, significantly increasing the friction of propagation. Therefore, the alert acts through both psychological mechanisms—encouraging users to reconsider forwarding—and platform-enforced technical barriers that slow dissemination. This dual mechanism is captured in our model through the stop-forwarding probability parameter p (representing behavioral responses) and the alert rate γ (representing exposure to moderation signals), aligning with empirical evidence on the alert's efficacy. Taken together, these findings show that trustworthiness-enhancing technologies can greatly slow the spread of false information, making them a crucial component of any comprehensive strategy to counteract misinformation. When considered holistically, these insights provide platform designers and policymakers with a solid basis for developing effective, scalable interventions to combat disinformation across diverse social media environments (Amazeen and Muddiman, 2018).
Beyond the technical and behavioral insights, this study raises important ethical and policy questions, especially regarding the simulation of misinformation dynamics and the role of generative AI. While modeling the spread of misinformation is vital for understanding and mitigating its impact, there is a risk that such simulations may inadvertently reveal mechanisms that could be exploited by malicious actors. For example, by exposing how emotional amplitude or learning rates influence forwarding behavior, bad-faith agents might tailor misinformation to maximize virality (Achuthan et al., 2025). This dual-use dilemma—where tools designed for protective purposes can also be weaponized—necessitates ethical guardrails in both publication and platform implementation (Boyd and Crawford, 2012).
Moreover, the use of generative AI in misinformation modeling introduces additional concerns related to algorithmic amplification and synthetic content generation. Policymakers must grapple with the fact that AI systems can both spread and detect misinformation, sometimes simultaneously. This paradox highlights the urgent need for governance frameworks that ensure transparency in AI behavior, accountability in design, and safeguards against misuse (Raman et al., 2023). In particular, regulatory approaches should address the deployment of AI systems capable of learning from and adapting to user behavior in real time, as such features raise profound questions about manipulation, autonomy, and digital consent (Brundage et al., 2018; Raman et al., 2025). Integrating ethical foresight into misinformation modeling can help anticipate misuse and guide the development of responsible AI tools that serve the public good.
While our models are grounded in classical epidemiological frameworks, the specific compartmentalization into As (users who stop forwarding after awareness) and Ac (users who continue forwarding despite awareness) represents a behavioral refinement that introduces qualitatively new insights. Unlike previous models that assume uniform reaction to awareness interventions (Rai et al., 2025), our split enables analysis of differential user compliance—capturing, for instance, how platform labeling may inadvertently reinforce belief or spread among skeptical users. This fine-grained structure mirrors real-world digital behavior more closely, where not all users respond to fact-checks or labels similarly.
Furthermore, our GIFS model introduces a dynamic feedback loop in which AI-generated misinformation adapts to user forwarding behavior, modeling an evolving misinformation ecosystem. This responsive AI mechanism—where the model learns from user behavior and adjusts its output—has not been widely explored in existing compartmental rumor or fake news models, and it underscores the compounding risk posed by generative AI in real-time social systems.
7 Limitations and future work
While the proposed ASM, EM, and GIFS models provide a versatile framework to explore the theoretical dynamics of misinformation spread, several limitations merit further discussion.
First, our models assume a well-mixed population, where all users are equally likely to interact—an assumption that neglects explicit network structure. In reality, social media interactions are governed by complex network topologies such as scale-free, small-world, or community-based graphs. While we conceptually acknowledge the role of network effects, incorporating explicit network structure in future extensions would allow us to better capture clustering, peer reinforcement, and echo chambers—factors that strongly influence the propagation of misinformation.
Second, the transition rates in our current framework are held constant within each scenario. This design allows us to isolate the effects of specific parameters across comparative conditions; however, it does not capture dynamic shifts in behavior or the impact of external events (e.g., news cycles, real-time platform interventions, or content moderation policies). A natural extension would involve introducing time-varying transition rates or exogenous shocks to simulate event-driven behavior and adaptive user responses.
Third, in the GIFS model, the role of generative AI is captured through a dynamic variable M(t), which evolves in response to the number of forwarding users, and a time-dependent influence coefficient α2(t) that models the adaptive nature of AI systems. This formulation introduces a basic feedback mechanism, allowing the AI's influence to grow over time as it “learns” from user behavior. While this represents an important step toward modeling adaptive misinformation dynamics, the framework still simplifies the multifaceted nature of generative AI. Future work could extend this component to account for specific AI capabilities such as content generation speed, realism or deception potential, targeting specificity, and platform evasion tactics. Incorporating these mechanisms would enable more faithful simulation of advanced strategies like microtargeting, hyper-realistic misinformation synthesis, and adversarial adaptation to moderation efforts.
Additionally, while our stability analysis characterizes the system's long-term behavior, it is important to note that stability does not imply desirability. A system may converge to a stable equilibrium that reflects high levels of misinformation, as observed in Scenario 3 of the GIFS model. Moreover, transient dynamics—particularly peak misinformation levels prior to convergence—can have substantial societal consequences. These short-term behaviors are critical to capture, especially in the presence of rapid amplification mechanisms like generative AI. Future work will further explore how to mitigate undesirable stable states and dampen transient surges.
Moreover, as indicated throughout the manuscript, the current study is analytical and simulation-driven. Empirical validation using real-world data is a critical next step. This would involve calibrating model parameters (e.g., infection rate β, recovery rate δ, fact-checking rate θ) using social media diffusion datasets—such as misinformation cascades from platforms like Twitter, WhatsApp, or Reddit—through parameter estimation techniques like maximum likelihood estimation or nonlinear least squares fitting. Model performance could then be assessed by comparing simulated dynamics to observed data using error metrics such as RMSE or MAPE.
Although the primary objective of this work is to establish a flexible theoretical foundation, we fully recognize the importance of empirical grounding. Future efforts will focus on fitting the models to misinformation spread datasets related to topics like the COVID-19 infodemic, election misinformation, or generative AI-driven deception. Such efforts will enhance both the realism and the predictive capacity of the proposed framework.
8 Summary and conclusions
This study analyzed three models for the spread of misinformation across six distinct scenarios. All models were constructed using systems of differential equations, with scenario-specific parameter sets (Tables 2, 4) capturing different dynamics.
The ASM focused on the spread of misinformation within a single social media platform and categorized users into five types: (1) susceptible, (2) exposed, (3) forwarding users who had not seen the “forwarded many times” message, (4) forwarding users who continued despite seeing the message, and (5) users who stopped forwarding after seeing the message.
The EM extended this framework by incorporating fact-checking users, a second social media platform, and confirmation bias.
The GIFS extended the ASM model by accounting for the generative AI facilitating the spread of the misinformation.
Analytical results revealed that the system of differential equations in all models has a single stable fixed point when the total number of users is constant. The fixed point was stable across all conditions and scenarios analyzed, ensuring predictable and controllable outcomes for the spread of misinformation.
At equilibrium, the smallest proportion of users forwarding misinformation was observed in scenarios 1, 4, and 6. Conversely, the largest proportion of forwarding users was found in scenario 3, where highly emotional or controversial misinformation dominates the population. For all presented models, the population was only dominated by forwarding users in scenario 3, highlighting the significant influence of emotionally charged content.
A comparison between ASM and the case where only one social media platform was considered in EM (Section 4.3) demonstrated that the inclusion of fact-checking users significantly reduces the proportion of forwarding users. This finding emphasizes the effectiveness of fact-checking interventions in mitigating the spread of misinformation.
Comparison between ASM and GIFS demonstrated that involvement of the generative AI can dramatically increase the number of users sharing misinformation. The result emphasizes the importance of developing measures that will counteract or identify the news constructed by generative AI models.
In summary, the results of this study highlight the critical role of platform moderation and fact-checking users in reducing the spread of misinformation. Additionally, they underscore the disproportionate impact of highly emotional or controversial content on the dynamics of misinformation propagation, reinforcing the need for targeted interventions to address such scenarios effectively.
Data availability statement
The original contributions presented in the study are included in the article/Supplementary material, further inquiries can be directed to the corresponding author.
Author contributions
KJ: Conceptualization, Formal analysis, Investigation, Methodology, Validation, Writing – original draft, Writing – review & editing. KA: Project administration, Supervision, Writing – review & editing.
Funding
The author(s) declare that no financial support was received for the research and/or publication of this article.
Conflict of interest
The authors declare that the research was conducted in the absence of any commercial or financial relationships that could be construed as a potential conflict of interest.
Generative AI statement
The author(s) declare that no Gen AI was used in the creation of this manuscript.
Any alternative text (alt text) provided alongside figures in this article has been generated by Frontiers with the support of artificial intelligence and reasonable efforts have been made to ensure accuracy, including review by the authors wherever possible. If you identify any issues, please contact us.
Publisher's note
All claims expressed in this article are solely those of the authors and do not necessarily represent those of their affiliated organizations, or those of the publisher, the editors and the reviewers. Any product that may be evaluated in this article, or claim that may be made by its manufacturer, is not guaranteed or endorsed by the publisher.
Supplementary material
The Supplementary Material for this article can be found online at: https://www.frontiersin.org/articles/10.3389/fcomp.2025.1570085/full#supplementary-material
References
Achuthan, K., Khobragade, S., and Kowalski, R. (2025). Cybercrime through the public lens: a longitudinal analysis. Humanit. Soc. Sci. Commun. 12, 1–16. doi: 10.1057/s41599-025-04459-x
Alkaissi, H., and McFarlane, B. (2023). Generative artificial intelligence: a systematic review and research agenda. Multimed. Tools Appl. 82, 36141–36170.
Amazeen, M. A., and Muddiman, A. R. (2018). Saving media or trading on trust? The effects of corrective and amplified news on beliefs and trust in news. Journal. Mass Commun. Q. 95, 1043–1064.
Bakshy, E., Messing, S., and Adamic, L. A. (2015). Exposure to ideologically diverse news and opinion on Facebook. Science 348, 1130–1132. doi: 10.1126/science.aaa1160
Bellman, R. (2008). Stability Theory of Differential Equations. North Chelmsford, MA: Courier Corporation.
Bettencourt, L. M., Cintrón-Arias, A., Kaiser, D. I., and Castillo-Chávez, C. (2006). The power of a good idea: quantitative modeling of the spread of ideas from epidemiological models. Phys. A 364, 513–536. doi: 10.1016/j.physa.2005.08.083
Blower, S. M., and Dowlatabadi, H. (1994). Sensitivity and uncertainty analysis of complex models of disease transmission: an HIV model, as an example. Int. Stat. Rev. 62, 229–243. doi: 10.2307/1403510
Boyd, D., and Crawford, K. (2012). Critical questions for big data: provocations for a cultural, technological, and scholarly phenomenon. Inf. Commun. Soc. 15, 662–679. doi: 10.1080/1369118X.2012.678878
Brady, W. J., Wills, J. A., Jost, J. T., Tucker, J. A., and Van Bavel, J. J. (2017). Emotion shapes the diffusion of moralized content in social networks. Proc. Nat. Acad. Sci. 114, 7313–7318. doi: 10.1073/pnas.1618923114
Breda, D., Diekmann, O., De Graaf, W., Pugliese, A., and Vermiglio, R. (2012). On the formulation of epidemic models (an appraisal of Kermack and Mckendrick). J. Biol. Dyn. 6, 103–117. doi: 10.1080/17513758.2012.716454
Britton, T. (2010). Stochastic epidemic models: a survey. Math. Biosci. 225, 24–35. doi: 10.1016/j.mbs.2010.01.006
Brundage, M., Avin, S., Clark, J., Toner, H., Eckersley, P., Garfinkel, B., et al. (2018). The malicious use of artificial intelligence: forecasting, prevention, and mitigation. arXiv [preprint]. arXiv:1802.7228. doi: 10.48550/arXiv:1802.7228
Butcher, J. C. (2008). Numerical Methods for Ordinary Differential Equations, 2nd Edon. Chichester: John Wiley & Sons. doi: 10.1002/9780470753767
Chen, X., Sin, S.-C. J., Theng, Y.-L., and Lee, C. S. (2015). Why do social media users share misinformation? Proc. Am. Soc. Inf. Sci. Technol. 52, 1–4.
Chesney, R., and Citron, D. K. (2019). Deep fakes: A looming challenge for privacy, democracy, and national security. Calif. Law Rev. 107, 1753–1819. doi: 10.2139/ssrn.3213954
Clayton, K., Blair, S., Busam, J., Forstner, S., Glance, J., Kovvuri, A., et al. (2020). Real solutions for fake news? Measuring the effectiveness of general warnings and fact-check tags in reducing belief in false stories on social media. Polit. Behav. 42, 1073–1095. doi: 10.1007/s11109-019-09533-0
Cotton, D. R. E., Cotton, P. A., and Shipman, L. (2023). Generative AI and the future of higher education: a threat to academic integrity? Int. J. Educ. Technol. High. Educ. 20, 1–16.
Del Vicario, M., Bessi, A., Zollo, F., Petroni, F., Scala, A., Caldarelli, G., et al. (2016). The spreading of misinformation online. Proc. Nat. Acad. Sci. 113, 554–559. doi: 10.1073/pnas.1517441113
Deters, J., Aguiar, I. P., and Feuerborn, J. (2019). The mathematics of gossip. CODEE J. 12, 73–82. doi: 10.5642/codee.201912.01.07
Friggeri, A., Adamic, L. A., Eckles, D., and Cheng, J. M. (2014). “Rumor cascades,” in Proceedings of the Eighth International Conference on Weblogs and Social Media (ICWSM) (AAAI), 101–110. doi: 10.1609/icwsm.v8i1.14559
Govindankutty, S., and Gopalan, S. P. (2024). Epidemic modeling for misinformation spread in digital networks through a social intelligence approach. Sci. Rep. 14:19100. doi: 10.1038/s41598-024-69657-0
Islam, M. S., Sarkar, T., Khan, S. H., Kamal, A.-H. M., Hasan, S. M. M., Kabir, A., et al. (2020). COVID-19–related infodemic and its impact on public health: a global social media analysis. Am. J. Trop. Med. Hyg. 103, 1621–1629. doi: 10.4269/ajtmh.20-0812
Jiang, W., Chen, T., Gao, X., Zhang, W., Cui, L., Yin, H., et al. (2025). “Epidemiology-informed network for robust rumor detection,” in Proceedings of the ACM on Web Conference 2025 (New York, NY: ACM), 3618–3627. doi: 10.1145/3696410.3714610
Lazer, D. M. J., Baum, M. A., Benkler, Y., Berinsky, A. J., Greenhill, K. M., Menczer, F., et al. (2018). The science of fake news. Science 359, 1094–1096. doi: 10.1126/science.aao2998
Lewandowsky, S., Ecker, U. K., and Cook, J. (2017). Beyond misinformation: understanding and coping with the “post-truth” era. J. Appl. Res. Mem. Cogn. 6, 353–369. doi: 10.1016/j.jarmac.2017.07.008
Lewandowsky, S. UK, E., CM, S., and N, S. J. C. (2012). Misinformation and its correction: continued influence and successful debiasing. Psychol. Sci. Public Interest. 13, 106–31. doi: 10.1177/1529100612451018
Li, F., and Yang, Y. (2024). Impact of artificial intelligence-generated content labels on perceived accuracy, message credibility, and sharing intentions for misinformation: web-based experiment. JMIR Form. Res. 8:e60024. doi: 10.2196/60024
Linden, S. V., Anthony, L., Seth, R., and Edward, M. (2017). Inoculating the public against misinformation about climate change. Glob. Chall. 1:1600008. doi: 10.1002/gch2.201600008
Maleki, M., Mead, E., Arani, M., and Agarwal, N. (2021). Using an epidemiological model to study the spread of misinformation during the black lives matter movement. arXiv [Preprint]. arXiv:2103.12191. doi: 10.48550/arXiv.2103.12191
Marchal, N., Kollanyi, B., and Howard, P. N. (2019). Bots and Online Disinformation: A Guide to Understanding Automated Propaganda and Social Media Manipulation. Technical report, Oxford Internet Institute.
Marino, S., Hogue, I. B., Ray, C. J., and Kirschner, D. E. (2008). A methodology for performing global uncertainty and sensitivity analysis in systems biology. J. Theor. Biol. 254, 178–196. doi: 10.1016/j.jtbi.2008.04.011
Ojha, R. P., Srivastava, P. K., Awasthi, S., Srivastava, V., Pandey, P. S., Dwivedi, R. S., et al. (2023). Controlling of fake information dissemination in online social networks: an epidemiological approach. IEEE Access 11, 32229–32240. doi: 10.1109/ACCESS.2023.3262737
Pennycook, G., Bear, A., Collins, E. T., and Rand, D. G. (2020). The implied truth effect: attaching warnings to a subset of fake news headlinges increases perceived accuracy of headlines without warnings. Manage. Sci. 66, 4944–4957. doi: 10.1287/mnsc.2019.3478
Pennycook, G., Cannon, T. D., and Rand, D. G. (2018). Prior exposure increases perceived accuracy of fake news. J. Exp. Psychol. Gen. 147, 1865–1880. doi: 10.1037/xge0000465
Pennycook, G., and Rand, D. (2019). Fighting misinformation on social media using crowdsourced judgments of news source quality. Proc. Nat. Acad. Sci., 116, 2521–2526. doi: 10.1073/pnas.1806781116
Porter, E., and Wood, T. J. (2021). The global effectiveness of fact-checking: evidence from simultaneous experiments in Argentina, Nigeria, south africa, and the united kingdom. Proc. Nat. Acad. Sci. 118:e2104235118. doi: 10.1073/pnas.2104235118
Rai, R., Sharma, R., and Meena, C. (2025). IPSR model: Misinformation intervention through prebunking in social systems. arXiv [Preprint]. arXiv:2502.12740. doi: 10.48550/arXiv.2502.12740
Raman, R., Kowalski, R., Achuthan, K., Iyer, A., and Nedungadi, P. (2025). Navigating artificial general intelligence development: societal, technological, ethical, and brain-inspired pathways. Sci. Rep. 15, 1–22. doi: 10.1038/s41598-025-92190-7
Raman, R., Nair, V. K., Nedungadi, P., Ray, I., and Achuthan, K. (2023). Darkweb research: past, present, and future trends and mapping to sustainable development goals. Heliyon 9:e22269. doi: 10.1016/j.heliyon.2023.e22269
Raman, R., Nair, V. K., Nedungadi, P., Sahu, A. K., Kowalski, R., Ramanathan, S., et al. (2024). Fake news research trends, linkages to generative artificial intelligence and sustainable development goals. Heliyon 10:e24727. doi: 10.1016/j.heliyon.2024.e24727
Raponi, S., Khalifa, Z., Oligeri, G., and Pietro, D. i. R. (2022). Fake news propagation: a review of epidemic models, datasets, and insights. ACM Trans. Web 16, 1–34. doi: 10.1145/3522756
Shao, C., Ciampaglia, G., Varol, O., Yang, K. C., Flammini, A., and Menczer, F. (2017). The spread of low-credibility content by social bots. arXiv [Preprint]. arXiv:1707.07592. doi: 10.48550/arXiv.1707.07592
Stewart, K. (2021). Detecting fake news: two problems for content moderation. Yale J. Law Technol. 23, 1–35. doi: 10.1007/s13347-021-00442-x
Syed, N. (2017). Real talk about fake news: towards a better theory for platform governance. Yale Law J. Forum 127, 337–357.
Tambuscio, M., Ruffo, G., Flammini, A., and Menczer, F. (2015). “Fact-checking effect on viral hoaxes: a model of misinformation spread in social networks,” in Proceedings of the 24th International Conference on World Wide Web (New York, NY: Association for Computing Machinery), 977–982. doi: 10.1145/2740908.2742572
The MathWorks Inc.. (2024). MATLAB R2024a. Natick, MA: The MathWorks Inc. Available online at: https://www.mathworks.com (Accessed January 5, 2025).
Vosoughi, S., Roy, D., and Aral, S. (2018). The spread of true and false news online. Science 359, 1146–1151. doi: 10.1126/science.aap9559
Walter, N., Cohen, J., Holbert, R. L., and Morag, Y. (2019). Fact-checking: a meta-analysis of what works and for whom. Polit. Commun. 37, 350–375. doi: 10.1080/10584609.2019.1668894
Wang, K., Yaqub, W., Lakhdari, A., and Suleiman, B. (2021). Combating fake news by empowering fact-checked news spread via topology-based interventions. arXiv [Preprint]. arXiv:2107.05016. doi: 10.48550/arXiv.2107.05016
Xiong, F., Liu, Y., Zhang, Z.-j., Zhu, J., and Zhang, Y. (2012). An information diffusion model based on retweeting mechanism for online social media. Phys. Lett. A 376, 2103–2108. doi: 10.1016/j.physleta.2012.05.021
Zellers, R., Holtzman, A., Rashkin, H., Bisk, Y., Farhadi, A., Roesner, F., et al. (2019). “Defending against neural fake news,” in Advances in Neural Information Processing Systems.
Zhao, L., Wang, J., Chen, Y., Wang, Q., Cheng, J., Cui, H., et al. (2012). SIHR rumor spreading model in social networks. Phys. A 391, 2444–2453. doi: 10.1016/j.physa.2011.12.008
Zhu, H., and Ma, J. (2019). Analysis of Shir rumor propagation in random heterogeneous networks with dynamic friendships. Phys. A 513, 257–271. doi: 10.1016/j.physa.2018.09.015
Keywords: misinformation, differential equations, stability analysis, math modeling, linear stability analysis, numerical simulation
Citation: Jain K and Achuthan K (2025) Modeling the dynamics of misinformation spread: a multi-scenario analysis incorporating user awareness and generative AI impact. Front. Comput. Sci. 7:1570085. doi: 10.3389/fcomp.2025.1570085
Received: 02 February 2025; Accepted: 14 August 2025;
Published: 03 October 2025.
Edited by:
Shahzad Ashraf, DHA Suffa University, PakistanReviewed by:
Maikel Lázaro Pérez Gort, Ca' Foscari University of Venice, ItalyMyles Joshua Toledo Tan, University of Florida, United States
Copyright © 2025 Jain and Achuthan. This is an open-access article distributed under the terms of the Creative Commons Attribution License (CC BY). The use, distribution or reproduction in other forums is permitted, provided the original author(s) and the copyright owner(s) are credited and that the original publication in this journal is cited, in accordance with accepted academic practice. No use, distribution or reproduction is permitted which does not comply with these terms.
*Correspondence: Kurunandan Jain, a3VydW5hbmRhbmpAYW0uYW1yaXRhLmVkdQ==