 Gary Tse1,2*
 Ka Hou Christien Li1,2,3Guangping Li4
 Tong Liu4
 George Bazoukis5Wing Tak Wong6Matthew T. V. Chan7Martin C. S. Wong8Yunlong Xia9
 Konstantinos P. Letsas5Gary Chin Pang Chan1Yat Sun Chan1
 William K. K. Wu2,7*
- 1Department of Medicine and Therapeutics, Faculty of Medicine, Chinese University of Hong Kong, Hong Kong, China
- 2Li Ka Shing Institute of Health Sciences, Faculty of Medicine, Chinese University of Hong Kong, Hong Kong, China
- 3Faculty of Medicine, Newcastle University, Newcastle upon Tyne, United Kingdom
- 4Tianjin Key Laboratory of Ionic-Molecular Function of Cardiovascular Disease, Department of Cardiology, Tianjin Institute of Cardiology, Second Hospital of Tianjin Medical University, Tianjin, China
- 5Laboratory of Cardiac Electrophysiology, Second Department of Cardiology, Evangelismos General Hospital of Athens, Athens, Greece
- 6School of Life Sciences, The Chinese University of Hong Kong, Hong Kong, China
- 7Department of Anaesthesia and Intensive Care, The Chinese University of Hong Kong, Hong Kong, China
- 8The Jockey Club School of Public Health and Primary Care, The Chinese University of Hong Kong, Hong Kong, China
- 9Department of Cardiology, First Affiliated Hospital of Dalian Medical University, Dalian, China
Background: Brugada syndrome (BrS) is a cardiac ion channelopathy that predisposes affected individuals to sudden cardiac death (SCD). Type 1 BrS is thought to take a more malignant clinical course than non-type 1 BrS. We hypothesized that the degrees of abnormal repolarization and conduction are greater in type 1 subjects and these differences can be detected by electrocardiography (ECG).
Methods: Electrocardiographic data from spontaneous type 1 and non-type 1 BrS patients were analyzed. ECG parameters were measured from leads V1 to V3. Values were expressed as median [lower quartile-upper quartile] and compared using Kruskal-Wallis ANOVA.
Results: Compared to non-type 1 BrS patients (n = 29), patients with spontaneous type 1 patterns (n = 22) showed similar (P > 0.05) heart rate (73 [64–77] vs. 68 [62–80] bpm), QRS duration (136 [124–161] vs. 127 [117–144] ms), uncorrected QT (418 [393–443] vs. 402 [386–424] ms) and corrected QT intervals (457 [414–474] vs. 430 [417–457] ms), JTpeak intervals (174 [144–183] vs. 174 [150–188] ms), Tpeak− Tend intervals (101 [93–120] vs. 99 [90–105] ms), Tpeak− Tend/QT ratios (0.25 [0.23–0.27] vs. 0.24 [0.22–0.27]), Tpeak− Tend/QRS (0.77 [0.62–0.87] vs. 0.77 [0.69–0.86]), Tpeak− Tend/(QRS × QT) (0.00074 [0.00034–0.00096] vs. 0.00073 [0.00048–0.00012] ms−1), index of Cardiac Electrophysiological Balance (iCEB, QT/QRS, marker of wavelength: 3.14 [2.56–3.35] vs. 3.21 [2.85–3.46]) and corrected iCEB (QTc/QRS: 3.25 [2.91–3.73] vs. 3.49 [2.99–3.78]). Higher QRS dispersion was seen in type 1 subjects (QRSd: 34 [24–66] vs. 24 [12–34] ms) but QT dispersion (QTd: 48 [39–71] vs. 43 [22–94] ms), QTc dispersion (QTcd: 52 [41–79] vs. 46 [23–104] ms), JTpeak dispersion (44 [23–62] vs. 45 [30–62] ms), Tpeak− Tend dispersion (28 [15–34] vs. 29 [22–53] ms) or Tpeak− Tend/QT dispersion (0.06 [0.03–0.08] vs. 0.08 [0.04–0.12]) did not differ between the two groups. Type 1 subjects showed higher (QRSd × Tpeak− Tend)/QRS (25 [19–44] vs. 19 [9–30] ms) but similar iCEB dispersion (0.83 [0.49–1.14] vs. 0.61 [0.34–0.92]) and iCEBc dispersion (0.93 [0.51–1.15] vs. 0.65 [0.39–0.96]).
Conclusion: Higher levels of dispersion in conduction and repolarization are found in type 1 than non-type 1 BrS patients, potentially explaining the higher incidence of ventricular arrhythmias in the former group.
Introduction
Brugada syndrome (BrS) is a cardiac ion channelopathy that predisposes affected individuals to ventricular tachyarrhythmias and sudden cardiac death (SCD). Type 1 BrS is thought to take a more malignant clinical course than non-type 1 BrS (1). Abnormalities in both conduction and repolarization processes contribute to ventricular tachyarrhythmias in BrS (2). For instance, slow and discontinuous conduction of action potentials through working myocardium, due to reduced sodium channel activity, may lead to higher degrees of spatial and temporal dispersion in conduction (3). These could potentially be detected as prolonged QRS intervals (4) and higher QRS dispersion (5). Moreover, heterogeneous time-course in full repolarization between the different myocardial layers, due to regional difference in transient outward potassium channel activity, leads to increased transmural repolarization gradients that can be measured electrographically using QT dispersion (QTd) (6, 7), interval from the peak to the end of the T-wave (8) [Tpeak – Tend, reflecting transmural dispersion of repolarization, TDR (9)], (Tpeak – Tend)/QT ratio (10, 11) and Tpeak – Tend dispersion. However, the present electrocardiographic indices do not incorporate parameters on dispersion and these may play important roles in producing the reentrant substrate for arrhythmogenesis (12). In this study, we hypothesized that the degree of abnormal repolarization and conduction is greater in spontaneous type 1 subjects and these differences can be detected by electrocardiographic indices incorporating spatial dispersion of conduction and repolarization.
Methods
Study Subjects
This retrospective study received ethics approval from the NTEC-CUHK Clinical Research Ethics Committee. Inclusion criteria include subjects diagnosed with Brugada Syndrome presented to the Prince of Wales Hospital, a tertiary level teaching hospital in Hong Kong, China. Age, sex, type of Brugada pattern (spontaneous type 1 or otherwise), syncopal symptoms and spontaneous VT or VF were recorded.
Electrocardiographic Measurements
The following parameters were obtained from 12-lead electrocardiograms of spontaneous type 1 (Data Sheet 1) and non-type 1 (Data Sheet 2) Brugada subjects. Measurements were made from the right precordial leads (V1–V3) with mean values calculated. They were measured together by GT and CL using Phillips ECGVue (Standard Edition). The first ten measurements were validated by clinical electrophysiologists of our centers (KPL and JC). The end of the T-wave was determined using the return to the baseline method. Dispersion was defined as the difference between the maximum and minimum value detected from V1 to V3.
Repolarization parameters including QT interval (onset of the QRS complex to the end of the T wave at T-P baseline; If U waves are present, the QT interval will be taken to the nadir of the curve between the T and U waves), QTc (correction using Bazett's formula), QT dispersion, Tpeak – Tend (peak of T-wave to end of T-wave), Tpeak – Tend dispersion, Tpeak – Tend/QT ratio, Tpeak – Tend/QT dispersion, and JTpeak (J point to peak of T-wave), and JTpeak dispersion. Conduction parameters include QRS duration (onset of Q-wave to the terminal portion of S-wave) and QRS dispersion. Conduction-repolarization indices include index of Cardiac Electrophysiological Balance (iCEB, QT/QRS, a surrogate marker of excitation wavelength), iCEBc (QTc/QRS), their dispersion parameters, (Tpeak – Tend)/QRS, Tpeak – Tend/(QT × QRS) and QRSd × (Tpeak – Tend)/QRS.
Statistical Analysis
Data were expressed as median [lower quartile to upper quartile]. Categorical data were analyzed by Fisher's exact test. Differences between study groups were tested using Kruskal-Wallis ANOVA. P < 0.05 was considered statistically significant.
Results
Clinical Characteristics
This study included a total of 51 Brugada syndrome patients. The baseline demographic and clinical characteristics are shown in Table 1. The mean age was 56 ± 2 years and 90% of the subjects were male. A type 1 pattern was observed in 22 patients (43%) and a non-type 1 pattern was observed in 29 patients (57%). Implantable cardioverter-defibrillators were inserted in 21 (71%) subjects. 25 (49%) subjects had syncope, and spontaneous VT was observed in 7 patients. Compared to non-type 1 subjects, type 1 subjects were more likely to have ICD implanted (68 vs. 21%, P = 0.0005) and suffer from syncope (68 vs. 34%, P = 0.02). However, no difference in age, appropriate ICD shocks or spontaneous VT was observed between the groups (P > 0.05). Resting heart rate was similar between type 1 and non-type 1 subjects (73 [64–77] vs. 68 [62–80] bpm, respectively; P = 0.78). The different electrocardiographic parameters were measured from the precordial leads V1–V3 and mean values were calculated. Dispersion was defined as the difference in the maximum and minimum values observed in leads V1–V3. Example screenshots of the ECG measurement system, a spontaneous Type 1 Brugada pattern and non-Type 1 Brugada pattern are shown in Figures 1A–C, respectively. The positions of the onset of the QRS complex and the end of the T-wave are represented by the vertical lines.
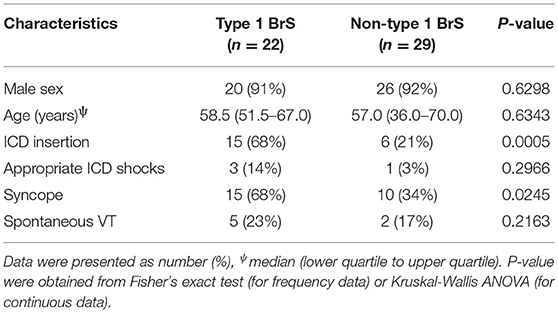
Table 1. Demographic and clinical characteristics of Brugada syndrome patients included in this study (n = 51).
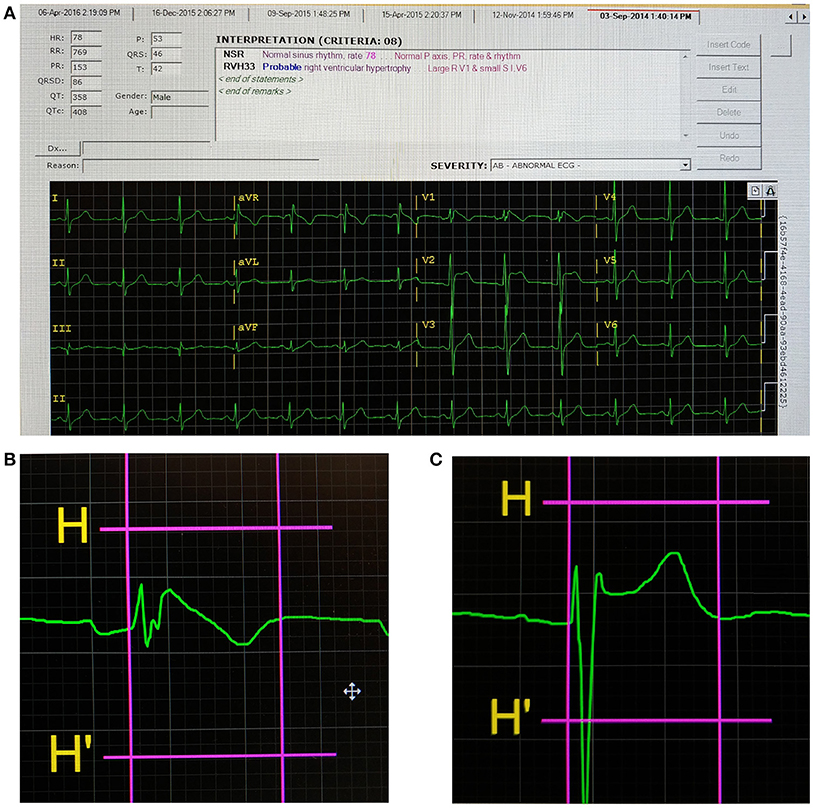
Figure 1. Screenshot of the ECG analysis program (A), a Type 1 Brugada pattern (B), and non-Type 1 Brugada pattern (C). The first and second vertical lines indicate the onset of the QRS complex and end of the T-wave, respectively, for (B,C).
Traditional Conduction or Repolarization Markers: QRS, QT, QTc, and JTPeak Intervals
Compared to non-type 1 BrS subjects, those with type 1 BrS had statistically indistinguishable QRS duration (136 [124–161] vs. 127 [117–144] ms; P = 0.14; Figure 2A), uncorrected QT (418 [393–443] vs. 402 [386–424] ms; P = 0.17; Figure 2B) and corrected QT intervals using Bazett's formula (457 [414–474] vs. 430 [417–457] ms; P = 0.15; Figure 2C). Moreover, JTpeak intervals, which are useful for assessing repolarization duration in the context of slowed ventricular conduction (13), were not significantly different between type 1 and non-type 1 BrS patients (174 [144–183] vs. 174 [150–188] ms; P = 0.52; Figure 2D).
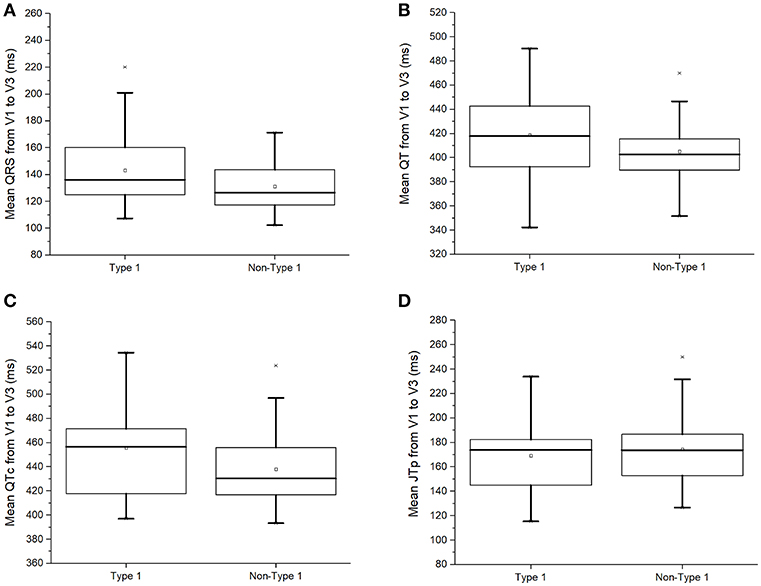
Figure 2. QRS duration (A), uncorrected QT interval (B), corrected QT interval (C), or JTpeak interval (D) in type 1 and non-type 1 Brugada syndrome patients.
Markers of Repolarization or Conduction Dispersion
The conduction dispersion marker, QRS dispersion, was significantly higher in type 1 subjects (QRSd: 34 [24–66] vs. 24 [12–34] ms; P = 0.03; Figure 3A). By contrast, the repolarization dispersion markers, QT dispersion (QTd: 48 [39–71] vs. 43 [22–94] ms; P = 0.98 Figure 3B), QTc dispersion (QTcd: 52 [41–79] vs. 46 [23–104] ms; P = 0.98; Figure 3C), JTpeak dispersion (44 [23–62] vs. 45 [30–62] ms; P = 0.77; Figure 3D) were statistically indistinguishable between both groups.
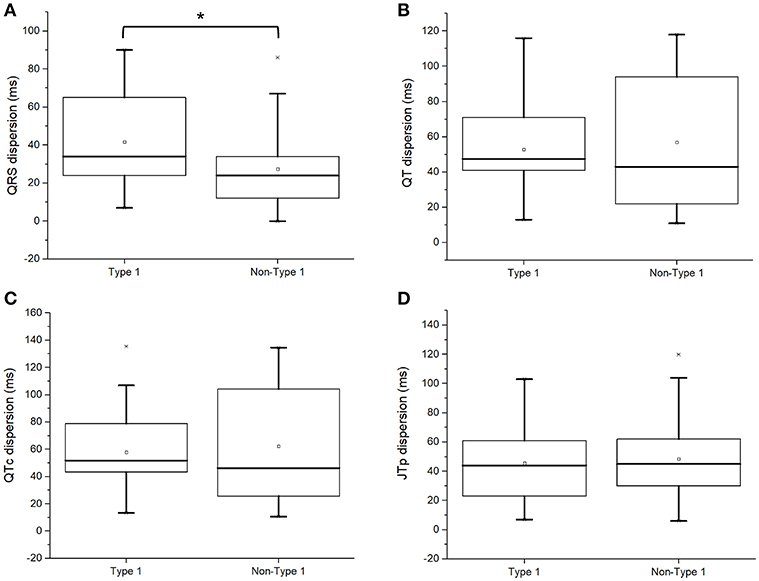
Figure 3. QRS dispersion (A), uncorrected QT dispersion (B), corrected QT dispersion (C), or JTpeak dispersion (D) in type 1 and non-type 1 Brugada syndrome patients. *Denotes significant difference between the two groups.
Moreover, Tpeak− Tend indices reflecting global or transmural dispersion of repolarization were studied. Tpeak− Tend intervals (101 [93–120] vs. 99 [90–105] ms; P = 0.28; Figure 4A), Tpeak− Tend dispersion (28 [15–34] vs. 29 [22–53] ms; P = 0.18; Figure 4B), Tpeak− Tend/QT ratios (0.25 [0.23–0.27] vs. 0.24 [0.22–0.27]; P = 0.56; Figure 4C), or Tpeak− Tend/QT dispersion (0.06 [0.03–0.08] vs. 0.08 [0.04–0.12]; P = 0.09; Figure 4D) did not differ between both groups.
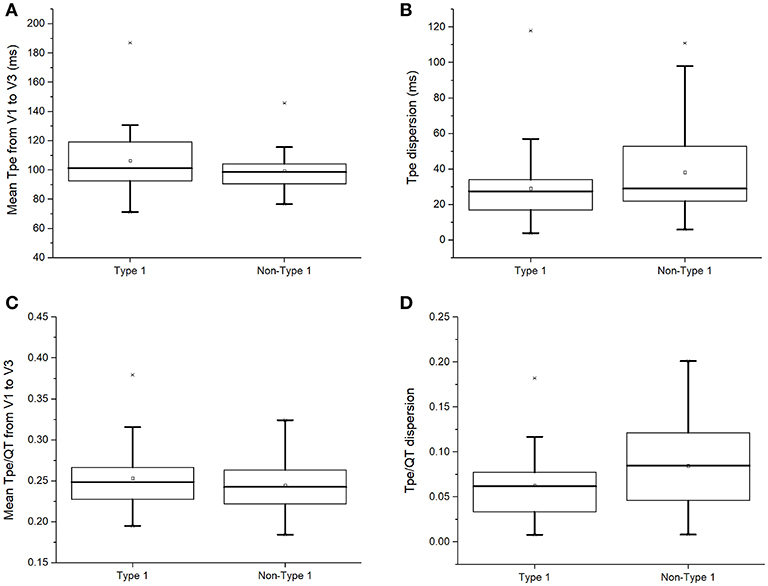
Figure 4. Tpeak− Tend intervals (A), Tpeak− Tend dispersion (B), Tpeak− Tend/QT ratios (C), or Tpeak− Tend/QT dispersion (D) in type 1 and non-type 1 Brugada syndrome patients.
Markers of Excitation Wavelength and Indices Incorporating Conduction and Repolarization Dispersion
Recently, the index of Cardiac Electrophysiological Balance (iCEB, QT/QRS) was proposed as a marker of excitation wavelength (14, 15). However, iCEB (3.14 [2.56–3.35] vs. 3.21 [2.85–3.46]; P = 0.45; Figure 5A) or iCEB corrected for heart rate (QTc/QRS: 3.25 [2.91–3.73] vs. 3.49 [2.99–3.78]; P = 0.48; Figure 5B) did not significantly differ between type 1 and non-type 1 BrS patients. Moreover, markers incorporating both repolarization and conduction dispersion, such as (Tpeak – Tend)/QRS, Tpeak – Tend/(QT × QRS) and QRSd × (Tpeak – Tend)/QRS were proposed for risk stratification (16, 17). However, type 1 and non-type 1 BrS patients showed similar Tpeak− Tend/QRS (0.77 [0.62–0.87] vs. 0.77 [0.69–0.86]; P = 0.89; Figure 5C) and Tpeak− Tend/(QRS × QT) (0.00074 [0.00034–0.00096] vs. 0.00073 [0.00048–0.00012] ms−1; P = 0.44; Figure 5D).
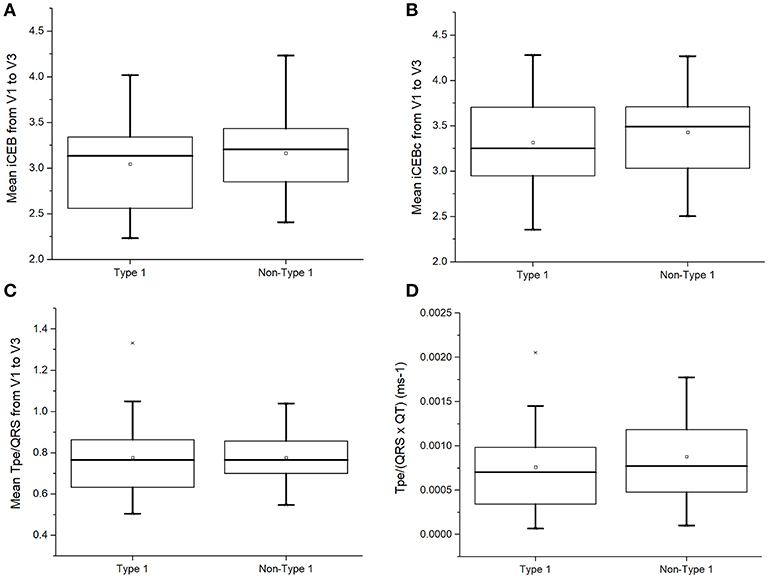
Figure 5. Index of Cardiac Electrophysiological Balance (iCEB, QT/QRS) (A), iCEB corrected for heart rate (QTc/QRS) (B), Tpeak− Tend/QRS (C), or Tpeak− Tend/(QRS × QT) (D) in type 1 and non-type 1 Brugada syndrome patients.
In this study, we calculated dispersion of iCEB and iCEBc for the first time. This is based on the physiological findings that reentrant tachycardia may be due to higher spatial dispersion of excitation wavelength, which can predispose to unidirectional conduction block and reentry (18). Moreover, we quantified (QRSd × Tpeak− Tend)/QRS for the first time, a parameter combining both dispersion of conduction and of repolarization. The present analysis found that type 1 BrS patients showed statistically indistinguishable iCEB dispersion (0.83 [0.49–1.14] vs. 0.61 [0.34–0.92]; P = 0.09; Figure 6A), iCEBc dispersion (0.93 [0.51–1.15] vs. 0.65 [0.39–0.96]; P = 0.08; Figure 6B) but significantly higher mean (QRSd × Tpeak− Tend)/QRS (25 [19–44] vs. 19 [9–30] ms; P = 0.03; Figure 6C) compared to non-type 1 subjects.
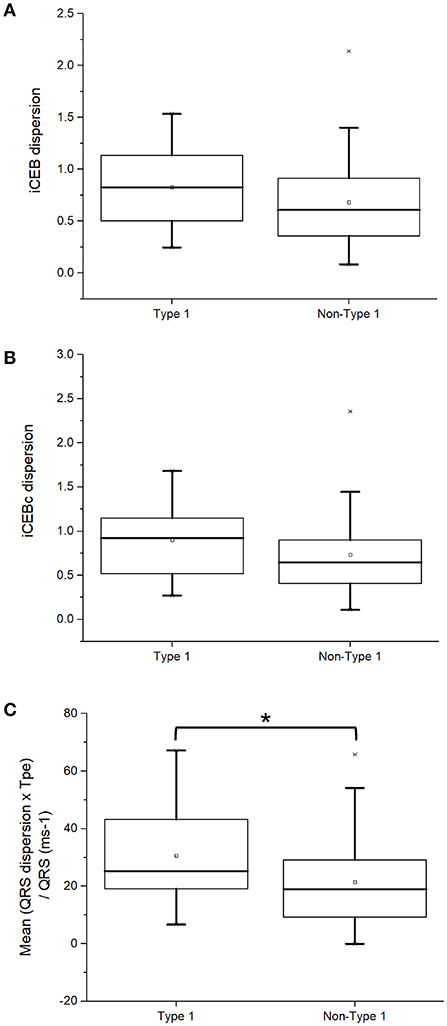
Figure 6. iCEB dispersion (A), iCEBc dispersion (B), or (QRSd × Tpeak− Tend)/QRS (C) in type 1 and non-type 1 Brugada syndrome patients. *Denotes significant difference between the two groups.
Discussion
The most important findings of this study are that parameters that measured the dispersion of conduction, repolarization or both processes across the three precordial leads, V1–V3, can distinguish patients with spontaneous type 1 Brugada from those with non-type 1 Brugada patterns. By contrast, the same parameters measured from a single lead only or their mean values were not significantly different between both groups.
Sudden cardiac death (SCD), frequently due to ventricular tachyarrhythmias, is a significant problem globally (19). Patients with Brugada syndrome (BrS) have an increased risk of developing SCD (20, 21). However, it remains difficult to identify patients at the highest risk for developing these arrhythmias (22). Those with a type 1 pattern are thought to have higher risk of developing such adverse events compared with those with non-type 1 patterns (23–26). However, some investigators have reported that those with non-type 1 patterns, which can be converted to a type 1 pattern using drug challenge, are also at higher risks of ventricular arrhythmias (27).
Depolarization and Repolarization Hypotheses and Their ECG Markers
Generally, the mechanism of arrhythmogenesis in BrS have been broadly divided into the depolarization and repolarization hypotheses (12, 28–31). The depolarization hypothesis posits that delayed propagation of action potentials through the right ventricular outflow tract, can lead to reduction of excitation wavelength to induce reentry. By contrast, the repolarization hypothesis posits that differences in repolarization time-course either locally or across the myocardial wall, can create electrotonic currents during phase 2 of the cardiac action potential, leading to reentry (32, 33). It is likely that both mechanisms co-exist and contribute to arrhythmogenesis in BrS.
These findings provide insights into the different electrocardiographic markers that can be used for risk stratification (34, 35). Traditionally, repolarization markers such as QT interval (corrected, QTc) have been widely used for this purpose. However they have a low sensitivity and specificity (36), given that ventricular arrhythmias can occur in the presence of a normal or even reduced QT interval (37). By contrast, depolarization or conduction markers such as QRS duration can also predict arrhythmic outcomes in BrS (4, 38).
Wavelength and Dispersion-Based Markers: Traditional and Novel Indices
Given the limitations of the above markers, recent interests have focused on the role of dispersion-based indices (18). Other markers include QT dispersion (QTd) (6, 7), interval from the peak to the end of the T wave (8, 39, 40) [Tpeak – Tend, reflecting transmural dispersion of repolarization, TDR (9)], and (Tpeak – Tend)/QT ratio (10). These markers stemmed from pre-clinical findings that higher spatial dispersion of repolarization can predispose to phase 2 reentry (41, 42). Although individual studies have reported the value for risk stratification, a recent study of 448 patients, which is the largest cohort to date, found no difference in this interval between subjects with VF/SCD and those who were asymptomatic (43). By contrast, QRS dispersion reflects spatial dispersion of CVs, increases in which can lead to unidirectional conduction block and reentry (44). Higher QRS dispersion (5) and increased fragmentation of the QRS complex (45, 46), have been associated with pro-arrhythmic outcomes in BrS patients.
Experiments from animal studies have demonstrated the importance of excitation wavelength, λ, given by the product of CV and refractory period, in determining arrhythmogenicity (47, 48). Thus, a decrease in either parameter reduces the length of the excitation wave, meaning that a higher number of re-entrant circuits can be accommodated in a given volume of myocardial tissue. However, λ must be determined by invasively with electrophysiological testing (49). This prompted Lu and colleagues to propose iCEB, the first electrocardiographic marker that serves as a good approximate of λ (14). This was subsequently shown to be decreased in BrS patients (15). Our study extends these findings by demonstrating that iCEB and iCEBc were similar between type 1 and non-type 1 BrS patients.
Given the observations that dispersion-based markers could provide additional value for arrhythmic risk stratification (36, 50), a number of indices incorporating repolarization and conduction dispersion have been proposed, namely Tpeak – Tend/QRS, Tpeak – Tend/(QT × QRS) and QRSd × Tpeak – Tend/QRS (16, 17). Recently, Robyns and colleagues found that Tpeak – Tend/QRS or Tpeak – Tend/(QT × QRS), like iCEB, were significantly different between control, BrS and long QT syndrome patients (51). However, data from Germany found no difference in either index between asymptomatic and symptomatic BrS patients (52). In our study, we found that both parameters did not significantly differ between type 1 and non-type 1 BrS patients. By contrast, we found significantly higher mean QRSd × Tpeak – Tend/QRS but similar iCEB and iCEBc dispersion parameters in type 1 compared to non-type 1 BrS patients. These findings therefore provide the evidence that higher dispersion of repolarization and conduction are found in type 1 BrS patients, which can potentially explain the higher incidence of ventricular arrhythmias and SCD than non-type 1 patients.
Limitations
Several limitations of this study are recognized. Firstly, this included a small cohort from a single center. These findings therefore need to be explored in larger cohorts. Secondly, this was a retrospective study that did not examine hard endpoints such as arrhythmic or mortality outcomes. It should be noted that our work is hypothesis-generating. Future studies can explore whether these novel dispersion-based electrocardiographic markers are useful for risk stratification in terms of arrhythmic or mortality outcomes.
Conclusions
This study provides electrocardiographic evidence that higher levels of dispersion in conduction and repolarization are found in type 1 than non-type 1 BrS patients. This may potentially explain the higher incidence of ventricular arrhythmias in the former group. Indices reflecting cumulative conduction and repolarization abnormalities may provide additional value for risk stratification.
Author Contributions
GT: study conception, data acquisition, data analysis, statistical analysis, data interpretation, drafting of manuscript, critical revision of manuscript, creation of figures; response to reviewer comments. KHCL: data acquisition. WKKW and KPL: study conception and supervision. YX: revision of manuscript and response to reviewer comments. All authors: data analysis and interpretation, critical revision of manuscript.
Conflict of Interest Statement
The authors declare that the research was conducted in the absence of any commercial or financial relationships that could be construed as a potential conflict of interest.
Acknowledgments
GT is supported by a Clinical Assistant Professorship from the Croucher Foundation of Hong Kong.
Supplementary Material
The Supplementary Material for this article can be found online at: https://www.frontiersin.org/articles/10.3389/fcvm.2018.00132/full#supplementary-material
References
1. Honarbakhsh S, Providencia R, Lambiase PD. Risk stratification in Brugada syndrome: current status and emerging approaches. Arrhythm Electrophysiol Rev. (2018) 7:79–83. doi: 10.15420/aer.2018.2.2
2. Lambiase PD, Ahmed AK, Ciaccio EJ, Brugada R, Lizotte E, Chaubey S, et al. High-density substrate mapping in Brugada syndrome: combined role of conduction and repolarization heterogeneities in arrhythmogenesis. Circulation (2009) 120:106–17, 101–104. doi: 10.1161/CIRCULATIONAHA.108.771401
3. Postema PG, Van Dessel PF, De Bakker JM, Dekker LR, Linnenbank AC, Hoogendijk MG, et al. Slow and discontinuous conduction conspire in Brugada syndrome: a right ventricular mapping and stimulation study. Circ Arrhythm Electrophysiol. (2008) 1:379–86. doi: 10.1161/CIRCEP.108.790543
4. Ohkubo K, Watanabe I, Okumura Y, Ashino S, Kofune M, Nagashima K, et al. Prolonged QRS duration in lead V2 and risk of life-threatening ventricular arrhythmia in patients with Brugada syndrome. Int Heart J. (2011) 52:98–102. doi: 10.1536/ihj.52.98
5. Hunuk B, Mugnai G, De Asmundis C, Velagic V, Saitoh Y, Cioconte G, et al. P2324A novel high risk ECG feature in Brugada syndrome probands: localized QRS prolongation on right precordial leads. Eur Heart J. (2017) 38:ehx502.P2324. doi: 10.1093/eurheartj/ehx502.P2324
6. Linker NJ, Colonna P, Kekwick CA, Till J, Camm AJ, Ward DE. Assessment of QT dispersion in symptomatic patients with congenital long QT syndromes. Am J Cardiol. (1992) 69:634–8. doi: 10.1016/0002-9149(92)90155-R
7. Elming H, Holm E, Jun L, Torp-Pedersen C, Kober L, Kircshoff M, et al. The prognostic value of the QT interval and QT interval dispersion in all-cause and cardiac mortality and morbidity in a population of Danish citizens. Eur Heart J. (1998) 19:1391–400. doi: 10.1053/euhj.1998.1094
8. Xia Y, Liang Y, Kongstad O, Holm M, Olsson B, Yuan S. Tpeak-tend interval as an index of global dispersion of ventricular repolarization: evaluations using monophasic action potential mapping of the epi- and endocardium in swine. J Interv Card Electrophysiol. (2005) 14:79–87. doi: 10.1007/s10840-005-4592-4
9. Gupta P, Patel C, Patel H, Narayanaswamy S, Malhotra B, Green JT, et al. T(p-e)/QT ratio as an index of arrhythmogenesis. J Electrocardiol. (2008) 41:567–74. doi: 10.1016/j.jelectrocard.2008.07.016
10. Castro Hevia J, Antzelevitch C, Tornes Barzaga F, Dorantes Sanchez M, Dorticos Balea F, Zayas Molina R, et al. Tpeak-Tend and Tpeak-Tend dispersion as risk factors for ventricular tachycardia/ventricular fibrillation in patients with the Brugada syndrome. J Am Coll Cardiol. (2006) 47:1828–34. doi: 10.1016/j.jacc.2005.12.049
11. Lambiase PD. Tpeak-Tend interval and Tpeak-Tend/QT ratio as markers of ventricular tachycardia inducibility in subjects with Brugada ECG phenotype. Europace (2010) 12:158–9. doi: 10.1093/europace/eup424
12. Meregalli PG, Wilde AA, Tan HL. Pathophysiological mechanisms of Brugada syndrome: depolarization disorder, repolarization disorder, or more? Cardiovasc Res. (2005) 67:367–78. doi: 10.1016/j.cardiores.2005.03.005
13. Zareba W, Mcnitt S, Polonsky S, Couderc JP. JT interval: What does this interval mean? J Electrocardiol. (2017) 50:748–51. doi: 10.1016/j.jelectrocard.2017.07.019
14. Lu HR, Yan GX, Gallacher DJ. A new biomarker–index of cardiac electrophysiological balance (iCEB)–plays an important role in drug-induced cardiac arrhythmias: beyond QT-prolongation and Torsades de Pointes (TdPs). J Pharmacol Toxicol Methods (2013) 68:250–9. doi: 10.1016/j.vascn.2013.01.003
15. Robyns T, Lu HR, Gallacher DJ, Garweg C, Ector J, Willems R, et al. Evaluation of index of cardio-electrophysiological balance (iCEB) as a new biomarker for the identification of patients at increased arrhythmic risk. Ann Noninvasive Electrocardiol. (2016) 21:294–304. doi: 10.1111/anec.12309
16. Tse G, Wong CW, Gong MQ, Meng L, Letsas KP, Li GP, et al. Meta-analysis of T-wave indices for risk stratification in myocardial infarction. J Geriatr Cardiol. (2017) 14:776–9. doi: 10.11909/j.issn.1671-5411.2017.12.009
17. Tse G, Yan BP. Novel arrhythmic risk markers incorporating QRS dispersion: QRSd x (Tpeak - Tend)/QRS and QRSd x (Tpeak - Tend)/(QT x QRS). Ann Noninvas Electrocardiol. (2017) 22:e12397. doi: 10.1111/anec.12397
18. Robert E, Aya AGM, Coussaye JEDL, Péray P, Juan JM, Brugada J, et al. Dispersion-based reentry: mechanism of initiation of ventricular tachycardia in isolated rabbit hearts. Am J Physiol Heart Circ Physiol. (1999) 276:H413–23. doi: 10.1152/ajpheart.1999.276.2.H413
19. Zipes DP, Wellens HJ. Sudden cardiac death. Circulation (1998) 98:2334–51. doi: 10.1161/01.CIR.98.21.2334
20. Brugada P, Brugada J. Right bundle branch block, persistent ST segment elevation and sudden cardiac death: a distinct clinical and electrocardiographic syndrome. A multicenter report. J Am Coll Cardiol. (1992) 20:1391–6. doi: 10.1016/0735-1097(92)90253-J
21. Brugada J, Brugada R, Brugada P. Determinants of sudden cardiac death in individuals with the electrocardiographic pattern of brugada syndrome and no previous cardiac arrest. Circulation (2003) 108:3092–6. doi: 10.1161/01.CIR.0000104568.13957.4F
22. Tse G, Lai ET, Yeo JM, Yan BP. Electrophysiological mechanisms of Bayés syndrome: insights from clinical and mouse studies. Front Physiol. (2016) 7:88. doi: 10.3389/fphys.2016.00188
23. Priori SG, Wilde AA, Horie M, Cho Y, Behr ER, Berul C, et al. HRS/EHRA/APHRS expert consensus statement on the diagnosis and management of patients with inherited primary arrhythmia syndromes: document endorsed by HRS, EHRA, and APHRS in May 2013 and by ACCF, AHA, PACES, and AEPC in June 2013. Heart Rhythm. (2013) 10:1932–63. doi: 10.1016/j.hrthm.2013.05.014
24. Letsas KP, Liu T, Shao Q, Korantzopoulos P, Giannopoulos G, Vlachos K, et al. Meta-analysis on risk stratification of asymptomatic individuals with the brugada phenotype. Am J Cardiol. (2015) 116:98–103. doi: 10.1016/j.amjcard.2015.03.044
25. Bayoumy A, Gong MQ, Christien Li KH, Wong SH, Wu WK, Li GP, et al. Spontaneous type 1 pattern, ventricular arrhythmias and sudden cardiac death in Brugada syndrome: an updated systematic review and meta-analysis. J Geriatr Cardiol. (2017) 14:639–43. doi: 10.11909/j.issn.1671-5411.2017.10.010
26. Letsas KP, Asvestas D, Baranchuk A, Liu T, Georgopoulos S, Efremidis M, et al. Prognosis, risk stratification, and management of asymptomatic individuals with Brugada syndrome: a systematic review. Pacing Clin Electrophysiol. (2017) 40:1332–45. doi: 10.1111/pace.13214
27. Delise P, Allocca G, Sitta N, Migliore F, Dagradi F, Spazzolini C, et al. Cardiac arrest and Brugada syndrome: Is drug-induced type 1 ECG pattern always a marker of low risk? Int J Cardiol. (2018) 254:142–5. doi: 10.1016/j.ijcard.2017.10.118
28. Wilde AA, Postema PG, Di Diego JM, Viskin S, Morita H, Fish JM, et al. The pathophysiological mechanism underlying Brugada syndrome: depolarization versus repolarization. J Mol Cell Cardiol. (2010) 49:543–53. doi: 10.1016/j.yjmcc.2010.07.012
29. Tokioka K, Kusano KF, Morita H, Miura D, Nishii N, Nagase S, et al. Electrocardiographic parameters and fatal arrhythmic events in patients with Brugada syndrome: combination of depolarization and repolarization abnormalities. J Am Coll Cardiol. (2014) 63:2131–8. doi: 10.1016/j.jacc.2014.01.072
30. Tse G, Wong ST, Tse V, Yeo JM. Depolarization vs. repolarization: what is the mechanism of ventricular arrhythmogenesis underlying sodium channel haploinsufficiency in mouse hearts? Acta Physiol. (2016) 218:234–5. doi: 10.1111/apha.12694
31. Nademanee K, Wilde AAM. Repolarization versus depolarization defects in Brugada syndrome. a tale of two different electrophysiologic settings? JACC Clin Electrophysiol. (2017) 3:364–66. doi: 10.1016/j.jacep.2017.01.011
32. Antzelevitch C. Ion channels and ventricular arrhythmias: cellular and ionic mechanisms underlying the Brugada syndrome. Curr Opin Cardiol. (1999) 14:274–9. doi: 10.1097/00001573-199905000-00013
33. Yan GX, Antzelevitch C. Cellular basis for the Brugada syndrome and other mechanisms of arrhythmogenesis associated with ST-segment elevation. Circulation (1999) 100:1660–6. doi: 10.1161/01.CIR.100.15.1660
34. Tse G, Yan BP. Traditional and novel electrocardiographic conduction and repolarization markers of sudden cardiac death. Europace (2017) 19:712–21. doi: 10.1093/europace/euw280
35. Asvestas D, Tse G, Baranchuk A, Bazoukis G, Liu T, Saplaouras A, et al. High risk electrocardiographic markers in Brugada syndrome. IJC Heart Vasculat. (2018) 18:58–64. doi: 10.1016/j.ijcha.2018.03.001
36. Castro-Torres Y, Carmona-Puerta R, Katholi RE. Ventricular repolarization markers for predicting malignant arrhythmias in clinical practice. World J Clin Cases (2015) 3:705–20. doi: 10.12998/wjcc.v3.i8.705
37. Hondeghem LM. QTc prolongation as a surrogate for drug-induced arrhythmias: fact or fallacy? Acta Cardiol. (2011) 66:685–9. doi: 10.1080/AC.66.6.2136950
38. Morita H, Miyamoto M, Watanabe A, Tsukuda S, Morimoto Y, Kawada S, et al. Progression of ECG abnormalities associated with initial ventricular fibrillation in asymptomatic patients with Brugada Syndrome. Heart Rhythm. (2018). doi: 10.1016/j.hrthm.2018.06.035. [Epub ahead of print].
39. Tse G, Gong M, Wong WT, Georgopoulos S, Letsas KP, Vassiliou VS, et al. The Tpeak - Tend interval as an electrocardiographic risk marker of arrhythmic and mortality outcomes: a systematic review and meta-analysis. Heart Rhythm. (2017) 14:1131–7. doi: 10.1016/j.hrthm.2017.05.031
40. Tse G, Gong M, Li CKH, Leung KSK, Georgopoulos S, Bazoukis G, et al. Tpeak – Tend, Tpeak – Tend/QT ratio and Tpeak – Tend dispersion for risk stratification in Brugada Syndrome: a systematic review and meta-analysis. J Arrhythmia (2018). doi: 10.1002/joa3.12118. [Epub ahead of print].
41. Antzelevitch C, Brugada P, Borggrefe M, Brugada J, Brugada R, Corrado D, et al. Brugada syndrome: report of the second consensus conference: endorsed by the Heart Rhythm Society and the European Heart Rhythm Association. Circulation (2005) 111:659–70. doi: 10.1161/01.CIR.0000152479.54298.51
42. Antzelevitch C, Sicouri S, Di Diego JM, Burashnikov A, Viskin S, Shimizu W, et al. Does Tpeak-Tend provide an index of transmural dispersion of repolarization? Heart Rhythm. (2007).4:1114–6. doi: 10.1016/j.hrthm.2007.05.028
43. Mugnai G, Hunuk B, Hernandez-Ojeda J, Stroker E, Velagic V, Ciconte G, et al. Role of electrocardiographic Tpeak-Tend for the prediction of ventricular arrhythmic events in the brugada syndrome. Am J Cardiol. (2017) 120:1332–7. doi: 10.1016/j.amjcard.2017.07.014
44. Tse G, Yeo JM. Conduction abnormalities and ventricular arrhythmogenesis: the roles of sodium channels and gap junctions. Int J Cardiol Heart Vasc. (2015) 9:75–82. doi: 10.1016/j.ijcha.2015.10.003
45. Meng L, Letsas KP, Baranchuk A, Shao Q, Tse G, Zhang N, et al. Meta-analysis of Fragmented QRS as an electrocardiographic predictor for arrhythmic events in patients with brugada syndrome. Front Physiol. (2017) 8:678. doi: 10.3389/fphys.2017.00678
46. Morita H, Watanabe A, Kawada S, Miyamoto M, Morimoto Y, Nakagawa K, et al. Identification of electrocardiographic risk markers for the initial and recurrent episodes of ventricular fibrillation in patients with Brugada syndrome. J Cardiovasc Electrophysiol. (2018) 29:107–14. doi: 10.1111/jce.13349
47. Choy L, Yeo JM, Tse V, Chan SP, Tse G. Cardiac disease and arrhythmogenesis: Mechanistic insights from mouse models. Int J Cardiol Heart Vascul. (2016) 12:1–10. doi: 10.1016/j.ijcha.2016.05.005
48. Tse G, Wong ST, Tse V, Yeo JM. Determination of action potential wavelength restitution in Scn5a(+/-) mouse hearts modelling human Brugada syndrome. J Geriatr Cardiol. (2017) 14:595–6. doi: 10.11909/j.issn.1671-5411.2017.09.011
49. Tse G. Both transmural dispersion of repolarization and of refractoriness are poor predictors of arrhythmogenicity: a role for iCEB (QT/QRS)? J Geriatr Cardiol. (2016) 13:813–4. doi: 10.11909/j.issn.1671-5411.2016.09.007
50. Tse G, Wong ST, Tse V, Yeo JM. Variability in local action potential durations, dispersion of repolarization and wavelength restitution in aged wild-type and Scn5a+/- mouse hearts modeling human Brugada syndrome. J Geriatr Cardiol. (2016) 13:930–1. doi: 10.1-1909/j.issn.1671-5411.2016.11.009
51. Robyns T, Lu HR, Gallacher DJ, Garweg C, Ector J, Willems R, et al. Response of Robyns to the Tse's letter to editor. Ann Noninvas Electrocardiol. (2017) 22:e12515. doi: 10.1111/anec.12515
Keywords: electrocardiography, conduction, repolarization, wavelength, Brugada syndrome
Citation: Tse G, Li KHC, Li G, Liu T, Bazoukis G, Wong WT, Chan MTV, Wong MCS, Xia Y, Letsas KP, Chan GCP, Chan YS and Wu WKK (2018) Higher Dispersion Measures of Conduction and Repolarization in Type 1 Compared to Non-type 1 Brugada Syndrome Patients: An Electrocardiographic Study From a Single Center. Front. Cardiovasc. Med. 5:132. doi: 10.3389/fcvm.2018.00132
Received: 16 May 2018; Accepted: 04 September 2018;
Published: 04 October 2018.
Edited by:
Pedro Brugada, Independent Researcher, Brussels, BelgiumReviewed by:
Moisés Rodríguez-Mañero, Universidade de Santiago de Compostela, SpainAntonio Sorgente, Cleveland Clinic Abu Dhabi, United Arab Emirates
Copyright © 2018 Tse, Li, Li, Liu, Bazoukis, Wong, Chan, Wong, Xia, Letsas, Chan, Chan and Wu. This is an open-access article distributed under the terms of the Creative Commons Attribution License (CC BY). The use, distribution or reproduction in other forums is permitted, provided the original author(s) and the copyright owner(s) are credited and that the original publication in this journal is cited, in accordance with accepted academic practice. No use, distribution or reproduction is permitted which does not comply with these terms.
*Correspondence: Gary Tse, dHNlZ0BjdWhrLmVkdS5oaw==
William K. K. Wu, d3VrYWtlaUBjdWhrLmVkdS5oaw==