 Don M. Matshazi1*
 Cecil J. Weale1
 Rajiv T. Erasmus2Andre P. Kengne3,4
 Saarah F. G. Davids1
 Shanel Raghubeer1
 Stanton Hector1Glenda M. Davison1
 Tandi E. Matsha1*
- 1South African Medical Research Council/Cape Peninsula University of Technology Cardiometabolic Health Research Unit, Department of Biomedical Sciences, Faculty of Health and Wellness Sciences, Cape Peninsula University of Technology, Cape Town, South Africa
- 2Division of Chemical Pathology, Faculty of Health Sciences, National Health Laboratory Service and Stellenbosch University, Cape Town, South Africa
- 3Non-communicable Diseases Research Unit, South African Medical Research Council, Cape Town, South Africa
- 4Department of Medicine, University of Cape Town, Cape Town, South Africa
Hypertension has a complex pathogenesis and symptoms appear in advanced disease. Dysregulation of gene expression regulatory factors like microRNAs has been reported in disease development. Identifying biomarkers which could help understand the pathogenesis and prognosis of hypertension is essential. The study's objective was to investigate microRNA expression profiles according to participant blood pressure status. Next generation sequencing was used to identify microRNAs in the whole blood of 48 body mass index-, smoking- and age-matched normotensive (n = 12), screen-detected hypertensive (n = 16) and known hypertensive (n = 20) female participants. Quantitative reverse transcription polymerase chain reaction was used to validate the next generation sequencing findings in a larger, independent sample of 84 men and 179 women. Using next generation sequencing, 30 dysregulated microRNAs were identified and miR-1299 and miR-30a-5p were the most significantly differentially expressed. Both microRNAs were upregulated in known hypertensives or screen-detected hypertensives compared to the normotensives. Kyoto Encyclopedia of Genes and Genomes pathway enrichment analysis indicated possible involvement of platelet activation, calcium signaling and aldosterone synthesis pathways. Further validation of miR-1299 and miR-30a-5p using quantitative reverse transcription polymerase chain reaction confirmed sequencing results while yielding new findings. These findings demonstrate microRNA dysregulation in hypertension and their expression may be related to genes and biological pathways essential for blood pressure homeostasis.
Introduction
The 8th report released by the Joint National Committee on Prevention, Detection and Evaluation of High Blood Pressure describes hypertension (HPT) as the persistent elevation of blood pressure (BP) above the 140/90 mmHg threshold (1, 2). Despite efforts to understand the pathogenesis of the condition, HPT remains a leading public health concern affecting both developed and developing countries (3, 4). It has been identified as one of the most important modifiable risk factors for cardiovascular disease, renal disease, and stroke, and accounts for over 10 million deaths throughout the world annually (5–7). In 90–95% of HPT patients, the cause is unknown, and is thus termed primary or essential HPT (8, 9). However, research has demonstrated the involvement of genetic and environmental factors in the development of HPT. The influence of epigenetic factors such as deoxyribonucleic (DNA) methylation and histone modification on the pathogenesis of HPT has been a subject of intense research, with several important conclusions being made along the way (10). However, there is a paucity of research regarding microRNAs (miRNAs) in the context of HPT.
MiRNAs are a group of small, endogenous, non-coding ribonucleic (RNA) sequences that are 17–25 base pairs long (11). These molecules are involved in gene expression regulation at the post-transcriptional level. This is achieved by binding to the 3′untranslated region of complementary messenger RNA (mRNA) molecules and inhibiting translation into protein or inducing mRNA degradation (12). MiRNAs are present in almost every cell and disturbances in their regulation are usually associated with disease processes, including HPT (13, 14). Herein, we investigated the miRNA profiles in South African individuals with normal BP, as well as those presenting with known or screen-detected HPT.
Materials and Methods
Ethics Statement
This investigation was based on the Cape Town Vascular and Metabolic Health (VMH) study, which was approved by the Research Ethics Committees of the Cape Peninsula University of Technology (CPUT) and Stellenbosch University (respectively, NHREC: REC−230 40−014 and N14/01/003). Ethical approval was also obtained for this cross-sectional sub-study from the CPUT Health and Wellness Sciences Research Ethics Committee (CPUT/HW-REC 2019/H7). The study was conducted as per the provisions of the Declaration of Helsinki. All procedures were explained to the participants in their language of choice. Once the participants fully understood their participation, they signed informed consent forms to allow the collection of blood and anthropometric data.
Study Design and Procedures
Data collection and procedures have been described previously (15). Briefly, participants underwent anthropometric and BP measurements, as well as oral glucose tolerance tests (OGTT). Anthropometric measurements for each participant were taken three times and the average reported. BP was measured according to the World Health Organization (WHO) guidelines (16), using a semi-automatic digital BP monitor (Omron M6 comfort-preformed cuff BP Monitor, China) on the right arm in a sitting position and at rest for at least 10 min. Three BP readings were taken at 3-min intervals and the lowest systolic BP and corresponding diastolic BP-values were used. Participants were grouped into three categories based on; the use of anti-hypertensive medication as known HPT, BP measurement of 140/90 mm Hg or greater as screen-detected HPT and normal BP measurement (<140/90 mm Hg) as normotensive. Body Mass Index (BMI) was calculated as weight per square meter (kg/m2), where kg was the participant's weight in kilograms and m2, the square of their height.
The following biochemical parameters were analyzed at an ISO 15189 accredited Pathology practice (PathCare Reference Laboratory, Cape Town, South Africa): glycated hemoglobin (HbA1c) by High Performance Liquid Chromatography (BioRad Variant Turbo, BioRad, Hercules, CA, USA); serum insulin by a paramagnetic particle chemiluminescence assay (Beckman DXI, Beckman Coulter, South Africa); serum cotinine by Competitive Chemiluminescent (Immulite 2000, Siemens, Munich, Germany); plasma glucose by enzymatic hexokinase method (Beckman AU, Beckman Coulter, Brea, CA, USA); total cholesterol (TC); high density lipoprotein cholesterol (HDL-c) by enzymatic immunoinhibition—end point (Beckman AU, Beckman Coulter, Brea, CA, USA); triglycerides (TG) by glycerol phosphate oxidase-peroxidase, end point (Beckman AU, Beckman Coulter, Brea, CA, USA); low density lipoprotein cholesterol (LDL) by enzymatic selective protection—end point (Beckman AU, Beckman Coulter, Brea, CA, USA); and ultrasensitive C-reactive protein (CRP) by Latex Particle Immunoturbidimetry (Beckman AU, Beckman Coulter, Brea, CA, USA). In addition, blood samples were collected in a Tempus RNA tube (ThermoFisher Scientific, Waltham, MA, USA) and stored at −80°C for total RNA extraction and analysis.
RNA Isolation
Total RNA, including miRNA, was isolated from whole blood using the MagMax for Stabilized Blood RNA isolation kit (ThermoFisher Scientific) according to manufacturer's instructions. The concentration and purity of each RNA extract was determined using a NanoDrop One spectrophotometer. Total RNA extracts with 260/280 values between 1.8 and 2.0, and concentrations >20 ng/μl were used for microRNA sequencing (miRNA-seq) using next generation sequencing (NGS) and quantitative reverse transcription PCR (RT-qPCR).
MicroRNA Sequencing
This was conducted on total RNA samples from 48 female participants representing three different HPT statuses. The inclusion of females only in this part of the study was to avoid introducing potential sources of variation due to gender effect in an already small cohort. Small RNA library construction, deep sequencing, and data processing were performed at Arraystar Inc., Rockville, USA as previously described by Matsha et al. (15). Briefly, the total RNA of each sample was used to prepare the miRNA sequencing library as follows: (1) 3′-adapter ligation with T4 RNA ligase 2 (truncated); (2) 5′-adapter ligation with T4 RNA ligase; (3) complementary DNA (cDNA) synthesis with RT primer; (4) PCR amplification; (5) extraction and purification of ~130–150 bp PCR amplified fragments (correspond to ~15–35 nt small RNAs) from the polyacrylamide gel electrophoresis gel. The Agilent 2100 Bioanalyzer was used to quantify completed libraries, thereafter DNA fragments were denatured with 0.1 M sodium hydroxide to generate single-stranded DNA molecules, then captured on Illumina flow cells, amplified in situ, and finally sequenced for 51 cycles on the Illumina HiSeq system according to the manufacturer's instructions. Raw sequences were generated as clean reads from the Illumina HiSeq using real-time base calling and quality filtering. The clean reads that passed the quality filter were processed to remove adaptor sequences as the trimmed reads. The trimmed reads (length ≥ 15 nt) were aligned to the human pre-miRNA in miRBase 21, using NovoAlign software. The miRNA expression levels were measured and normalized as transcripts per million of total aligned miRNA reads.
Gene Ontology and Functional Enrichment Analysis
The Gene Ontology (GO) analysis was performed to describe gene and gene product attributes (http://www.geneontology.org). The ontology covers three domains: Biological Process, Cellular Component and Molecular Function. Commonly predicted gene targets were subjected to functional analysis using Kyoto Encyclopedia of Genes and Genomes (KEGG). A conservative Fisher's exact-test and false discovery rate method were used to calculate the targeted pathways.
Validation of NGS miRNA Expression Results
To confirm the expression of miRNAs, the validation of NGS results was performed on total RNA from an independent sample of 263 male and female participants randomly selected from an existing database and 48 females on which NGS had been conducted. MiRNAs were converted to cDNA using the TaqMan MicroRNA Reverse Transcription Kit according to the manufacturer's protocol (Life Technologies, USA). The miRNA expression levels were assessed using TaqMan miRNA Assay primers on the QuantStudio 7 Flex real-time PCR instrument (Life Technologies, USA) analyzer. In order to determine miRNA expression in each sample and between two groups, the 2−ΔCt and 2−ΔΔCt (17), respectively, were used and normalized using miR-16-5p as the endogenous control. The suitability of miR-16-5p as an endogenous control in RT-qPCR was assessed and confirmed, as there was minimal variation in its expression in normotensive and hypertensive participants.
Statistical Analysis
Data were analyzed using R statistical software version 3.2.2 (The R Foundation for Statistical Computing, Vienna, Austria) and TIBCO Statistica version 13.5.0.17 (TIBCO Software Inc., California, USA). The Shapiro-Wilk W-test was employed to determine whether the data were normally distributed, based on probability thresholds of p > 0.1. Continuous variables were summarized as mean and standard deviation (SD) when normally distributed, while median, and 25th and 75th percentiles were used for skewed variables, whilst categorical variables were reported as counts and percentages. When comparing groups, for continuous variables, the analysis of variance (ANOVA) was used for normally distributed data; Kruskal Wallis-H test with Dunn post-hoc-test was used for skewed data, whilst the chi-square-test was used for categorical variables. Multivariable regression analysis was conducted to investigate the possible effects of these differences in baseline characteristics on the expression of miRNAs in screen-detected and known HPT. Various models were used, with variations to the crude model being used to analyse the effect or relationship of a baseline characteristic with miRNA expression in HPT. All comparisons were made with the normotensive group as the reference. A p-value < 0.05 was used to characterize statistically significant results. MicroRNAs with fold changes ≥1.3, and p-values ≤ 0.1 were selected as the differentially expressed miRNAs. Novel miRNAs were predicted using miRDeep.
Results
General Participant Characteristics
Of the 1988 VMH survey participants, 311 (227, 73.0% female) were selected for inclusion into this sub-study. Of these, 48 (all female) took part in the NGS part of the study while an additional 263 randomly selected male and female participants were included in the RT-qPCR validation study. The distribution of the NGS and RT-qPCR participants by BP status is shown in Table 1. The 48 women in the NGS sample included 20 with known HPT, 16 with screen-detected HPT and 12 normotensives, whilst the validation sample included 106 known hypertensives, 52 screen-detected hypertensives and 105 normotensives. The expected differences by status for HPT in the cardiovascular risk profile were apparent across the two sub-samples (Table 1).
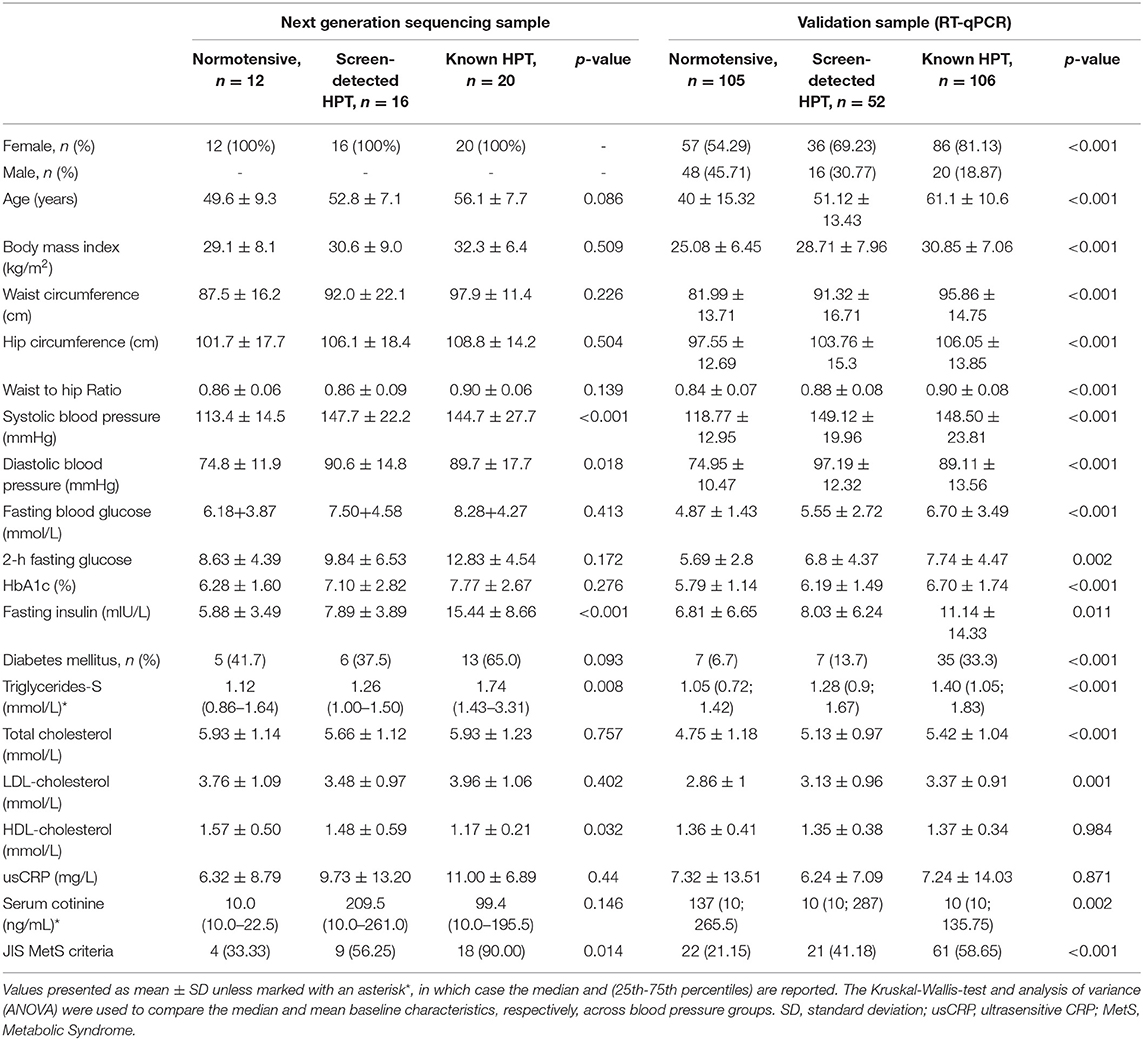
Table 1. Characteristics of the participants, based on hypertension status.
NGS miRNA Expression Profiling
All 48 samples met the quality control standards. We generated Heat Map and Unsupervised Hierarchical Clustering on all miRNAs that were expressed in at least one sample, to produce miRNA or condition trees that would allow us to pick out groups of similar miRNAs. The result of hierarchical clustering on conditions showed a distinguishable miRNA expression profile amongst the groups (Figures 1A–C). For the identification of differentially expressed miRNAs, we computed “fold changes” (i.e., the ratio of the group averages) and p-values between each group. MicroRNAs with fold changes ≥ 1.3 and p-values ≤ 0.1 were selected as the differentially expressed miRNAs. Based on pre-specified criteria, we then used volcano plots to visualize the significantly differentially expressed pre-miRNAs between the study groups as shown in Figures 2A–C. A total of 30 significantly differentially expressed mature miRNAs were identified at varying expression levels and are summarized in Table 2. Of the thirty differentially expressed miRNAs, two (6.7%) were novel, and whilst one of these novel miRNAs was upregulated in known HPT vs. normotensive, the other was upregulated in known HPT vs. screen-detected HPT. Whilst miR-1299 exhibited the highest fold change of all significantly upregulated miRNAs as seen in screen-detected HPT vs. normotensive (fold change = 3.38, p = 0.0812), miR-30a-5p upregulation was greatest in known HPT vs. normotensive (fold change = 2.44, p = 0.0631) and known HPT vs. screen detected HPT (fold change = 2.02, p = 0.0715; Table 2).
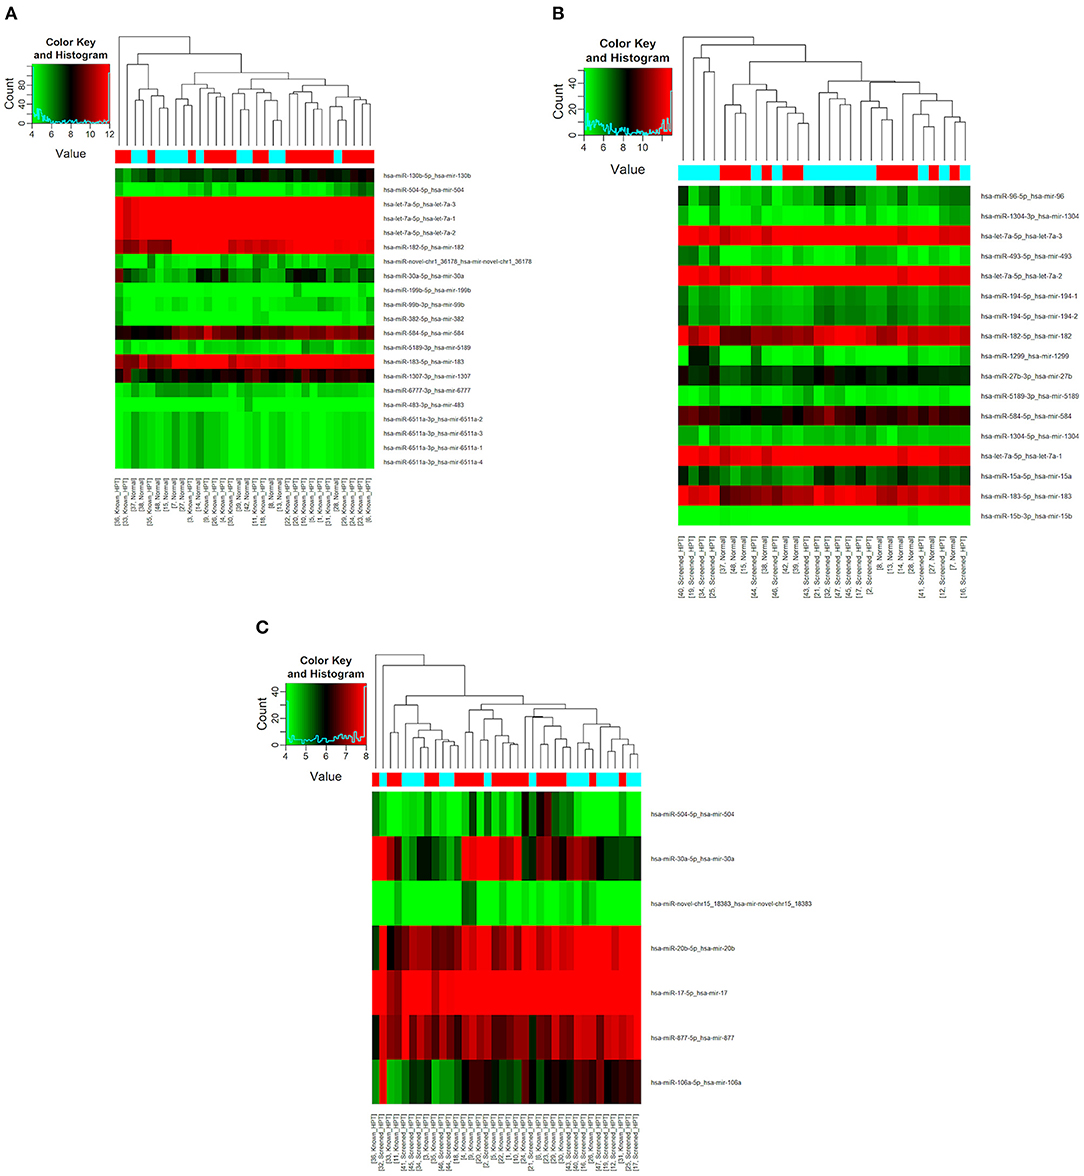
Figure 1. Differential miRNA expression according to HPT status. The heatmap shows all differentially expressed miRNAs at adjusted p-value < 0.05. (A) Normotensive vs. known HPT; (B) Normotensive vs. screen-detected HPT; (C) Known HPT vs. screen-detected HPT.
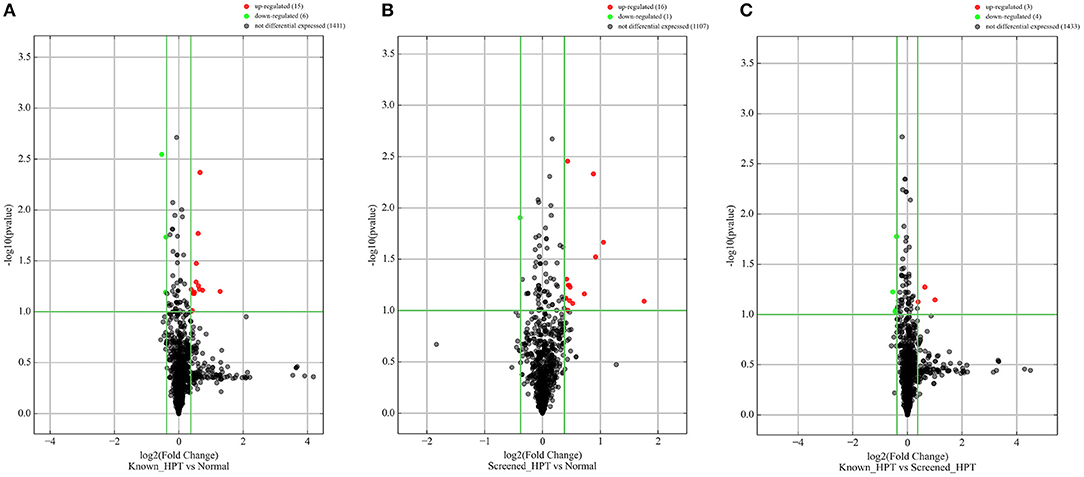
Figure 2. Differentially expressed pre-miRNAs in comparison between blood pressure groups. (A) Is a comparison between known hypertensives and normotensives. (B) Is a comparison between screen-detected HPT and normotensives. (C) Is a comparison between known HPT and screen-detected HPT. Significantly different expression of a pre-miRNA was those in which there was a ≥ 1.3-fold change difference in expression between comparison groups and p ≤ 0.1. Red and green dots signify upregulated and downregulated miRNAs, respectively. No differential expression was signified with a black dot.
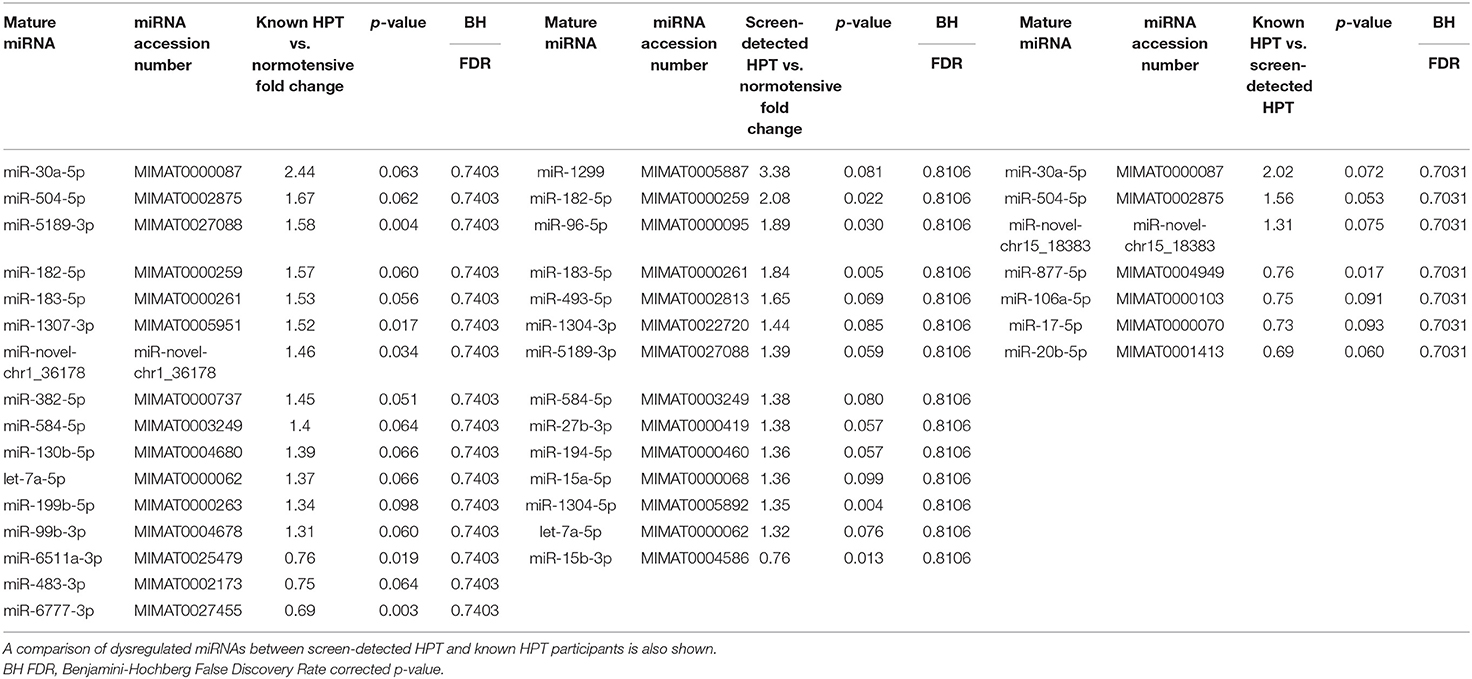
Table 2. Dysregulated mature miRNAs in screen-detected and known HPT compared to normotensive participants.
Kyoto Encyclopedia of Genes and Genomes pathway analysis revealed 84 pathways, five of which are essential for platelet activation, calcium signaling, vascular smooth muscle contraction, vasopressin-mediated water reabsorption and aldosterone synthesis and secretion. Based on GO analyses, we retrieved the biological processes, cellular components and molecular functions of dysregulated miRNAs. In Figure 3, we present the top enrichment scores for biological processes of dysregulated miRNAs in hypertensive vs. normotensive participants.
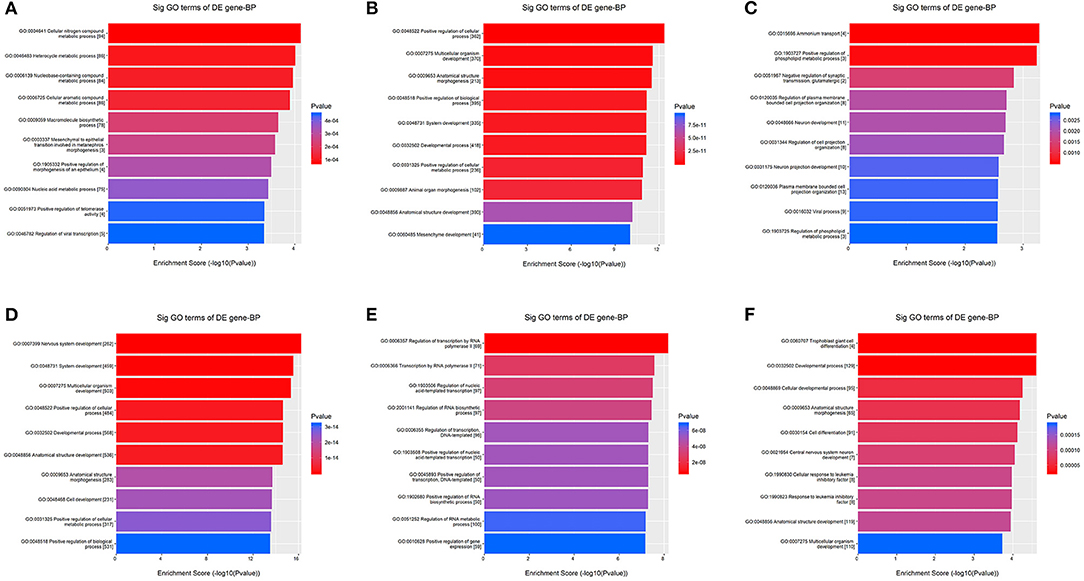
Figure 3. GO analysis—Biological Processes. The bars plots show the top 10 enrichment score values of the significant enrichment terms. X-axis: GOID's enrichment score value; it equals –log10(p-value); Y-axis: GO category. (A) Upregulated in known HPT vs. normotensive. (B) Downregulated in known HPT vs. normotensive. (C) Upregulated in screen-detected HPT vs. normotensive. (D) Downregulated in screen-detected HPT vs. normotensive. (E) Upregulated in known HPT vs. screen-detected HPT. (F) Downregulated in known HPT vs. screen-detected HPT.
Next Generation Sequencing Results Validation
The RT-qPCR data were normalized using miR-16-5p and the raw Ct values, showing its suitability as an endogenous control in our cohort, are shown in Supplementary Figure 1. The two miRNAs with the highest fold change between study groups using NGS were selected for validation with RT-qPCR, namely miR-30a-5p and miR-1299. The relative expressions (2−ΔCt) of each target miRNA in the three participant groups are shown in Figure 4. Both miR-30a-5p and miR-1299 were upregulated in known HPT compared to normotensive or screen-detected HPT, p = 0.015, whilst miR-30a-5p was also significantly upregulated in screen-detected HPT vs. normotensive, p = 0.023. Using the 2−ΔΔCt formula to compute fold changes between two groups, miR-30a-5p expression was 2.58-fold higher in known HPT vs. normotensive and 1.69-fold higher vs. screen-detected HPT. In screen-detected HPT, miR-30a-5p expression was 1.52-fold higher when compared to the normotensives. As for miR-1299, there was a 3.93-fold and 2.78-fold higher expression in known HPT vs. normotensives and screen-detected HPT, respectively. However, there was not a great difference in the expression of miR-1299 between screen-detected HPT vs. normotensive as shown by the 1.41-fold difference in expression.
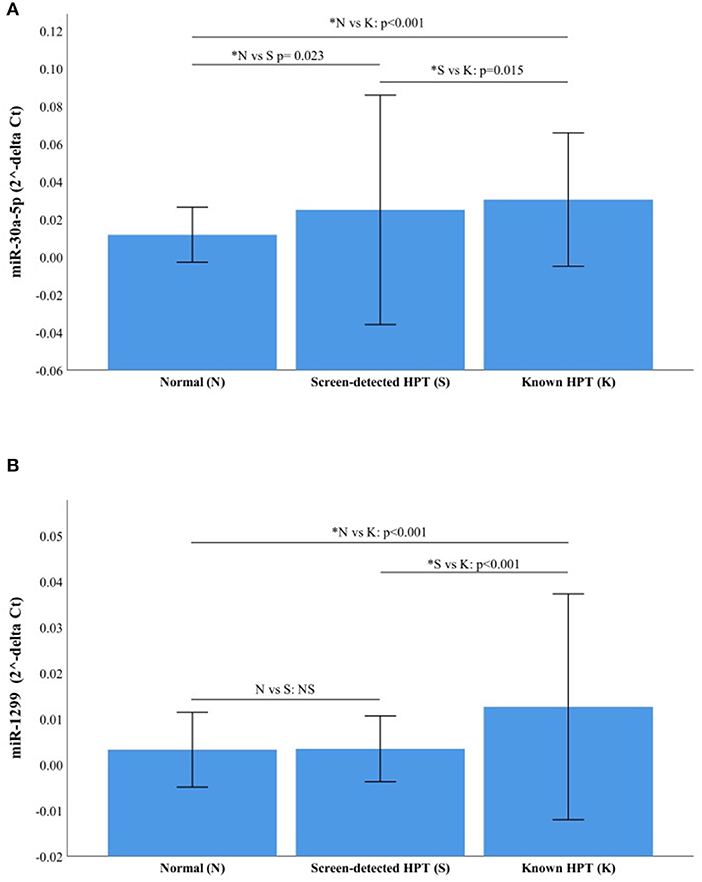
Figure 4. Relative expression of miR-30a-5p and miR-1299. (A) miR-30a-5p in normotensive (n = 116), screen-detected HPT (n = 66) and known HPT (n = 124). (B) miR-1299p in normotensive, screen-detected HPT and known HPT. Data are represented graphically as the mean ± SD. Not significant (NS) if p > 0.05 and significant p-value denoted by an asterisk*.
Multivariable Regression Analysis
The results of multivariable regression analysis are shown in Supplementary Table 1. For miR-30a-5p, the crude odds ratio was 1.31 [95% confidence interval (CI): 1.13–1.51, p < 0.001] for screen-detected HPT, whilst for known HPT, the OR was 1.30 (95% CI: 1.13–1.49, p < 0.001). When the models were adjusted for different variables, the expression of miR-30a-5p remained significantly associated with both screen-detected and known HPT (p ≤ 0.019). With regard to miR-1299, the crude odds ratio was 0.80 [95% confidence interval (CI): 0.54–1.20, p = 0.284] for screen-detected HPT, whilst for known HPT, the OR was 1.11 (95% CI: 0.96–1.30, p = 0.164). There was no significant association between screen-detected and known HPT with miR-1299 expression for all tested models (p ≥ 0.134). In this cohort of participants, differences in age, sex, diabetes status, BMI, total cholesterol and trigylerides between normotensives and hypertensives (screen-detected and known) did not significantly impact the expression of both miR-30a-5p and miR-1299.
Discussion
To our knowledge, no study has been conducted on miRNA expression in relation to HPT in populations from Africa. Using NGS, we identified 30 (including two novel) mature miRNAs that were differentially expressed in 48 South African women with either screen-detected or treated HPT. These miRNAs were associated with pathways such as platelet activation, calcium signaling and vascular smooth muscle contraction pathways which are particularly important in cardiovascular pathogenesis (18–20). Two miRNAs, namely miR-1299 and miR-30a-5p were the most significantly dysregulated in hypertensive individuals and this was validated using RT-qPCR in 311 study participants, confirming the miRNA sequencing results while yielding new findings. Multivariable regression analysis showed that in our cohort, differences in age, sex, diabetes status, BMI, total cholesterol and trigylerides had no significant effect on the expression of miRNAs. Furthermore, the significant relationship between miR-30a-5p expression and screen-detected and known HPT was demonstrated.
Several studies have reported on a number of dysregulated miRNAs in HPT using different tissues, but results remain inconsistent (21–25). A study similar to ours reported 27 dysregulated miRNAs in a sample of 13 individuals with HPT (21), although the miRNAs were not similar to ours. A recurring theme within these miRNA profiling studies in HPT is the inter-study inconsistency of findings. For example, expression of various miRNAs such as miR-21, miR-145-5p, miR-155-5p, miR-181a (26–34) that had been previously associated with BP and HPT were not found in this study. We suspect this may partially be attributed to the diverse genetic makeup of Africans and in particular, our study participants whose heterogeneous genetic makeup comprises 32–43% Khoisan, 20–36% Bantu-speaking Africans, 21–28% European, and 9–11% Asian ancestry (35). Furthermore, differences in the methods used could account for the discordance in inter-study findings as the tissue specific nature of some miRNAs has been previously described (36). In our study, discordant results with regards to miR-1299 were evident between NGS and RT-qPCR. Other studies have employed the candidate miRNA approach and reported on miRNAs that have not necessarily been identified using microarrays or sequencing, highlighting the need for more studies employing the same methodologies and experimental designs and standardized sample preparation before these miRNAs can be utilized as new biomarkers.
In a previous study, miR-30 was down-regulated in the plasma of patients with essential HPT (37). In contrast, our findings using both sequencing and RT-qPCR showed an upregulation of miR-30a-5p in both screen-detected or known hypertensive (on antihypertensive treatment) individuals. This difference in expression may be partially explained by the differences in the sample type used for analysis. Whilst our study utilized whole blood (composed of plasma, red blood cells, platelets and white blood cells) for total miRNA expression, the other study made use of plasma (cell-deficient). Pre-analytical sample manipulation using centrifugation, which is required for obtaining plasma from whole blood, affects miRNA expression profiles, as it removes from the plasma, cell-specific miRNAs that would otherwise have been detected in whole blood (38). Findings similar to ours were also reported by Huang et al. who demonstrated increased plasma expression of miR-30a in essential and white coat HPT, relative to normotensive participants (39). Overexpression of miR-30a has been reported to interfere with the removal of damaged or dead endothelial cells, promoting atherosclerosis and predisposing individuals to cardiovascular complications, like heart attacks (40). Similarly, other miRNAs in the miR-30 family have been associated with cardiovascular diseases and suggestions made that they act as predictors for acute myocardial infarction and heart failure (40, 41). For instance, the overexpression of miR-30b-5p was shown to have a downregulatory effect on a muscleblind-like splicing regulator 1 (MBLN1) transcript in atherosclerosis, possibly playing a role in the regulation of vascular smooth muscle cells VSMCs (42). Another miRNA with interesting results was miR-1299, which was significantly upregulated in screen-detected HPT when compared to the normotensive group, fold change = 3.38. This was also confirmed with RT-qPCR, which indicated a 1.41-fold increase in expression of the miRNA in screen-detected HPT compared to the normotensive group. However, multivariable regression analysis did not indicate a relationship between HPT and the expression of miR-1299. Although miR-1299 is yet to be reported in HPT by other groups, the microRNA has been implicated in Rheumatic Heart Disease (RHD), a common complication of which is pulmonary arterial hypertension (PAH) (43). One study identified miR-1299 as an important role player in suppressing the growth of colon cancer cells via downregulation of the signal transducers and activators of transcription (STAT3). STAT3 is as an important component in the heart's adaptation to elevated BP (44, 45). It is possible then that elevated expression of miR-1299, as seen in the hypertensive participants, may be a contributing factor in protecting against cardiovascular events associated with elevated BP levels.
As seen in KEGG analysis, the significantly differentially expressed miRNAs had possible involvement in various pathways relevant to HPT, including vascular smooth muscle contraction, vasopressin-mediated water reabsorption, platelet activation, calcium signaling, and aldosterone synthesis and secretion. Alterations to the vascular smooth muscle cells (VSMCs) phenotype has implications in vascular resistance, BP and HPT and Kontaraki et al. demonstrated differential expression of five miRNAs (miR-1, −21, −133, 143, and −145) previously implicated in the alteration of the VSMC phenotype (34). Water retention is also essential in BP regulation and fluid volume maintenance and various miRNAs have been implicated in these processes. Through repression of the methyl CpG binding protein 2 (Mecp2) gene and MeCP2 protein, miR-132 regulates vasopressin synthesis and as such, fluid retention (46), whilst miR-32 and −137 regulate water retention by targeting kidney water channels controlled by vasopressin (47, 48). Dysregulations in aldosterone production or secretion pathways may be a risk for the development of HPT and aldosterone production is reduced due to miR-24 targeting of mRNA from the CYP11B2 gene (49), whilst angiotensin II-mediated overexpression of miR-21 leads to increased aldosterone secretion (50). Dysregulation of calcium signaling leads to altered responses by the vasculature, a common characteristic in HPT (51). In a murine model, Wu et al. demonstrated the regulation of calcium signaling in the kidney by the miR-30 family (52), whilst another study reported miR-214 as a regulator of the calcium pathways through repression of mRNA encoding the sodium-calcium exchanger protein, Ncx1 (53).
Our study had some limitations. Firstly, we did not investigate the effect of antihypertensive drugs, which could have likely influenced the differential expression of miRNAs between treated (known HPT) and untreated (screen-detected HPT) hypertensive individuals. For instance, in a murine model of salt-sensitive HPT, a high salt diet was accompanied by reduced expression of miR-27a, miR-29a, and miR-133a. However, Nebivolol prevented the high salt-mediated lower expression of miR-27a, whilst there was complete and partial reversal of high salt-induced miR-29a decrease by Nebivolol and Atenolol, respectively. Both medications were able to prevent a decrease in miR-133a expression (54). Second, in our NGS analysis, miRNA expression screening was done in only 48 female participants. However, the RT-qPCR validation was performed in a larger sample that also included male participants. Lastly, only two of the 30 significantly dysregulated miRNAs as shown by NGS were validated by RT-qPCR.
In conclusion, our study demonstrated miRNA dysregulation in hypertensive individuals and to our knowledge, is the first study to do so in a sub-Saharan population. Based on our findings, we have shown a number of miRNAs, particularly, miR-30a-5p and miR-1299 that could be explored further for a potential prognostic role, or as therapeutic targets.
Data Availability Statement
The datasets presented in this study can be found in online repositories. The names of the repository/repositories and accession number(s) can be found below: https://www.ncbi.nlm.nih.gov/, PRJNA680302.
Ethics Statement
This Investigation was based on the Cape Town Vascular and Metabolic Health (VMH) Study, which was approved by the Research Ethics Committees of the Cape Peninsula University of Technology (CPUT) and Stellenbosch University (respectively, NHREC: REC−230 408−014 and N14/01/003). Ethical approval was also obtained for this cross-sectional sub-study from the CPUT Health and Wellness Sciences Research Ethics Committee (CPUT/HW-REC 2019/H7). The study was conducted as per the provisions of the Declaration of Helsinki. All procedures were explained to the participants in their language of choice. Once the participants fully understood their participation, they signed informed consent forms to allow the collection of blood and anthropometric data. The patients/participants provided their written informed consent to participate in this study.
Author Contributions
TM, RE, and AK: conceptualization and funding acquisition. DM, SR, and CW: methodology. DM and SD: formal analysis. DM and CW: investigation. TM: resources. DM, SR, and SD: data curation. DM: writing—original draft preparation. TM, RE, AK, GD, SR, and SH: writing—review and editing. DM, CW, and SR: validation. DM, SD, and TM: visualization. TM, GD, and SH: supervision. TM and SD: project administration. All authors have read and agreed to the published version of the manuscript.
Funding
This research was funded by the South African Medical Research Council (SAMRC), with funds from National Treasury under its Economic Competitiveness and Support Package (MRC-RFA-UFSP-01-2013/VMH Study) and South African National Research Foundation (SANRF) (Grant No. 115450).
Conflict of Interest
The authors declare that the research was conducted in the absence of any commercial or financial relationships that could be construed as a potential conflict of interest.
Acknowledgments
Our thanks to the Bellville South Ward 009 community for partaking in the study as well as the Bellville South Community Health Forum for supporting the engagement with the Bellville South Community.
Supplementary Material
The Supplementary Material for this article can be found online at: https://www.frontiersin.org/articles/10.3389/fcvm.2021.645541/full#supplementary-material
Supplementary Figure 1. A comparison of the raw Ct-values of the RT-qPCR normalizer, miR-16-5p in the three blood pressure groups. No significant difference in expression was observed between groups. Known HPT vs. normotensives, p = 0.083; known HPT vs. screen-detected HPT, p = 0.118 and normotensive vs. screen-detected HPT, p = 0.710.
Supplementary Table 1. Multivariate regression analysis of miRNAs for the presence of screen-detected and known hypertension.
References
1. James PA, Oparil S, Carter BL, Cushman WC, Dennison-Himmelfarb C, Handler J, et al. 2014 Evidence-based guideline for the management of high blood pressure in adults: report from the panel members appointed to the eighth joint national committee (JNC 8). JAMA. (2014) 311:507–20. doi: 10.1001/jama.2013.284427
2. Abegaz TM, Abdela OA, Bhagavathula AS, Teni FS. Magnitude and determinants of uncontrolled blood pressure among hypertensive patients in ethiopia: hospital-based observational study. Pharm Pract (Granada). (2018) 16:1173. doi: 10.18549/PharmPract.2018.02.1173
3. Wise IA, Charchar FJ. Epigenetic modifications in essential hypertension. Int J Mol Sci. (2016) 17:451. doi: 10.3390/ijms17040451
4. Polsinelli VB, Satchidanand N, Singh R, Holmes D, Izzo JL. Hypertension and aging in Rural Haiti: results from a preliminary survey. J Hum Hypertens. (2017) 31:138–44. doi: 10.1038/jhh.2016.52
5. Lim SS, Vos T, Flaxman AD, Danaei G, Shibuya K, Adair-Rohani H, et al. A comparative risk assessment of burden of disease and injury attributable to 67 risk factors and risk factor clusters in 21 regions, 1990-2010: a systematic analysis for the global burden of disease study 2010. Lancet. (2012) 380:2224–60. doi: 10.1016/S0140-6736(12)61766-8
6. Babiker FA, Elkhalifa LA, Moukhyer ME. Awareness of hypertension and factors associated with uncontrolled hypertension in sudanese adults. Cardiovasc J Afr. (2013) 24:208–12. doi: 10.5830/CVJA-2013-035
7. Peltzer K, Phaswana-Mafuya N. Hypertension and associated factors in older adults in South Africa. Cardiovasc J Afr. (2013) 24:66–72. doi: 10.5830/CVJA-2013-002
8. Bátkai S, Thum T. MicroRNAs in hypertension: mechanisms and therapeutic targets. Curr Hypertens Rep. (2012) 14:79–87. doi: 10.1007/s11906-011-0235-6
9. Rossier BC, Bochud M, Devuyst O. The hypertension pandemic: an evolutionary perspective. Physiolgy. (2017) 32:112–25. doi: 10.1152/physiol.00026.2016
10. Mu S, Shimosawa T, Ogura S, Wang H, Uetake Y, Kawakami-Mori F, et al. Epigenetic modulation of the renal β-adrenergic-WNK4 pathway in salt-sensitive hypertension. Nat Med. (2011) 17:573–80. doi: 10.1038/nm.2337
11. Shin VY, Chu K-M. MiRNA as potential biomarkers and therapeutic targets for gastric cancer. World J Gastroenterol. (2014) 20:10432–9. doi: 10.3748/wjg.v20.i30.10432
12. Levy E, Spahis S, Bigras J-L, Delvin E, Borys J-M. The epigenetic machinery in vascular dysfunction and hypertension. Curr Hypertens Rep. (2017) 19:1–12. doi: 10.1007/s11906-017-0745-y
13. Chen X, Ba Y, Ma L, Cai X, Yin Y, Wang K, et al. Characterization of microRNAs in serum: a novel class of biomarkers for diagnosis of cancer and other diseases. Cell Res. (2008) 18:997–1006. doi: 10.1038/cr.2008.282
14. Nemecz M, Alexandru N, Tanko G, Georgescu A. Role of microRNA in endothelial dysfunction and hypertension. Curr Hypertens Rep. (2016) 18:87. doi: 10.1007/s11906-016-0696-8
15. Matsha TE, Kengne AP, Hector S, Mbu DL, Yako YY, Erasmus RT. MicroRNA profiling and their pathways in south african individuals with prediabetes and newly diagnosed type 2 diabetes mellitus. Oncotarget. (2018) 9:30485–98. doi: 10.18632/oncotarget.25271
16. Chalmers J, MacMahon S, Mancia G, Whitworth J, Beilin L, Hansson L, et al. 1999 World health organization-international society of hypertension guidelines for the management of hypertension. Clin Exp Hypertens. (1999) 21:1009–60.
17. Livak KJ, Schmittgen TD. Analysis of relative gene expression data using real-time quantitative PCR and the 2-ΔΔCT method. Methods. (2001) 25:402–8. doi: 10.1006/meth.2001.1262
18. Gkaliagkousi E, Passacquale G, Douma S, Zamboulis C, Ferro A. Platelet activation in essential hypertension: implications for antiplatelet treatment. Am J Hypertens. (2010) 23:229–36. doi: 10.1038/ajh.2009.247
19. Landstrom AP, Dobrev D, Wehrens XHT. Calcium signaling and cardiac arrhythmias. Circ Res. (2017) 120:1969–93. doi: 10.1161/CIRCRESAHA.117.310083
20. Touyz RM, Alves-Lopes R, Rios FJ, Camargo LL, Anagnostopoulou A, Arner A, et al. Vascular smooth muscle contraction in hypertension. Cardiovasc Res. (2018) 114:529–39. doi: 10.1093/cvr/cvy023
21. Li S, Zhu J, Zhang W, Chen Y, Zhang K, Popescu LM, et al. Signature microRNA expression profile of essential hypertension and its novel link to human cytomegalovirus infection. Circulation. (2011) 124:175–84. doi: 10.1161/CIRCULATIONAHA.110.012237
22. Jairajpuri DS, Malalla ZH, Mahmood N, Almawi WY. Circulating microRNA expression as predictor of preeclampsia and its severity. Gene. (2017) 627:543–8. doi: 10.1016/j.gene.2017.07.010
23. Chen S, Chen R, Zhang T, Lin S, Chen Z, Zhao B, et al. Relationship of cardiovascular disease risk factors and noncoding RNAs with hypertension: a case-control study. BMC Cardiovasc Disord. (2018) 18:58. doi: 10.1186/s12872-018-0795-3
24. Özkan G, Ulusoy S, Geyik E, Erdem Y. Down-regulation of miRNA 145 and up-regulation of miRNA 4516 may be associated with primary hypertension. J Clin Hypertens. (2019) 21:1724–31. doi: 10.1111/jch.13704
25. Yildirim E, Ermis E, Allahverdiyev S, Ucar H, Yavuzer S, Cengiz M. Circulating miR-21 levels in hypertensive patients with asymptomatic organ damage. Medicine (Baltimore). (2019) 98:e17297. doi: 10.1097/MD.0000000000017297
26. Santovito D, Mandolini C, Marcantonio P, De Nardis V, Bucci M, Paganelli C, et al. Overexpression of microRNA-145 in atherosclerotic plaques from hypertensive patients. Expert Opin Ther Targets. (2013) 17:217–23. doi: 10.1517/14728222.2013.745512
27. Cengiz M, Yavuzer S, Klçkran Avc B, Yürüyen M, Yavuzer H, Dikici SA, et al. Circulating miR-21 and eNOS in subclinical atherosclerosis in patients with hypertension. Clin Exp Hypertens. (2015) 37:643–9. doi: 10.3109/10641963.2015.1036064
28. Sethupathy P, Borel C, Gagnebin M, Grant GR, Deutsch S, Elton TS, et al. Human microRNA-155 on chromosome 21 differentially interacts with its polymorphic target in the AGTR1 3′ untranslated region: a mechanism for functional single-nucleotide polymorphisms related to phenotypes. Am J Hum Genet. (2007) 81:405–13. doi: 10.1086/519979
29. Li H, Zhang X, Wang F, Zhou L, Yin Z, Fan J, et al. MicroRNA-21 lowers blood pressure in spontaneous hypertensive rats by upregulating mitochondrial translation. Circulation. (2016) 134:734–51. doi: 10.1161/CIRCULATIONAHA.116.023926
30. Ceolotto G, Papparella I, Bortoluzzi A, Strapazzon G, Ragazzo F, Bratti P, et al. Interplay between miR-155, AT1R A1166C polymorphism, and AT1R expression in young untreated hypertensives. Am J Hypertens. (2011) 24:241–6. doi: 10.1038/ajh.2010.211
31. Jackson KL, Marques FZ, Watson AMD, Palma-Rigo K, Nguyen-Huu TP, Morris BJ, et al. A novel interaction between sympathetic overactivity and aberrant regulation of renin by miR-181a in BPH/2J genetically hypertensive mice. Hypertension. (2013) 62:775–81. doi: 10.1161/HYPERTENSIONAHA.113.01701
32. Marques FZ, Campain AE, Tomaszewski M, Zukowska-Szczechowska E, Yang YHJ, Charchar FJ, et al. Gene expression profiling reveals renin mRNA overexpression in human hypertensive kidneys and a role for microRNAs. Hypertension. (2011) 58:1093–8. doi: 10.1161/HYPERTENSIONAHA.111.180729
33. Parmacek MS. MicroRNA-modulated targeting of vascular smooth muscle cells. J Clin Invest. (2009) 119:2526–8. doi: 10.1172/JCI40503
34. Kontaraki JE, Marketou ME, Zacharis EA, Parthenakis FI, Vardas PE. Differential expression of vascular smooth muscle-modulating MicroRNAs in human peripheral blood mononuclear cells: novel targets in essential hypertension. J Hum Hypertens. (2014) 28:510–6. doi: 10.1038/jhh.2013.117
35. De Wit E, Delport W, Rugamika CE, Meintjes A, Möller M, Van Helden PD, et al. Genome-wide analysis of the structure of the south african coloured population in the Western Cape. Hum Genet. (2010) 128:145–53. doi: 10.1007/s00439-010-0836-1
36. Ludwig N, Leidinger P, Becker K, Backes C, Fehlmann T, Pallasch C, et al. Distribution of miRNA expression across human tissues. Nucleic Acids Res. (2016) 44:3865–77. doi: 10.1093/nar/gkw116
37. Huang Y, Chen J, Zhou Y, Yu X, Huang C, Li J, et al. Circulating miR-30 is related to carotid artery atherosclerosis. Clin Exp Hypertens. (2016) 38:489–94. doi: 10.3109/10641963.2016.1163370
38. Felekkis K, Papaneophytou C. Challenges in using circulating micro-RNAs as biomarkers for cardiovascular diseases. Int J Mol Sci. (2020) 21:561. doi: 10.3390/ijms21020561
39. Huang YQ, Huang C, Chen JY, Li J, Feng YQ. The association of circulating miR-30a, miR-29 and miR-133 with white-coat hypertension. Biomark Med. (2016) 10:1231–9. doi: 10.2217/bmm-2016-0215
40. Zhang T, Tian F, Wang J, Jing J, Zhou SS, Chen YD. Endothelial cell autophagy in atherosclerosis is regulated by miR-30-mediated translational control of ATG6. Cell Physiol Biochem. (2015) 37:1369–78. doi: 10.1159/000430402
41. Maciejak A, Kostarska-Srokosz E, Gierlak W, Dluzniewski M, Kuch M, Marchel M, et al. Circulating miR-30a-5p as a prognostic biomarker of left ventricular dysfunction after acute myocardial infarction. Sci Rep. (2018) 8:9883. doi: 10.1038/s41598-018-28118-1
42. Woo CC, Liu W, Lin XY, Dorajoo R, Lee KW, Richards AM, et al. The interaction between 30b-5p miRNA and MBNL1 mRNA is involved in vascular smooth muscle cell differentiation in patients with coronary atherosclerosis. Int J Mol Sci. (2020) 21:11. doi: 10.3390/ijms21010011
43. Li N, Lian J, Zhao S, Zheng D, Yang X, Huang X, et al. Detection of differentially expressed microRNAs in rheumatic heart disease: miR-1183 and miR-1299 as potential diagnostic markers. Biomed Res Int. (2015) 2015:524519. doi: 10.1155/2015/524519
44. Zouein FA, Zgheib C, Hamza S, Fuseler JW, Hall JE, Soljancic A, et al. Role of STAT3 in angiotensin II-induced hypertension and cardiac remodeling revealed by mice lacking STAT3 serine 727 phosphorylation. Hypertens Res. (2013) 36:496–503. doi: 10.1038/hr.2012.223
45. Wang Y, Lu Z, Wang N, Zhang M, Zeng X, Zhao W. MicroRNA-1299 is a negative regulator of STAT3 in colon cancer. Oncol Rep. (2017) 37:3227–34. doi: 10.3892/or.2017.5605
46. Bijkerk R, Trimpert C, van Solingen C, de Bruin RG, Florijn BW, Kooijman S, et al. MicroRNA-132 controls water homeostasis through regulating MECP2-mediated vasopressin synthesis. Am J Physiol Ren Physiol. (2018) 315:F1129–38. doi: 10.1152/ajprenal.00087.2018
47. Gomes A, da Silva IV, Rodrigues CMP, Castro RE, Soveral G. The emerging role of microRNAs in aquaporin regulation. Front Chem. (2018) 6:238. doi: 10.3389/fchem.2018.00238
48. Kim J-E, Jung HJ, Lee Y-J, Kwon T-H. Vasopressin-regulated miRNAs and AQP2-targeting miRNAs in kidney collecting duct cells. Am J Physiol Ren Physiol. (2015) 308:F749–64. doi: 10.1152/ajprenal.00334.2014
49. Robertson S, Mackenzie SM, Alvarez-Madrazo S, Diver LA, Lin J, Stewart PM, et al. MicroRNA-24 is a novel regulator of aldosterone and cortisol production in the human adrenal cortex. Hypertension. (2013) 62:572–8. doi: 10.1161/HYPERTENSIONAHA.113.01102
50. Romero DG, Plonczynski MW, Carvajal CA, Gomez-Sanchez EP, Gomez-Sanchez CE. Microribonucleic acid-21 increases aldosterone secretion and proliferation in H295R human adrenocortical cells. Endocrinology. (2008) 149:2477–83. doi: 10.1210/en.2007-1686
51. Wilson C, Zhang X, Buckley C, Heathcote HR, Lee MD, McCarron JG. Increased vascular contractility in hypertension results from impaired endothelial calcium signaling. Hypertension. (2019) 74:1200–14. doi: 10.1161/HYPERTENSIONAHA.119.13791
52. Wu J, Zheng C, Wang X, Yun S, Zhao Y, Liu L, et al. MicroRNA-30 family members regulate calcium/calcineurin signaling in podocytes. J Clin Invest. (2015) 125:4091–106. doi: 10.1172/JCI81061
53. Aurora AB, Mahmoud AI, Luo X, Johnson BA, Van Rooij E, Matsuzaki S, et al. MicroRNA-214 protects the mouse heart from ischemic injury by controlling Ca2+ overload and cell death. J Clin Invest. (2012) 122:1222–32. doi: 10.1172/JCI59327
Keywords: hypertension, microRNA, blood pressure, cardiovascular, non-coding, sub-Saharan Africa
Citation: Matshazi DM, Weale CJ, Erasmus RT, Kengne AP, Davids SFG, Raghubeer S, Hector S, Davison GM and Matsha TE (2021) MicroRNA Profiles in Normotensive and Hypertensive South African Individuals. Front. Cardiovasc. Med. 8:645541. doi: 10.3389/fcvm.2021.645541
Received: 23 December 2020; Accepted: 23 March 2021;
Published: 16 April 2021.
Edited by:
BuChun Zhang, University of Science and Technology of China, ChinaReviewed by:
Valdo Jose Dias Da Silva, Universidade Federal do Triângulo Mineiro, BrazilElisa Cairrão, Universidade da Beira Interior, Portugal
Copyright © 2021 Matshazi, Weale, Erasmus, Kengne, Davids, Raghubeer, Hector, Davison and Matsha. This is an open-access article distributed under the terms of the Creative Commons Attribution License (CC BY). The use, distribution or reproduction in other forums is permitted, provided the original author(s) and the copyright owner(s) are credited and that the original publication in this journal is cited, in accordance with accepted academic practice. No use, distribution or reproduction is permitted which does not comply with these terms.
*Correspondence: Don M. Matshazi, bWF0c2hhemlkQGdtYWlsLmNvbQ==; Tandi E. Matsha, bWF0c2hhdEBjcHV0LmFjLnph; dGFuZGltYXRzaGFAZ21haWwuY29t