 Ziwei Chen
 Jing He2†
- 1Department of Cardiology, Affiliated Hospital of Nantong University, Nantong, China
- 2Department of Oncology, Affiliated Hospital of Nantong University, Nantong, China
Objective: The study aims to investigate the association of total bilirubin with all-cause and cause-specific mortality in the general population.
Methods: A total of 37,234 adults from the United States National Health and Nutrition Examination Survey 1999–2014 were enrolled. Baseline levels of total bilirubin associated with risk of mortality were evaluated on a continuous scale (restricted cubic splines) and by quartile categories with Cox regression models.
Results: Higher levels of total bilirubin was positively associated with an increased risk of all-cause mortality [hazard ratio (HR) 1.59, 95% confidence interval (CI) 1.46–1.72; p < 0.001]. Compared with individuals with the lowest quartile of bilirubin, the multivariable adjusted hazard ratio for all-cause mortality was 1.25 (1.14–1.37) for individuals in the highest quartile. Restricted cubic splines indicated that the association was non-linear in cardiovascular mortality and cancer mortality while linear in all-cause mortality.
Conclusions: Total bilirubin was associated with all-cause and cause-specific mortality in the general population.
Introduction
As an end product of heme degradation, bilirubin has antioxidant and anti-inflammatory effects (1). Animal experiments showed that bilirubin improved vascular dysfunction in atherosclerosis and myocardial infarction (2). Many studies have confirmed an inverse association of plasma bilirubin levels with the prognosis of many diseases, such as diabetes (3, 4), arteriosclerotic cardiovascular disease (5), and hypertension (6). The protective function can be explained by the anti-oxidative, anti-inflammatory, and anti-adipogenic roles of bilirubin, making bilirubin a potential therapeutic target (7).
However, studies on the association between bilirubin levels and the risk of mortality have provided conflicting results. Previous studies have suggested bilirubin to be a protective marker in cardiovascular diseases (8, 9) and cancer (10), showing an inverse relationship. Some studies reported that increased bilirubin was a risk factor of mortality in patients with ischemic heart failure (11), stroke (12), or traumatic brain injury patients (13). In addition, total bilirubin levels were found to be associated with cardiovascular mortality in an L-shaped or U-shaped relationship (14, 15).
Moreover, there was a lack of studies on the association between total bilirubin levels and all-cause mortality in the general population. Therefore, we examined the association of total bilirubin levels with all-cause and cause-specific mortality. We also investigated whether such associations were linear.
Methods
Study Population
The study included individuals from the National Health and Nutrition Examination Survey (NHANES) between the period of 1999–2014, a nationwide cross-sectional survey conducted by the Center for Disease Control and Prevention (CDC) in the United States (16). After excluding participants with missing total bilirubin data (n = 30,307) at baseline, 51,784 participants were available. Participants with age <18 (n = 9,720), cancer or pregnancy (n = 4,780), and unavailable mortality status (n = 48) were further excluded. Finally, 37,234 participants were enrolled in our study. Figure 1 depicted the selection process. All participants provided written informed consent and the protocol was approved by NCHS Research Ethics Review Board (Protocol #98-12, Protocol #2005–06, and Protocol #2011–17).

Figure 1. The flow chart of participant selection.
Endpoints
The primary outcome was all-cause mortality while the secondary outcomes included death from cardiac-specific and cancer-specific disease. Mortality status was obtained by linkage to the National Death Index by December 31, 2015. Cardiac-specific disease was defined as ICD-10 codes I00-I09, I11, I13, or I20-I51. Cancer-specific disease was defined as ICD-10 codes C00-C97.
Covariates' Collection
Serum bilirubin levels were measured using a timed-endpoint Diazo method across all individuals. Briefly, bilirubin reacts with diazo reagent in the presence of caffeine, benzoate, and acetate as accelerators to form azobilirubin. The system monitors the change in absorbance at 520 nm at a fixed-time interval. This change in absorbance is directly proportional to the concentration of total bilirubin in the sample.
Information on age, gender, race, education, poverty income ratio (PIR), drinking, smoking, physical activity, medical history (hypertension, diabetes, and cardiovascular diseases), medications (antihypertensive drugs, hypoglycemic drugs, and lipid-lowering drugs) were available. Alanine aminotransferase (ALT), aspartate aminotransferase (AST), albumin, cholesterol, triglycerides, high density lipoprotein (HDL), low density lipoprotein (LDL), and C-reactive protein (CRP) were obtained and measured by standard biochemistry assays. ALT and AST were measured using an enzymatic rate method. Albumin was measured using a biochromatic digital endpoint method. Cholesterol was measured using a timed-endpoint method. Triglycerides and LDL were measured enzymatically using Roche Modular P chemistry analyzer. HDL was measured using a direct immunoassay method. CRP was measured using a latex-enhanced nephelometry method. The details of laboratory methodology are available at https://wwwn.cdc.gov/Nchs/Nhanes/2013-2014/BIOPRO_H.htm. Body mass index (BMI) was calculated as weight in kilograms divided by the square of height in meters. Race was classified as non-Hispanic white, non-Hispanic black, Mexican American, other Hispanic, or others. Education level was categorized as less than high school, high school, college or equivalent, or above. Poverty income ratio (PIR) was stratified as <1, 1–3, and>3. Smoking status was defined as current, past, and never. Physical activity status was classified as vigorous, moderate, and inactive. The estimated glomerular filtration rate (eGFR) was calculated according to the Chronic Kidney Disease-Epidemiology Collaboration (CKD-EPI) equation (17). Hypertension was defined as a history of hypertension or blood pressure ≥140/90 mm Hg or taking anti-hypertensive medications. Diabetes was defined as a history of diabetes or fasting glucose >7 mmol/L or glycated hemoglobin A1c >6.5% or use of hypoglycemic medication. Cardiovascular disease (CVD) was defined as self-reported congestive heart failure, coronary heart disease, angina pectoris, heart attack, and stroke (18). The participant was recorded as having CVD if she/he answered “yes” to the following question: “Has a doctor or other health professional ever told you that you had congestive heart failure/coronary heart disease/angina pectoris/stroke?” in a validated questionnaire (https://wwwn.cdc.gov/Nchs/Nhanes/2013-2014/MCQ_H.htm). Multiple imputation using predictive mean matching (PMM) was performed for covariates with missing values.
Statistical Analysis
Descriptive statistics was presented according to the levels of bilirubin (Q1: ≤ 8.55 μmol/L; Q2: 8.55~11.97 μmol/L; Q3: 11.97~13.68 μmol/L; Q4: >13.68 μmol/L) and group differences were explored by one-way analysis of variance and chi-square tests. Associations between levels of bilirubin and the risk of all-cause and specific-cause mortality were estimated by multivariate Cox regression models with 95% confidence intervals. Model 1 was adjusted for age and gender. Model 2 was adjusted for age, gender, education level, race, PIR, BMI, smoker, drinking, physical activity, hypertension, diabetes, anti-hypertensive drug, hypoglycemic drug, and lipid-lowering drug. Model 3 was adjusted for age, gender, education level, race, PIR, BMI, smoker, drinker, physical activity, hypertension, diabetes, CVD, anti-hypertensive drug, hypoglycemic drug, lipid-lowering drug, ALT, AST, cholesterol, triglycerides, HDL, LDL, CRP, and eGFR. The associations between levels of bilirubin and all endpoints were evaluated on a continuous scale with restricted cubic spline curve with 3 knots (0.10, 0.50, and 0.90, respectively) based on the Cox proportional hazards models. The critical point of the bilirubin was chosen based on the hazard ratio equal to one. Subgroup analyses were conducted to examine whether the investigated associations between bilirubin and all-cause mortality were modified by age, gender, diabetes, hypertension, and cardiovascular diseases based on the fully adjusted multivariable regression model with interactions between bilirubin and stratified covariates. R software version 3.6.0 was used for all the statistical analyses, and a p < 0.05 was considered significant.
Results
The baseline characteristics of the study population according to bilirubin quartiles were shown in Table 1. The highest quartile tended to be older, male, and had increased levels of ALT and AST. However, triglycerides decreased with increasing bilirubin concentration. The lowest bilirubin concentration had a higher percentage of hypertension and diabetes while a lower percentage of CVD.
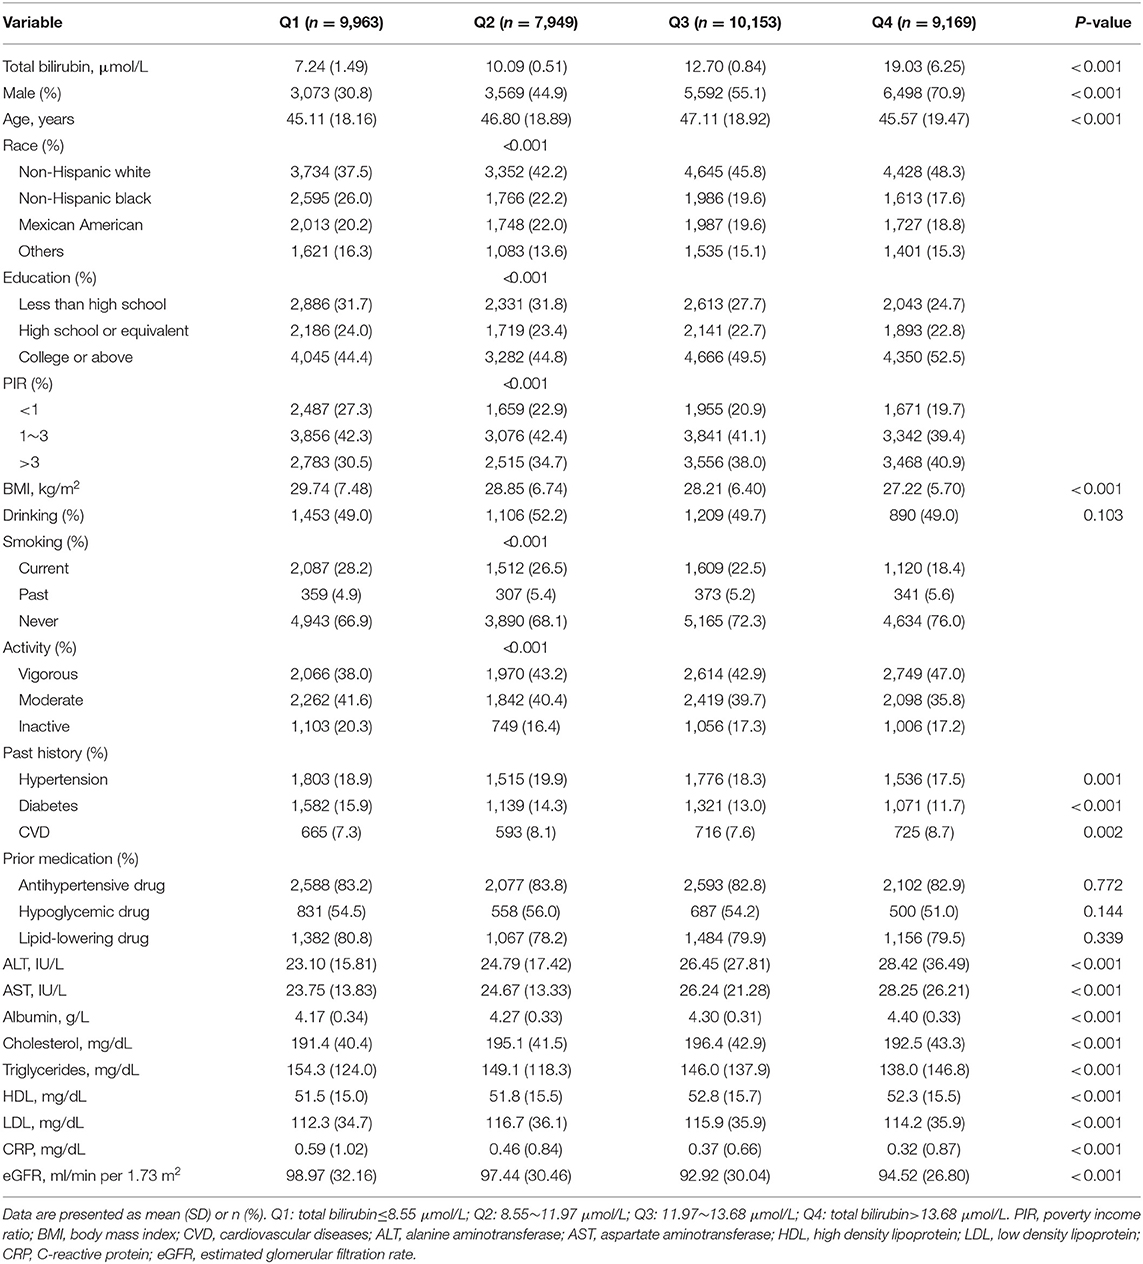
Table 1. Characteristics of the study population.
As shown in Table 2, after adjusting for demographics, lifestyles, medical history, and biochemical index, total bilirubin was positively associated with all-cause mortality [HR 1.59, 95% CI (1.46–1.72), p < 0.001]. When compared with the lowest quartile of participants (total bilirubin ≤ 8.55 μmol/L), the multivariable adjusted HR for all-cause mortality was 1.25 [95% CI (1.14, 1.37), p < 0.001] for individuals with total bilirubin>13.68 μmol/L. Also, an increased risk of cardiovascular mortality [HR 1.53, 95% CI (1.26, 1.85), p < 0.001] and cancer mortality [HR 1.44, 95%CI (1.20, 1.74), p < 0.001] were also seen at higher bilirubin levels.
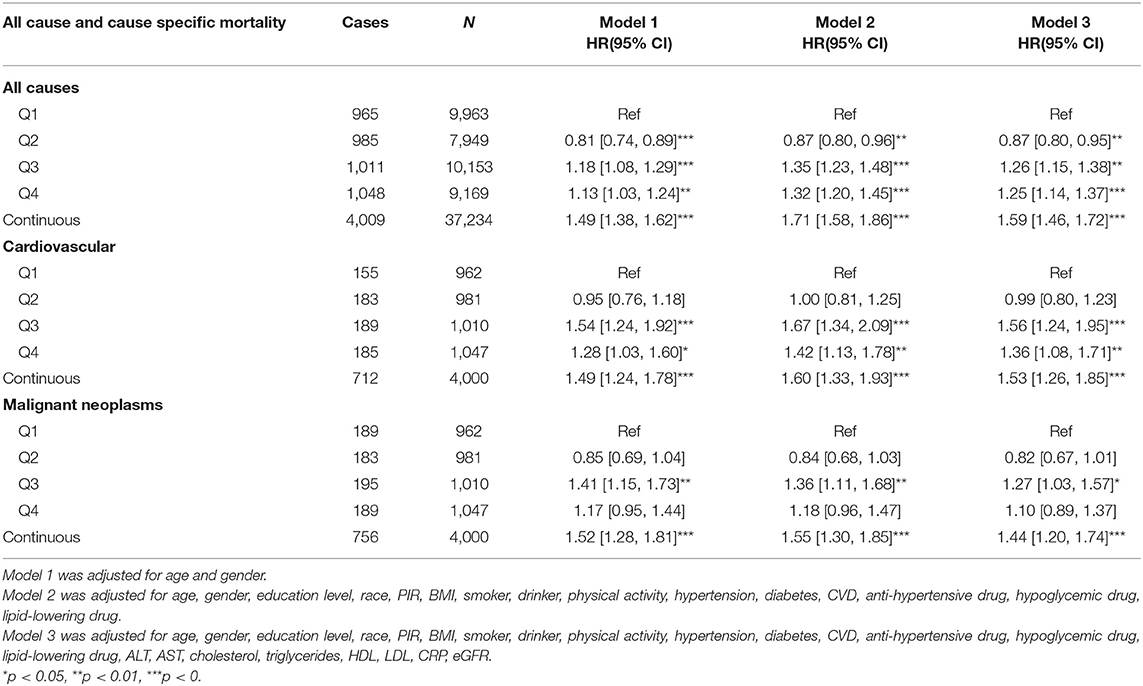
Table 2. Association of total bilirubin with all-cause and cause-specific mortality.
A non-linear relationship was explored using restricted cubic splines regression. Total bilirubin levels were linearly associated with the higher risk of all-cause mortality (Figure 2A; p for non-linearity = 0.118). When the bilirubin concentration was <12.2 μmol/L (log12.2 = 2.5), the bilirubin showed a protective role. The association between bilirubin levels and the risk of cardiovascular and cancer mortality was non-linear. A range of 12.2–18.0 μmol/L was significantly associated with a high risk of cardiovascular mortality, while higher bilirubin levels were not (Figure 2B). However, the 95% confidence interval included the hazard ratio of 1.0 above the concentration of 12.2 μmol/L for cancer mortality (Figure 2C).
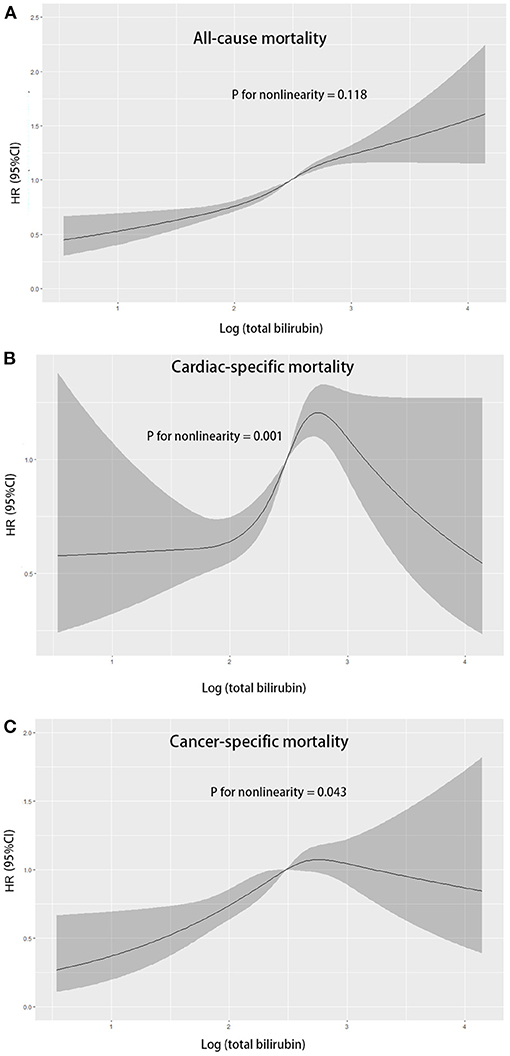
Figure 2. Multivariable adjusted hazard ratios for all-cause mortality (A), cardiovascular mortality (B), and cancer mortality (C) according to levels of total bilirubin levels on a continuous scale (log-transformed) in overall population. Solid blue lines are multivariable adjusted hazard ratios, with shadow lines showing 95% confidence intervals derived from restricted cubic spline regressions.
To observe significant interactions for association between total bilirubin with all-cause mortality, we stratified the individuals by age, gender, hypertension, diabetes, and cardiovascular diseases. Subgroup analysis (Table 3) showed that the association of total bilirubin with all-cause mortality was consistent across gender, age, high blood pressure, diabetes, and cardiovascular diseases groups. The association was more pronounced in individuals aged 65 or above [HR 1.66, 95% CI (1.49, 1.84), p for interaction = 0.045] or hypertension populations [HR 1.96, 95% CI (1.71, 2.24), p for interaction = 0.016].
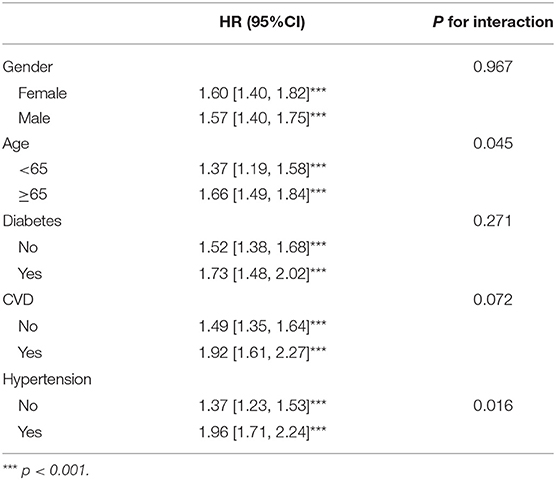
Table 3. Subgroup analysis of association of total bilirubin with all-cause mortality.
Discussion
In this large prospective study of 37,234 adults recruited from a nationally representative sample of the United States, our findings demonstrated that higher levels of bilirubin were independently associated with increased all-cause and cause-specific mortality. Such association remained significant across subgroups. Restricted cubic splines indicated that the association was non-linear in cardiovascular mortality and cancer mortality while it was linear in all-cause mortality.
Bilirubin is the end product of heme catabolism and has antioxidant and anti-inflammatory effects (19). However, our study found total bilirubin levels increased the risk of all-cause mortality. This is consistent with other previous studies (15, 20). A high risk of cardiovascular disease could contribute to increased mortality. In addition, subgroup analysis confirmed that a history of diabetes, cardiovascular diseases, and high blood pressure increased the risk of total bilirubin for all-cause mortality. In this regard, previous studies found that total bilirubin levels are positively associated with the severity of CAD in patients with STEMI or non-STEMI (21, 22).
However, several studies investigating the relation between levels of plasma bilirubin and the risk of all-cause mortality have found inverse association. HAPIEE cohort had supported the negative relationship between bilirubin and total mortality and cancer mortality (23). In a male Belgian population, high serum bilirubin within normal ranges was associated with lower all-cause and cancer mortality (24). A study that enrolled older adults from NHANES found that the association of total bilirubin levels with total mortality was the highest among those with a level between 0.1 and 0.4 mg/dl and it could not investigate whether higher total bilirubin levels were associated with a higher mortality risk (25). Our study had a large sample size of US adults with more representative bilirubin levels and our positive correlation remained consistent across gender. A large cohort study in the UK found a per 0.1-mg/dl increase in bilirubin level indicated a 3% decrease for mortality (26), but the bilirubin levels were lower compared with our study. A negative relationship was also found in particular populations, such as chronic hemodialysis patients (27) and diabetic patients (8). Some diseases could lead to the metabolism change of total bilirubin, thereby influencing the association.
Some possible explanations could exist. Firstly, a high level of bilirubin could be a reflection of increased oxidative stress and chronic inflammation response, which predicted poor prognosis. Secondly, high bilirubin levels cause cell toxicity and tissue injury. Thirdly, bilirubin was elevated in liver diseases, which contributed to the association with higher mortality risk. Finally, circulating bilirubin, as a surrogate biomarker of cardiac dysfunction and poor hepatic perfusion, could exert an effect on the blood pressure and other cardiovascular risk (28). However, these speculations require further investigation.
Our study has some limitations. First, some covariates were self-reported using validated questionnaires. Second, data on total bilirubin was only collected once at baseline, and it was unclear whether bilirubin changes over time could affect the association with mortality.
Conclusions
In summary, we found that high bilirubin levels were associated with an increased risk of all-cause, cardiovascular, and cancer mortality in US adults. It is favorable to control total bilirubin under 12.2 μmol/L.
Data Availability Statement
The original contributions generated for the study are included in the article/supplementary materials, further inquiries can be directed to the corresponding author/s.
Ethics Statement
The studies involving human participants were reviewed and approved by National Center for Health Statistics. The patients/participants provided their written informed consent to participate in this study.
Author Contributions
QL designed the study. ZC wrote the main manuscript. JH and CC prepared the figures and tables. All authors contributed to the article and approved the submitted version.
Conflict of Interest
The authors declare that the research was conducted in the absence of any commercial or financial relationships that could be construed as a potential conflict of interest.
Acknowledgments
This study was supported by the Municipal Natural Science Foundation of Nantong (Nos. MS22019004 and YYZ-16012).
References
1. Pineda S, Bang OY, Saver JL, Starkman S, Yun SW, Liebeskind DS, et al. Association of serum bilirubin with ischemic stroke outcomes. J Stroke Cerebrovasc Dis. (2008) 17:147–52. doi: 10.1016/j.jstrokecerebrovasdis.2008.01.009
2. Bulmer AC, Bakrania B, Du Toit EF, Boon AC, Clark PJ, Powell LW, et al. Bilirubin acts as a multipotent guardian of cardiovascular integrity: more than just a radical idea. Am J Physiol Heart Circ Physiol. (2018) 315:H429–47. doi: 10.1152/ajpheart.00417.2017
3. Nano J, Muka T, Cepeda M, Voortman T, Dhana K, Brahimaj A, et al. Association of circulating total bilirubin with the metabolic syndrome and type 2 diabetes: a systematic review and meta-analysis of observational evidence. Diabetes Metab. (2016) 42:389–97. doi: 10.1016/j.diabet.2016.06.002
4. Zhu B, Wu X, Bi Y, Yang Y. Effect of bilirubin concentration on the risk of diabetic complications: a meta-analysis of epidemiologic studies. Sci Rep. (2017) 7:41681. doi: 10.1038/srep41681
5. Lan Y, Liu H, Liu J, Zhao H, Wang H. Is serum total bilirubin a predictor of prognosis in arteriosclerotic cardiovascular disease? A meta-analysis. Medicine. (2019) 98:e17544. doi: 10.1097/MD.0000000000017544
6. Liu M, Li Y, Li J, Lv X, He Y. Elevated serum total bilirubin levels are negatively associated with major diabetic complications among Chinese senile diabetic patients. J Diabetes Complications. (2017) 31:213–7. doi: 10.1016/j.jdiacomp.2016.08.023
7. Novak P, Jackson AO, Zhao GJ, Yin K. Bilirubin in metabolic syndrome and associated inflammatory diseases: new perspectives. Life Sci. (2020) 257:118032. doi: 10.1016/j.lfs.2020.118032
8. Chen SC, Lin CP, Hsu HC, Shu JH, Liang Y, Hsu PF, et al. Serum bilirubin improves the risk predictions of cardiovascular and total death in diabetic patients. Clin Chim Acta. (2019) 488:1–6. doi: 10.1016/j.cca.2018.10.028
9. Schwertner HA, Jackson WG, Tolan G. Association of low serum concentration of bilirubin with increased risk of coronary artery disease. Clin. Chem. (1994) 40:18–23. doi: 10.1093/clinchem/40.1.18
10. Sun H, He B, Nie Z, Pan Y, Lin K, Peng H, et al. A nomogram based on serum bilirubin and albumin levels predicts survival in gastric cancer patients. Oncotarget. (2017) 8:41305–18. doi: 10.18632/oncotarget.17181
11. Frikha Z, Ferreira JP, Bozec E, McMurray JJV, Pitt B, Dickstein K, et al. Relation of high serum bilirubin to short-term mortality following a myocardial infarction complicated by left ventricular systolic dysfunction (from the high-risk myocardial infarction database initiative). Am J Cardiol. (2018) 121:1015–20. doi: 10.1016/j.amjcard.2018.01.012
12. Luo Y, Li J, Zhang J, Xu Y. Elevated bilirubin after acute ischemic stroke linked to the stroke severity. Int J Dev Neurosci. (2013) 31:634–8. doi: 10.1016/j.ijdevneu.2013.08.002
13. Wang R, He M, Xu J. Serum bilirubin level correlates with mortality in patients with traumatic brain injury. Medicine. (2020) 99:e21020. doi: 10.1097/MD.0000000000021020
14. Horsfall LJ, Nazareth I, Petersen I. Cardiovascular events as a function of serum bilirubin levels in a large, statin-treated cohort. Circulation. (2012) 126:2556–564. doi: 10.1161/CIRCULATIONAHA.112.114066
15. Troughton JA Woodside JV Young IS Arveiler D Amouyel P Ferrieres J. Bilirubin and coronary heart disease risk in the prospective epidemiological study of myocardial infarction (PRIME). Eur J Cardiovasc Prev Rehabil. (2007) 14:79–84. doi: 10.1097/01.hjr.0000230097.81202.9f
16. Johnson CL, Dohrmann SM, Burt VL, Mohadjer LK. National health and nutrition examination survey: sample design, 2011–2014. Vital Health Stat 2. (2014) 1–33.
17. Levey AS, Stevens LA, Schmid CH, Zhang YL, Castro, 3rd AF, Feldman HI, et al. A new equation to estimate glomerular filtration rate. Ann Intern Med. (2009) 150:604–12. doi: 10.7326/0003-4819-150-9-200905050-00006
18. Zhang Y, Huang M, Zhuang P, Jiao J, Chen X, Wang J, et al. Exposure to acrylamide and the risk of cardiovascular diseases in the National Health and Nutrition Examination Survey 2003–2006. Environ Int. (2018) 117:154–63. doi: 10.1016/j.envint.2018.04.047
19. Brites D. Bilirubin injury to neurons and glial cells: new players, novel targets, newer insights. Semin Perinatol. (2011) 35:114–20. doi: 10.1053/j.semperi.2011.02.004
20. Gul M, Uyarel H, Ergelen M, Akgul O, Karaca G, Turen S, et al. Prognostic value of total bilirubin in patients with ST-segment elevation acute myocardial infarction undergoing primary coronary intervention. Am J Cardiol. (2013) 111:166–71. doi: 10.1016/j.amjcard.2012.09.011
21. Kaya MG, Sahin O, Akpek M, Duran M, Uysal OK, Karadavut S, et al. Relation between serum total bilirubin levels and severity of coronary artery disease in patients with non-ST-segment elevation myocardial infarction. Angiology. (2014) 65:245–9. doi: 10.1177/0003319713504820
22. Sahin O, Akpek M, Elcik D, Karadavut S, Simsek V, Tulmac M, et al. Bilirubin levels and the burden of coronary atherosclerosis in patients with STEMI. Angiology. (2013) 64:200–4. doi: 10.1177/0003319712440619
23. Vitek L, Hubacek JA, Pajak A, Dorynska A, Kozela M, Eremiasova L, et al. Association between plasma bilirubin and mortality. Ann Hepatol. (2019) 18:379–85. doi: 10.1016/j.aohep.2019.02.001
24. Temme EH, Zhang J, Schouten EG, Kesteloot H. Serum bilirubin and 10-year mortality risk in a Belgian population. Cancer Causes Control. (2001) 12:887–94. doi: 10.1023/A:1013794407325
25. Ong KL, Allison MA, Cheung BM, Wu BJ, Barter PJ, Rye KA. The relationship between total bilirubin levels and total mortality in older adults: the United States National Health and Nutrition Examination Survey (NHANES) 1999-2004. PLoS ONE. (2014) 9:e94479. doi: 10.1371/journal.pone.0094479
26. Horsfall LJ, Rait G, Walters K, Swallow DM, Pereira SP, Nazareth I, et al. Serum bilirubin and risk of respiratory disease and death. JAMA. (2011) 305:691–7. doi: 10.1001/jama.2011.124
27. Chen YH, Hung SC, Tarng DC. Serum bilirubin links UGT1A1*28 polymorphism and predicts long-term cardiovascular events and mortality in chronic hemodialysis patients. Clin J Am Soc Nephrol. (2011) 6:567–74. doi: 10.2215/CJN.06130710
Keywords: total bilirubin, oxidative stress, all-cause mortality, cause-specific mortality, National Health and Nutrition Examination Survey
Citation: Chen Z, He J, Chen C and Lu Q (2021) Association of Total Bilirubin With All-Cause and Cardiovascular Mortality in the General Population. Front. Cardiovasc. Med. 8:670768. doi: 10.3389/fcvm.2021.670768
Received: 22 February 2021; Accepted: 26 May 2021;
Published: 18 June 2021.
Edited by:
Mohsen Mazidi, King's College London, United KingdomReviewed by:
Dongfeng Zhang, Qingdao University, ChinaIrene R. Degano, Centro de Investigación Biomédica en Red en Enfermedades Cardiovasculares (CIBERCV), Spain
Copyright © 2021 Chen, He, Chen and Lu. This is an open-access article distributed under the terms of the Creative Commons Attribution License (CC BY). The use, distribution or reproduction in other forums is permitted, provided the original author(s) and the copyright owner(s) are credited and that the original publication in this journal is cited, in accordance with accepted academic practice. No use, distribution or reproduction is permitted which does not comply with these terms.
*Correspondence: Qi Lu, bHVxaW50QHNpbmEuY29t
†These authors have contributed equally to this work