Abstract
Background: There are substantial geographic disparities in the life expectancy (LE) across the U.S. with myocardial infarction (MI) contributing significantly to the differences between the states with highest (leading) and lowest (lagging) LE. This study aimed to systematically investigate the epidemiology of geographic disparities in MI among older adults.
Methods: Data on MI outcomes among adults aged 65+ were derived from the Center for Disease Control and Prevention-sponsored Wide-Ranging Online Data for Epidemiologic Research database and a 5% sample of Medicare Beneficiaries for 2000–2017. Death certificate-based mortality from MI as underlying/multiple cause of death (CBM-UCD/CBM-MCD), incidence-based mortality (IBM), incidence, prevalence, prevalence at age 65, and 1-, 3-, and 5-year survival, and remaining LE at age 65 were estimated and compared between the leading and lagging states. Cox model was used to investigate the effect of residence in the lagging states on MI incidence and survival.
Results: Between 2000 and 2017, MI mortality was higher in the lagging than in the leading states (per 100,000, CBM-UCD: 236.7–583.7 vs. 128.2–357.6, CBM-MCD: 322.7–707.7 vs. 182.4–437.7, IBM: 1330.5–1518.9 vs. 1003.3–1197.0). Compared to the leading states, lagging states had higher MI incidence (1.1–2.0% vs. 0.9–1.8%), prevalence (10.2–13.1% vs. 8.3–11.9%), pre-existing prevalence (2.5–5.1% vs. 1.4–3.6%), and lower survival (70.4 vs. 77.2% for 1-year, 63.2 vs. 67.2% for 3-year, and 52.1 vs. 58.7% for 5-year), and lower remaining LE at age 65 among MI patients (years, 8.8–10.9 vs. 9.9–12.8). Cox model results showed that the lagging states had greater risk of MI incidence [Adjusted hazards ratio, AHR (95% Confidence Interval, CI): 1.18 (1.16, 1.19)] and death after MI diagnosis [1.22 (1.21, 1.24)]. Study results also showed alarming declines in survival and remaining LE at age 65 among MI patients.
Conclusion: There are substantial geographic disparities in MI outcomes, with lagging states having higher MI mortality, incidence, and prevalence, lower survival and remaining LE at age 65. Disparities in MI mortality in a great extent could be due to between-the-state differences in MI incidence, prevalence at age 65 and survival. Observed declines in survival and remaining LE require an urgent analysis of contributing factors that must be addressed.
Introduction
Myocardial infarction (MI) is a challenging clinical and public health problem among older adults in the United States (U.S.) (1, 2). MI is one of the most important risk factors for heart failure (HF) (3, 4) which contributes substantially to the geographic disparities in life expectancy (LE) (5), that have been observed for decades in the U.S. with the highest LE of 82.0 years in Hawaii and the lowest of 74.9 in Mississippi (data for 2017) (6). The underlying mechanisms of the disparities between the states with the highest and lowest LE (referred to in this text as “leading” and “lagging” states) are complex and not fully understood. Understanding the patterns of MI outcomes in states leading and lagging in LE provides additional opportunities for mitigating both MI and HF disparities.
MI occurs once every 40 seconds in the U.S., with an estimated annual incidence of 605,000 new cases and 200,000 recurrent cases (1, 2), and a prevalence of 3.0% for U.S. adults aged 20 years and older during 2013-2016 (1). MI is more prevalent among older adults with an average age of the first MI being 65.6 years for males and 72.0 years for females (1, 2). MI mortality in the U.S. was 27.0 per 100,000 in 2018 with highest rate being observed in Arkansas and the lowest in Alaska (7). Despite the well-studied sex and racial disparities (1, 8–10), factors contributing to geographic disparities in MI mortality are not fully understood. Due to the great improvements in MI treatment and management (4), a substantial declining trend of MI mortality has been observed in the past decades (1, 11); however, recent studies reported increasing mortality from ST segment Elevation MI (STEMI, one important subtype of MI) (12), mortality in MI patients with comorbidities (13, 14), as well as the post-discharge MI mortality (15, 16).
It is challenging to investigate the underlying mechanisms of the geographic disparities in MI mortality. Possible epidemiologic scenarios explaining the disparities may include the following: regions/states with higher MI mortality may also have (a) a higher MI incidence; (b) poorer survival of MI patients; and (c) higher pre-existing MI prevalence (i.e., at time the older adults are enrolled in the Medicare program) (17). These scenarios may work independently or together in contributing to geographic disparities in MI mortality across the U.S.
In this study, we aimed to investigate the epidemiology of the geographic disparities in MI outcomes (e.g., mortality, incidence, prevalence, survival, remaining LE at age 65) between states leading and lagging by LE, and discuss the underlying scenarios that may explain the disparities in MI mortality by analyzing data from death certificate and a 5% sample of Medicare Beneficiaries. We hypothesize that compared with the leading states, the lagging states may have worse MI outcomes (e.g., higher MI mortality, incidence, and prevalence, lower survival and remaining LE), and the three scenarios (i.e., pre-existing prevalence, incidence, survival) may all contribute to the MI mortality disparities. Findings of the study will provide evidence for health professionals, researchers and policy decision-makers to devise and implement interventions and health policies to reduce the geographic disparities of MI, and ultimately mitigate the LE gap across the U.S.
Materials and Methods
Data Source
Two data sources covering the 2000–2017 period were used in the study. First, data on death certificate-based mortality (CBM) were directly derived from the Wide-Ranging Online Data for Epidemiologic Research (WONDER) of the U.S. Center for Disease Control and Prevention (CDC) (18). Second, data on MI incidence-based mortality (IBM), incidence, prevalence, prevalence at age 65, survival after MI diagnosis, and remaining LE at age 65 among MI patients were derived from a 5% sample of over five million Medicare beneficiaries (both Part A and Part B) (19). Individuals whose Medicare coverage was <20% of their months were excluded. Patients who were coded as 410 and 411 in the International Classification of Disease, Ninth Revision (ICD-9), and I21–I22 and I24 in the ICD-10 were categorized as MI. The Medicare provides a good data source that is from a national representative sample of older adults aged 65+, covers the whole geographic regions in the U.S., and includes both morbidity and mortality indicators, enabling us to examine the geographic disparities of MI outcomes.
Ethics Approval
This is a secondary data analysis. All data analyses were designed and performed in accordance with the ethical standards of the responsible committee on human studies and with the Declaration of Helsinki (of 1975, revised in 2013), and have been approved by the Duke University Health System Institutional Review Board for Clinical Investigations (IRB FWA00009025).
Leading and Lagging States
To characterize the geographic disparities, the leading (i.e., Hawaii, Florida, Arizona, Connecticut, Minnesota, and Colorado, California and New York) and lagging (i.e., Arkansas, Tennessee, Louisiana, Oklahoma, Kentucky, Alabama, Mississippi, and West Virginia) states were selected based on the LE at age 65 (17). Among the leading states, New York and California were excluded from the analysis due to their higher heterogeneity in healthcare service and primarily urban regions.
Variable Measures
Death certificate-based mortality (CBM) from MI as the underlying cause of death (CBM-UCD) was computed based on the number of deaths immediately caused by MI, while CBM from MI as multiple cause of death (CBM-MCD) was computed based on the number of deaths by any causes with MI being one comorbidity. IBM was computed based on the number of all-cause deaths occurring in individuals with a prior MI diagnosis. MI incidence was defined based on the date of the earliest record with a primary diagnosis of MI if a second confirmatory record of MI appeared no later than 0.3 years afterwards (20). MI prevalence was defined based on an individual's diagnosis record of MI during a 12-month lookback period. MI prevalence at age 65 was estimated as the number of people with MI at age 65 divided by the respective total number of people at age 65 when they were enrolled in the Medicare program. One, 3 and 5-year survival rates were defined based on the date of death available in the Medicare records. Remaining LE at age 65 among MI patients were calculated based on the Medicare records of MI onset and death (21). Detailed computation of these variables can be found in the Supplementary Methods.
Statistical Analysis
The characteristics of the study sample can be found in Supplementary Table 1. The estimated CBMs, IBM, incidence, prevalence, prevalence at age 65, and survival rates after MI diagnosis and remaining LE at age 65 were age-standardized based on the U.S. 2000 standard population. The temporal trends of these MI outcomes were compared between the leading and lagging states. Sex- and race-specific trends were included in the Supplementary Materials (Supplementary Figures 1–5); 95% confidence intervals (CI) were used to compare the differences between leading and lagging states with no overlapping of the 95% CI indicating significant differences at p-value < 0.05.
To quantify the geographic disparities in MI incidence and survival after diagnosis, Cox proportional hazards model was used. The Cox models were analyzed for total sample and separately by sex- and race-specific groups, that was then further stratified by age groups (65–79 and 80+). In the Cox models for survival in the age group 80+, the analysis was further stratified by the age of diagnosis (65–79 and 80+). The Cox estimates for White and Black were included in the main results, and more detailed race-specific analysis (i.e., Hispanics, Asian, Native American, and other races) was shown in the Supplementary Materials (Supplementary Figure 6). Age was controlled in the incidence Cox model, and age of diagnosis was controlled in the survival Cox model. In the total sample model, both sex and race were controlled, while in the sex- and race-specific models, race and sex were controlled, respectively. The software SAS was used for all statistical analyses (Version 9.4, SAS Institute, Inc., Cary, NC).
Results
Characteristics of the Study Sample
In the leading states, the proportion of males did not change (ranging from 42.2% in 2000 to 45.6% in 2017), while the proportion of White and Black populations varied from 88.7% to 85.7%, and from 3.6% to 4.4% during the same period, respectively. In the lagging states, the proportion of males increased from 39.8% in 2000 to 44.5% in 2017, while the respective proportion for White and Black ranged from 84.5% to 84.1%, and from 12.0% to 11.5% (Supplementary Table 1).
Certificate-Based Mortality
The MI CBM-UCD (1/100,000) in the lagging states declined from 583.7 in 2000 to 236.7 in 2017, significantly higher than that in the leading states, which ranged from 357.6 to 128.2 during the same study period (Figure 1A). The CBM-MCD (1/100,000) in the lagging states declined from 707.7 in 2000 to 322.7 in 2017, significantly higher than that in the leading states which ranged from 437.7 to 182.4 (Figure 1B). The between-the-state difference was narrowing with time.
Figure 1
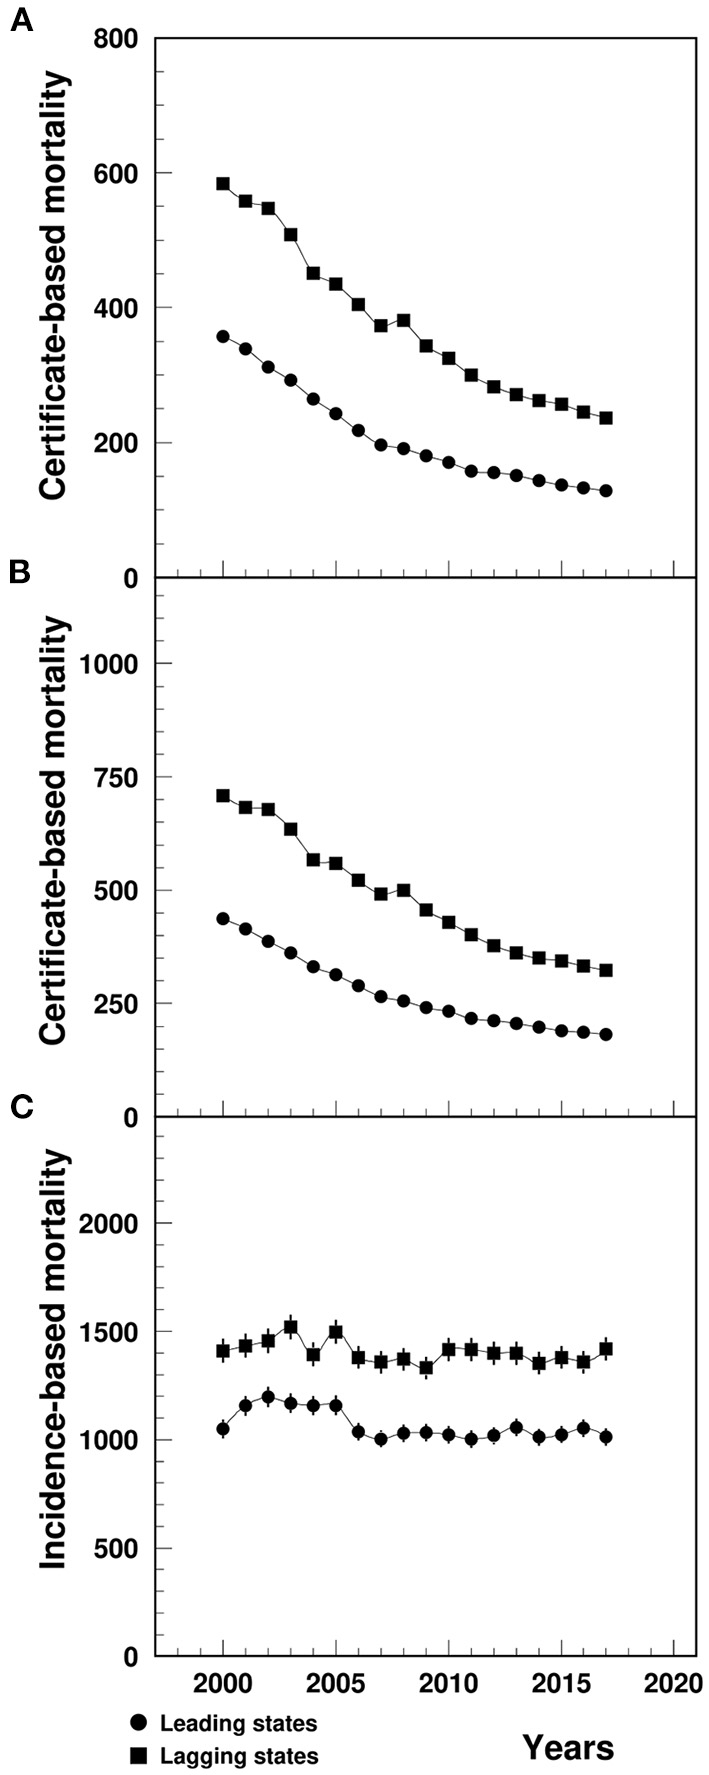
Temporal trend of CBM-UCD (A), CBM-MCD (B) and IBM (C) (1/100,000) of MI among patients aged 65+ in the U.S. leading and lagging states. CBM-UCD, Certificate-based mortality from MI as underlying cause of death, CBM-MCD, Certificate-based mortality from MI as the multiple cause of death, IBM, Incidence-based mortality, MI, Myocardial infarction. Note: 1Data for (A,B) were derived from CDC WONDER, and data for (C) were derived from 5% Medicare Beneficiaries. The 95%CI were too small to show up in the CBM plots (A,B).
Incidence-Based Mortality
The MI IBM (1/100,000) in the lagging states varied from 1409.6 in 2000 to 1419.1 in 2017, significantly higher than that in the leading states ranged from 1050.4 in 2000 to 1012.1 in 2017 (Figure 1C).
MI Incidence
The MI incidence in the lagging states declined from 2.0% in 2000 to 1.2% in 2017, significantly higher than that in the leading states (varying from 1.8 to 0.9%) (Figure 2).
Figure 2
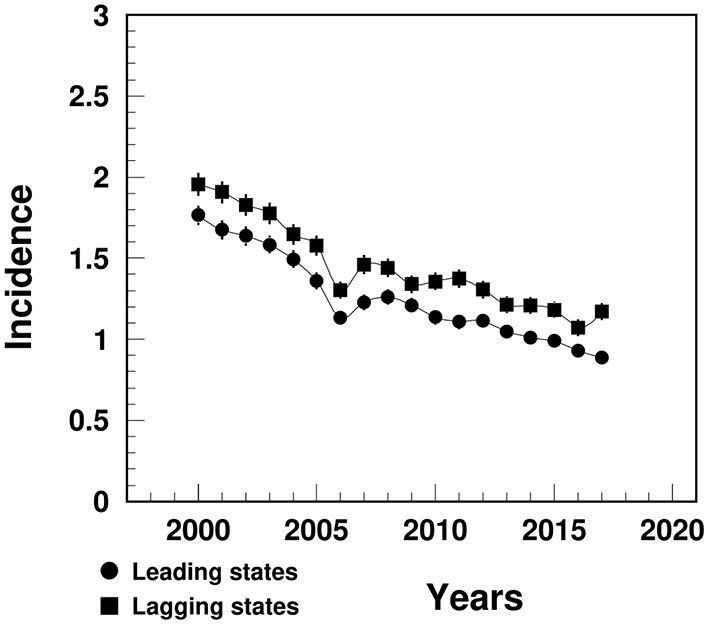
Temporal trend of MI incidence (%) among people aged 65+ in the U.S. leading and lagging states. Note: 1Data were derived from 5% Medicare Beneficiaries. 2The sudden decline in 2005–2006 that mainly occurred among females could potential be contributed from the Medicare Policy change (https://www.liebertpub.com/doi/10.1089/jwh.2012.3777).
MI Prevalence
The MI prevalence in the lagging states increased from 11.7% in 2000 to 13.1% in 2005, followed by a decline to 10.2% in 2017, significantly higher than the similar trend in the leading states (varying from 11.2 to 8.4%) (Figure 3A). The between-the-state difference was widening over time.
Figure 3
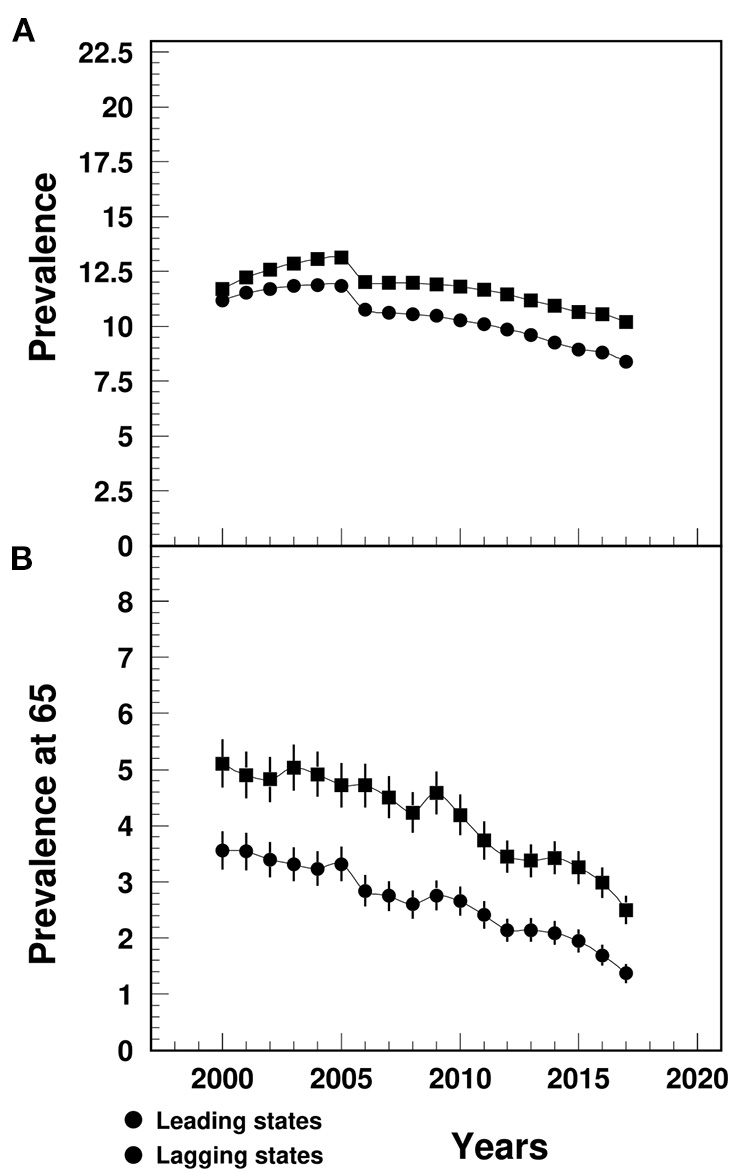
Temporal trend of MI prevalence (A) among people aged 65+ and prevalence at age 65 (B) (%) in the U.S. leading and lagging states. Note: 1Data were derived from 5% Medicare Beneficiaries. 2The sudden decline in 2005–2006 that mainly occurred among females could potential be contributed from the Medicare Policy change (https://www.liebertpub.com/doi/10.1089/jwh.2012.3777). 3The 95%CI bars in (A) were too small to show up in the plot.
The MI prevalence at age 65 in the lagging states declined from 5.1% in 2000 to 2.5% in 2017, that was significantly higher than the leading states (ranging from 3.6 to 1.4%) (Figure 3B). The between-the-state difference declined since 2009.
Survival After MI Diagnosis
The survival rates after a MI diagnosis in the lagging states were significantly lower compared to the leading states for 1-year (varying from 76.4% in 2000 to 70.4% in 2016 vs. 83.7 to 77.2%), 3-year (from 64.1% in 2000 to 63.2% in 2014 vs. 72.9 to 67.2%) and 5-year survival (from 53.3% in 2000 to 52.1% in 2012 vs. 63.1 to 58.7%) (Figure 4).
Figure 4
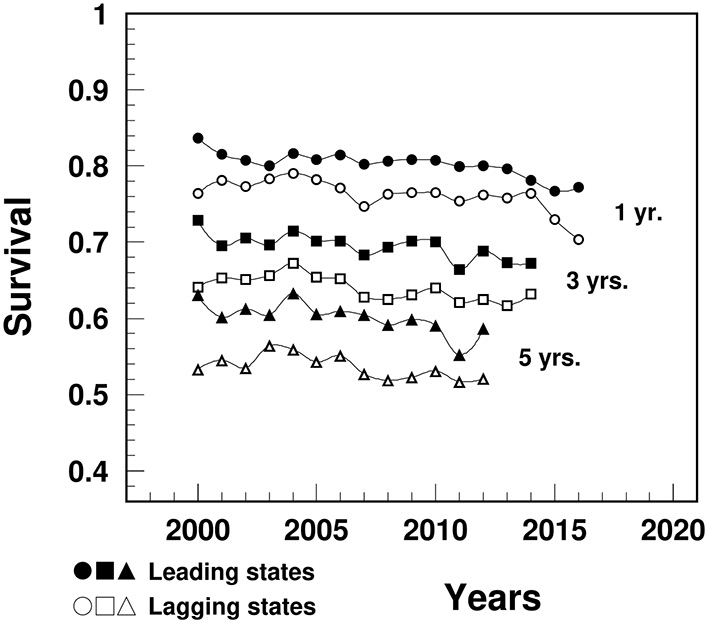
Temporal trend of 1-, 3-, and 5-year survival after a MI diagnosis among people aged 65+ in the U.S. leading and lagging states. Note: Data were derived from 5% sample of Medicare Beneficiaries.
Life Expectancy at Age 65
The remaining LE at age 65 (years) among MI patients in the lagging states decreased from 10.5 in 2000 to 8.9 in 2017, significantly lower than the leading states (ranged from 12.8 to 9.9) (Figure 5). The remaining LE gap between MI and non-MI patients widened in the lagging states from 6.3 in 2000 to 8.9 in 2017, narrower than the gap in the leading states (from 6.3 to 10.0).
Figure 5
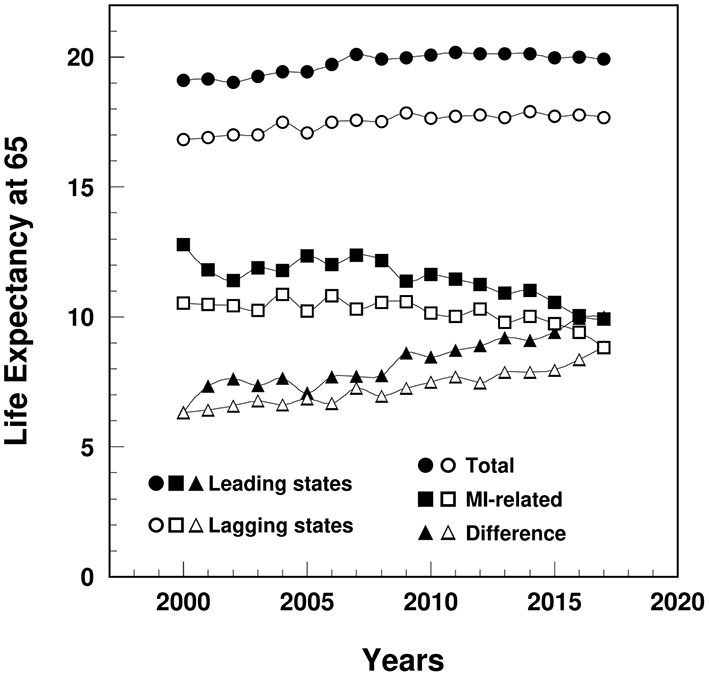
Temporal trend of remaining life expectancy at age 65 (years) among MI patients and non-MI patients and their gap in the leading and lagging states. Note: Data were derived from 5% sample of Medicare Beneficiaries.
Effects of Residence in the Lagging States
Results from Cox model (Figure 6) showed that old adults living in the lagging states had greater risk of MI incidence than their counterparts from the leading states [Adjusted Hazards Ratio, AHR (95% Confidence Interval, CI)]: 1.18 (1.16, 1.19) for total sample, 1.18 (1.16, 1.20) for males, 1.17 (1.15, 1.19) for females, 1.19 (1.18, 1.21) for White, but not for Blacks 0.99 (0.94, 1.05). Compared with people aged 80+, individuals aged <80 had more pronounced between-the-state differences in the risk of MI incidence [1.25 (1.23, 1.27) vs. 1.05 (1.03, 1.08) for total sample].
Figure 6
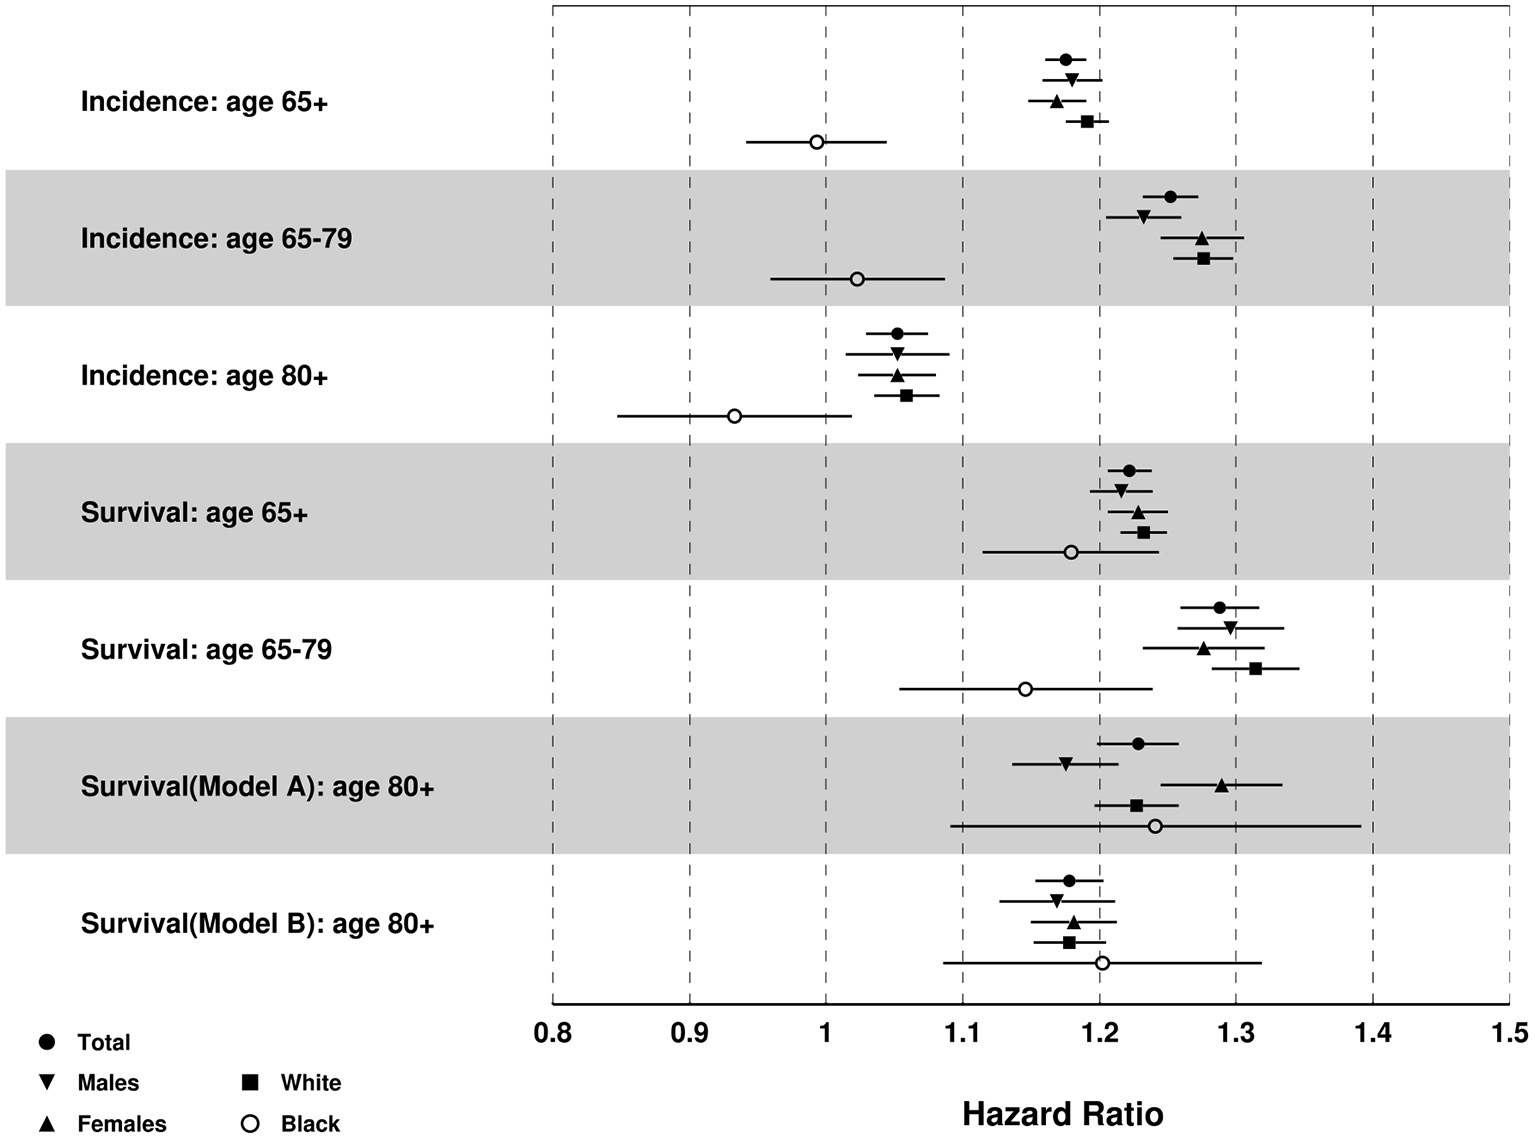
Results of multivariate Cox proportional hazards regression for MI incidence and death after MI diagnosis: Adjusted hazards ratio (HR) [95% CI] of lagging vs. leading states. Note: Age was controlled for incidence, and age of diagnosis was controlled for survival after MI diagnosis.
Results in Figure 6 also showed that old adults in the lagging states had greater risk of death after MI diagnosis [AHR (95%CI)]: 1.22 (1.21, 1.24) for total sample, 1.22 (1.19, 1.24) for males, 1.23 (1.21, 1.25) for females, 1.23 (1.22, 1.25) for White, and 1.18 (1.12, 1.25) for Black population. Individuals aged <80 also showed greater between-the-state differences in the risk of death after MI diagnosis than those aged 80+: 1.29 (1.26, 1.32) for individuals aged 65–79 years old, 1.23 (1.20, 1.26) for individuals aged 80+ and age of MI diagnosis <80, and 1.18 (1.15, 1.20) for individuals age 80+ and age of MI diagnosis 80+.
Cox model results for other races showed similar results with the total sample except that Hispanics in the lagging states had lower incidence than the leading states [0.71 (0.56, 0.89)] (Supplementary Figure 6).
Discussion
This study found that compared with the states leading by LE, lagging states had substantially higher MI mortality, incidence, prevalence, as well as lower survival and remaining LE at age 65. Most of the mortality disparities were due to the between-the-state differences in MI incidence, pre-existing prevalence at age 65, and survival. Higher MI mortality rates in the lagging states are consistent with previous studies showing the U.S. East and West South Central regions having higher mortality from MI (22, 23). In our study, all three scenarios (incidence, survival, and pre-existing prevalence) contributed substantially to the geographic disparities in MI mortality. Higher MI incidence rates in the lagging states are consistent with other studies (22) and may be attributable to the higher prevalence of risk factors including, but not limited to, hypertension, stroke, angina, diabetes and mental health problems (24), obesity (25), cigarettes smoking (26), and physical inactivity (27), with the impacts of these risk factors on MI incidence varying by geographic region (28–30). The prevalence of MI at age 65 (when older U.S. adults are enrolled in the Medicare program), was also higher in the lagging states and suggested early onset of MI in the lagging states. It is consistent with data from the Behavioral Risk Factor Surveillance System (BRFSS) studies that showed higher prevalence of MI at ages younger than 65 in the lagging states (31) potentially associated with higher prevalence of MI risk factors in the lagging states among younger adults (24–27, 32). Finally, observed lower survival rates after MI diagnosis and lower remaining LE at age 65 among MI patients may be explained by earlier MI onset (31), lower rate of cardiac rehabilitation (33), worse nursing home performance (34), lower adherence to medication intake for arterial hypertension and cholesterol-lowering (35), and longer pre-hospital time to the percutaneous coronary intervention (PCI) centers (36) in the lagging states.
Higher MI mortality among males and in the Black population could be associated with lower survival in these two groups (8), while greater geographic disparities in MI incidence among Whites than Blacks could be associated with greater race-specific between-the-state differences in the prevalence of risk factors (37). Higher incidence of MI in the leading states could be due to the higher prevalence of risk factors among Hispanics in the leading states (37, 38) or the possible underdiagnosis of MI in the lagging states, that is attributable to the lower access to health care and lower coverage of health insurance among Hispanics in these LE lagging states (39).
Older adults aged 65–79 years had more pronounced between-the-state differences in MI incidence than people aged 80+. This can be explained by the fact that people with MI risk factors may not be able to survive to age 80, thus leading to greater between-the-state differences in prevalence of risk factors in people aged 65–79 (31). It is also likely that more MI patients aged 65–79 would die in the lagging states compared to the leading states. Thus, after passage of high-risk MI patients before age 80 (more cases died in the lagging states), the remaining MI patients in both states may show less geographic differences in the risk of death (40).
Both leading and lagging states had consistently declining trends of MI mortality (i.e., CBMs) that were consistent with some other studies (11, 24), while IBM for MI entered a plateau stage in recent years. The decade-long declines in CBMs may be attributable to the advances and improvements in MI and other heart diseases treatment and management [e.g., the emergency reperfusion of ischemic myocardium (41), PCI treatment (14), enhancements in timeliness of emergency medical systems (42)].
Compared with the data from death certificates (i.e., CBMs), IBM, estimated based on administrative Medicare data, may be more sensitive to earlier detection of the change of mortality since it contains additional information regarding the disease morbidity. The recent decade-long plateau stage in IBM may be mainly attributed to the dynamics in incidence and survival. The decade-long declines in incidence, consistent with previous studies (24, 43), may be attributable to the improvements in primary prevention efforts, including lifestyle alternation and pharmacological interventions (44), and improved awareness, treatment and control of cardiovascular disease risk factors (45, 46). We also observed a sudden dip in MI incidence and prevalence during 2005–2006 among females, that may be related to the “Welcome to Medicare” visit (WMV) effective on January 1, 2005 (47). In the WMV, women will receive additional breast and cervical cancer screening test. Thus, more females would join the Medicare program, leading to a greater total female population with smaller incidence and prevalence. Another reason may be the introduction of Medicare Part D in 2006 where more females were enrolled than males (48).
One alarming finding of the study was the recent declines in survival, which was also corresponding to the declines in remaining LE among MI patients. The declining survival may be attributed to, at least in part, the reduced length of hospital stay (49, 50), that followed by less-than-optimal self-management of MI (51) and inadequate post-discharge management of the increasing MI complications and comorbidities (50, 52, 53), as well as the increases in mortalities from non-cardiovascular diseases after hospital discharge among older MI patients (16).
Another potential cause of the declining survival is the Hospital Readmissions Reduction Program (HRRP) that aims to encourage hospitals to improve the quality of health care, and in turn, to reduce the readmission rates. HRRP was discussed during 2007–2009, announced in 2010 and implemented in 2012 that imposes Medicare payment penalties on hospitals with higher-than-expected readmission rate (54). Three diseases were initially covered in HRRP, including acute MI, heart failure and pneumonia. However, previous studies indicated that MI mortality did not significantly increase corresponding to the HRRP (55–58). Since mortality contains information from multiple components (e.g., incidence, survival), it is not as sensitive as survival to reflect the change as shown in this study. If the causal relationship between the HRRP and declining survival can be confirmed, urgent actions are needed to amend the respective policy.
Limitations
Due to the unavailability of Medicare data for detailed subtypes of MI [e.g., STEMI, non-ST elevation MI (NSTEMI)], cautions are needed when generalizing the geographic differences and temporal trend of MI overall shown in the study to individual subtypes of MI. Electronic health records with more detailed MI subtype information will be used in the future studies to differentiate the distinct pattern of geographic disparities and temporal trends of MI subtypes, and to identify the core subtype to be intervened.
Conclusion
There are substantial geographic disparities in MI outcomes across the U.S. with the lagging states having higher mortality, incidence, and prevalence, lower survival and remaining LE among older adults. The disparities in MI mortality were mainly attributable to the between-the-state differences in MI incidence, pre-existing prevalence at age 65, and survival after MI diagnosis. We also observed alarming declining trends in survival and remaining LE among MI patients that may suggest the potential increase in mortality, underscoring the urgent need of investigation of contributing factors that must be addressed.
Funding
The work was supported by the National Institute on Aging (#: R01-AG057801). The sponsors had no role in the design and conduct of this study.
Publisher's Note
All claims expressed in this article are solely those of the authors and do not necessarily represent those of their affiliated organizations, or those of the publisher, the editors and the reviewers. Any product that may be evaluated in this article, or claim that may be made by its manufacturer, is not guaranteed or endorsed by the publisher.
Statements
Data availability statement
The data analyzed in this study is subject to the following licenses/restrictions: Data were obtained from Centers for Medicare & Medicaid Services that contain personally identifiable information under a data use agreement. These data are currently stored on a secure server at the Duke University. Requests to access these datasets should be directed to Centers for Medicare & Medicaid Services (https://www.cms.gov/).
Ethics statement
The studies involving human participants were reviewed and approved by Duke University Health System Institutional Review Board. Written informed consent for participation was not required for this study in accordance with the national legislation and the institutional requirements.
Author contributions
BY, IA, and JK contributed to the conception and design of the study. IA performed the statistical analyses. BY wrote the first draft of the manuscript. IA, AY, and JK reviewed and improved the manuscript. All authors read and approved the submitted version.
Conflict of interest
The authors declare that the research was conducted in the absence of any commercial or financial relationships that could be construed as a potential conflict of interest.
Supplementary material
The Supplementary Material for this article can be found online at: https://www.frontiersin.org/articles/10.3389/fcvm.2021.707102/full#supplementary-material
References
1.
Virani SS Alonso A Benjamin EJ Bittencourt MS Callaway CW Carson AP et al . Heart disease and stroke statistics-2020 update: a report from the american heart association. Circulation. (2020) 141:e139–596. 10.1161/CIR.0000000000000746
2.
Atherosclerosis Risk in Communities (ARIC) Study . Community Surveillance component, 2005–2014. (2020). Available online at: https://sites.cscc.unc.edu/aric/ (accessed September 13, 2020).
3.
Thygesen K Alpert JS Jaffe AS Chaitman BR Bax JJ Morrow DA et al . Fourth universal definition of myocardial infarction (2018). J Am Coll Cardiol. (2018) 72:2231–64. 10.1016/j.jacc.2018.08.1038
4.
Anderson JL Morrow DA . Acute myocardial infarction. N Engl J Med. (2017) 376:2053–64. 10.1056/NEJMra1606915
5.
Akushevich I Yashkin A Kravchenko J . Racial and Geographic Disparities in U.S. Life Expectancy: Analysis of Time Trends and disease Contributions using Multiple Cause of Death and Medicare Data. Population Association of America (2021).
6.
World Population Review . Life Expectancy By State 2020. (2020). Available online at: https://worldpopulationreview.com/state-rankings/life-expectancy-by-state (accessed August 6, 2020).
7.
Centers for Disease Control and Prevention National Center for Health Statistics . Underlying Cause of Death 1999–2018 on CDC WONDER Online Database, released in (2020). Data are from the Multiple Cause of Death Files, 1999–2018, as compiled from data provided by the 57 vital statistics jurisdictions through the Vital Statistics Cooperative Program. (2020). Available online at: http://wonder.cdc.gov/ucd-icd10.html (accessed September 15, 2020).
8.
Simon S Ho PM . Ethnic and racial disparities in acute myocardial infarction. Curr Cardiol Rep. (2020) 22:88. 10.1007/s11886-020-01351-9
9.
Hinohara TT Al-Khalidi HR Fordyce CB Gu X Sherwood MW Roettig ML et al . Impact of regional systems of care on disparities in care among female and black patients presenting with st-segment-elevation myocardial infarction. J Am Heart Assoc. (2017) 6:e007122. 10.1161/JAHA.117.007122
10.
Liakos M Parikh PB . Gender disparities in presentation, management, and outcomes of acute myocardial infarction. Curr Cardiol Rep. (2018) 20:64. 10.1007/s11886-018-1006-7
11.
Krumholz HM Normand S-LT Wang Y . Twenty-year trends in outcomes for older adults with acute myocardial infarction in the United States. JAMA Netw Open. (2019) 2:e191938. 10.1001/jamanetworkopen.2019.1938
12.
Sugiyama T Hasegawa K Kobayashi Y Takahashi O Fukui T Tsugawa Y . Differential time trends of outcomes and costs of care for acute myocardial infarction hospitalizations by ST elevation and type of intervention in the United States, 2001–2011. J Am Heart Assoc. (2015) 4:e001445. 10.1161/JAHA.114.001445
13.
Lemor A Gorgis S Villablanca PA Basir MB Voeltz M Alaswad K et al . Regional variation in procedural and clinical outcomes among patients with ST elevation myocardial infarction with cardiogenic shock. Am J Cardiol. (2020) 125:1612–8. 10.1016/j.amjcard.2020.02.033
14.
Damluji AA Bandeen-Roche K Berkower C Boyd CM Al-Damluji MS Cohen MG et al . Percutaneous coronary intervention in older patients with ST-segment elevation myocardial infarction and cardiogenic shock. J Am Coll Cardiol. (2019) 73:1890–900. 10.1016/j.jacc.2019.01.055
15.
Plakht Y Gilutz H Shiyovich A . Temporal trends in acute myocardial infarction: what about survival of hospital survivors? Disparities between STEMI & NSTEMI remain. Soroka acute myocardial infarction II (SAMI-II) project. Int J Cardiol. (2016) 203:1073–81. 10.1016/j.ijcard.2015.11.072
16.
Kostis WJ Deng Y Pantazopoulos JS Moreyra AE Kostis JB . Myocardial infarction data acquisition system (MIDAS14) study group. Trends in mortality of acute myocardial infarction after discharge from the hospital. Circ Cardiovasc Qual Outcomes. (2010) 3:581–9. 10.1161/CIRCOUTCOMES.110.957803
17.
Yu B Akushevich I Yashkin A Yashin A Lyerly H Kravchenko J . Heart failure mortality, incidence, prevalence and survival in the United States: analysis of geographic disparities among older adults using Medicare data. In: Population Association of America Annual Meeting 2021. (2020).
18.
CDC . CDC WONDER. (2020). Available online at: https://wonder.cdc.gov/ (accessed Mar 7, 2020).
19.
Medicare . What's Medicare? (2020). Available online at: https://www.medicare.gov/what-medicare-covers/your-medicare-coverage-choices/whats-medicare (accessed June 19, 2020).
20.
Akushevich I Kravchenko J Ukraintseva S Arbeev K Yashin A . Circulatory diseases in the U.S. elderly in the linked national long-term care survey-Medicare database: population-based analysis of incidence, comorbidity, and disability.Res Aging. (2013) 35:437–58. 10.1177/0164027512446941
21.
Meyer AC Drefahl S Ahlbom A Lambe M Modig K . Trends in life expectancy: did the gap between the healthy and the ill widen or close?BMC Med. (2020) 18:41. 10.1186/s12916-020-01514-z
22.
Yeh RW Normand S-LT Wang Y Barr CD Dominici F . Geographic disparities in the incidence and outcomes of hospitalized myocardial infarction: does a rising tide lift all boats?Circ Cardiovasc Qual Outcomes. (2012) 5:197–204. 10.1161/CIRCOUTCOMES.111.962456
23.
CDC . Stats of the States—Heart Disease Mortality. (2019). Available online at: https://www.cdc.gov/nchs/pressroom/sosmap/heart_disease_mortality/heart_disease.htm (accessed March 29, 2021).
24.
Yeh RW Sidney S Chandra M Sorel M Selby JV Go AS . Population trends in the incidence and outcomes of acute myocardial infarction. N Engl J Med. (2010) 362:2155–65. 10.1056/NEJMoa0908610
25.
Le A Judd SE Allison DB Oza-Frank R Affuso O Safford MM et al . The geographic distribution of obesity in the US and the potential regional differences in misreporting of obesity. Obesity. (2014) 22:300–6. 10.1002/oby.20451
26.
CDC . Map of Cigarette Use Among Adults. (2020). Available online at: https://www.cdc.gov/statesystem/cigaretteuseadult.html (accessed October 12, 2020).
27.
CDC . Adult Physical Inactivity Prevalence Maps by Race/Ethnicity. (2020). Available online at: https://www.cdc.gov/physicalactivity/data/inactivity-prevalence-maps/index.html (accessed October 12, 2020).
28.
Teo KK Ounpuu S Hawken S Pandey MR Valentin V Hunt D et al . Tobacco use and risk of myocardial infarction in 52 countries in the INTERHEART study: a case-control study. Lancet. (2006) 368:647–58. 10.1016/S0140-6736(06)69249-0
29.
Rosengren A Hawken S Ounpuu S Sliwa K Zubaid M Almahmeed WA et al . Association of psychosocial risk factors with risk of acute myocardial infarction in 11119 cases and 13648 controls from 52 countries (the INTERHEART study): case-control study. Lancet. (2004) 364:953–62. 10.1016/S0140-6736(04)17019-0
30.
Voeks JH McClure LA Go RC Prineas RJ Cushman M Kissela BM et al . Regional differences in diabetes as a possible contributor to the geographic disparity in stroke mortality: the REasons for geographic and racial differences in stroke study. Stroke. (2008) 39:1675–80. 10.1161/STROKEAHA.107.507053
31.
CDC . Behavioral Risk Factor Surveillance System. (2019). Available online at: https://www.cdc.gov/brfss/ (accessed August 13, 2020).
32.
Shikany JM Safford MM Newby PK Durant RW Brown TM Judd SE . Southern dietary pattern is associated with hazard of acute coronary heart disease in the reasons for geographic and racial differences in stroke (REGARDS) study. Circulation. (2015) 132:804–14. 10.1161/CIRCULATIONAHA.114.014421
33.
Beatty AL Truong M Schopfer DW Shen H Bachmann JM Whooley MA . Geographic variation in cardiac rehabilitation participation in medicare and veterans affairs populations: opportunity for improvement. Circulation. (2018) 137:1899–908. 10.1161/CIRCULATIONAHA.117.029471
34.
Pandolfi MM Wang Y Spenard A Johnson F Bonner A Ho S-Y et al . Associations between nursing home performance and hospital 30-day readmissions for acute myocardial infarction, heart failure and pneumonia at the healthcare community level in the United States. Int J Older People Nurs. (2017) 12. 10.1111/opn.12154
35.
CDC . Interactive Atlas of Heart Disease and Stroke. (2017). Available online at: https://nccd.cdc.gov/DHDSPAtlas/?state=County (accessed July 12, 2020).
36.
Hsia RY Shen Y-C . Percutaneous coronary intervention in the united states: risk factors for untimely access. Health Serv Res. (2016) 51:592–609. 10.1111/1475-6773.12335
37.
CDC . Adult Obesity Prevalence Maps. (2019). Available online at: https://www.cdc.gov/obesity/data/prevalence-maps.html (accessed July 22, 2020).
38.
Allen NB Holford TR Bracken MB Goldstein LB Howard G Wang Y et al . Geographic variation in one-year recurrent ischemic stroke rates for elderly Medicare beneficiaries in the USA. Neuroepidemiology. (2010) 34:123–9. 10.1159/000274804
39.
Waidmann TA Rajan S . Race and ethnic disparities in health care access and utilization: an examination of state variation. Med Care Res Rev. (2000) 57 (Suppl 1):55–84. 10.1177/1077558700057001S04
40.
Smilowitz NR Mahajan AM Roe MT Hellkamp AS Chiswell K Gulati M et al . Mortality of myocardial infarction by sex, age, and obstructive coronary artery disease status in the ACTION registry-GWTG (acute coronary treatment and intervention outcomes network registry-get with the guidelines). Circ Cardiovasc Qual Outcomes. (2017) 10:e003443. 10.1161/CIRCOUTCOMES.116.003443
41.
Vallabhajosyula S Vallabhajosyula S Dunlay SM Hayes SN Best PJM Brenes-Salazar JA et al . Sex and gender disparities in the management and outcomes of acute myocardial infarction-cardiogenic shock in older adults. Mayo Clin Proc. (2020) 95:1916–27. 10.1016/j.mayocp.2020.01.043
42.
O'Gara PT Kushner FG Ascheim DD Casey DE Chung MK de Lemos JA et al . (2013). ACCF/AHA guideline for the management of ST-elevation myocardial infarction: a report of the American college of cardiology foundation/American heart association task force on practice guidelines. J Am Coll Cardiol. (2013) 61:e78–140.
43.
Solomon MD Leong TK Rana JS Xu Y Go AS . Community-based trends in acute myocardial infarction from 2008 to 2014. J Am Coll Cardiol. (2016) 68:666–8. 10.1016/j.jacc.2016.03.607
44.
Goldberg RJ Tisminetzky M Tran HV Yarzebski J Lessard D Gore JM . Decade long trends (2001–2011) in the incidence rates of initial acute myocardial infarction. Am J Cardiol. (2019) 123:206–11. 10.1016/j.amjcard.2018.10.002
45.
Reynolds K Go AS Leong TK Boudreau DM Cassidy-Bushrow AE Fortmann SP et al . Trends in incidence of hospitalized acute myocardial infarction in the cardiovascular research network (CVRN). Am J Med. (2017) 130:317–27. 10.1016/j.amjmed.2016.09.014
46.
Huffman MD Capewell S Ning H Shay CM Ford ES Lloyd-Jones DM . Cardiovascular health behavior and health factor changes (1988–2008) and projections to 2020: results from the National Health and Nutrition Examination Surveys. Circulation. (2012) 125:2595–602. 10.1161/CIRCULATIONAHA.111.070722
47.
Salloum RG Jensen GA Biddle AK . The “Welcome to Medicare” visit: a missed opportunity for cancer screening among women?J Womens Health. (2013) 22:19–25. 10.1089/jwh.2012.3777
48.
Goyal A de Lemos JA Peng SA Thomas L Amsterdam EA Hockenberry JM et al . Association of patient enrollment in medicare part D with outcomes after acute myocardial infarction. Circ Cardiovasc Qual Outcomes. (2015) 8:567–75. 10.1161/CIRCOUTCOMES.115.001650
49.
Chen H-Y Tisminetzky M Lapane KL Yarzebski J Person SD Kiefe CI et al . Decade-long trends in 30-day rehospitalization rates after acute myocardial infarction. J Am Heart Assoc. (2015) 4:e002291. 10.1161/JAHA.115.002291
50.
Fang J Alderman MH Keenan NL Ayala C . Acute myocardial infarction hospitalization in the United States, 1979 to 2005. Am J Med. (2010) 123:259–66. 10.1016/j.amjmed.2009.08.018
51.
Kwok CS Capers Q Savage M Gulati M Potts J Mohamed MO et al . Unplanned hospital readmissions after acute myocardial infarction: a nationwide analysis of rates, trends, predictors and causes in the United States between 2010 and 2014. Coron Artery Dis. (2020) 31:354–64. 10.1097/MCA.0000000000000844
52.
Kwok CS Wong CW Shufflebotham H Brindley L Fatima T Shufflebotham A et al . Early readmissions after acute myocardial infarction. Am J Cardiol. (2017) 120:723–8. 10.1016/j.amjcard.2017.05.049
53.
McManus DD Nguyen HL Saczynski JS Tisminetzky M Bourell P Goldberg RJ . Multiple cardiovascular comorbidities and acute myocardial infarction: temporal trends (1990–2007) and impact on death rates at 30 days and 1 year. Clin Epidemiol. (2012) 4:115–23. 10.2147/CLEP.S30883
54.
Psotka MA Fonarow GC Allen LA Joynt Maddox KE Fiuzat M Heidenreich P et al . The hospital readmissions reduction program: nationwide perspectives and recommendations: A JACC: heart failure position paper. JACC Heart Fail. (2020) 8:1–11. 10.1016/j.jchf.2019.07.012
55.
Khera R Dharmarajan K Wang Y Lin Z Bernheim SM Wang Y et al . Association of the hospital readmissions reduction program with mortality during and after hospitalization for acute myocardial infarction, heart failure, and pneumonia. JAMA Netw Open. (2018) 1:e182777. 10.1001/jamanetworkopen.2018.2777
56.
Chatterjee P Joynt Maddox KE . US national trends in mortality from acute myocardial infarction and heart failure: policy success or failure?JAMA Cardiol. (2018) 3:336–40. 10.1001/jamacardio.2018.0218
57.
Huckfeldt P Escarce J Sood N Yang Z Popescu I Nuckols T . Thirty-day postdischarge mortality among black and white patients 65 years and older in the medicare hospital readmissions reduction program. JAMA Netw Open. (2019) 2:e190634. 10.1001/jamanetworkopen.2019.0634
58.
Wadhera RK Joynt Maddox KE Wasfy JH Haneuse S Shen C Yeh RW . Association of the hospital readmissions reduction program with mortality among Medicare beneficiaries hospitalized for heart failure, acute myocardial infarction, and pneumonia. JAMA. (2018) 320:2542–52. 10.1001/jama.2018.19232
Summary
Keywords
myocardial infarction, life expectancy, geographic disparity, leading and lagging states, mortality, survival
Citation
Yu B, Akushevich I, Yashkin AP and Kravchenko J (2021) Epidemiology of Geographic Disparities of Myocardial Infarction Among Older Adults in the United States: Analysis of 2000–2017 Medicare Data. Front. Cardiovasc. Med. 8:707102. doi: 10.3389/fcvm.2021.707102
Received
08 May 2021
Accepted
29 July 2021
Published
09 September 2021
Volume
8 - 2021
Edited by
Kristi Reynolds, Kaiser Permanente, United States
Reviewed by
Matthew Mefford, Kaiser Permanente Southern California, United States; Chuanhui Dong, University of Miami, United States
Updates
Copyright
© 2021 Yu, Akushevich, Yashkin and Kravchenko.
This is an open-access article distributed under the terms of the Creative Commons Attribution License (CC BY). The use, distribution or reproduction in other forums is permitted, provided the original author(s) and the copyright owner(s) are credited and that the original publication in this journal is cited, in accordance with accepted academic practice. No use, distribution or reproduction is permitted which does not comply with these terms.
*Correspondence: Bin Yu binyu1029@outlook.com
This article was submitted to Cardiovascular Epidemiology and Prevention, a section of the journal Frontiers in Cardiovascular Medicine
Disclaimer
All claims expressed in this article are solely those of the authors and do not necessarily represent those of their affiliated organizations, or those of the publisher, the editors and the reviewers. Any product that may be evaluated in this article or claim that may be made by its manufacturer is not guaranteed or endorsed by the publisher.