 Tzu-Pin Lu1,2
 Amrita Chattopadhyay1,2
 Kuan-Chen Lu1,2Jing-Yuan Chuang3Shih-Fan Sherri Yeh4I-Shou Chang5
 Ching-Yu Julius Chen6I-Chien Wu5Chih-Cheng Hsu5Tzu-Yu Chen5Wei-Ting Tseng5Chao Agnes Hsiung5
 Jyh-Ming Jimmy Juang6*
- 1Department of Public Health, Institute of Epidemiology and Preventive Medicine, National Taiwan University, Taipei, Taiwan
- 2Bioinformatics and Biostatistics Core, Center of Genomic and Precision Medicine, National Taiwan University, Taipei, Taiwan
- 3Department of Medical Laboratory Science and Biotechnology, China Medical University, Taichung, Taiwan
- 4Department of Environmental and Occupational Medicine, National Taiwan University Hospital Hsin-Chu Branch, Hsinchu, Taiwan
- 5Institute of Population Health Sciences, National Health Research Institutes, Zhunan, Taiwan
- 6Cardiovascular Center and Division of Cardiology, Department of Internal Medicine, National Taiwan University Hospital and National Taiwan University College of Medicine, Taipei, Taiwan
With an aging world population, risk stratification of community-based, elderly population is required for primary prevention. This study proposes a combined score developed using electrocardiographic (ECG) parameters and determines its long-term prognostic value for predicting risk of cardiovascular mortality. A cohort-study, conducted from December 2008 to April 2019, enrolled 5,380 subjects in Taiwan, who were examined, using three-serial-12-lead ECGs, and their health/demographic information were recorded. To understand the predictive effects of ECG parameters on overall-survival, Cox hazard regression analysis were performed. The mean age at enrollment was 69.04 ± 8.14 years, and 47.4% were males. ECG abnormalities, LVH [hazard ratio (HR) = 1.39, 95% confidence intervals (CI) = (1.16–1.67), P = 0.0003], QTc [HR = 1.31, CI = (1.07–1.61), P = 0.007] and PR interval [HR = 1.40, CI = (1.01–1.95), P = 0.04], were significantly associated with primary outcome all-cause death. Furthermore, LVH [HR = 2.37, CI = (1.48–3.79), P = 0.0003] was significantly associated with cardiovascular death, while PR interval [HR = 2.63, CI = (1.24– 5.57), P = 0.01] with unexplained death. ECG abnormality (EA) score was defined based on the number of abnormal ECG parameters for each patient, which was used to divide all patients into sub-groups. Competing risk survival analysis using EA score were performed by using the Gray's test, which reported that high-risk EA groups showed significantly higher cumulative incidence for all three outcomes. Prognostic models using the EA score as predictor were developed and a 10-fold cross validation design was adopted to conduct calibration and discrimination analysis, to establish the efficacy of the proposed models. Overall, ECG model could successfully predict people, susceptible to all three death outcomes (P < 0.05), with high efficacy. Statistically significant (P < 0.001) improvement of the c-indices further demonstrated the robustness of the prediction model with ECG parameters, as opposed to a traditional model with no EA predictor. The EA score is highly associated with increased risk of mortality in elderly population and may be successfully used in clinical practice.
Introduction
The world's population is gradually aging as every country in the world is facing an increase in the number and proportion of older people in its population. Based on data from the United Nations' World Population Prospects, 1 in 11 people (9%) was over the age of 65 years in 2019, and this proportion will increase to nearly 1 in 6 people (17%) by 2050. Therefore, it is to be expected that the prevalence of diseases associated with old age, such as cardiovascular disease, will also rise. Thus, for the patients, health providers, and families, risk stratification for elderly people who have or are susceptible to chronic diseases such as hypertension, diabetes mellitus or chronic kidney diseases, is important, for primary prevention. Therefore, finding an effective, low-cost, non-invasive and readily available risk stratification tool for clinical practice is an important issue that needs to be addressed.
Although traditional cardiovascular risk factors (e.g., hypertension, diabetes or hyperlipidemia) have been identified and are widely used in clinical practice for risk stratification of cardiovascular disease development and cardiovascular events (1–3), the predictive value is less accurate in older adults than in middle-aged adults (4). An increased risk of sudden cardiac deaths has also been reported to be associated with several electrocardiographic (ECG) parameters (5–7), however, most of these parameters are used as a single predictor (e.g., QT interval) to predict clinical outcomes, resulting in limited predictive value. Combining several ECG parameters into integrated traditional risk models may improve risk stratification of cardiovascular events or mortality. This approach has not been investigated, until now, in elderly people.
Mostly, prior studies have been conducted in relatively young or middle-aged general populations (<65 years old) (5, 6, 8, 9) or in disease cohorts (10, 11) and the use of ECG parameters as predictive values of cardiovascular events for the general elderly population is scarce. The Healthy Aging Longitudinal Study (HALST) is a large, multi-site cohort study of community-dwelling older-middle-aged and elderly adults (>55 years old), with at least a 10-year follow-up, from the Han Chinese general population in Taiwan. Here, we sought to develop a combined ECG score using several ECG parameters and determine the score's long-term prognostic value for all-cause mortality, cardiovascular mortality and unexplained mortality in the HALST cohort.
Methods
Study Subjects: Taiwan Geriatric Health Survey population
We performed a prospective community-based cohort study in Taiwan, the HALST study (Supplementary Material), a community-based cohort study, that enrolled 5,380 study participants (12–14). Participants were enrolled from December 2008 through March 2013, and were followed up until April 2019. We collected three serial 12-lead ECGs and other relevant clinical and demographic information prospectively at the time of enrollment according to the study protocol. All analysis were conducted between May 2019 and September 2020.
We excluded individuals with a history of any cancer, significant heart diseases (e.g., documented coronary artery disease, severe heart failure (New York Heart Association class III/IV), myocardial infarction, severe valvular diseases, any kinds of cardiomyopathies and infectious cardiac diseases), ventricular conduction delay (2nd or 3rd degree atrioventricular block), atrial fibrillation or flutter, congenital short or long QT syndrome (15, 16), Brugada-type ECG (17), catecholaminergic polymorphic ventricular tachycardia (18), ventricular pre-excitation, and implanted pacemakers. The final study cohort population consisted of 4,615 individuals, constituting a random sample representative of the entire source population. All those who died of cardiac or other causes (n = 87 and n = 683, respectively) during the follow-up (mean follow-up time 95.1 ± 21.9 months) were identified.
Long-Term Prognosis and Follow-Up
The clinical outcomes that are considered in this study are all-cause death, cardiovascular death, and unexplained death. Death from cardiovascular causes was defined by the ICD codes I01-I02.0, I05-I09, I20-I25, I27, and I30-I52. The definition of unexplained deaths are sudden deaths with unexplained causes, occurring in an individual older than 1 year, according to 2020 AHPRS/HRS expert consensus statement (19). Taiwan maintains extensive administrative registers that record every death in the country. Two clinicians blinded to the ECG results determined the causes of death by examining death certificates from the National Taiwan Institute of Health and Welfare. The causes of death were adjudicated by a committee of experienced cardiologists, who were blinded to the data from the electrocardiographic analyses.
ECG Measurement and Definition of Abnormality Score
The 12-lead ECGs (Hewlett Packard, USA) were recorded at the standard settings of 10 mm/mV and 25 mm/s. PR and QRS intervals were computed automatically, while QTc was computed using Bazett's formula. We selected ECG variables, that are associated with mortality and relatively easily obtained in clinical practice, for risk analysis. The criteria for abnormality for each of the ECG parameters were defined as follows: PR interval >220 ms, QRS duration >110 ms, spatial QRS-T angle >90°, corrected QT interval (QTc) >450 ms in men or >460 ms in women, heart rate > 80/min, ST segment elevation in lead aVR, early repolarization pattern (ERP) in inferior or lateral leads (lead II, III, aVf; V4–6), fragmented QRS (fQRS) (20, 21) and left ventricular hypertrophy (LVH) by Sokolow-Lyon criteria or modified Cornell Criteria (22, 23). Each abnormal ECG variable counted for 1 point.
ECGs were displayed on a 24-in computer screen in multiple formats, enabling careful classification of slurring on the downslope of the R and J waves. All ECGs were analyzed and interpreted independently in random order by two trained cardiologists, who were blinded to clinical data and follow-up status. In case of divergent results, a third blinded cardiologist re-interpreted the ECG, and a preliminary decision on each ECG parameters was achieved by majority vote. After the preliminary decision on each ECG parameters, two trained cardiologists jointly re-assessed, and a final decision was reached by consensus. The inter-observer agreement was k = 0.97, and agreement proportion = 0.98.
Statistical Analysis
Cumulative ECG Abnormality Score
All-cause death, cardiovascular (CV) death, and unexplained death were considered as the study endpoints (Supplementary Materials). All-cause death, is considered as the primary study endpoint as it is comprised of CV death, unexplained death and deaths due to other causes. A Cox proportional hazards model was used to estimate the hazard ratio and 95% confidence intervals (CI) of the nine ECG risk parameters (Table 1) (24) using all study samples. A univariate analysis, age- and sex-adjusted, were conducted with each ECG parameter as predictor for the three clinical outcomes, followed by a joint analysis of all ECG parameters, with an age-adjusted and sex-adjusted model. As each of the ECG parameters would generally have a low predictive power, explaining only a small percentage of the variance, we proceeded to include all nine parameters to calculate a primary, cumulative ECG based score, named as ECG abnormality (EA) score to increase the explanatory power by looking at the joint effect of multiple ECG parameters. Subjects were stratified into four groups: (a) subjects in Group 0 showed no abnormal ECG readings, (b) Group 1's subjects exhibited one ECG abnormality, (c) Group 2's exhibited two ECG abnormalities, and (d) subjects in Group 3 showed three or more abnormalities. Additionally, a secondary EA score was developed, as a comparison, by stratifying the subjects into (i) a low-EA group (ECG abnormalities ≤1) and (ii) a high-EA group (ECG abnormalities ≥2).
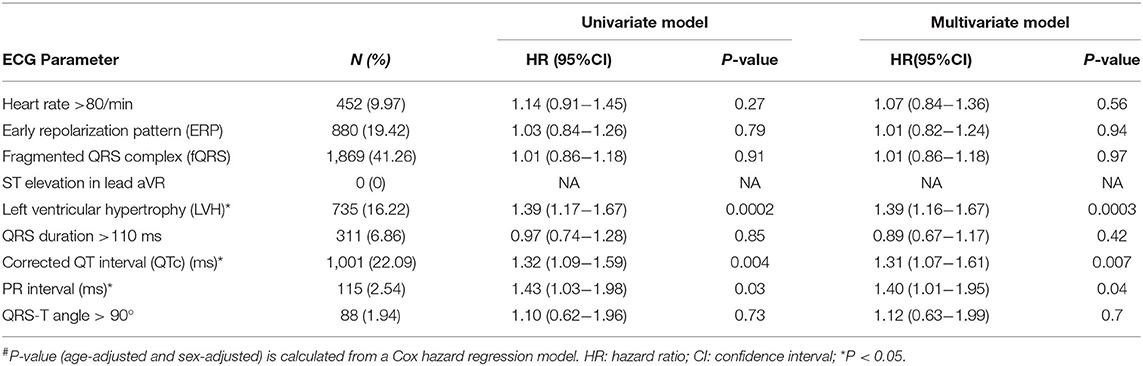
Table 1. Association between ECG parameters and all-cause death. #(N = 4,530).
Competing Risk Analysis
This study consists of three events where the occurrence of one may preclude or significantly alter the probability of the other two events. Therefore, competing risk analysis, using the complete data (N = 4,530), were performed for each of the three events, all-cause death, CV death and unexplained death, to estimate the hazard of failing from each of the given causes (cause-specific hazard function) in the presence of other two competing risk events, respectively (25). The cumulated incidence function (CIF) (probability of failing from a specific cause C before time) was employed using the “survminer” (26) and “cmprsk” (27) packages in R and CIF plots were used to compare the cumulative incidence of subjects with EA scores. Gray's test was performed to elucidate whether significant differences exist in the different groups: (A) all-cause death, (B) CV death, and (C) unexplained death.
Development of Prognostic Models With ECG Risk Scores
The EA scores were used to propose prognostic models using all patients (N = 4,530) in this study, including (i) an age and sex adjusted EA score prognostic model and (ii) a multivariate-adjusted EA score prognostic model, for all three endpoints in this study. The variables included in the multivariate adjustment consisted of traditional variables from the baseline model, such as age, sex, systolic blood pressure (SBP), diastolic blood pressure (DBP), body mass index (BMI), current smoking status, hypertension, diabetes mellitus, hyperlipidemia, stroke, and chronic kidney disease. The Cox proportional hazards model was employed using the “Survival” package in R (24) to estimate the hazard ratio and the corresponding 95% CIs. Statistical tests and graphical diagnostics based on the scaled Schoenfeld residuals testing, were used to check the proportional hazards (PH) assumption for all outcomes and for all models (age and sex adjusted ECG model and Multivariate adjusted ECG model) that have been proposed in this study (28).
Model Evaluation Using Internal Validation Cohort
To evaluate whether EA scores can help to identify elderly people's susceptibility to death outcomes, a 10-fold cross-validation (10CV) was performed to conduct model calibration and discrimination as indicators of performance (29). The study subjects from the HALST cohort were randomly split into training and testing sets in the ratio of 9:1, and repeated 10 times, to ensure all of the 10 data folds were used as the testing data. The training data were used on the (i) a multivariate-adjusted EA score prognostic model (ECG model), and (ii) a baseline model consisting of only traditional variables adjusted by age and sex (traditional model), to estimate the coefficients of the predictor variables, and the testing data were used to validate the fitted models, for all three outcomes.
Harrell's c-index from the “Survival” package in R (24) was utilized for the discrimination analysis to evaluate the concordance of predicted and observed survival. For a prognostic model to have a robust prediction performance for a pair of patients, the patient with shorter time to event (T) should have higher risk scores (R), as assigned by the model. In this study c-indices from all 10 cross-validation runs were averaged to evaluate the models' performances for all three outcomes. Furthermore, the c-indices of the two prediction models, with and without adding ECG parameters, were compared using a bootstrapping strategy (30) to check if adding the EA score into the prediction model leads to significant improvement in the discrimination ability, as opposed to only traditional variables.
For the calibration analysis, difference between the observed and predicted mortality for both the ECG model and the traditional model, were computed as percentages, over all study subjects, by a given follow up time. Furthermore, a proportion test was conducted to check if the differences attained statistical significance (P < 0.01).
Results
Baseline Characteristics
From a total of 5,380 relatively healthy and ambulatory individuals, enrolled in this study (Supplementary Figure 1), 755 individuals were excluded due to cancer, underlying severe cardiovascular diseases (e.g., myocardial infarction or pacemaker implantation), or missing follow-up information. Finally, 4,530 individuals with complete data were used for analysis (Supplementary Table 1).
Prognostic Value of Individual ECG Parameters
To evaluate whether ECG parameters were associated with the death outcomes, we performed a log-rank test using both univariate and multivariate approaches. As shown in Table 1, LVH, QTc and the PR interval were significantly associated with the primary outcome, all-cause death (P < 0.05). The hazard ratios (HRs) of LVH, QTc and the PR interval were 1.39 [95% CI = (1.16–1.67)], 1.31 [95% CI = (1.07–1.61)] and 1.40 [95% CI = (1.01–1.95)], respectively, in the multivariate model. Similarly, the LVH was a significant predictor of CV death [HR = 2.37, 95% CI = (1.48–3.79), P < 0.05] (Supplementary Table 2), and PR interval was the risk predictor of unexplained death [HR = 2.63, CI= (1.24– 5.57), P < 0.05] (Supplementary Table 3).
ECG Abnormality Risk Groups' Association With All-Cause Mortality, Cardiovascular Mortality and Unexplained Mortality
To further evaluate whether ECG parameters can be used to stratify people into different risk groups, we divided subjects into subgroups based on how many ECG abnormal parameters they displayed. The baseline characteristics of each ECG group are summarized in Table 2. Comparison among all groups were conducted to report p-values (Table 2 and Supplementary Table 4).Some clinical factors showed significant differences among the 4 groups, including age, systolic and diastolic blood pressures, smoking and hypertension (P < 0.05).
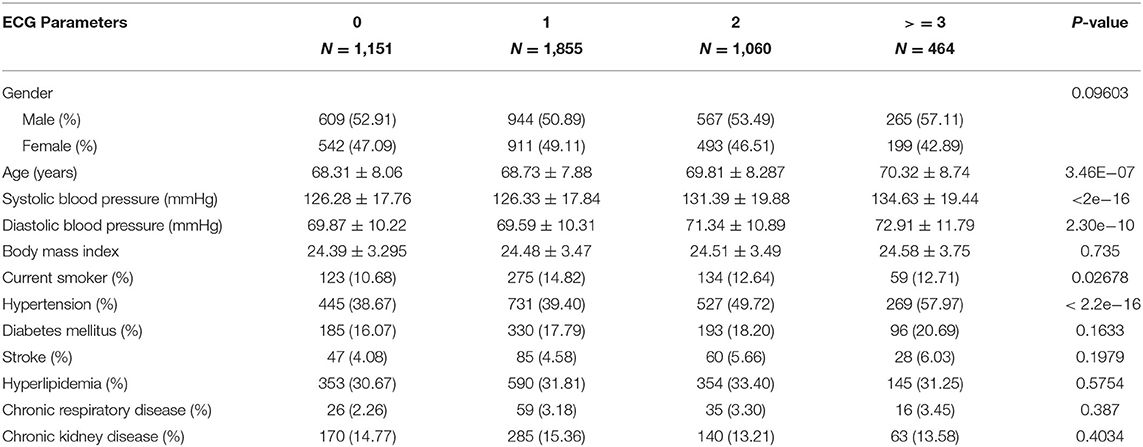
Table 2. Demographic characteristics of study subjects (N = 4,530) divided into subgroups based on number of ECG abnormal parameters (0, 1, 2, ≥3).
To explore whether the EA score was associated with the survival outcomes, we examined the proportion of death events for each EA level. The results are illustrated in Supplementary Figure 2; the proportion of events for EA subgroups increased with each additional ECG abnormal parameter. Group with 3 ECG abnormalities exhibited the highest proportion of events for outcomes, all-cause death (10.25, 13.04, 18.39, and 19.82%), CV death (0.78, 129, 2.16, and 2.80%) and unexplained death (0.78, 1.29, 2.16, and 2.80%), respectively. We further performed a secondary analysis, using only two EA groups: low and high. The samples with no or one ECG abnormal parameter (0 or 1) were classified as low EA, whereas samples displaying two or more ECG abnormal parameters were classified as high EA. As shown in Figure 1, the high EA group showed a higher proportion of events for all-cause deaths (18.83%), CV deaths (2.82%) and unexplained deaths (2.36%) compared to that of the low EA group (11.97%, 1.13%, and 1.10%, respectively).
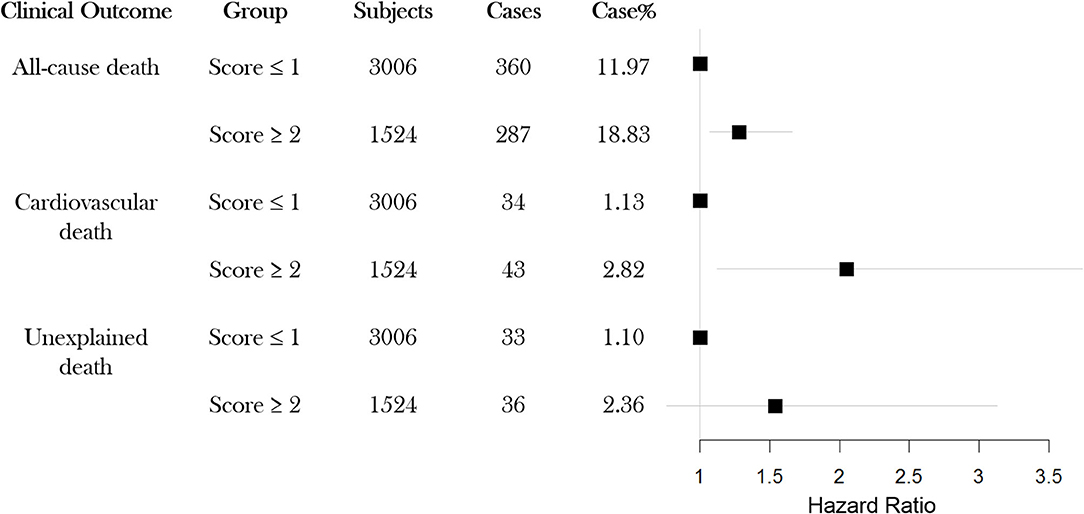
Figure 1. Event rates for each of three possible outcomes All-cause death, CV death and Unexpected death, for study subjects classified into two groups (high-EA or low-EA) based on ECG abnormal parameters (N = 4,530). EA: ECG abnormality; CV: cardiovascular.
Furthermore, a competing risk survival analysis of the two-level EA groups were performed by using the Gray's tests to elucidate their associations with each of the death outcomes studied, while taking into consideration the possibility of the event to have an affect due to deaths by other causes (Figure 2). Notably, the high EA group showed significantly higher cumulative incidence in all three outcomes: all-cause death (P = 0.004, Figure 2A), CV death (P < 0.001, Figure 2B), and unexplained death (P = 0.006, Figure 2C). The detailed classification (using four EA categories) of each group and its association with the different death outcomes is shown in Supplementary Figure 3, which showed similar pattern as that of the two-level EA groups for all three events. In conclusion, these results indicate that ECG parameters can help in identifying people at a higher risk for all-cause-death, cardiovascular death, or unexplained death.
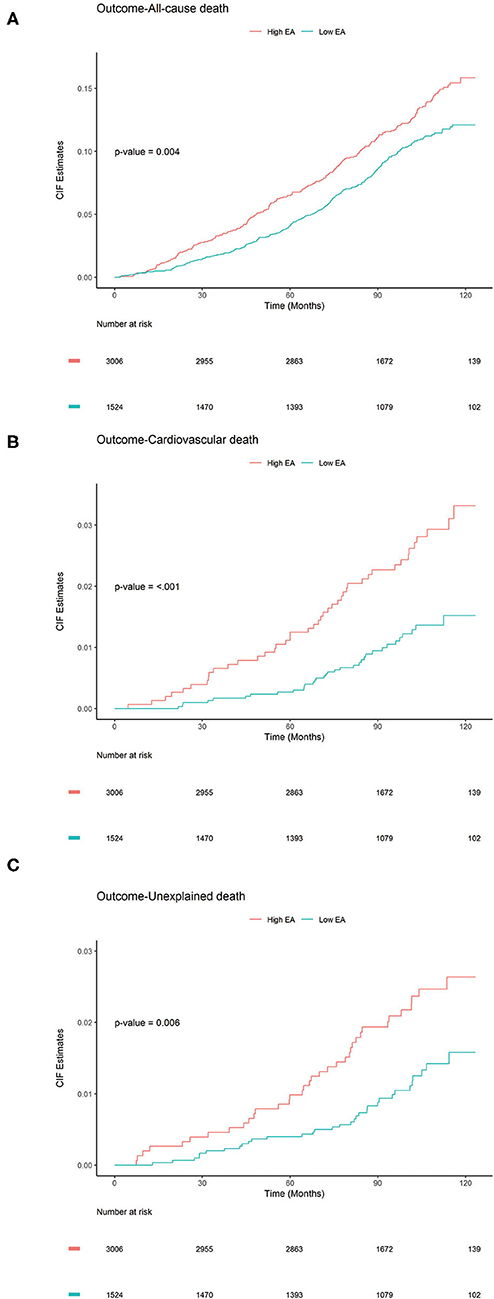
Figure 2. Cumulative Incidence Function plots to compare the cumulative incidence of subjects (N = 4,530) with ECG abnormality (EA) score (high, low). P-values were calculated using Gray's test to elucidate whether significant differences exist in the different groups: (A) All-cause death, (B) CV death, and (C) Unexplained death.
Development of Prognostic Model
Supplementary Tables 5–13 displays the results for the scaled Schoenfeld residuals testing that were conducted for all three study outcomes to check for the validity of the proportional hazard assumption for the covariates under consideration, in each of the proposed prognostic models in this study. The findings along with the global tests were not found to be statistically significant, implying that the proportional hazard assumption is valid for all models. Cox - proportion hazards regression was performed on an age and sex adjusted univariate model and a multivariate adjusted prognostic model, to check if the EA score is a significant predictor for all three endpoints all-cause death, CV death and unexpected death. The results for the primary outcome, all-cause death are summarized in Table 3. Notably, the EA (high, low) was a significant predictor in the age- and sex-adjusted model (HR: 1.31; 95% CI= (1.12–1.53), P = 0.0008) and the multivariate model (HR: 1.28; 95% CI = (1.09–1.50); P = 0.002) after considering all traditional risk factors. The c-index was 0.786 in the multivariate model, suggesting a good-fit of the prediction model and the real death events in all-cause death. As shown in Supplementary Tables 14, 15, the EA score was a significant predictor for both CV death, and unexplained death, respectively.
Table 3. Prediction performance of ECG abnormality score (low EA and high EA) associated with all-cause death (N = 4,530).
ECG Abnormality Score Validation and Model Improvement
To evaluate the performance of the multivariate adjusted prediction model in comparison with the traditional model, discrimination analysis was conducted using a 10CV design. Table 4, Supplementary Table 16 lists the average and the standard deviations of the C- indices over all 10CVs for both the models and for all three study outcomes. Harrel's c-index values for all three outcomes were reported to be 0.786, 0.798, and 0.851, implying that the ECG model is an effective predictor of the study events and can correctly discriminate patient's survival for a given patient pair. Furthermore, comparison of the c-indices between ECG model and traditional model, using a bootstrapping strategy, revealed that adding ECG parameters can significantly improve the predictive capability (P < 0.001), based on our data.
Table 4. Average and standard deviation of c-indices from 10-fold cross-validation.
Finally, a calibration analysis was conducted to examine if the predicted events were significantly different from the observed events, for all three study outcomes. Figure 3 displays the results of the calibration analysis that was performed using a 10CV for each of the 10 years where the average difference of the proportions between the predicted and observed events were plotted for both ECG model (high, low) and traditional model. For all-cause death the differences in the proportions were ≤5% for the first 5 years, while for both CV death and unexpected death the differences in the proportions were negligible (<3%) for all 10 years. The higher differences that were observed for all-cause death after 5 years may be attributed to the fact that these elder patients may die of diseases other than cardiovascular ones, such as cancers. Similar patterns were observed for the other EA score model (0, 1, 2, and 3) (Supplementary Figure 4) and traditional models (Figure 3 and Supplementary Figure 4). Supplementary Tables 17–22 further lists the detailed calibration analysis results for both ECG model and traditional model, for all three outcomes. All results suggest that our prediction model can help to identify subjects with a high risk of a death event among the elderly.
Figure 3. Calibration plots for the events (A) all-cause death, (B) cardiovascular death and, (C) unexplained death, to show the difference between observed and predicted survival probability for proposed ECG model (with EA score (high, low) and traditional variables) and traditional model (only traditional variables without EA score). Calibration for each of the models is conducted using 10-fold cross-validation (CV) and each bar shows an average of the probability difference over 10 models for each CV. Black bars: model with EA score + traditional variables (with ECG). Gray bars: model with only traditional variables (without ECG).
Discussion
Due to the increasing elderly population, world-wide, risk assessment and stratification of elderly people becomes an important issue in patient care. To our knowledge, this is the first study to specifically investigate the usefulness of an EA score as a predictive tool for an elderly population (mean age ≥65 years).
This study identified LVH, QTc and PR interval to be independently associated with increased risk of the primary study outcome, all-cause mortality, while LVH and PR as the only risk factor of cardiovascular mortality and unexplained mortality, respectively. Previous studies, including the Framingham experience, have demonstrated that LVH, manifested by repolarization abnormality and increased voltage, is one of the less common but ominous risk factors for coronary artery disease, stroke and heart failure. It was associated with a 3–15-fold increase of cardiovascular events (31–33). QTc and PR prolongation has also been reported as cardiac risk factors of sudden death (34, 35) in coronary patients or risk equivalent for middle age and older adults (36). Our findings were not only consistent with previous studies, but also extended the utility of the three ECG parameters to community-based elder individuals.
Several ECG parameters have been tested in many previous studies, both in general populations (37, 38) and in cohorts with cardiac specific diseases (39, 40). These studies showed that the predictive value of a single ECG parameter for sudden cardiac death was generally lower than combining multiple ECG parameters (6, 41, 42). This study uses a specific set of 9 ECG parameters to define the EA score, used to construct the prognostic models. This is because, these ECG parameters have more clinical meanings after having been used in medical practice for 100 years and their potential in predicting the outcomes of cardiovascular events have already been verified through numerous prior studies (6, 20, 21, 43–48) One of the more representative studies is one where the authors analyzed 6,830 participants and reported important ECG abnormalities associated with sudden cardiac death risks (6). To make the results in this study comparable to the previous study, the same ECG parameters were used for defining the EA score in this study. After adjusting for multiple traditional cardiovascular risk factors, our combined and validated EA scores successfully revealed that elderly subjects with ≥3 ECG abnormalities had a 29% higher risk of all-cause mortality compared to elderly subjects with ≤3 ECG abnormalities. Combined ECG risk parameters and traditional cardiovascular risk factors have a cumulative effect on the risk of all-cause mortality. In summary, these results suggest that the combined EA score has the potential to serve as a predictive tool of death events in the elderly.
ECG is a globally used, essential, inexpensive, and non-invasive technique to detect electric abnormalities of the heart and more and more elderly individuals receive annual health examinations, including ECG. We expect that ECG abnormalities would be an incidental finding during a routine health examination. Our study provides an important reference for clinicians or health professionals when they encounter asymptomatic elderly individuals susceptible to chronic diseases or with comorbidities.
Although we performed internal validation, a limitation of this study is that the findings have not been validated in a prospective, external cohort. However, as our cohort takes into consideration the complexity associated with diverse outcomes of cardiac related deaths in general elder population, we believe that our results are generalizable to other similar elder cohorts. Future studies will be conducted to validate the findings on independent cohorts. Secondly, as some of the covariates in our proposed model for the primary outcome, all-cause death (diabetes mellitus and stroke) could possibly have a have a non-proportional hazard effect (Supplementary Tables 5–7), further studies are needed for better modeling by conducting the possible interaction of these variables with time. Lastly, detailed clinical information such as echocardiographic assessment (e.g., left ventricular ejection fraction), coronary angiography, or medications are not available in the HALST database. For screening purposes in a large cohort, these information are seldom available, thus this study mimics the setting in which screening would normally take place.
Conclusion
The findings in this study show that combined EA score is highly associated with an increased risk of all-cause mortality, CV mortality and unexplained mortality in an elderly population, which will be confirmed through future validation in independent cohorts. Use of this abnormality score may improve the risk stratification for elderly population in clinical practice.
Data Availability Statement
The raw data supporting the conclusions of this article will be made available by the authors, without undue reservation.
Ethics Statement
The studies involving human participants were reviewed and approved by this study was approved by the Ethics Committee of the National Health Research Institutes and conducted according to the principles of the Declaration of Helsinki. The patients/participants provided their written informed consent to participate in this study.
Author Contributions
The study was conceptualization and designed by T-PL, S-FY, J-MJ, C-YC, and J-YC. Enrolled individuals, collected data, and laboratory work were done by CH, I-SC, I-CW, C-CH, T-YC, and W-TT. Data analysis and interpretation were done by T-PL, AC, K-CL, S-FY, J-MJ, C-YC, and J-YC. Resources and supervision was done by CH and J-MJ. Writing, reviewing, and editing the manuscript was done by T-PL, AC, K-CL, S-FY, J-YC, and J-MJ. All authors have read and approved the final version of the submitted manuscript.
Funding
This study was mainly supported by the National Health Research Institutes of Taiwan (Grant Numbers: PH-101-SP-01, PH-102-SP-01, and PH-103-SP-01), partly by the Ministry of Science and Technology of Taiwan (Grant Numbers: MOST 106-2314-B-002-134-MY2, MOST 106-2314-B-002-206, MOST 107-2314-B-002-009, MOST 107-2314-B-002-261-MY3, and MOST 108-2314-B-002-187), and the Taiwan Health Foundation, and National Taiwan University Hospital (Grant Numbers: NTUH-UN105-012 and NTUH 106-018).
Conflict of Interest
The authors declare that the research was conducted in the absence of any commercial or financial relationships that could be construed as a potential conflict of interest.
Publisher's Note
All claims expressed in this article are solely those of the authors and do not necessarily represent those of their affiliated organizations, or those of the publisher, the editors and the reviewers. Any product that may be evaluated in this article, or claim that may be made by its manufacturer, is not guaranteed or endorsed by the publisher.
Acknowledgments
We are sincerely grateful to the HALST study's advisory committee (Drs. Luigi Ferrucci, Jack M. Guralnik, Dilip V. Jeste, and Kung-Yee Liang) for the valuable suggestions. We wish to thank the men and women who participated in the study, and all the members of the HALST study group. The members of the HALST study group are as follows: Drs. Chao-Agnes Hsiung, C-CH, I-CW, Hsing-Yi Chang, Chu-Chih Chen, Yen-Feng Chiu, Hui-Ju Tsai, and Ken N. Kuo, of National Heath Research Institutes; Dr. Ching-Yu Chen of National Taiwan University; Dr. Kiang Liu of Northwestern University Medical School; Dr. Marion Lee of University of California at San Francisco; Dr. Ida Chen of Cedars-Sinai Medical Center; Dr. Shu-Han Yu of Chung Shan Medical University; Dr. Kai-Ting Ko of Mackay Memorial Hospital; Dr. Tzuo-Yun Lan of National Yang-Ming University; Dr. Hou-Chang Chiu of Shin Kong Wu Ho-Su Memorial Hospital; Dr. Wen-Jin Liaw of Yee Zen General Hospital; Dr. Yo-Hann Liu of Hope Doctors Hospital; Dr. I-Ching Lin of Changhua Christian Hospital; Dr. Ping-An Wu of Potz General Hospital; Dr. Chon-Chou Juan of Yuan's General Hospital; Drs. Chi-Chung Wang and Shi-Chen Shen of Mennonite Christian Hospital; and Dr. Huey-Ming Lo of Fu-Jen Catholic University Hospital. We thank the staff of the Sixth Core Lab, Department of Medical Research, National Taiwan University Hospital, and Taiwan Health foundation for technical support. The authors thank Ellen Craig of Craig Composition, LLC for editing the manuscript.
Supplementary Material
The Supplementary Material for this article can be found online at: https://www.frontiersin.org/articles/10.3389/fcvm.2021.738061/full#supplementary-material
References
1. Berry JD, Lloyd-Jones DM, Garside DB, Greenland P. Framingham risk score and prediction of coronary heart disease death in young men. Am Heart J. (2007) 154:80–6. doi: 10.1016/j.ahj.2007.03.042
2. Greenland P, Knoll MD, Stamler J, Neaton JD, Dyer AR, Garside DB, et al. Major risk factors as antecedents of fatal and nonfatal coronary heart disease events. JAMA. (2003) 290:891–7. doi: 10.1001/jama.290.7.891
3. Smith Jr SC, Greenland P, Grundy SM. Prevention conference V: beyond secondary prevention: identifying the high-risk patient for primary prevention: executive summary. Circulation. (2000) 101:111–6. doi: 10.1161/01.CIR.101.1.111
4. D'Agostino RB, Grundy S, Sullivan LM, Wilson P, Group CRP. Validation of the Framingham coronary heart disease prediction scores: results of a multiple ethnic groups investigation. JAMA. (2001) 286:180–7. doi: 10.1001/jama.286.2.180
5. Fisch C. Role of the electrocardiogram in identifying the patient at increased risk for sudden death. J Am Coll Cardiol. (1985) 5:6B−8. doi: 10.1016/S0735-1097(85)80517-9
6. Holkeri A, Eranti A, Haukilahti MAE, Kerola T, Kenttä TV, Tikkanen JT, et al. Predicting sudden cardiac death in a general population using an electrocardiographic risk score. Heart. (2020) 106:427–33. doi: 10.1136/heartjnl-2019-315437
7. KANNEL WB GORDON T, OFFUTT D. Left ventricular hypertrophy by electrocardiogram: prevalence, incidence, and mortality in the Framingham study. Ann Intern Med. (1969) 71:89–105. doi: 10.7326/0003-4819-71-1-89
8. Blackburn H, Taylor H, Keys A. Coronary heart disease in seven countries XVI. The electrocardiogram in prediction of five-year coronary heart disease incidence among men aged forty through fifty-nine. Circulation. (1970) 41(Suppl. 2):I154–I61. doi: 10.1161/01.CIR.41.4S1.I-154
9. Rose G, Baxter P, Reid D, McCartney P. Prevalence and prognosis of electrocardiographic findings in middle-aged men. Heart. (1978) 40:636–43. doi: 10.1136/hrt.40.6.636
10. Kim D, Lee GY, Choi JO, Kim K, Kim SJ, Jeon E-S. Associations of electrocardiographic parameters with left ventricular longitudinal strain and prognosis in cardiac light chain amyloidosis. Sci Rep. (2019) 9:1–7. doi: 10.1038/s41598-019-44245-9
11. Welch RD, Zalenski R, Grzybowski M, Kowalenko T, Malmgren JA, Every NR. Predictive value of the electrocardiogram in acute myocardial infarction—reply. JAMA. (2002) 287:711–2. doi: 10.1001/jama.287.6.711
12. Wu IC, Chang HY, Hsu CC, Chiu YF, Yu SH, Tsai YF, et al. Association between dietary fiber intake and physical performance in older adults: a nationwide study in Taiwan. PLoS ONE. (2013) 8:e80209. doi: 10.1371/journal.pone.0080209
13. Juang JMJ, Chen CYJ, Chen YH, Wu IC, Hsu CC, Chen LN, et al. Prevalence and prognosis of Brugada electrocardiogram patterns in an elderly Han Chinese population: a nation-wide community-based study (HALST cohort). Ep Europace. (2016) 17(suppl_2):ii54–62. doi: 10.1093/europace/euv141
14. Chen CYJ, Juang JMJ, Chen YH, Wu IC, Hsu CC, Wu RC, et al. Comparisons of clinical impacts on individuals with Brugada electrocardiographic patterns defined by ISHNE criteria or EHRA/HRS/APHRS criteria: a nationwide community-based study. Ann Med. (2018) 50:7–15. doi: 10.1080/07853890.2017.1353222
15. Moss AJ, Schwartz PJ, Crampton RS, Locati E, Carleen E. The long QT syndrome: a prospective international study. Circulation. (1985) 71:17–21. doi: 10.1161/01.CIR.71.1.17
16. Gaita F, Giustetto C, Bianchi F, Wolpert C, Schimpf R, Riccardi R, et al. Short QT syndrome: a familial cause of sudden death. Circulation. (2003) 108:965–70. doi: 10.1161/01.CIR.0000085071.28695.C4
17. Berne P, Brugada J. Brugada syndrome 2012. Circ J. (2012) 76:1563–71. doi: 10.1253/circj.CJ-12-0717
18. Cerrone M, Napolitano C, Priori SG. Catecholaminergic polymorphic ventricular tachycardia: a paradigm to understand mechanisms of arrhythmias associated to impaired Ca2+ regulation. Heart Rhythm. (2009) 6:1652–9. doi: 10.1016/j.hrthm.2009.06.033
19. Stiles MK, Wilde AA, Abrams DJ, Ackerman MJ, Albert CM, Behr ER, et al. 2020 APHRS/HRS expert consensus statement on the investigation of decedents with sudden unexplained death and patients with sudden cardiac arrest, and of their families. Heart Rhythm. (2021) 18:e1–e50. doi: 10.1016/j.hrthm.2020.10.010
20. Haïssaguerre M, Derval N, Sacher F, Jesel L, Deisenhofer I, de Roy L, et al. Sudden cardiac arrest associated with early repolarization. New Eng J Med. (2008) 358:2016–23. doi: 10.1056/NEJMoa071968
21. Macfarlane PW, Antzelevitch C, Haissaguerre M, Huikuri HV, Potse M, Rosso R, et al. The early repolarization pattern: a consensus paper. J Am Coll Cardiol. (2015) 66:470–7. doi: 10.1016/j.jacc.2015.05.033
22. Knilans BST. Chou's Electrocardiography in Clinical Practice: Adult and Pediatric. 6th ed. Philadelphia, PA: WB Saunders Company 2008.
23. Rautaharju PM, Surawicz B, Gettes LS, Bailey JJ, Childers R, Deal BJ, et al. AHA/ACCF/HRS recommendations for the standardization and interpretation of the electrocardiogram: part IV: the ST segment, T and U waves, and the QT interval: a scientific statement from the American Heart Association Electrocardiography and Arrhythmias Committee, Council on Clinical Cardiology; the American College of Cardiology Foundation; and the Heart Rhythm Society. Endorsed by the International Society for Computerized Electrocardiology. J Am Coll Cardiol. (2009) 53:982–91. doi: 10.1161/CIRCULATIONAHA.108.191096
25. Lau B, Cole SR, Gange SJ. Competing risk regression models for epidemiologic data. Am J Epidemiol. (2009) 170:244–56. doi: 10.1093/aje/kwp107
26. Kassambara A, Kosinski M, Biecek P, Fabian S. Package ‘survminer'. Drawing Survival Curves using ‘ggplot2'(R package version 03 1). (2017).
28. Hess KR. Graphical methods for assessing violations of the proportional hazards assumption in Cox regression. Stat Med. (1995) 14:1707–23. doi: 10.1002/sim.4780141510
29. D'Agostino RB, Nam BH. Evaluation of the performance of survival analysis models: discrimination and calibration measures. Handbook Stat. (2003) 23:1–25. doi: 10.1016/S0169-7161(03)23001-7
30. Kang L, Chen W, Petrick NA, Gallas BD. Comparing two correlated C indices with right-censored survival outcome: a one-shot nonparametric approach. Stat Med. (2015) 34:685–703. doi: 10.1002/sim.6370
31. Katholi RE, Couri DM. Left ventricular hypertrophy: major risk factor in patients with hypertension: update and practical clinical applications. Int J Hypertens. (2011) 2011:495349. doi: 10.4061/2011/495349
32. Bang CN, Soliman EZ, Simpson LM, Davis BR, Devereux RB, Okin PM, et al. Electrocardiographic left ventricular hypertrophy predicts cardiovascular morbidity and mortality in hypertensive patients: the ALLHAT study. Am J Hypertens. (2017) 30:914–22. doi: 10.1093/ajh/hpx067
33. Frohlich ED. Left ventricular hypertrophy as a risk factor. Cardiol Clin. (1986) 4:137–44. doi: 10.1016/S0733-8651(18)30642-8
34. Chan YH, Hai JJ, Lau KK, Li SW, Lau CP, Siu CW, et al. PR interval prolongation in coronary patients or risk equivalent: excess risk of ischemic stroke and vascular pathophysiological insights. BMC Cardiovasc Disord. (2017) 17:1–9. doi: 10.1186/s12872-017-0667-2
35. Vrtovec B, Delgado R, Zewail A, Thomas CD, Richartz BM, Radovancevic B. Prolonged QTc interval and high B-type natriuretic peptide levels together predict mortality in patients with advanced heart failure. Circulation. (2003) 107:1764–9. doi: 10.1161/01.CIR.0000057980.84624.95
36. Magnani JW, Wang N, Nelson KP, Connelly S, Deo R, Rodondi N, et al. Electrocardiographic PR interval and adverse outcomes in older adults: the health, aging, and body composition study. Circ Arrhythm Electrophysiol. (2013) 6:84–90. doi: 10.1161/CIRCEP.112.975342
37. Wellens HJ, Schwartz PJ, Lindemans FW, Buxton AE, Goldberger JJ, Hohnloser SH, et al. Risk stratification for sudden cardiac death: current status and challenges for the future. Eur Heart J. (2014) 35:1642–51. doi: 10.1093/eurheartj/ehu176
38. Waks JW, Sitlani CM, Soliman EZ, Kabir M, Ghafoori E, Biggs ML, et al. Global electric heterogeneity risk score for prediction of sudden cardiac death in the general population: the atherosclerosis risk in communities (ARIC) and cardiovascular health (CHS) studies. Circulation. (2016) 133:2222–34. doi: 10.1161/CIRCULATIONAHA.116.021306
39. Das MK, Saha C, El Masry H, Peng J, Dandamudi G, Mahenthiran J, et al. Fragmented QRS on a 12-lead ECG: a predictor of mortality and cardiac events in patients with coronary artery disease. Heart Rhythm. (2007) 4:1385–92. doi: 10.1016/j.hrthm.2007.06.024
40. Stavileci B, Cimci M, Ikitimur B, Barman HA, Ozcan S, Ataoglu E, et al. Significance and usefulness of narrow fragmented QRS complex on 12-lead electrocardiogram in acute ST-segment elevation myocardial infarction for prediction of early mortality and morbidity. Ann Noninvasive Electrocardiol. (2014) 19:338–44. doi: 10.1111/anec.12133
41. Aro AL, Reinier K, Rusinaru C, Uy-Evanado A, Darouian N, Phan D, et al. Electrical risk score beyond the left ventricular ejection fraction: prediction of sudden cardiac death in the Oregon Sudden Unexpected Death Study and the Atherosclerosis Risk in Communities Study. Eur Heart J. (2017) 38:3017–25. doi: 10.1093/eurheartj/ehx331
42. Reinier K, Narayanan K, Uy-Evanado A, Teodorescu C, Chugh H, Mack WJ, et al. Electrocardiographic markers and left ventricular ejection fraction have cumulative effects on Risk of Sudden Cardiac Death. JACC Clin Electrophysiol. (2015) 1:542–50. doi: 10.1016/j.jacep.2015.07.010
43. Soliman EZ, Cammarata M, Li Y. Explaining the inconsistent associations of PR interval with mortality: the role of P-duration contribution to the length of PR interval. Heart Rhythm. (2014) 11:93–8. doi: 10.1016/j.hrthm.2013.10.003
44. Kalahasti V, Nambi V, Martin DO, Lam CT, Yamada D, Wilkoff BL, et al. QRS duration and prediction of mortality in patients undergoing risk stratification for ventricular arrhythmias. Am J Cardiol. (2003) 92:798–803. doi: 10.1016/S0002-9149(03)00886-5
45. Mizusawa Y, Horie M, Wilde AA. Genetic and clinical advances in congenital long QT syndrome. Circ J. (2014) 2014:CJ-14-0905. doi: 10.1253/circj.CJ-14-0905
46. Morita H, Watanabe A, Morimoto Y, Kawada S, Tachibana M, Nakagawa K, et al. Distribution and prognostic significance of fragmented QRS in patients with Brugada syndrome. Circ Arrhythm Electrophysiol. (2017) 10:e004765. doi: 10.1161/CIRCEP.116.004765
47. Antzelevitch C, Yan G-X. J-wave syndromes: Brugada and early repolarization syndromes. Heart Rhythm. (2015) 12:1852–66. doi: 10.1016/j.hrthm.2015.04.014
Keywords: prevalence, long-term prognosis, electrocardiographic abnormality score, Han Chinese population, community-based
Citation: Lu T-P, Chattopadhyay A, Lu K-C, Chuang J-Y, Yeh S-FS, Chang I-S, Chen C-YJ, Wu I-C, Hsu C-C, Chen T-Y, Tseng W-T, Hsiung CA and Juang J-MJ (2021) Develop and Apply Electrocardiography-Based Risk Score to Identify Community-Based Elderly Individuals at High-Risk of Mortality. Front. Cardiovasc. Med. 8:738061. doi: 10.3389/fcvm.2021.738061
Received: 08 July 2021; Accepted: 13 September 2021;
Published: 08 October 2021.
Edited by:
Giovanni Veronesi, University of Insubria, ItalyReviewed by:
Giulia Barbati, University of Trieste, ItalyChien-Yi Hsu, Taipei Medical University Hospital, Taiwan
Copyright © 2021 Lu, Chattopadhyay, Lu, Chuang, Yeh, Chang, Chen, Wu, Hsu, Chen, Tseng, Hsiung and Juang. This is an open-access article distributed under the terms of the Creative Commons Attribution License (CC BY). The use, distribution or reproduction in other forums is permitted, provided the original author(s) and the copyright owner(s) are credited and that the original publication in this journal is cited, in accordance with accepted academic practice. No use, distribution or reproduction is permitted which does not comply with these terms.
*Correspondence: Jyh-Ming Jimmy Juang, amptanVhbmdAbnR1LmVkdS50dw==