Abstract
Objective: This study aimed to develop machine learning-based prediction models to predict masked hypertension and masked uncontrolled hypertension using the clinical characteristics of patients at a single outpatient visit.
Methods: Data were derived from two cohorts in Taiwan. The first cohort included 970 hypertensive patients recruited from six medical centers between 2004 and 2005, which were split into a training set (n = 679), a validation set (n = 146), and a test set (n = 145) for model development and internal validation. The second cohort included 416 hypertensive patients recruited from a single medical center between 2012 and 2020, which was used for external validation. We used 33 clinical characteristics as candidate variables to develop models based on logistic regression (LR), random forest (RF), eXtreme Gradient Boosting (XGboost), and artificial neural network (ANN).
Results: The four models featured high sensitivity and high negative predictive value (NPV) in internal validation (sensitivity = 0.914–1.000; NPV = 0.853–1.000) and external validation (sensitivity = 0.950–1.000; NPV = 0.875–1.000). The RF, XGboost, and ANN models showed much higher area under the receiver operating characteristic curve (AUC) (0.799–0.851 in internal validation, 0.672–0.837 in external validation) than the LR model. Among the models, the RF model, composed of 6 predictor variables, had the best overall performance in both internal and external validation (AUC = 0.851 and 0.837; sensitivity = 1.000 and 1.000; specificity = 0.609 and 0.580; NPV = 1.000 and 1.000; accuracy = 0.766 and 0.721, respectively).
Conclusion: An effective machine learning-based predictive model that requires data from a single clinic visit may help to identify masked hypertension and masked uncontrolled hypertension.
Introduction
Hypertension is a major global health risk, affecting 1.13 billion people worldwide (1). However, almost half of people are unaware that they have hypertension (2). It is therefore important to improve the diagnosis and monitoring of hypertension for better management of blood pressure (BP) and to reduce the risk of developing future cardiovascular diseases (CVD) (3).
Masked hypertension (MH) or masked uncontrolled hypertension (MUCH) is defined as normotensive office BP and hypertensive out-of-office BP (4–7). MH refers to treatment-naïve patients and MUCH to patients with prior hypertension treatments. International registries show that MH/MUCH is a highly prevalent condition, present in up to one in three office-controlled patients (8). Patients with MH/MUCH have an increased risk of mortality and cardiovascular events (6, 9, 10).
Currently, the diagnosis of MH/MUCH depends on out-of-office BP measurement, including ambulatory BP monitoring (ABPM) and home BP monitoring (HBPM) (4–7), which take at least 24 h or 7 days, respectively. Whether MH/MUCH patients can be diagnosed early based on the clinical features of a single outpatient visit is still an open question.
Artificial intelligence (AI) approaches have revolutionized the way data can be processed and analyzed. Several studies have shown the potential benefits of AI in the prediction of cardiac arrhythmias, coronary artery disease, heart failure, and stroke (11, 12). However, the application of AI in hypertension diagnosis or classification is still limited (13).
The current study aimed to develop machine learning-based prediction models using accessible clinical characteristics as input features to identify patients with MH/MUCH in actual clinical settings. The models we developed may facilitate the diagnosis of MH/MUCH.
Materials and Methods
Data Sources and Patient Selection
Data for this study were derived from two cohorts. In the first cohort (cohort 1), patients with hypertension were recruited from six medical centers in Taiwan between 2004 and 2005. The inclusion criteria were as follows: age 20–50 years; patients with essential hypertension; body mass index (BMI) ≤ 35 kg/m2; fasting glucose level <126 mg/dL without diabetes mellitus; no medical history of severe diseases, including malignancy or failure of the heart, lungs, kidneys, or liver; and no acute disease within 2 weeks prior to the visit. Patients with secondary hypertension were excluded from the study. The inclusion and exclusion criteria were described in detailed in a previous unrelated study (14). The study protocol was approved by the ethics committees of Academia Sinica and the six medical centers.
In the second cohort (cohort 2, the external validation set), patients with hypertension who visited the outpatient clinic of Taipei Veteran General Hospital between 2012 and 2020 were included. The inclusion criteria were as follows: age ≥20 years; patients with essential hypertension; without a medical history of severe diseases, including malignancy or failure of the heart, lungs, kidneys, or liver; and no acute disease within 2 weeks prior to the visit. Patients with secondary hypertension were excluded from the study. The inclusion and exclusion criteria were described in detail in a previous unrelated study (15).
All patients in the two cohorts agreed to participate and signed the informed consent document for the study. Data collection from both cohorts were conducted in accordance with the principles of the Declaration of Helsinki.
Study Design
Data from cohort 1 were used to develop prediction models to identify patients with MH/MUCH and for internal validation. Data from cohort 2 were used for external validation. The study flowchart is shown in Figure 1.
Figure 1
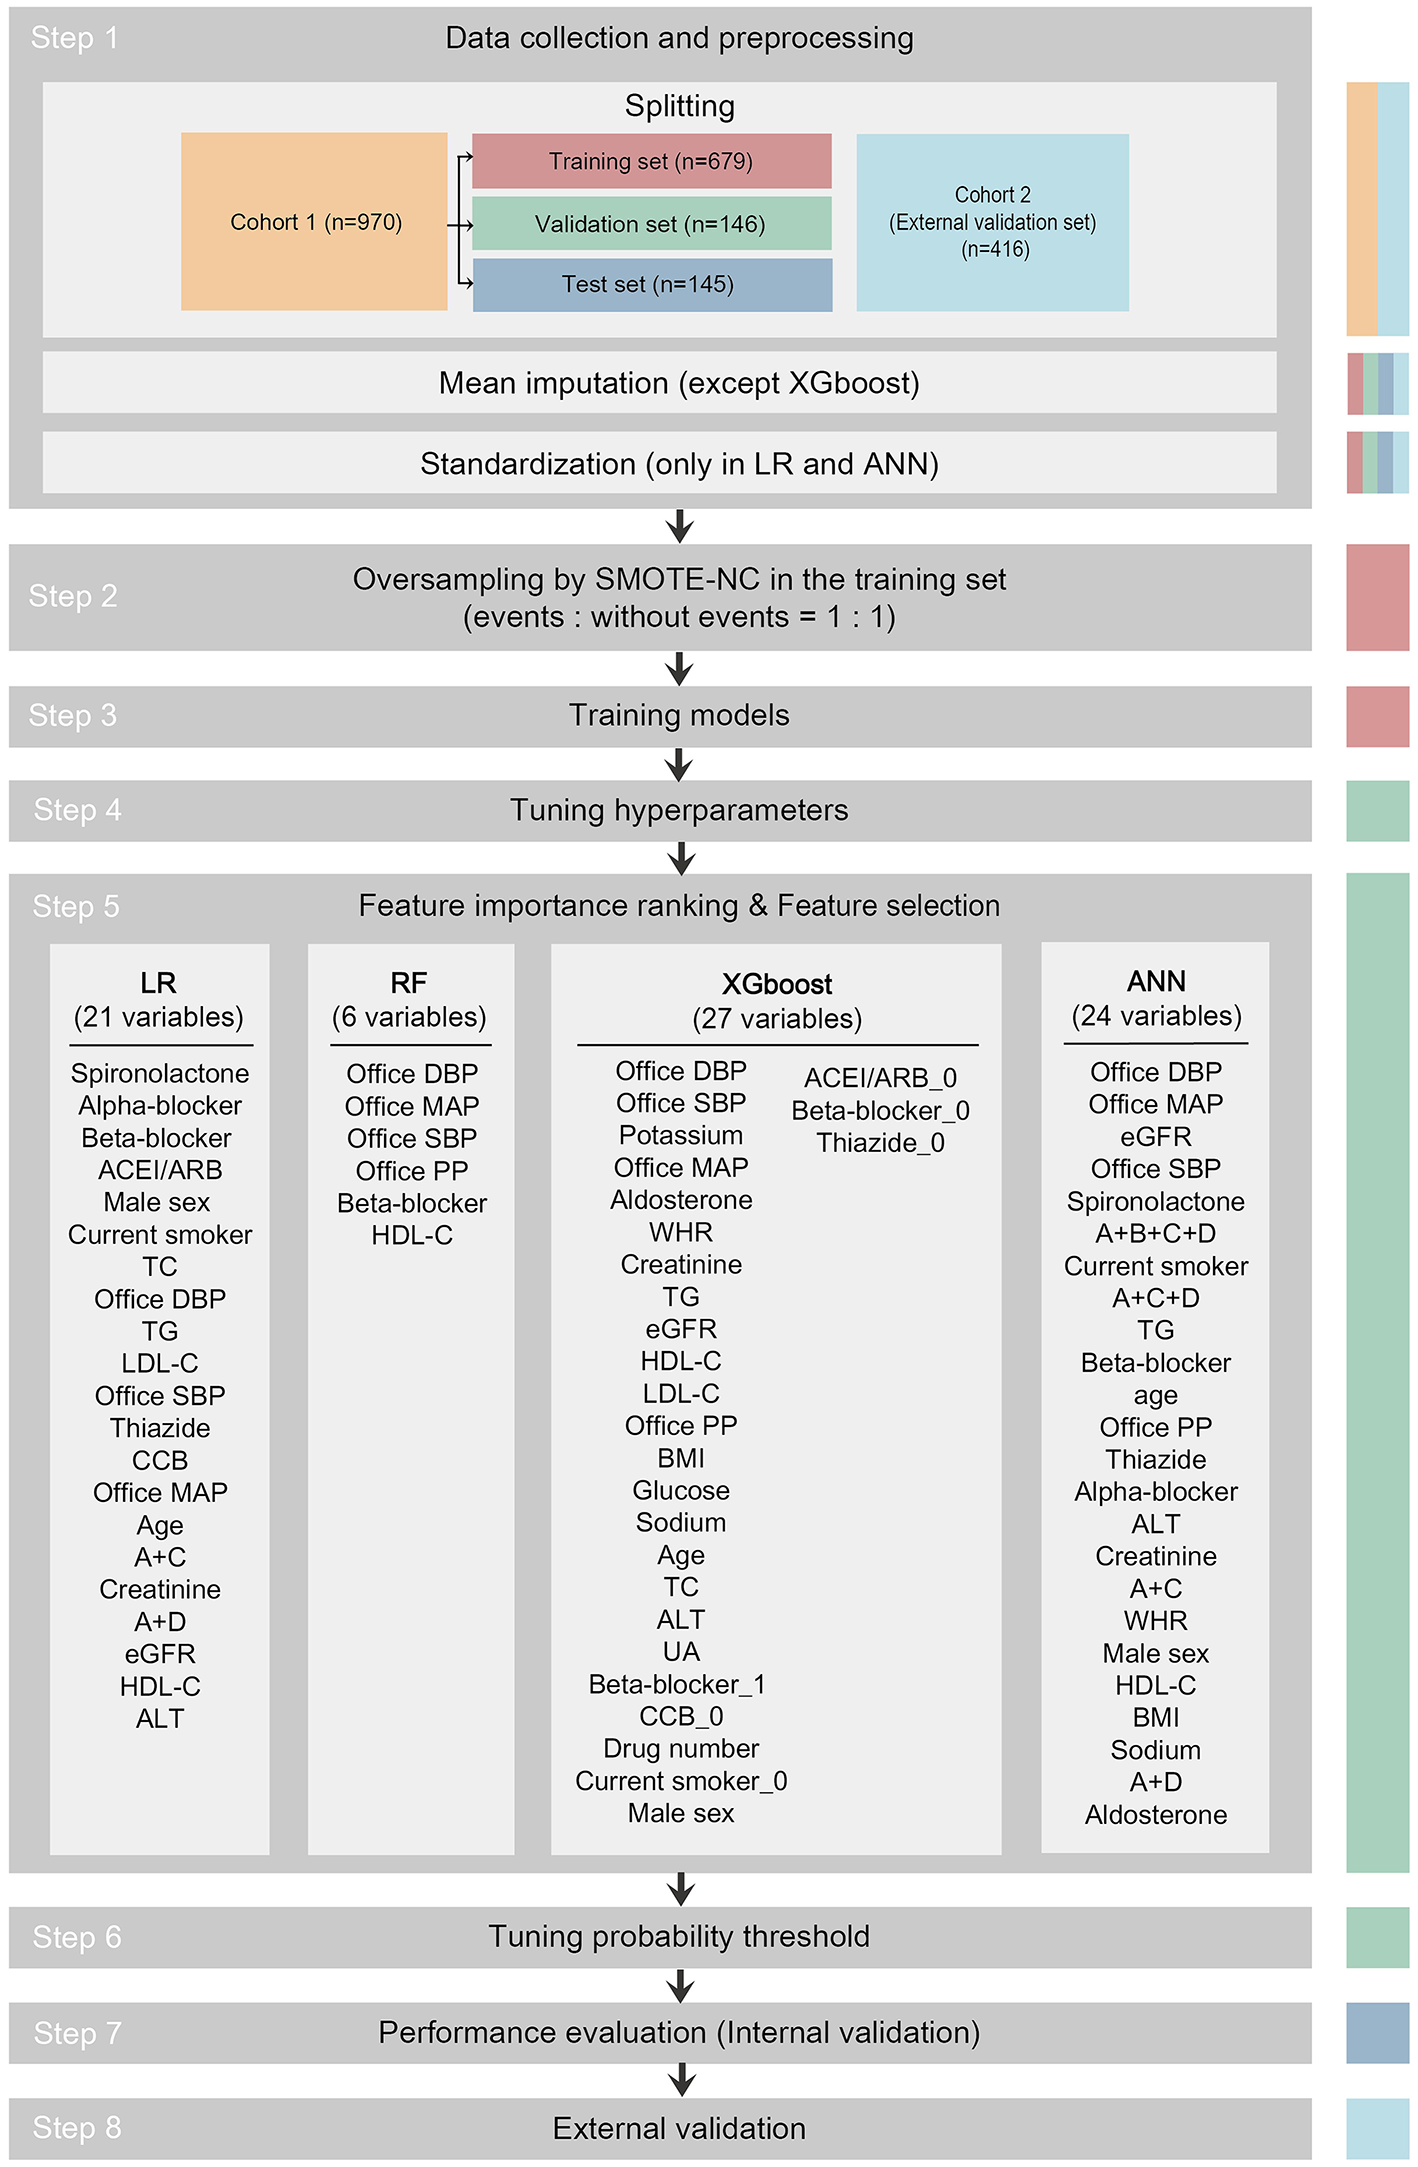
Study flowchart. The data set used in each step is indicated as colored columns on the right side (training set for step 2 and 3, validation set for step 4 to 6, test set for step 7, cohort 2 for step 8). Mean imputation was done to all data sets using the mean of the training set in the LR, RF, and ANN models after splitting. Standardization was done to all data sets in the LR and ANN models after mean imputation. In step 5, 21 among 33 candidate variables were selected as predictor variables in the LR model, 6 in RF, 27 in XGboost, and 24 in ANN. The predictor variables were written in descending order of importance. ACEI/ARB, angiotensin-converting enzyme inhibitor/angiotensin receptor blocker; ACEI/ARB_0, dummy variable of not taking ACEI/ARB; A+B+C+D, combination of ACEI/ARB and beta-blocker and CCB and thiazide; A+C, combination of ACEI/ARB and CCB; A+C+D, combination of ACEI/ARB and CCB and thiazide; A+D, combination of ACEI/ARB and thiazide; ALT, alanine aminotransferase; ANN, artificial neural network; Beta-blocker_1, dummy variable of taking beta-blocker; Beta-blocker_0, dummy variable of not taking beta-blocker; BMI, body mass index; CCB, calcium channel blocker; CCB_0, dummy variable of not taking CCB; Current smoker_0, dummy variable of not current smoker; DBP, diastolic blood pressure; eGFR, estimated glomerular filtration rate; HDL-C, high-density lipoprotein-cholesterol; LDL-C, low-density lipoprotein-cholesterol; LR, logistic regression; MAP, mean arterial pressure; PP, pulse pressure; SMOTE-NC, synthetic minority oversampling technique–nominal continuous; Thiazide_0, dummy variable of not taking thiazide; RF, random forest; SBP, systolic blood pressure; TC, total cholesterol; TG, triglyceride; UA, uric acid; WHR, waist-to-hip ratio; XGboost, eXtreme Gradient Boosting.
Data Collection and Candidate Variables
In total, 73 and 53 variables were recorded in cohort 1 and 2, respectively (Supplementary Table 1). Of these, 33 variables were selected or derived as the candidate variables for the model based on previous literature and taking into account the accessibility of data from outpatient clinics (4, 5, 7, 16–27). These candidate variables were as follows: 1. demographic data [age, male sex, BMI, waist-to-hip ratio (WHR), current smoker]; 2. office BP parameters [office systolic BP (SBP), office diastolic BP (DBP), office mean arterial pressure (MAP), office pulse pressure (PP)]; 3. antihypertensive drug usage [angiotensin-converting enzyme inhibitor/angiotensin receptor blocker (ACEI/ARB), beta-blocker, calcium channel blocker (CCB), thiazide, spironolactone, alpha-blocker, combination of ACEI/ARB and CCB, combination of ACEI/ARB and thiazide, combination of ACEI/ARB and CCB and thiazide, combination of CCB and thiazide, combination of ACEI/ARB and beta-blocker and CCB and thiazide, antihypertensive drug number]; and 4. biochemical profiles [total cholesterol (TC), triglyceride (TG), high-density lipoprotein-cholesterol (HDL-C), low-density lipoprotein-cholesterol (LDL-C), creatinine, sodium, potassium, alanine aminotransferase (ALT), uric acid (UA), glucose, aldosterone, estimated glomerular filtration rate (eGFR)] (Supplementary Material 1).
Definition of MH/MUCH
MH and MUCH were defined as office BP <140/90 mmHg and 24-h average BP ≥ 130/80 mmHg and/or awake (daytime) BP ≥ 130/80 mmHg and/or asleep (nighttime) BP ≥ 120/70 mmHg in untreated and treated patients, respectively (5–7). MH and MUCH were labeled as events based on the office BP and 24-h ambulatory BP measured in each participant in both cohorts.
Prediction Models
Logistic regression (LR), random forest (RF), eXtreme Gradient Boosting (XGboost), and artificial neural network (ANN) were used as the classifiers to obtain a comprehensive spectrum of prediction models. All the models were developed using RStudio (version 1.3.1056, RStudio, PBC, Boston, MA, USA). The algorithms and packages used are listed in Supplementary Table 2. All models returned discriminative outputs of 1 to indicate events or 0 to indicate non-events.
Development of Prediction Models
As shown in Figure 1, the pipeline to develop the prediction models consisted of the following steps: 1. data collection and preprocessing; 2. oversampling; 3. training models; 4. tuning hyperparameters; 5. importance ranking of 33 candidate variables and feature selection for predictor variables; 6. tuning probability threshold; 7. performance evaluation (internal validation); and 8. external validation.
Participants in cohort 1 (n = 970) were randomly split into training set (n = 679), validation set (n = 146), and test set (n = 145) in a 0.7/0.15/0.15 ratio with balanced levels. Missing values in the training set, validation set, test set, and external validation set were replaced by the mean of all available values for the same variable in the training set in the LR, RF, and ANN models (only 3 missing data points out of 26,190 data points in cohort 1 and 63 missing data points out of 11,232 data points in cohort 2). In the LR and ANN models, all variables were scaled (normalized) by subtracting the mean and then dividing by the standard deviation (SD) of the training set.
Given that there was a class imbalance between events and non-events and to overcome the accuracy paradox, we performed the synthetic minority oversampling technique–nominal continuous (SMOTE-NC) to equalize the number of events and non-events in the training set (random oversampling and random undersampling were also performed, but with poorer performance) (28).
To obtain the maximum area under the receiver operating characteristic curve (AUC) in the validation set during model training, we tuned the hyperparameters using a random search technique (29). Feature importance ranking and supervised feature selection were performed to prevent overfitting and to achieve the maximum AUC in the validation set (30). The details of feature selection are presented in Supplementary Material 2. We established the confusion matrix and calculated F1 score (= ) while changing the decision threshold of the classifier from 0 to 1 (threshold-moving) in the validation set. We then selected the optimal probability threshold yielding the largest F1 score and published the final models (Supplementary Material 3). The test set and the external validation set were always independent of the training and tuning processes during the development of the models.
Performance Metrics of Internal Validation
To evaluate the performance of various models in the test set, we computed the sensitivity, specificity, positive predictive value (PPV), negative predictive value (NPV), accuracy, and F1 score. Receiver operating characteristic (ROC) curves were plotted along with the AUC. For AUC calculation, all predicted results were converted to probabilities.
External Validation
The external validity of the model was then evaluated with the external validation set. Model discrimination was assessed by plotting ROC curves and calculating the AUC. The sensitivity, specificity, PPV, NPV, accuracy, and F1 score were also computed.
Statistical Analysis
Quantitative variables are expressed as mean ± SD, and categorical variables are expressed as percentages. Continuous parametric data between cohorts 1 and 2 were compared using an unpaired Student's t-test. Continuous parametric data between the training set, validation set, and test set were compared by one-way analysis of variance. Non-parametric data were compared using the Mann-Whitney test. Categorical variables were analyzed using the chi-square test or Fisher's exact test. Spearman's rank correlation coefficients were calculated between candidate variables. Statistical significance was inferred at a two-sided P-value < 0.05. Statistical analysis was performed using the SPSS software (version 21.0, SPSS Inc., Chicago, IL, USA).
Results
Baseline Characteristics
In cohort 1, there were 970 patients with hypertension; their mean age was 41.0 ± 7.2 years and 68.5% of them were male. Heat map showing the Spearman's correlation coefficients with significance levels of pairwise comparison between variables is presented in Supplementary Figure 1. In cohort 2, there were 416 patients with hypertension; their mean age was 62.0 ± 14.2 years and 57.7% of them were male. Compared to cohort 1, cohort 2 patients had higher WHR (P < 0.001), office SBP (P < 0.001), office PP (P < 0.001), but lower office DBP (P < 0.001); used more antihypertensive drugs (P < 0.001), including more ACEI/ARB (P < 0.001), CCB (P < 0.001), alpha-blockers (P = 0.021), combination of ACEI/ARB and CCB (P < 0.001), combination of ACEI/ARB and CCB and thiazide (P < 0.001), and combination of ACEI/ARB and beta-blocker and CCB and thiazide (P = 0.001), but less beta-blockers (P < 0.001); had lower levels of TG (P < 0.001), TC (P < 0.001), and potassium (P < 0.001), as well as lower eGFR (P < 0.001) (Table 1). Baseline characteristics of the training set, validation set, and test set were similar, except HDL-C (P = 0.038) (Table 2).
Table 1
| Cohort 1 (n = 970) | Cohort 2 (n = 416) | P-value | |
|---|---|---|---|
| Demographic data | |||
| Age, years | 41.0 ± 7.2 | 62.0 ± 14.2 | <0.001 |
| Male sex, n (%) | 664 (68.5%) | 240 (57.7%) | <0.001 |
| BMI, kg/m2 | 26.5 ± 3.4 | 26.1 ± 3.7 | 0.036 |
| WHR, % | 87.6 ± 6.1 | 91.5 ± 7.1 | <0.001 |
| Current smoker, n (%) | 232 (23.9%) | 22 (5.3%) | <0.001 |
| Office BP parameters | |||
| Office SBP, mmHg | 126.1 ± 14.5 | 131.6 ± 16.8 | <0.001 |
| Office DBP, mmHg | 84.9 ± 11.7 | 81.8 ± 10.5 | <0.001 |
| Office MAP, mmHg | 98.7 ± 11.9 | 98.4 ± 11.0 | 0.671 |
| Office PP, mmHg | 41.2 ± 9.8 | 49.8 ± 14.6 | <0.001 |
| Antihypertensive drug usage | |||
| Antihypertensive drug number, n | 1.5 ± 1.0 | 1.9 ± 0.9 | <0.001 |
| ACEI/ARB, n (%) | 410 (42.3%) | 276 (66.3%) | <0.001 |
| Beta-blocker, n (%) | 437 (45.1%) | 104 (25.0%) | <0.001 |
| CCB, n (%) | 405 (41.8%) | 306 (73.6%) | <0.001 |
| Thiazide, n (%) | 157 (16.2%) | 83 (20.0%) | 0.089 |
| Spironolactone, n (%) | 7 (0.7%) | 5 (1.2%) | 0.276 |
| Alpha-blocker, n (%) | 22 (2.3%) | 19 (4.6%) | 0.021 |
| Combination of ACEI/ARB and CCB, n (%) |
71 (7.3%) | 96 (23.1%) | <0.001 |
| Combination of ACEI/ARB and thiazide, n (%) |
36 (3.7%) | 12 (2.9%) | 0.440 |
| Combination of CCB and thiazide, n (%) |
13 (1.3%) | 4 (1.0%) | 0.557 |
| Combination of ACEI/ARB and CCB and thiazide, n (%) |
26 (2.7%) | 34 (8.2%) | <0.001 |
| Combination of ACEI/ARB and beta-blocker and CCB and thiazide, n (%) |
13 (1.3%) | 17 (4.1%) | 0.001 |
| Biochemical profiles | |||
| TC, mg/dL | 195.8 ± 35.4 | 184.4 ± 30.9 | <0.001 |
| TG, mg/dL | 166.1 ± 112.2 | 130.3 ± 90.0 | <0.001 |
| HDL-C, mg/dL | 45.4 ± 12.1 | 48.6 ± 13.0 | <0.001 |
| LDL-C, mg/dL | 126.0 ± 31.4 | 112.0 ± 27.1 | <0.001 |
| Creatinine, mg/dL | 0.8 ± 0.2 | 0.9 ± 0.2 | 0.324 |
| eGFR, mL/min/1.73 m2 | 129.4 ± 38.3 | 86.1 ± 19.2 | <0.001 |
| Sodium, mmol/L | 141.3 ± 2.6 | 141.0 ± 2.5 | 0.076 |
| Potassium, mmol/L | 4.0 ± 0.3 | 3.9 ± 0.6 | <0.001 |
| ALT, U/L | 27.6 ± 19.3 | 26.1 ± 16.6 | 0.167 |
| UA, mg/dL | 6.6 ± 1.7 | 6.1 ± 1.5 | <0.001 |
| Glucose, mg/dL | 98.1 ± 9.2 | 101.9 ± 18.0 | <0.001 |
| Aldosterone, pg/mL | 226.5 ± 121.0 | 122.0 ± 11.5 | <0.001 |
| Ambulatory BP parameters | |||
| 24-h SBP, mmHg | 123.2 ± 12.2 | 122.0 ± 11.5 | 0.068 |
| 24-h DBP, mmHg | 82.6 ± 9.5 | 73.2 ± 8.3 | <0.001 |
| Daytime SBP, mmHg | 126.1 ± 12.7 | 123.9 ± 11.9 | 0.002 |
| Daytime DBP, mmHg | 84.9 ± 9.9 | 74.8 ± 8.5 | <0.001 |
| Nighttime SBP, mmHg | 114.0 ± 12.8 | 117.6 ± 12.9 | <0.001 |
| Nighttime DBP, mmHg | 74.7 ± 10.0 | 69.5 ± 9.3 | <0.001 |
| MUCH/MH, n (%) | 386 (39.8%) | 140 (33.7%) | 0.031 |
Baseline characteristics and the proportion of MH/MUCH in the two cohorts.
ACEI, angiotensin converting enzyme inhibitor; ALT, alanine aminotransferase; ARB, angiotensin receptor blocker; BMI, body mass index; BP, blood pressure; CCB, calcium channel blocker; DBP, diastolic blood pressure; eGFR, estimated glomerular filtration rate; HDL-C, high-density lipoprotein-cholesterol; LDL-C, low-density lipoprotein-cholesterol; MAP, mean arterial pressure; MH, masked hypertension; MUCH, masked uncontrolled hypertension; PP, pulse pressure; SBP, systolic blood pressure; TC, total cholesterol; TG, triglyceride; UA, uric acid; WHR, waist-hip ratio.
Table 2
|
Training set
(n = 679) |
Validation set
(n = 146) |
Test set
(n = 145) |
P-value | |
|---|---|---|---|---|
| Demographic data | ||||
| Age, years | 41.2 ± 6.8 | 40.5 ± 8.1 | 41.1 ± 7.8 | 0.634 |
| Male sex, n (%) | 462 (68.0%) | 105 (71.9%) | 97 (66.9%) | 0.598 |
| BMI, kg/m2 | 26.6 ± 3.4 | 26.3 ± 3.6 | 26.7 ± 3.4 | 0.599 |
| WHR, % | 87.6 ± 6.0 | 87.5 ± 6.8 | 87.6 ± 5.9 | 0.974 |
| Current smoker, n (%) | 174 (25.6%) | 28 (19.2%) | 30 (20.7%) | 0.156 |
| Office BP parameters | ||||
| Office SBP, mmHg | 126.5 ± 14.5 | 125.0 ± 15.5 | 125.3 ± 13.5 | 0.403 |
| Office DBP, mmHg | 85.2 ± 11.5 | 83.5 ± 13.2 | 85.3 ± 11.3 | 0.272 |
| Office MAP, mmHg | 99.0 ± 11.7 | 97.3 ± 13.1 | 98.6 ± 11.4 | 0.327 |
| Office PP, mmHg | 41.4 ± 9.9 | 41.5 ± 10.5 | 40.0 ± 8.6 | 0.295 |
| Antihypertensive drug usage | ||||
| Antihypertensive drug number, n | 1.5 ± 1.0 | 1.6 ± 1.0 | 1.4 ± 0.9 | 0.250 |
| ACEI/ARB, n (%) | 279 (41.1%) | 74 (50.7%) | 57 (39.3%) | 0.076 |
| Beta-blocker, n (%) | 308 (45.4%) | 69 (47.3%) | 60 (41.4%) | 0.576 |
| CCB, n (%) | 286 (42.1%) | 56 (38.4%) | 63 (43.4%) | 0.637 |
| Thiazide, n (%) | 105 (15.5%) | 31 (21.2%) | 21 (14.5%) | 0.191 |
| Spironolactone, n (%) | 3 (0.4%) | 2 (1.4%) | 2 (1.4%) | 0.290 |
| Alpha-blocker, n (%) | 16 (2.4%) | 2 (1.4%) | 4 (2.8%) | 0.700 |
| Combination of ACEI/ARB and CCB, n (%) |
48 (7.1%) | 13 (8.9%) | 10 (6.9%) | 0.726 |
| Combination of ACEI/ARB and thiazide, n (%) |
26 (3.8%) | 7 (4.8%) | 3 (2.1%) | 0.449 |
| Combination of CCB and thiazide, n (%) |
9 (1.3%) | 3 (2.1%) | 1 (0.7%) | 0.598 |
| Combination of ACEI/ARB and CCB and thiazide, n (%) |
21 (3.1%) | 1 (0.7%) | 4 (2.8%) | 0.263 |
| Combination of ACEI/ARB and beta-blocker and CCB and thiazide, n (%) |
10 (1.5%) | 3 (2.1%) | 0 (0.0%) | 0.269 |
| Biochemical profiles | ||||
| TC, mg/dL | 194.5 ± 34.7 | 200.4 ± 36.0 | 197.0 ± 37.7 | 0.171 |
| TG, mg/dL | 168.2 ± 110.1 | 172.3 ± 135.0 | 150.0 ± 94.7 | 0.158 |
| HDL-C, mg/dL | 44.8 ± 11.1 | 46.2 ± 13.9 | 47.4 ± 14.0 | 0.038 |
| LDL-C, mg/dL | 125.1 ± 31.4 | 128.9 ± 31.5 | 127.2 ± 31.7 | 0.359 |
| Creatinine, mg/dL | 0.8 ± 0.2 | 0.9 ± 0.2 | 0.8 ± 0.2 | 0.553 |
| eGFR, mL/min/1.73 m2 | 130.0 ± 38.1 | 126.4 ± 41.0 | 129.4 ± 36.5 | 0.594 |
| Sodium, mmol/L | 141.2 ± 2.6 | 141.6 ± 2.8 | 141.2 ± 2.4 | 0.273 |
| Potassium, mmol/L | 4.1 ± 0.3 | 4.0 ± 0.3 | 4.0 ± 0.3 | 0.421 |
| ALT, U/L | 27.8 ± 19.2 | 27.2 ± 18.9 | 26.8 ± 20.0 | 0.805 |
| UA, mg/dL | 6.7 ± 1.7 | 6.7 ± 1.8 | 6.5 ± 1.6 | 0.421 |
| Glucose, mg/dL | 98.1 ± 9.1 | 97.5 ± 9.0 | 98.4 ± 10.0 | 0.667 |
| Aldosterone, pg/mL | 225.4 ± 126.9 | 232.6 ± 97.0 | 225.1 ± 115.2 | 0.799 |
| Ambulatory BP parameters | ||||
| 24-h SBP, mmHg | 123.1 ± 12.1 | 123.0 ± 12.7 | 124.1 ± 11.8 | 0.659 |
| 24-h DBP, mmHg | 82.6 ± 9.4 | 81.7 ± 10.0 | 83.0 ± 9.6 | 0.483 |
| Daytime SBP, mmHg | 125.9 ± 12.7 | 126.1 ± 13.3 | 126.9 ± 12.3 | 0.670 |
| Daytime DBP, mmHg | 85.0 ± 9.8 | 84.3 ± 10.4 | 85.2 ± 9.9 | 0.661 |
| Nighttime SBP, mmHg | 114.1 ± 12.7 | 113.0 ± 13.1 | 114.5 ± 12.7 | 0.568 |
| Nighttime DBP, mmHg | 74.9 ± 9.8 | 73.5 ± 10.4 | 75.4 ± 10.2 | 0.219 |
| MH/MUCH, n (%) | 264 (38.9%) | 64 (43.8%) | 58 (40.0%) | 0.539 |
Baseline characteristics and the proportion of MH/MUCH in the training set, validation set, and test set.
ACEI, angiotensin converting enzyme inhibitor; ALT, alanine aminotransferase; ANN, artificial neural networks; ARB, angiotensin receptor blocker; BP, blood pressure; BMI, body mass index; CCB, calcium channel blocker; DBP, diastolic blood pressure; eGFR, estimated glomerular filtration rate; HDL-C, high-density lipoprotein-cholesterol; LDL-C, low-density lipoprotein-cholesterol; LR, logistic regression; MAP, mean arterial pressure; MH, masked hypertension; MUCH, masked uncontrolled hypertension; PP, pulse pressure; RF, random forest; SBP, systolic blood pressure; TC, total cholesterol; TG, triglyceride; UA, uric acid; WHR, waist-hip ratio; XGboost, eXtreme Gradient Boosting.
Proportion of MH/MUCH
In cohort 1, 386 patients fulfilled the criteria of MH/MUCH (39.8%). In cohort 2, 140 patients fulfilled the criteria of MH/MUCH (33.7%). The proportions of MH/MUCH were higher in cohort 1 (P = 0.031) (Table 1).
The proportions of MH/MUCH were similar among the training set (38.9%), validation set (43.8%), and test set (40.0%) (Table 2).
Hyperparameters and Importance Rank of Candidate Variables
The tuned hyperparameters in the four models are presented in Supplementary Table 3. The top 10 important variables and their importance in each model are listed in Supplementary Table 4. The importance matrix plot of the RF model is presented in Supplementary Figure 2.
Feature Selection
The validation plot showing the trend of AUC to the number of features in the validation set is shown in Figure 2. Twenty one predictor variables (spironolactone, alpha-blocker, beta-blocker, ACEI/ARB, male sex, current smoker, TC, office DBP, TG, LDL-C, office SBP, thiazide, CCB, office MAP, age, combination of ACEI/ARB and CCB, creatinine, combination of ACEI/ARB and thiazide, eGFR, HDL-C, and ALT, written in descending order of importance) obtained the largest AUC in the LR model. Six predictor variables (office DBP, office MAP, office SBP, office PP, beta-blocker, and HDL-C, written in descending order of importance) obtained the largest AUC in the RF model. Twenty seven predictor variables (office DBP, office SBP, potassium, office MAP, aldosterone, WHR, creatinine, TG, eGFR, HDL-C, LDL-C, office PP, BMI, glucose, sodium, age, TC, ALT, UA, dummy variable of taking beta-blocker, dummy variable of not taking CCB, antihypertensive drug number, dummy variable of not current smoker, male sex, dummy variable of not taking ACEI/ARB, dummy variable of not taking beta-blocker, and dummy variable of not taking thiazide, written in descending order of importance) obtained the largest AUC in the XGboost model. Twenty four predictor variables (office DBP, office MAP, eGFR, office SBP, spironolactone, combination of ACEI/ARB and beta-blocker and CCB and thiazide, current smoker, combination of ACEI/ARB and CCB and thiazide, TG, beta-blocker, age, office PP, thiazide, alpha-blocker, ALT, creatinine, combination of ACEI/ARB and CCB, WHR, male sex, HDL-C, BMI, sodium, combination of ACEI/ARB and thiazide, and aldosterone, written in descending order of importance) obtained the largest AUC in the ANN model (Figures 1, 2).
Figure 2
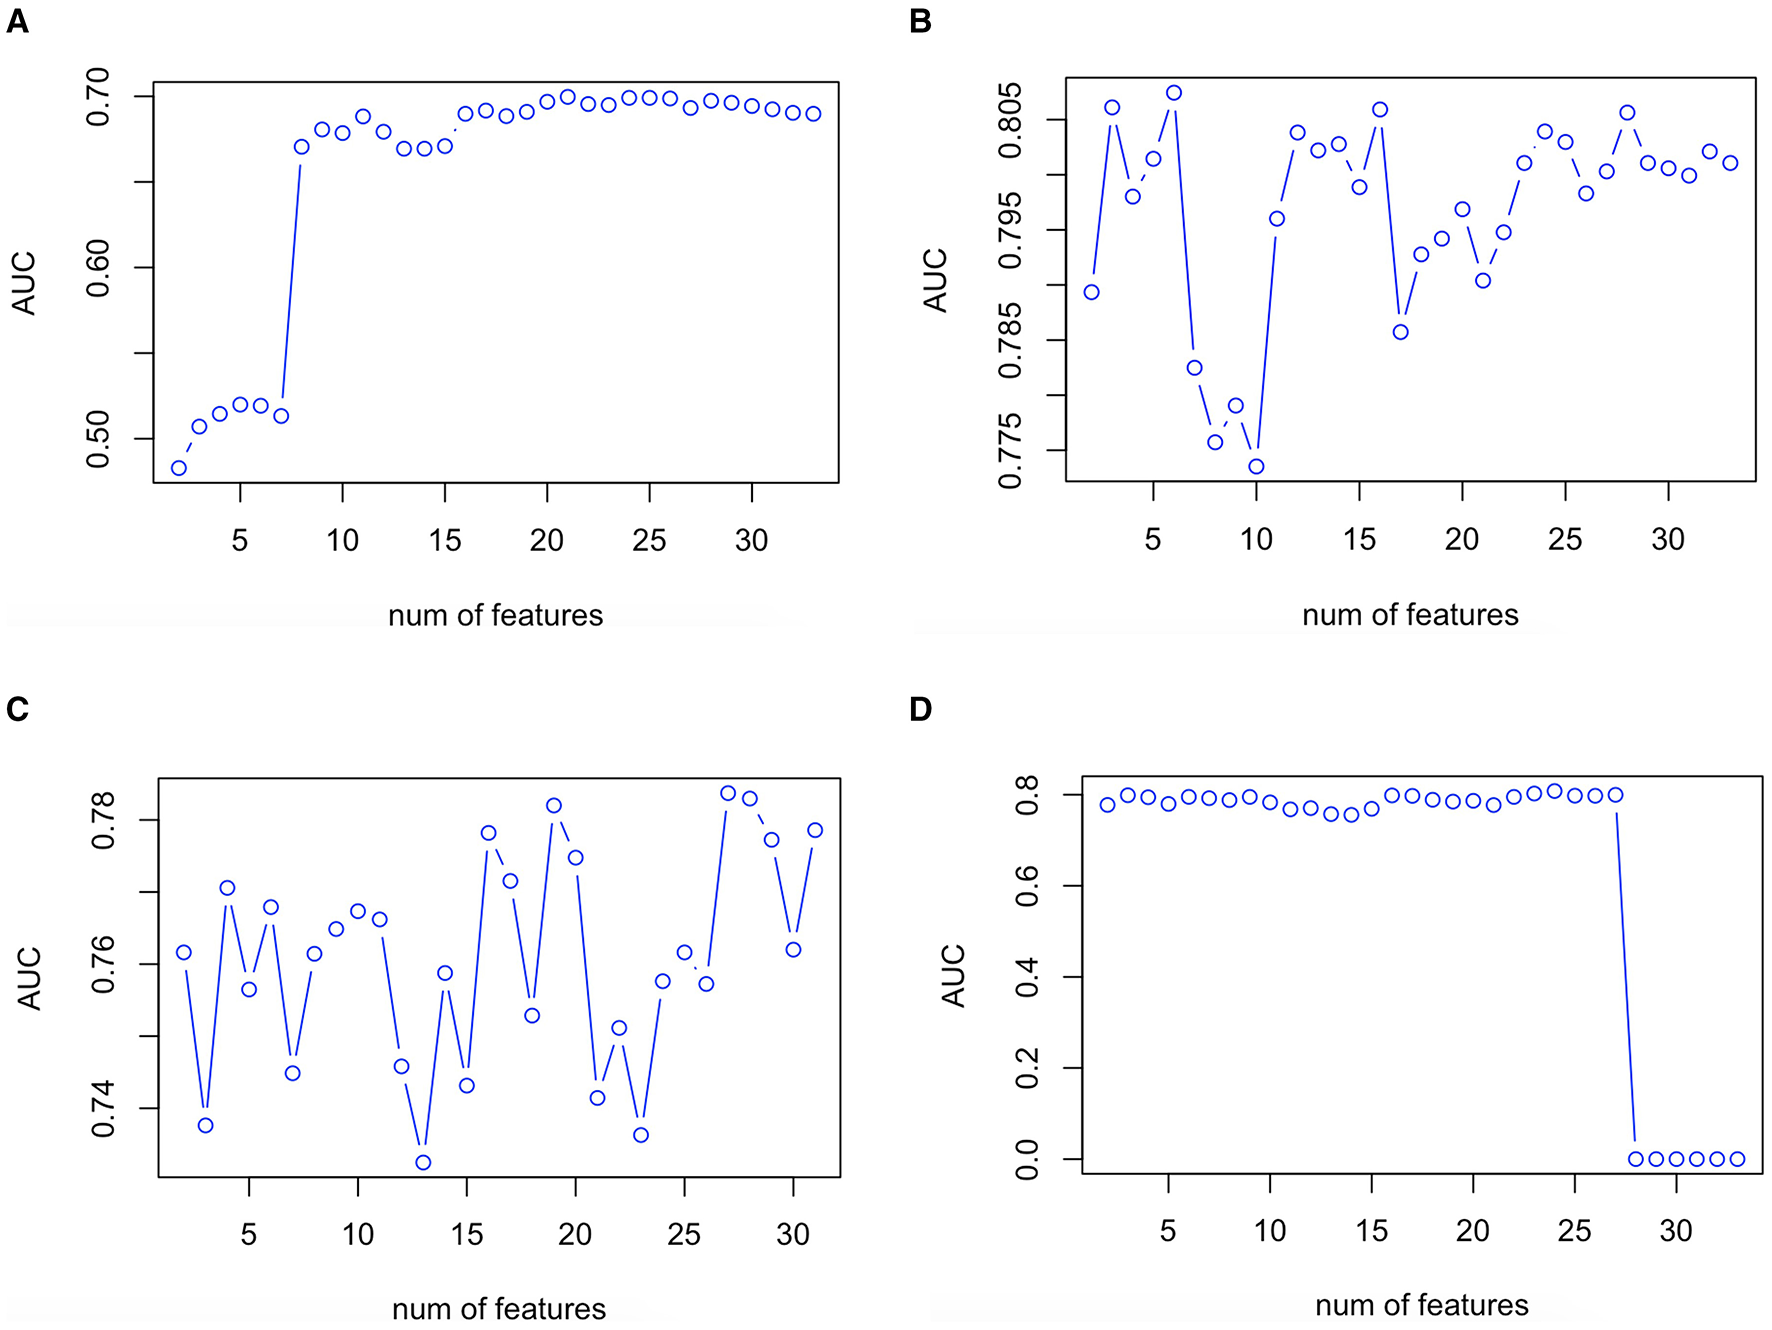
Validation plot of feature selection in the LR (A), RF (B), XGboost (C), and ANN (D) models. First spot starts in two features. ANN, artificial neural network; AUC, area under the receiver operating characteristic curve; LR, logistic regression; RF, random forest; XGboost, eXtreme Gradient Boosting.
Probability Threshold
The optimal probability thresholds were 0.211, 0.112, 0.020, and 0.245 for the LR, RF, XGboost, and ANN models, respectively.
Performance of Prediction Models in Internal Validation
Figure 3A presents the ROC curves and the AUC obtained in the test set. The RF model exhibited the largest AUC (0.851, 95% CI 0.789–0.913), whereas the LR model exhibited the smallest AUC (0.674, 95% CI 0.586–0.762).
Figure 3
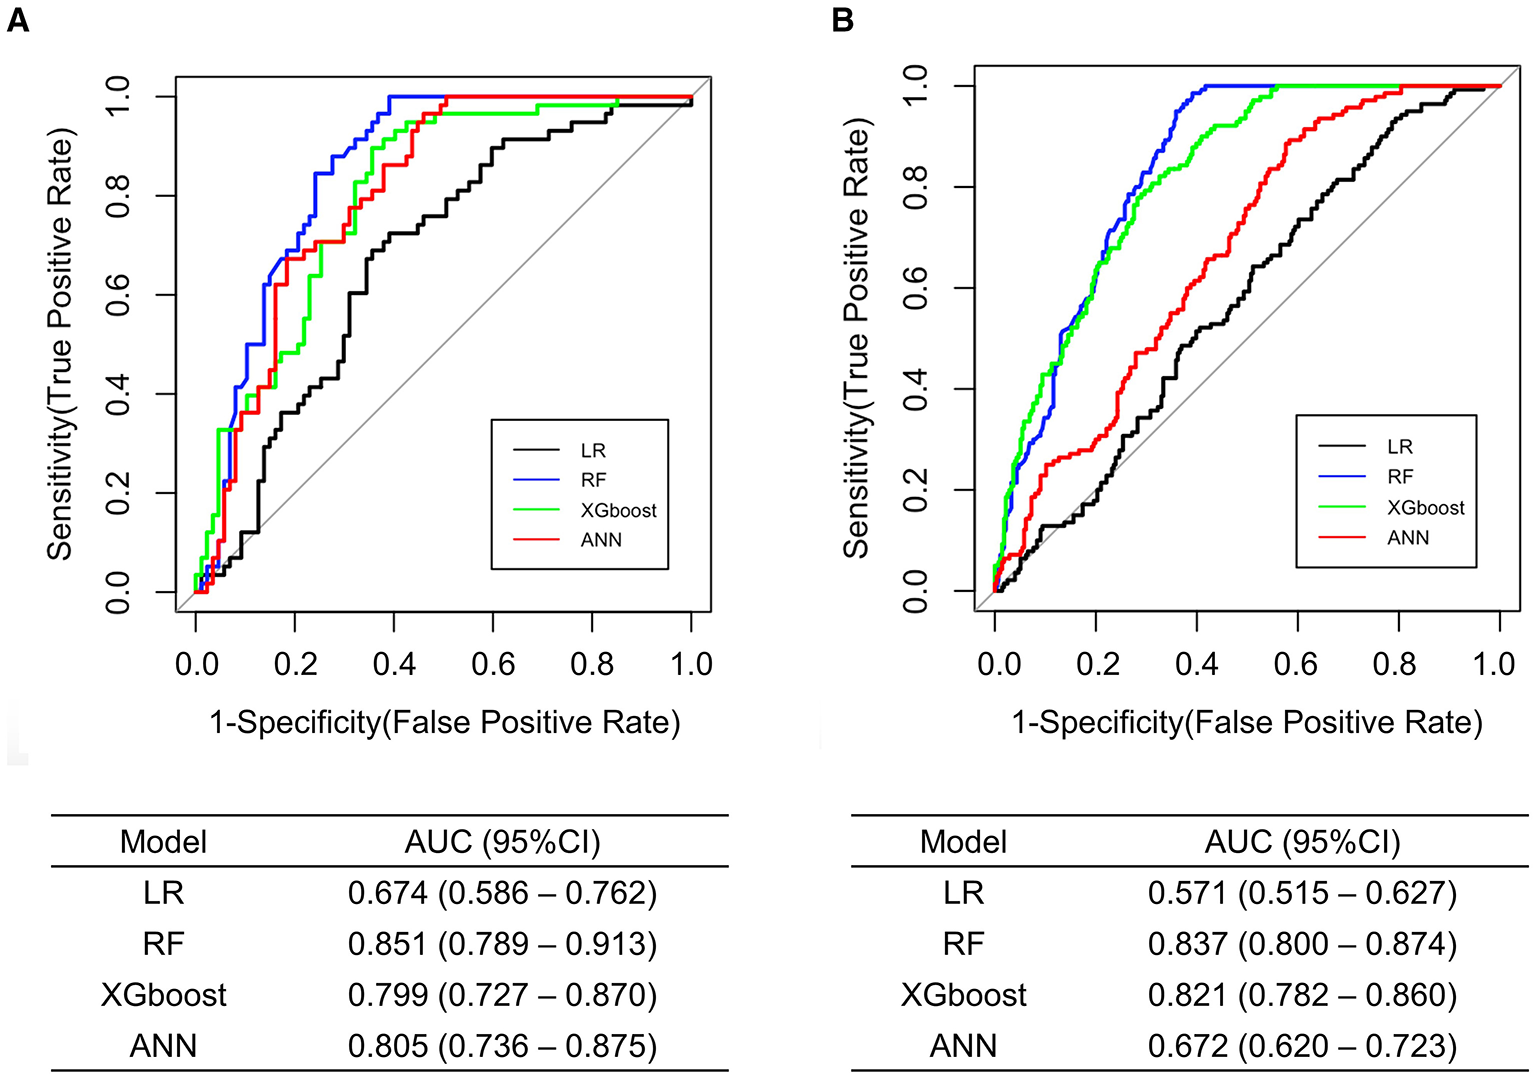
Comparison of the ROC curves and the AUC among the developed models for MH/MUCH prediction in internal (A) and external validation (B). ANN, artificial neural network; AUC, area under the curve; CI, confidence interval; LR, logistic regression; MH/MUCH, masked hypertension/masked uncontrolled hypertension; RF, random forest; ROC, receiver operating characteristic; XGboost, eXtreme Gradient Boosting.
The confusion matrix and performance metrics of the four models in the test set were assessed (Table 3). All models had a high sensitivity for the prediction of MH/MUCH (0.914–1.000). The NPVs in the RF, XGboost, and ANN models were also high (0.927–1.000). However, the specificity (0.333–0.609), PPV (0.478–0.630), and accuracy (0.566–0.766) were relatively low in the four models. Among the four models, the RF model exhibited the highest sensitivity (1.000, 95% CI 1.000–1.000), specificity (0.609, 95% CI 0.507–0.712), PPV (0.630, 95% CI 0.532–0.729), NPV (1.000, 95% CI 1.000–1.000), accuracy (0.766, 95% CI 0.688–0.832), and F1 score (0.773).
Table 3
| Model |
Actual
MH/MUCH |
Sensitivity
(95% CI) |
Specificity
(95% CI) |
PPV
(95% CI) |
NPV
(95% CI) |
Accuracy
(95% CI) |
||||
|---|---|---|---|---|---|---|---|---|---|---|
| 1 | 0 | |||||||||
| Internal validation | LR | Predicted MH/MUCH |
1
0 |
53 5 |
58 29 |
0.914 (0.842–0.986) |
0.333 (0.234–0.432) |
0.478 (0.385–0.570) |
0.853 (0.734–0.972) |
0.566 (0.481–0.648) |
| RF |
1
0 |
58 0 |
34 53 |
1.000 (1.000–1.000) |
0.609 (0.507–0.712) |
0.630 (0.532–0.729) |
1.000 (1.000–1.000) |
0.766 (0.688–0.832) |
||
| XGboost |
1
0 |
54 4 |
36 51 |
0.931 (0.866–0.996) |
0.586 (0.483–0.690) |
0.600 (0.499–0.701) |
0.927 (0.859–0.996) |
0.724 (0.644–0.795) |
||
| ANN |
1
0 |
55 3 |
39 48 |
0.948 (0.891–1.005) |
0.552 (0.447–0.656) |
0.585 (0.486–0.685) |
0.941 (0.877–1.006) |
0.710 (0.629–0.783) |
||
| External validation | LR | Predicted MH/MUCH |
1
0 |
133 7 |
227 49 |
0.950 (0.914–0.986) |
0.178 (0.132–0.223) |
0.369 (0.320–0.419) |
0.875 (0.788–0.962) |
0.438 (0.389–0.487) |
| RF |
1
0 |
140 0 |
116 160 |
1.000 (1.000–1.000) |
0.580 (0.521–0.638) |
0.547 (0.486–0.608) |
1.000 (1.000–1.000) |
0.721 (0.675–0.764) |
||
| XGboost |
1
0 |
137 3 |
149 127 |
0.979 (0.955–1.003) |
0.460 (0.401–0.519) |
0.479 (0.421–0.537) |
0.977 (0.951–1.003) |
0.635 (0.586–0.681) |
||
| ANN |
1
0 |
138 2 |
213 63 |
0.986 (0.966–1.005) |
0.228 (0.179–0.278) |
0.393 (0.342–0.444) |
0.969 (0.927–1.011) |
0.483 (0.434–0.532) |
||
Confusion matrix and performance metrics among the developed models for MH/MUCH prediction (1 represents with MH/MUCH; 0 represents without MH/MUCH).
ANN, artificial neural network; CI, confidence interval; LR, logistic regression; MH/MUCH, masked hypertension/masked uncontrolled hypertension; NPV, negative predictive value; PPV, positive predictive value; RF, random forest; XGboost, eXtreme Gradient Boosting.
Supplementary Figures 3, 4 present the example decision tree plots in the training set of the RF and XGboost models, respectively.
Performance of Prediction Models in External Validation
The ROC curves and the AUC are shown in Figure 3B. Similar to the results in internal validation, the RF model exhibited the largest AUC (0.837, 95% CI 0.800–0.874), whereas the LR model exhibited the smallest AUC (0.571, 95% CI 0.515–0.627).
The confusion matrix and performance metrics of the four models in the external validation set were assessed (Table 3). All models had high sensitivity for the prediction of MH/MUCH (0.950–1.000). The NPVs in the RF, XGboost, and ANN models were also high (0.969–1.000). However, the specificity (0.178–0.580), PPV (0.369–0.547), and accuracy (0.438–0.721) were relatively low. Among the four models, the RF model exhibited the highest sensitivity (1.000, 95% CI 1.000–1.000), specificity (0.580, 95% CI 0.521–0.638), PPV (0.547, 95% CI 0.486–0.608), NPV (1.000, 95% CI 1.000–1.000), accuracy (0.721, 95% CI 0.675–0.764), and F1 score (0.707).
Discussion
In the present study, we developed four models for MH/MUCH prediction using patient features obtained in a single outpatient visit and tested them. All models had high sensitivity and NPV. The RF, XGboost, and ANN models had AUC and F1 scores that surpassed those of the LR model. Among them, the RF model, composed of 6 predictor variables, exhibited the best overall performance. In addition, age, male sex, current smoker, office SBP, office DBP, office MAP, office PP, eGFR, creatinine, TG, HDL-C, ALT, beta-blocker, and thiazide were selected as predictor variables in more than three models, indicating their close association with MH/MUCH.
Patients with MH/MUCH had a significantly higher risk of cardiac/cerebrovascular events than those with controlled hypertension but a similar risk to those with sustained hypertension (9, 10). Identifying these patients and initiating appropriate treatment is a priority. Currently, out-of-office BP monitoring, either ABPM or HBPM, is the gold standard to diagnose these patients (4–7). However, the use of out-of-office BP monitoring is usually limited for many reasons, such as the shortage of resources, great consumption of time, poor compliance, and poor adherence of patients (31, 32). It is important to find a more efficient way to identify this particular patient group.
To the best of our knowledge, the present study is the first to report the development and evaluation of prediction models for MH/MUCH. The strength of the present study is the reasonable discrimination of the RF model in the external validation set, despite the high dissimilarity between cohort 1 and 2. The temporal, geographical, and domain validation of our model (33) prove its transportability and applicability to actual outpatient settings. It was suggested that a high NPV, as in the present study, is desirable when a condition is serious, largely asymptomatic, or if treatment for a condition is advisable early in its course (34), which matches the features of MH/MUCH (24).
The reason the RF model produced the best performance may be attributable to its ability to overcome the multicollinearity of our given data (35). The RF algorithm was previously used to define SBP variability features for cardiovascular outcome prediction in the Systolic Blood Pressure Intervention Trial (SPRINT) trial (36). While interpreting the importance of multi-colinear variables is still difficult in the RF algorithm, accuracy is much less affected (37), making it a favorable algorithm. Some of the given variables in our dataset are highly correlated (Supplementary Figure 1), creating a significant hindrance to linear algorithms such as LR (38).
It is interesting to point out that eGFR and creatinine were included as predictor variables in three models. Several studies have shown that MH/MUCH is associated with the development of chronic kidney disease (CKD) and the progression of kidney disease (16, 17). MUCH/MH is also common in patients with CKD and associated with lower eGFR (18), which is consistent with our finding that eGFR and creatinine were important variables for the prediction of MH/MUCH.
In the present study, HDL-C and TG were predictor variables selected in all and three models, respectively. Previous studies have found a correlation between metabolic syndrome and MH/MUCH (6, 19, 20). Although one study reported that MH patients had greater waist circumference and lower HDL-C than normotensives (19), another study showed that only office BP contributed significantly (20). Our results suggest that among the criteria for metabolic syndrome, HDL-C and TG have higher significance with the exception of office BP. These findings mark the complexity of MH/MUCH pathophysiology, and also imply that different parameters in metabolic syndrome have variable degrees of impact or association with MH/MUCH, providing us with further insights into the underlying mechanisms.
It has been suggested by previous studies that patients with MH/MUCH tend to have a more active sympathetic tone out of the office due to neurogenic abnormalities (21–23). In the present study, beta-blocker and alpha-blocker are chosen in all and two models, respectively, and these drugs are sympathetic antagonists commonly used to treat CVD and hypertension. However, these associations are indicated by cross-sectional comparisons, and direct causal inferences cannot be ascertained.
As for demographic variables, previous studies showed that smoking was associated with MH/MUCH (5, 6, 24–27). The prevalence of MH/MUCH is also found to be greater in men (5, 6, 24, 27). It is consistent with our finding that current smoker and male sex were important variables for the prediction of MH/MUCH.
In the present study, MH/MUCH was defined according to daytime as well as nighttime ambulatory BP. Patients with MH/MUCH increased from 276 (28.5%) to 386 (39.8%) in cohort 1 and increased from 70 (16.8%) to 140 (33.7%) in cohort 2 when we included nighttime BP as one of our criteria to define MH/MUCH aside from office BP, 24-h average BP, and daytime ambulatory BP. High prevalence of nighttime MUCH (or masked uncontrolled nocturnal hypertension) was also noted in the study by Coccina F et al. in which 357 (48.5%) patients among 738 treated hypertensive patients were reported to have nighttime MUCH (39). In their study, patients with nighttime MUCH had an increased risk of cardiovascular events compared to those with controlled hypertension. With our models, physicians could identify patients with not only daytime but also nighttime MH/MUCH.
Study Limitations
The current study has several limitations that must be considered. First, external validation was only performed in patients with hypertension in Taiwan. Data with more representation of diverse populations, a larger sample size, and untreated patients must be obtained to demonstrate better transportability. Second, there were some differences between the inclusion criteria of the two cohorts. Compared to cohort 2, cohort 1 had additional inclusion criteria of “age ≤ 50 years old,” “BMI ≤ 35 kg/m2”, and “fast glucose level <126 mg/dL with no diabetes mellitus.” Despite the differences of baseline characteristics between the two cohorts, the performance of our models in external validation was acceptable. Third, HBPM was not included in the diagnostic criteria for MH/MUCH. Even though previous studies showed a greater importance of ABPM to MH (24, 40), the present study may be limited by not identifying all MH/MUCH patients. Forth, some variables found to be related to MH/MUCH were not available in our cohorts, such as echocardiographic variables (41). Finally, our models were developed to predict MH and MUCH together. However, there are potential different pathophysiology and etiology behind MH and MUCH (6, 24). Although some previous studies also did not differentiate MUCH from MH (41–44), further studies should be considered to develop models of MH and MUCH separately in order to increase the accuracy of prediction models.
Conclusion
Patients with MH/MUCH are at an increased risk of CVD compared to patients with controlled hypertension. Due to their “masking nature,” they are, however, largely underdiagnosed and often left untreated. Our machine learning-based prediction models, especially RF, could assist physicians with their ability to detect MH/MUCH patients using clinical data obtained in a single outpatient visit. Through timely and proper handling of these models, patients with MH/MUCH could be able to receive early diagnosis and appropriate treatment to prevent cardiovascular events in the future.
Funding
The authors disclosed receipt of the following financial support for the research, authorship, and/or publication of this article: This work was supported by research grants V101B-004, V102B-024, V103C-019, V104C-025, V106C-120, V108C-151, VGHUST108-G1-3-2, VTA108-V1-7-2, and V110C-058 from Taipei Veterans General Hospital, Taipei, Taiwan, ROC and by research grant MOST108-2314-B-075-062-MY3 from the Ministry of Science and Technology, Taiwan, ROC. The funders had no role in data collection or preparation of the manuscript.
Publisher's Note
All claims expressed in this article are solely those of the authors and do not necessarily represent those of their affiliated organizations, or those of the publisher, the editors and the reviewers. Any product that may be evaluated in this article, or claim that may be made by its manufacturer, is not guaranteed or endorsed by the publisher.
Statements
Data availability statement
The raw data supporting the conclusions of this article will be made available by the authors, without undue reservation.
Ethics statement
The studies involving human participants were reviewed and approved by Taipei Veterans General Hospital. The patients/participants provided their written informed consent to participate in this study.
Author contributions
M-HH, L-CS, and Y-CW contributed to conception and design, analysis and interpretation of data, and drafted the manuscript. H-BL, P-HH, T-CW, S-JL, W-HP, and J-WC contributed to data acquisition and drafted the manuscript. C-CH contributed to conception, data acquisition, analysis and interpretation of data, and drafted and critically revised the manuscript. All authors gave final approval and agreed to be accountable for all aspects of work ensuring integrity and accuracy.
Conflict of interest
The authors declare that the research was conducted in the absence of any commercial or financial relationships that could be construed as a potential conflict of interest.
Supplementary material
The Supplementary Material for this article can be found online at: https://www.frontiersin.org/articles/10.3389/fcvm.2021.778306/full#supplementary-material
References
1.
Zhou B Bentham J Di Cesare M Bixby H Danaei G Cowan MJ et al . Worldwide trends in blood pressure from 1975 to 2015: a pooled analysis of 1479 population-based measurement studies with 19·1 million participants. Lancet. (2017) 389:37–55. 10.1016/S0140-6736(16)31919-5
2.
Chow CK Teo KK Rangarajan S Islam S Gupta R Avezum A et al . Prevalence, awareness, treatment, and control of hypertension in rural and urban communities in high-, middle-, and low-income countries. JAMA. (2013) 310:959–68. 10.1001/jama.2013.184182
3.
Kario K Thijs L Staessen JA . Blood pressure measurement and treatment decisions. Circ Res. (2019) 124:990–1008. 10.1161/CIRCRESAHA.118.313219
4.
Whelton PK Carey RM Aronow WS Casey DE Jr Collins KJ Dennison Himmelfarb C et al . 2017 ACC/AHA/AAPA/ABC/ACPM/AGS/APhA/ASH/ASPC/NMA/PCNA guideline for the prevention, detection, evaluation, and management of high blood pressure in adults: a report of the American college of cardiology/American heart association task force on clinical practice guidelines. Hypertension. (2018) 71: e13–15. 10.1161/HYP.0000000000000065
5.
Williams B Mancia G Spiering W Agabiti Rosei E Azizi M Burnier M et al . 2018 ESC/ESH guidelines for the management of arterial hypertension: the task force for the management of arterial hypertension of the European Society of Cardiology (ESC) and the European Society of Hypertension (ESH). Eur Heart J. (2018) 39:3021–104. 10.1093/eurheartj/ehy339
6.
Franklin SS O'Brien E Thijs L Asayama K Staessen JA . Masked hypertension: a phenomenon of measurement. Hypertension. (2015) 65:16–20. 10.1161/HYPERTENSIONAHA.114.04522
7.
O'Brien E Parati G Stergiou G Asmar R Beilin L Bilo G et al . European society of hypertension position paper on ambulatory blood pressure monitoring. J Hypertens. (2013) 31:1731–68. 10.1097/HJH.0b013e328363e964
8.
Gorostidi M Vinyoles E Banegas JR de la Sierra A . Prevalence of white-coat and masked hypertension in national and international registries. Hypertens Res. (2015) 38:1–7. 10.1038/hr.2014.149
9.
Pierdomenico SD Pierdomenico AM Coccina F Clement DL De Buyzere ML De Bacquer DA et al . Prognostic value of masked uncontrolled hypertension. Hypertension. (2018) 72:862–9. 10.1161/HYPERTENSIONAHA.118.11499
10.
Thakkar HV Pope A Anpalahan M . Masked hypertension: a systematic review. Heart Lung Circ. (2020) 29:102–11. 10.1016/j.hlc.2019.08.006
11.
Krittanawong C Virk HUH Bangalore S Wang Z Johnson KW Pinotti R et al . Machine learning prediction in cardiovascular diseases: a meta-analysis. Sci Rep. (2020) 10:16057. 10.1038/s41598-020-72685-1
12.
Sevakula RK Au-Yeung WM Singh JP Heist EK Isselbacher EM Armoundas AA . State-of-the-art machine learning techniques aiming to improve patient outcomes pertaining to the cardiovascular system. J Am Heart Assoc. (2020) 9:e013924. 10.1161/JAHA.119.013924
13.
Chaikijurajai T Laffin LJ Tang WHW . Artificial intelligence and hypertension: recent advances and future outlook. Am J Hypertens. (2020) 33:967–974. 10.1093/ajh/hpaa102
14.
Huang CC Chung CM Leu HB Lin TH Hung SI Wu TC et al . Genetic variation in C-reactive protein in ethnic Chinese population in Taiwan. Eur J Clin Invest. (2013) 43:449–56. 10.1111/eci.12067
15.
Hung MH Huang CC Chung CM Chen JW . 24-h ambulatory blood pressure variability and hypertensive nephropathy in Han Chinese hypertensive patients. J Clin Hypertens. (2021) 23:281–8. 10.1111/jch.14108
16.
Mwasongwe S Min YI Booth JN 3rd Katz R Sims M Correa A et al . Masked hypertension and kidney function decline: the jackson heart study. J Hypertens. (2018) 36:1524–32. 10.1097/HJH.0000000000001727
17.
Rahman M Wang X Bundy JD Charleston J Cohen D Cohen J et al . Prognostic significance of ambulatory BP monitoring in CKD: a report from the chronic renal insufficiency cohort (CRIC) study. J Am Soc Nephrol. (2020) 31:2609–21. 10.1681/ASN.2020030236
18.
Drawz PE Alper AB Anderson AH Brecklin CS Charleston J Chen J et al . Masked hypertension and elevated nighttime blood pressure in CKD: prevalence and association with target organ damage. Clin J Am Soc Nephrol. (2016) 11:642–52. 10.2215/CJN.08530815
19.
Hänninen MR Niiranen TJ Puukka PJ Jula AM . Metabolic risk factors and masked hypertension in the general population: the finn-home study. J Hum Hypertens. (2014) 28:421–6. 10.1038/jhh.2013.129
20.
Colantonio LD Anstey DE Carson AP Ogedegbe G Abdalla M Sims M et al . Metabolic syndrome and masked hypertension among African Americans: the jackson heart study. J Clin Hypertens. (2017) 19:592–600. 10.1111/jch.12974
21.
Grassi G Seravalle G Trevano FQ Dell'oro R Bolla G Cuspidi C et al . Neurogenic abnormalities in masked hypertension. Hypertension. (2007) 50:537–42. 10.1161/HYPERTENSIONAHA.107.092528
22.
Siddiqui M Judd EK Jaeger BC Bhatt H Dudenbostel T Zhang B et al . Out-of-clinic sympathetic activity is increased in patients with masked uncontrolled hypertension. Hypertension. (2019) 73:132–41. 10.1161/HYPERTENSIONAHA.118.11818
23.
Siddiqui M Judd EK Zhang B Dudenbostel T Carey RM Oparil S et al . Masked uncontrolled hypertension is accompanied by increased out-of-clinic aldosterone secretion. Hypertension. (2021) 77:435–44. 10.1161/HYPERTENSIONAHA.120.15950
24.
Franklin SS O'Brien E Staessen JA . Masked hypertension: understanding its complexity. Eur Heart J. (2017) 38:1112–8. 10.1093/eurheartj/ehw502
25.
Zhang DY Huang JF Kang YY Dou Y Su YL Zhang LJ et al . The prevalence of masked hypertension in relation to cigarette smoking in a Chinese male population. J Hypertens. (2020) 38:1056–63. 10.1097/HJH.0000000000002392
26.
Bromfield SG Shimbo D Booth JN 3rd Correa A Ogedegbe G Carson AP et al . Cardiovascular risk factors and masked hypertension: the Jackson heart study. Hypertension. (2016) 68:1475–82. 10.1161/HYPERTENSIONAHA.116.08308
27.
Sheppard JP Fletcher B Gill P Martin U Roberts N McManus RJ . Predictors of the home-clinic blood pressure difference: a systematic review and meta-analysis. Am J Hypertens. (2016) 29:614–25. 10.1093/ajh/hpv157
28.
Blagus R Lusa L . SMOTE for high-dimensional class-imbalanced data. BMC Bioinform. (2013) 14:106. 10.1186/1471-2105-14-106
29.
Bergstra J Bengio Y . Random search for hyper-parameter optimization. J Mach Learn Res. (2012) 13:281–305.
30.
Goodfellow I Bengio Y Courville A . Deep Learning. 1st ed. Cambridge: MIT press (2016).
31.
Townsend RR . Out-of-office blood pressure monitoring: a comparison of ambulatory blood pressure monitoring and home (self) monitoring of blood pressure. Hypertension. (2020) 76:1667–73. 10.1161/HYPERTENSIONAHA.120.14650
32.
Stergiou GS Palatini P Parati G O'Brien E Januszewicz A Lurbe E et al . 2021 European society of hypertension practice guidelines for office and out-of-office blood pressure measurement. J Hypertens. (2021) 39:1293–302. 10.1097/HJH.0000000000002843
33.
Moons KG Kengne AP Grobbee DE Royston P Vergouwe Y Altman DG et al . Risk prediction models: II. External validation, model updating, and impact assessment. Heart. (2012) 98:691–8. 10.1136/heartjnl-2011-301247
34.
Trevethan R . Sensitivity, specificity, and predictive values: foundations, pliabilities, and pitfalls in research and practice. Front Public Health. (2017) 5:307. 10.3389/fpubh.2017.00307
35.
Genuer R Poggi J-M Tuleau-Malot C . Variable selection using random forests. Pattern Recogn Lett. (2010) 31:2225–36. 10.1016/j.patrec.2010.03.014
36.
Lacson RC Baker B Suresh H Andriole K Szolovits P Lacson E Jr . Use of machine-learning algorithms to determine features of systolic blood pressure variability that predict poor outcomes in hypertensive patients. Clin Kidney J. (2019) 12:206–12. 10.1093/ckj/sfy049
37.
Kutner M Nachtsheim C Neter J . Applied Linear Statistical Models. 4th ed. New York, NY: McGraw-Hill (2004).
38.
James G Witten D Hastie T Tibshirani R . An Introduction to Statistical Learning: With Applications in R. 1st ed. New York, NY: Springer (2013).
39.
Coccina F Pierdomenico AM Cuccurullo C Pizzicannella J Madonna R Trubiani O et al . Prognostic value of masked uncontrolled hypertension defined by different ambulatory blood pressure criteria. Am J Hypertens. (2020) 33:726–33. 10.1093/ajh/hpaa078
40.
Anstey DE Muntner P Bello NA Pugliese DN Yano Y Kronish IM et al . Diagnosing masked hypertension using ambulatory blood pressure monitoring, home blood pressure monitoring, or both?Hypertension. (2018) 72:1200–7. 10.1161/HYPERTENSIONAHA.118.11319
41.
Cuspidi C Facchetti R Quarti-Trevano F Sala C Tadic M Grassi G et al . Incident left ventricular hypertrophy in masked hypertension. Hypertension. (2019) 74:56–62. 10.1161/HYPERTENSIONAHA.119.12887
42.
Cuspidi C Facchetti R Bombelli M Sala C Tadic M Grassi G et al . Risk of new-onset metabolic syndrome associated with white-coat and masked hypertension: data from a general population. J Hypertens. (2018) 36:1833–9. 10.1097/HJH.0000000000001767
43.
Tientcheu D Ayers C Das SR McGuire DK de Lemos JA Khera A et al . Target organ complications and cardiovascular events associated with masked hypertension and white-coat hypertension: analysis from the Dallas heart study. J Am Coll Cardiol. (2015) 66:2159–69. 10.1016/j.jacc.2015.09.007
44.
Gkaliagkousi E Protogerou AD Argyris AA Koletsos N Triantafyllou A Anyfanti P et al . Contribution of single office aortic systolic blood pressure measurements to the detection of masked hypertension: data from two separate cohorts. Hypertens Res. (2021) 44:215–24. 10.1038/s41440-020-00550-9
Summary
Keywords
ambulatory blood pressure monitoring, artificial intelligence, machine learning, hypertension, masked hypertension, masked uncontrolled hypertension
Citation
Hung M-H, Shih L-C, Wang Y-C, Leu H-B, Huang P-H, Wu T-C, Lin S-J, Pan W-H, Chen J-W and Huang C-C (2021) Prediction of Masked Hypertension and Masked Uncontrolled Hypertension Using Machine Learning. Front. Cardiovasc. Med. 8:778306. doi: 10.3389/fcvm.2021.778306
Received
16 September 2021
Accepted
28 October 2021
Published
19 November 2021
Volume
8 - 2021
Edited by
Michele Ciccarelli, University of Salerno, Italy
Reviewed by
Lucia Soriente, University of Sannio, Italy; Stefano Omboni, Istituto Italiano di Telemedicina, Italy
Updates
Copyright
© 2021 Hung, Shih, Wang, Leu, Huang, Wu, Lin, Pan, Chen and Huang.
This is an open-access article distributed under the terms of the Creative Commons Attribution License (CC BY). The use, distribution or reproduction in other forums is permitted, provided the original author(s) and the copyright owner(s) are credited and that the original publication in this journal is cited, in accordance with accepted academic practice. No use, distribution or reproduction is permitted which does not comply with these terms.
*Correspondence: Chin-Chou Huang cchuang4@vghtpe.gov.tw; huangchinchou@gmail.com
This article was submitted to Hypertension, a section of the journal Frontiers in Cardiovascular Medicine
Disclaimer
All claims expressed in this article are solely those of the authors and do not necessarily represent those of their affiliated organizations, or those of the publisher, the editors and the reviewers. Any product that may be evaluated in this article or claim that may be made by its manufacturer is not guaranteed or endorsed by the publisher.