Abstract
Objectives:
Most patients with acute aortic dissection (AAD) have a history of hypertension. Diagnosis of AAD in patients with hypertension at an early stage is complicated and challenging. This study aimed to explore the distinctive metabolic changes in plasma samples of AAD patients with hypertension and patients with hypertension only and provide early identification and diagnosis of AAD in patients with hypertension.
Materials and methods:
We collected blood samples from 20 patients with type A AAD and hypertension admitted to the emergency department and physically examined other 20 patients with hypertension as controls. The plasma metabolomic profiles of these patients were determined using untargeted metabolomics with ultra-high-performance liquid chromatography-quadrupole time-of-flight mass spectrometry.
Results:
A total of 38 metabolites that differed between the AAD and hypertension groups were screened. In the positive ion mode, 12 metabolites were different between the two groups, and in the negative ion mode, 26 metabolites were different. Among the 26 different metabolites detected by the negative ion mode, 21 were significantly upregulated and five were downregulated in patients with AAD compared to patients with hypertension. Moreover, five metabolites were upregulated and seven were significantly downregulated in patients with AAD compared to those with hypertension, as detected by the positive ion mode. The metabolites differentially expressed in AAD were mainly involved in lipid metabolism (fatty acid biosynthesis, biosynthesis of unsaturated fatty acids, and linoleic acid metabolism), carbohydrate metabolism (galactose, fructose, and mannose metabolisms), and membrane transport (ATP-binding cassette transporters). Interestingly, plasma hydrocortisone and dimethylglycine concentrations were significantly increased in patients with type A AAD, with the highest area under the curve value (AUC = 0.9325 or 0.9200, respectively) tested by the receiver operating characteristic curve analysis.
Conclusion:
This study provides possible metabolic markers for the early clinical diagnosis of AAD in patients with hypertension.
Introduction
The normal aortic wall is divided into three layers, the innermost tunica intima, the tunica media, and the tunica adventitia (1). Acute aortic dissection (AAD) is the most devastating aortic pathology caused by the tearing of the tunica intima, which is gradually stripped owing to the impact of bloodstream flow under the action of many pathogenic factors (2). According to the Oxford Vascular Study in Britain, the annual incidence of AAD in developed countries is approximately 6/100,000 (3), and the prevalence of aortic dissection in people over 65 years in the United States is 8%, ranking 13th among the disease killers in the United States (4). In China, diagnostics and living standards have increasingly improved yearly. Due to incomplete statistics, our country has a tendency to experience an increase in the incidence of AAD and show a trend of younger age. Without treatment, the weekly mortality rate for AAD is 37% and increases to 75% in 2 weeks (5). Hypertension is considered one of the most critical risk factors for AAD development and is observed in 65–75% of patients with AAD (6). In China, hypertension diagnosis, treatment, and control have been much lower than in developed countries (7). Despite its importance, reliable estimation of AAD incidence and survival is challenging (8). Therefore, timely screening and diagnosis of AAD in patients with hypertension are of great significance for the prevention, treatment, and prognosis of aortic dissection (9, 10).
Currently, the clinical auxiliary diagnosis of AAD relies mainly on computed tomography angiography (CTA) (11). However, CTA has several limitations. For example, it requires intravenous contrast agents, which should not be used in patients who are allergic to it, and radiation exposure from CTA is not appropriate for particular patients such as pregnant women. Although peripheral blood detection is a rapid and less invasive option, reliable peripheral blood markers for AAD are lacking. The recently identified early peripheral blood biomarkers for AAD [D-dimer, creatine kinase-BB, matrix metalloproteinases (MMPs), and elastin] are not sufficiently specific. Therefore, a sensitive, accurate, non-invasive, and time-sensitive biomarker is needed in clinical practice to facilitate the early detection and intervention of AAD.
Metabolomics has recently emerged as a novel technique to provide comprehensive quantitative measurements of endogenous metabolites within biological systems (12). Metabolomic studies may help better understand the underlying mechanisms and discover new diagnostic markers for AAD. This study aimed to investigate the distinctive metabolic changes in plasma samples from patients with type A AAD and identify sensitive metabolic candidate biomarkers for diagnosing AAD using a metabolomics platform.
Materials and methods
Samples from participants
Forty blood samples from 20 patients with type A AAD and hypertension and 20 samples from patients with hypertension only were obtained from the Xiamen Cardiovascular Hospital of Xiamen University from December 2019 to January 2021. The study protocol was approved by the Ethics Committee of Xiamen Cardiovascular Hospital of Xiamen University, and informed consent was obtained from each participant. AAD in patients with hypertension was confirmed by CTA with an accurate and false lumen of the aortic wall. Based on physical examination, hypertensive patients without other cardiovascular diseases were randomly selected from those with a confirmed diagnosis of hypertension in our hospital. Patients with connective tissue disorders or atherosclerotic cardiovascular disease were excluded.
Metabolite sample preparation
Plasma samples from the 40 patients were slowly thawed at 4°C, and an appropriate amount of the sample was added to a pre-cooled methanol/acetonitrile/water solution (2:2:1, v/v). After eddy mixing, low-temperature ultrasound for 30 min, standing at –20°C for 10 min, and centrifugation at 14000 × g and 4°C for 20 min, the supernatant was vacuum-dried, and 100 μL of acetonitrile-water solution was added during mass spectrometry (acetonitrile:water = 1:1, v/v) for redissolution. After centrifuging the samples at 14000 × g and 4°C for 15 min, the supernatants were ready for analysis (13).
Ultra-performance liquid chromatography-tandem mass spectrometry analysis
The experimental conditions for chromatography are as follows (14): Samples were separated using an Agilent 1290 Infinity LC ultra-performance liquid chromatography (UHPLC) column. The flow rate was 0.5 mL/min, and the injection volume was 2 μL. Mobile phase composition: A was water with 25 mM ammonium acetate and 25 mM ammonia and B was acetonitrile. The gradient elution procedure was as follows: 0–0.5 min, 95% B; 0.5–7 min, B changed linearly from 95 to 65%; 7–8 min, B changed linearly from 65 to 40%; 8–9 min, B remained at 40%; 9–9.1 min, B changed linearly from 40 to 95%; 9.1–12 min, B was maintained at 95%. The samples were placed in an automatic sampler at 4°C throughout the analysis. To avoid the influence of the fluctuation of the instrument detection signal, continuous analysis of the samples was carried out in a random sequence. The quality control (QC) samples were inserted into the sample queue to monitor and evaluate the stability and reliability of the experimental data.
The ESI source conditions were set as follows: Ion Source Gas1 (Gas1), 60; Ion Source Gas2 (Gas2), 60; curtain gas (CUR), 30; source temperature, 600°C; and ion spray voltage floating, ± 5500 V. In MS acquisition, the instrument was set to acquire over the mass-to-charge ratio (m/z) range of 60–1000 Da, and the accumulation time for the TOF MS scan was set at 0.20 s/spectra. In the auto MS/MS acquisition, the instrument was set to acquire over the m/z range of 25–1000 Da, and the accumulation time for the production scan was set at 0.05 s/spectra. The production scan was acquired using information-dependent acquisition with a high-sensitivity mode. The parameters were set as follows: the collision energy was fixed at 35 V with ± 15 eV; de-clustering potential, at 60 V (+), and –60V (–), excluding isotopes within 4 Da; and candidate ions to monitor per cycle, 10.
Quality controls
Comparison of total ion flow diagrams of quality control samples
The total ion chromatograms of the QC samples were superimposed and compared. The experimental results showed that each chromatographic peak’s response strength and retention time overlapped, indicating that the variation caused by instrument error was slight during the entire experimental process.
Principal component analysis of the total samples
Principal component analysis (PCA) was performed on the peaks extracted from all experimental and QC samples. The results showed that QC samples in the positive and negative ion modes were closely clustered together, indicating good reproducibility of the experiment.
Data processing
The raw MS data (wiff.scan files) were converted to MzXML files using ProteoWizard MS Convert before importing them into the freely available XCMS software. For peak picking, the following parameters were used: center-wave m/z = 25 ppm, peak width = c (10, 60), and prefilter = c (10, 100). For the peak grouping, bw = 5, mzwid = 0.025, and minfrac = 0.5. Collection of Algorithms of MEtabolite pRofile Annotation (CAMERA) was used to annotate isotopes and adducts. Only variables with >50% of the non-zero measurement values in the extracted ion features were kept in at least one group. Compound identification of metabolites was performed by comparing the accuracy of m/z values (<25 ppm) and MS/MS spectra with an in-house database established with authentic standards.
Statistical analyses
After normalization to the total peak intensity, the processed data were analyzed using the R package (ropes), where they were subjected to multivariate data analysis, including Pareto-scaled PCA and orthogonal partial least-squares discriminant analysis (OPLS-DA). The 7-fold cross-validation and response permutation testing were performed to evaluate the robustness of the model. The variable importance in the projection (VIP) value of each variable in the OPLS-DA model was calculated to indicate its contribution to the classification. Metabolites with VIP values >1 were further subjected to Student’s t-test at the univariate level to measure the significance of each metabolite. Statistical significance was set at p < 0.05.
Results
General data of participants
Forty participants, including 20 patients with AAD plus hypertension and 20 with hypertension only from the Xiamen Cardiovascular Hospital of Xiamen University, were recruited. The detailed data of the two groups are summarized in Table 1. There were no significant differences in age, sex, height, weight, or body mass index between the AAD and hypertension groups. Urea, blood glucose, creatinine, and uric acid values did not differ between the AAD and hypertension groups. Both groups were diagnosed with hypertension: systolic blood pressure (148.60 ± 17.25 in the hypertension group vs. 147.30 ± 28.32 in the AAD group, P = 0.8618) and diastolic pressure (91.80 ± 9.61 in the hypertension group vs. 93.15 ± 14.17 in the AAD group, P = 0.7263). Moreover, the D-dimer (10.84 ± 10.94 mg/L) and hs-CRP (35.54 ± 53.40 mg/L) of the AAD group were higher than the standard value range (<0.55 mg/L or <3 mg/L), but these values were not detected in the hypertension group.
TABLE 1
| Items | Hypertension (n = 20) |
Acute aortic dissection (n = 20) |
P-value |
| Age (years) | 56.35 ± 15.30 | 58.10 ± 15.30 | 0.6472 |
| Gender ratio (M/F) | 12:8 | 10:10 | – |
| Height (cm) | 162.20 ± 8.76 | 160.70 ± 8.16 | 0.5876 |
| Weight (kg) | 58.85 ± 10.40 | 59.50 ± 10.11 | 0.8423 |
| BMI (kg/m2) | 22.25 ± 2.63 | 22.97 ± 3.10 | 0.4317 |
| Systolic blood pressure (mmHg) | 148.60 ± 17.25 | 147.30 ± 28.32 | 0.8618 |
| Diastolic pressure (mmHg) | 91.80 ± 9.61 | 93.15 ± 14.17 | 0.7263 |
| D-dimer (mg/L) | Not detected | 10.84 ± 10.94 | – |
| Hs-CRP (mg/L) | Not detected | 35.54 ± 53.40 | – |
| Urea (mmol/L) | 6.84 ± 4.78 | 7.48 ± 3.55 | 0.6362 |
| Blood glucose (mmol/L) | 7.47 ± 1.63 | 8.62 ± 2.75 | 0.1167 |
| Creatinine (mmol/L) | 82.68 ± 63.07.6 | 83.53 ± 29.96 | 0.9566 |
| Uric acid (mmol/L) | 379.90 ± 126.76 | 329.34 ± 141.45 | 0.2413 |
The clinical information of AAD patients and hypertension patients.
Statistical analysis of samples and distributions of different metabolites
The volcano maps with p < 0.05 and log2FC > 0.5 are shown as positive (Figure 1A) and negative (Figure 1B) ion modes, respectively. Before analyzing the differentially expressed metabolites, we validated the algorithm model used in the analysis using PCA, partial least squares discrimination analysis (PLS-DA), and OPLS-DA. PCA is an unsupervised data analysis method that re-linearly combines all identified metabolites to form a new set of comprehensive variables and selects some of them according to the analyzed problem. The distribution of metabolic profiles for the samples in the PCA was exhibited in ESI positive (Figure 1C) and negative (Figure 1D) ion modes. PCA results showed that the two groups could not be effectively separated. In the subsequent analysis, the two methods, PLA-DA and OPLS-DA were applied to eliminate information and perform orthogonal signal correction to further process the above results. PLS-DA is supervised statistical discriminant analysis. OPLS-DA is a modified analytic method for PLS-DA that can filter out noises irrelevant to classification information and improve the analytical ability and effectiveness of the model. The PLS-DA (Figure 1E, positive ion mode; Figure 1G, negative ion mode) and OPLS-DA (Figure 1I, positive ion mode; Figure 1K, negative ion mode) score plots in both ESI positive and negative modes indicated that the cluster of patients with AAD was well separated from those with hypertension, suggesting that the overall metabolic pattern was altered in the plasma of both patients with AAD plus hypertension and hypertension only. Specifically, the explanation rates for the Y variable (R2Y) and prediction ability (Q2) were 0.9482 and 0.06424 in the positive ion mode (Figure 1F) and 0.7668 and –0.6385 in the negative ion mode (Figure 1H) in the PLS-DA model, respectively. In the OPLS-DA, R2Y and Q2 were 0.9445 and –0.5331 in the positive ion mode (Figure 1J) and 0.8755 and –0.4011 in the negative ion mode (Figure 1L), respectively, which confirmed the stability and reliability of the OPLS-DA mode.
FIGURE 1
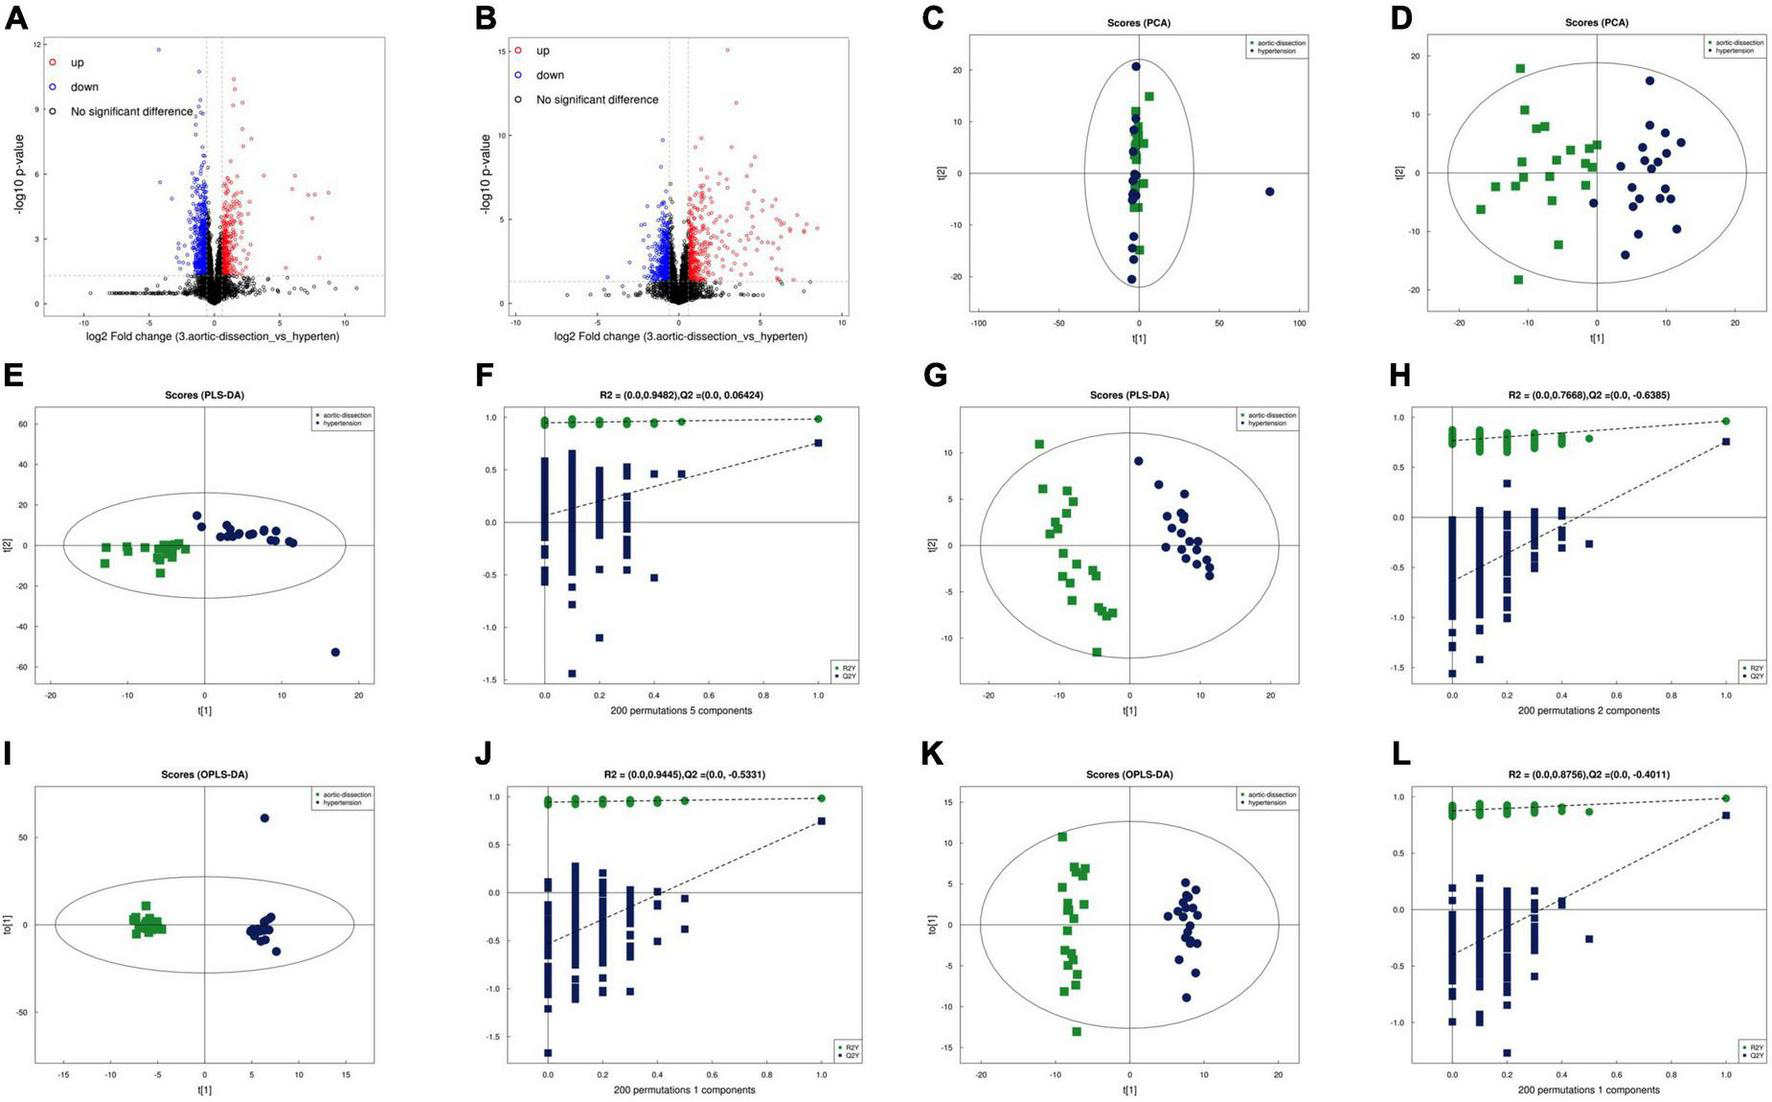
Separation and classification of metabolic profiles in plasma from the AAD and hypertension groups. Volcano plot of positive (A) and negative (B) ion mode results. PCA score plots of the AAD and hypertension groups in the positive (C) and negative (D) ion modes. PLS-DA score plots of AAD and hypertension groups in the positive (E) and negative (F) mode and the cumulative fitness (R2 value) and prediction power (Q2 value) of the PLS-DA analysis in the positive (G) and negative (H) ion mode. OPLS-DA score plots of AAD and hypertension groups in the positive (I) and negative (J) ion mode and the cumulative fitness (R2 value) and prediction power (Q2 value) of the OPLS-DA analysis in the positive (K) and negative ion modes (L). The t [1] and t [2] values in the figures represent the scores of each sample in principal components 1 and 2, respectively. Each dot on the plot represents a sample in the corresponding group. PCA: principal component analysis; PLS-DA: orthogonal partial least square discriminant analysis; PLS-DA: a partial least square discriminant analysis.
A total of 9902 and 9337 m/z features were detected in the positive and negative ion modes, respectively, from the plasma samples of the two groups. In the positive mode, 12 m/z features were significantly different between patients with AAD and hypertension (P < 0.05); 5 m/z features showed a fold change (FC) > 1, and 7 m/z features showed an FC < 1 between patients with AAD and hypertension (P < 0.05) (Figures 2A,C and Table 2). In the negative mode, 26 m/z features were significantly different between patients with AAD and hypertension (P < 0.05); 21 m/z features had an FC > 1.5, and 5 m/z features had an FC < 1 (Figures 2B,D and Table 3).
FIGURE 2
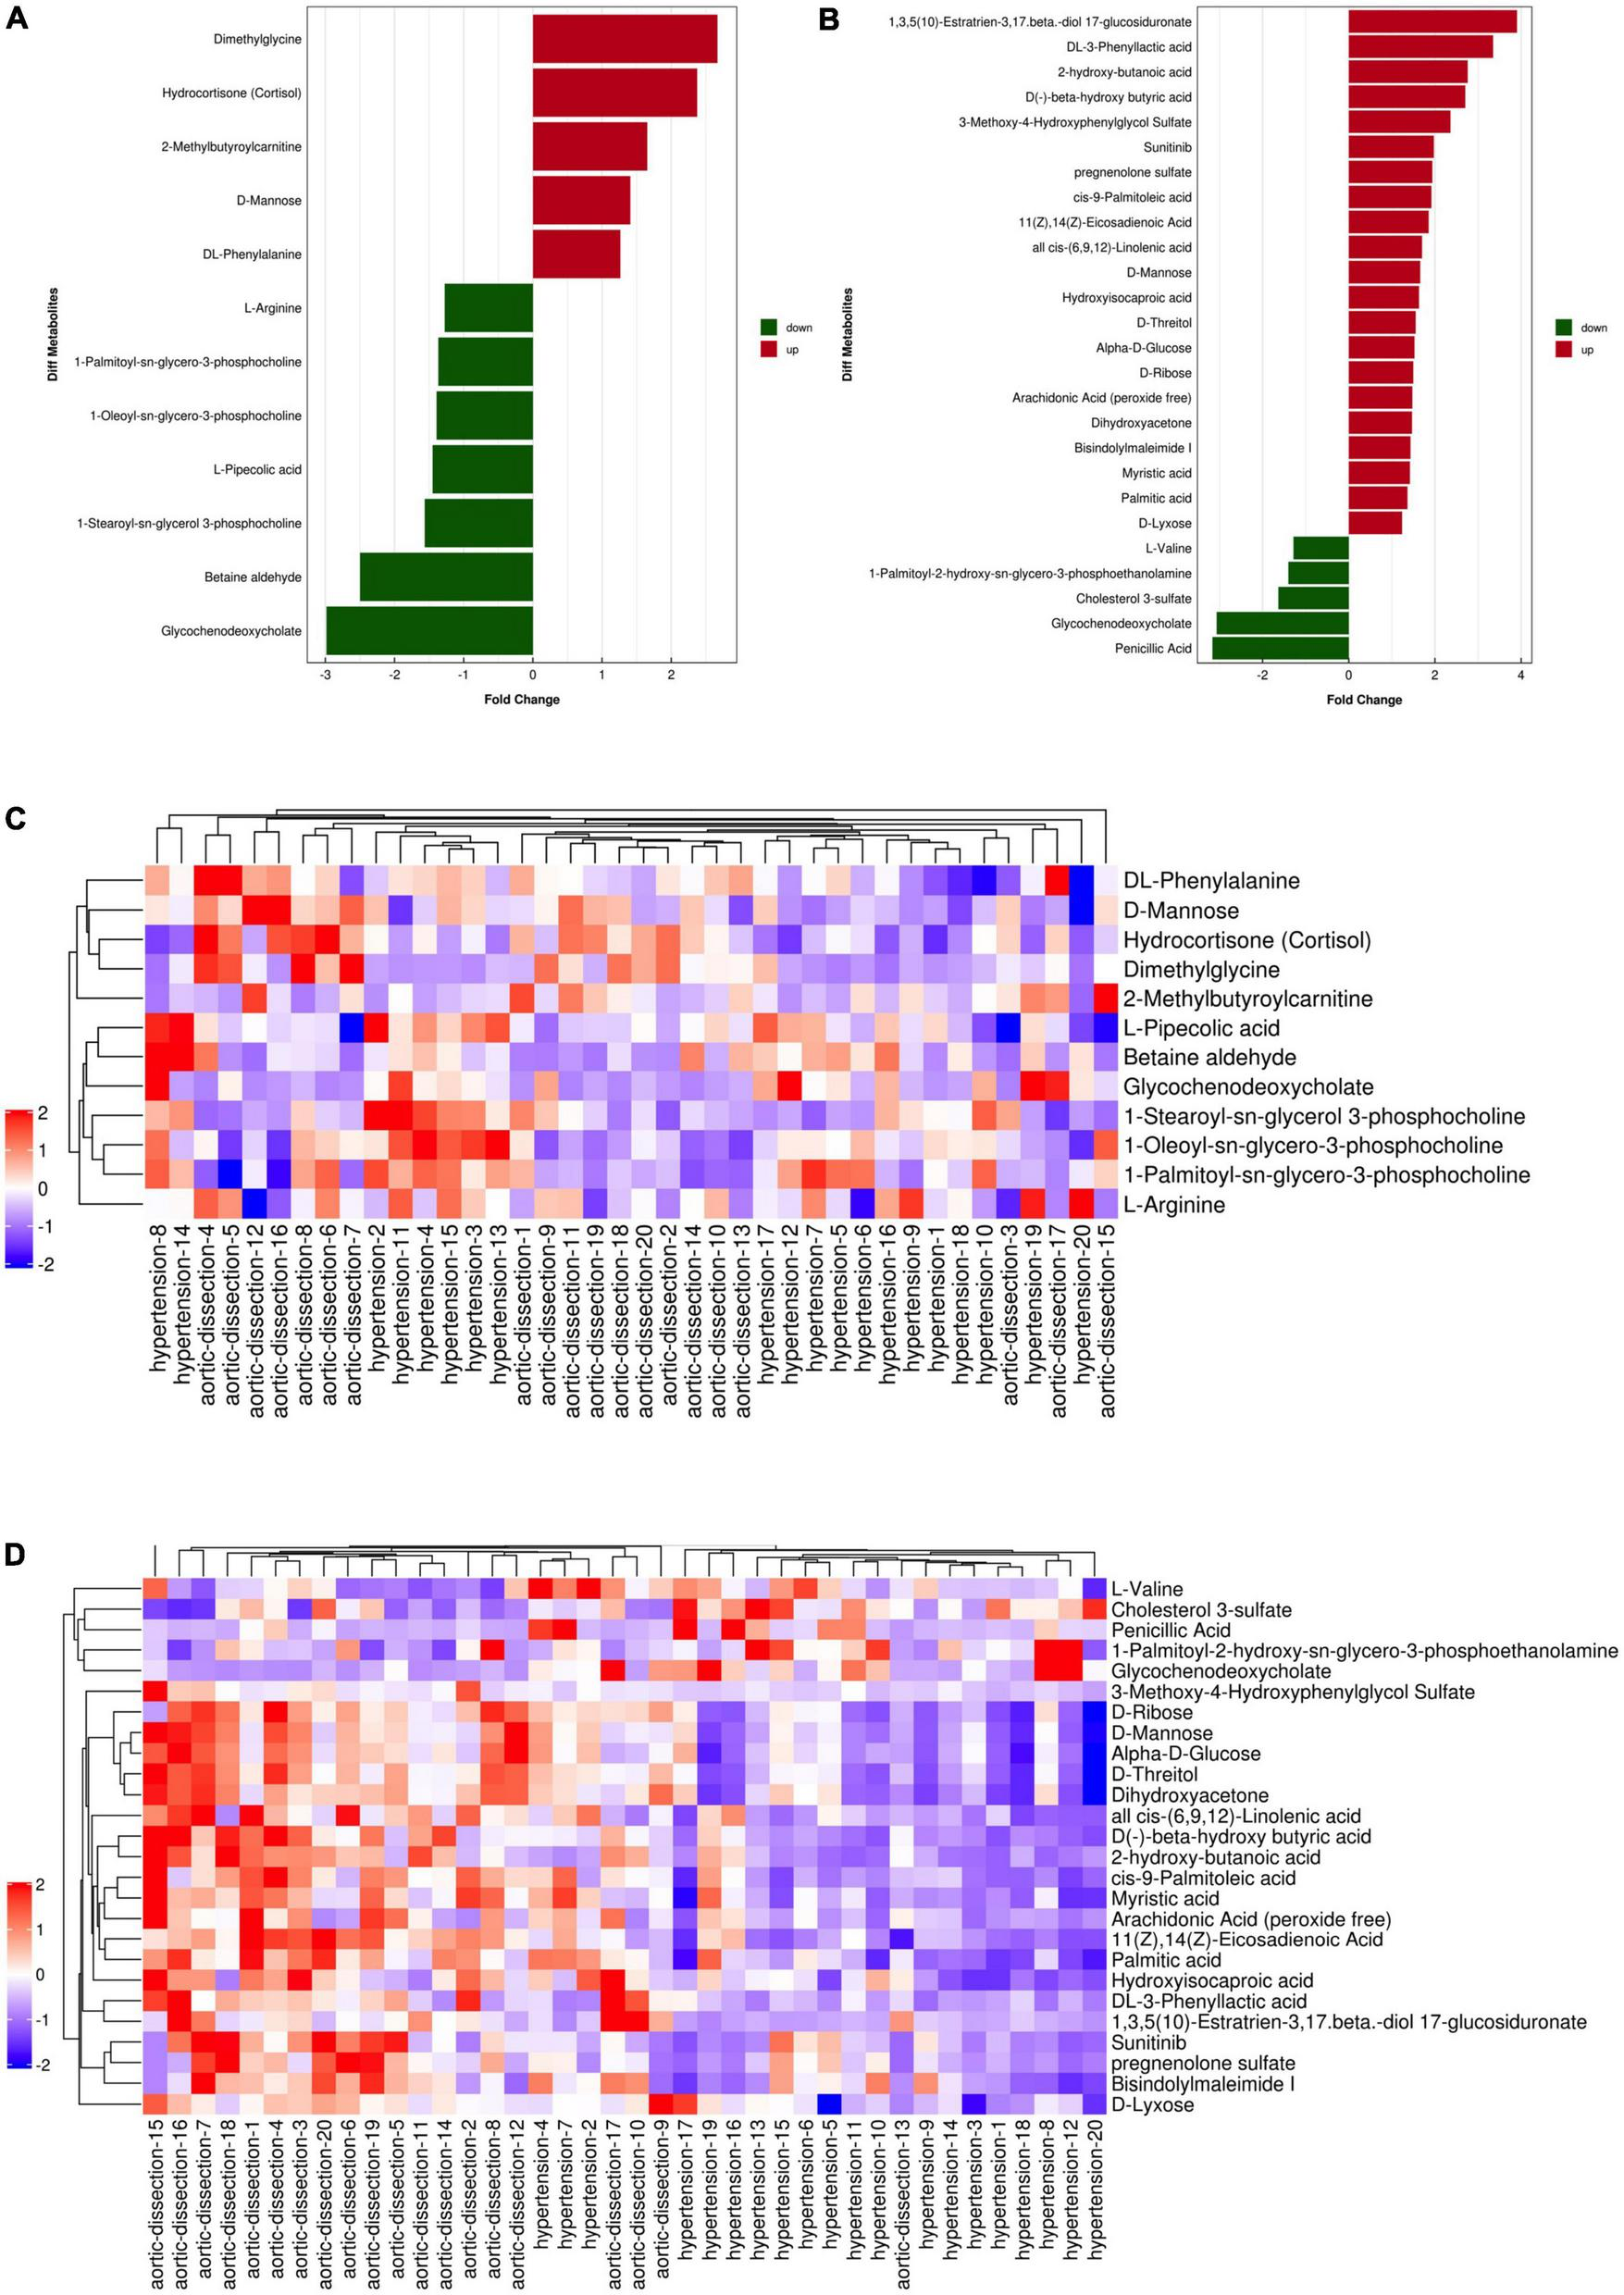
Fold change analysis and heat map of the differential metabolites between hypertension and AAD groups in ESI positive and negative mode. (A) Fold change of five up-regulated metabolites (red bars) and seven down-regulated metabolites (green bars) in ESI positive ion mode. (B) Fold change of 21 up-regulated metabolites (red bars) and five down-regulated metabolites (green bars) in ESI negative mode. Heat map of the differential metabolites between hypertension and AAD groups in ESI positive (C) and negative (D) ion mode (red represents the metabolites in high abundance, blue represents the metabolites in low abundance).
TABLE 2
|
Name |
VIP | Fold change | P-value | m/z | rt(s) |
| Hydrocortisone (Cortisol) | 2.540181454 | 2.377060532 | 2.54044E-07 | 363.21489 | 45.067 |
| Dimethylglycine | 1.238043185 | 2.669990192 | 1.84116E-05 | 104.06966 | 290.683 |
| 1-Palmitoyl-sn-glycero-3-phosphocholine | 16.31693226 | 0.731060704 | 9.82702E-05 | 496.33927 | 189.075 |
| L-Pipecolic acid | 3.108120087 | 0.689489648 | 0.001123665 | 171.11275 | 258.895 |
| D-Mannose | 2.074941992 | 1.40761344 | 0.001905338 | 198.09617 | 291.5135 |
| Glycochenodeoxycholate | 1.283728085 | 0.33516846 | 0.002624755 | 432.30876 | 203.9575 |
| Betaine aldehyde | 4.134241653 | 0.400500219 | 0.002885916 | 162.11226 | 310.12 |
| 1-Oleoyl-sn-glycero-3-phosphocholine | 6.57882624 | 0.717045917 | 0.003526007 | 522.35398 | 154.556 |
| 1-Stearoyl-sn-glycerol 3-phosphocholine | 2.22919433 | 0.640546032 | 0.010722346 | 524.3687 | 84.6435 |
| DL-Phenylalanine | 1.766904818 | 1.263807289 | 0.017858202 | 207.11233 | 225.446 |
| 2-Methylbutyroylcarnitine | 3.235520714 | 1.654094994 | 0.036214924 | 246.16943 | 234.765 |
| L-Arginine | 3.384491698 | 0.785754592 | 0.049182685 | 175.11869 | 578.0455 |
Statistical analysis of different metabolites in positive ion patterns.
TABLE 3
| Name | VIP | Fold change | P-value | m/z | rt(s) |
| L-Glutamate | 1.75684417 | 0.425108584 | 9.73216E-06 | 146.04467 | 394.25 |
| 11(Z),14(Z)-Eicosadienoic Acid | 3.256119257 | 0.580386243 | 0.00121708 | 307.2624 | 45.183 |
| Arachidonic Acid (peroxide free) | 8.785229564 | 0.491955015 | 0.00146021 | 303.23177 | 45.179 |
| Myristic acid | 6.179872893 | 0.571095792 | 0.001648591 | 227.20056 | 48.539 |
| DL-lactate | 12.94141146 | 0.400099692 | 0.002179355 | 89.02434 | 266.916 |
| 16-Hydroxypalmitic acid | 1.382002127 | 0.664183457 | 0.00232748 | 271.22585 | 74.643 |
| 1-Palmitoyl-2-hydroxy-sn-glycero-3-phosphoethanolamine | 2.068817045 | 0.637222361 | 0.00307604 | 452.27658 | 194.745 |
| 1-Oleoyl-L-.alpha.-lysophosphatidic acid | 1.056618982 | 0.267034475 | 0.003457425 | 457.23309 | 239.6715 |
| 2-hydroxy-butanoic acid | 1.757680909 | 0.483444895 | 0.003683016 | 103.03934 | 193.2195 |
| Palmitic acid | 17.13490388 | 0.738098272 | 0.004073127 | 255.23278 | 47.299 |
| all cis-(6,9,12)-Linolenic acid | 8.921459175 | 0.522121985 | 0.004282796 | 277.21612 | 46.843 |
| Nname,cis-9,10-Epoxystearic acid | 1.841099778 | 0.712405004 | 0.004650072 | 297.24161 | 50.606 |
| Pentadecanoic Acid | 1.08088633 | 0.704023246 | 0.005292252 | 241.21579 | 47.915 |
| L-Valine | 2.489268942 | 0.59057917 | 0.005351996 | 116.07095 | 301.4365 |
| Taurine | 2.86744555 | 0.681677383 | 0.007222477 | 124.00697 | 289.48 |
| Hypoxanthine | 2.988244266 | 0.46944798 | 0.009166969 | 135.03041 | 164.6565 |
| Glycerol | 1.422678731 | 0.389901064 | 0.01029718 | 92.04968 | 80.8635 |
| D-Arabinono-1,4-lactone | 1.416010553 | 1.373664747 | 0.011288645 | 147.02873 | 150.67 |
| 1-Palmitoyl Lysophosphatidic Acid | 1.143848211 | 0.207112312 | 0.011523676 | 409.23304 | 245.3135 |
| L-Proline | 1.24529976 | 0.708887843 | 0.014415796 | 114.05519 | 308.705 |
| Cyanuric acid | 1.13649118 | 1.310366919 | 0.016014213 | 129.01818 | 195.272 |
| 3-Methoxy-4-Hydroxyphenylglycol Sulfate | 1.627694095 | 0.485754533 | 0.016688262 | 263.02162 | 44.291 |
| Formylanthranilic acid | 2.024688357 | 0.540934721 | 0.025152884 | 164.034 | 95.876 |
| cis-9-Palmitoleic acid | 2.59147119 | 0.685273976 | 0.027505613 | 253.21627 | 34.451 |
| L-Gulonic gamma-lactone | 1.138848495 | 1.267933006 | 0.029405392 | 237.05989 | 125.187 |
| D(-)-beta-hydroxy butyric acid | 1.004123231 | 0.594452067 | 0.033847279 | 103.03919 | 213.233 |
| Valsartan | 1.59310605 | 0.091676265 | 0.037294106 | 434.2198 | 98.984 |
| Methylmalonic acid | 1.896513445 | 1.216446702 | 0.044149286 | 117.0183 | 127.685 |
Statistical analysis of different metabolites in negative ion patterns.
Identification of different metabolites between the acute aortic dissection and hypertension groups
According to the normality of the data and the homogeneity of variance, we selected the univariate ANOVA test and Kruskal–Wallis test (p < 0.05) to measure the differences in metabolites between the two groups. The fold change of significantly differential metabolites in AAD versus hypertension in positive and negative ion modes is presented in Figures 2A,B and, respectively. Specifically, in the positive ion mode, dimethylglycine and hydrocortisone were more than 2-fold upregulated in the AAD group, and glycochenodeoxycholate and betaine aldehyde showed more than 2-fold downregulation compared with the hypertension group. In the negative ion mode, 1,3,5(10)-Estratrien-3,17 beta-diol 17-glucosiduronate, DL-3-phenylacetic acid, 2-hydroxy-butanoic acid, D(-)-beta-hydroxybutyric acid, and 3-methoxy-4-hydroxyphenylglycol sulfate were upregulated by more than 2-fold, and penicillic acid and glycochenodeoxycholate were downregulated by more than 2-fold in the AAD group compared with the hypertension group. Moreover, a hierarchical clustering heatmap was used to view the data more intuitively (Figures 2C,D). Cluster analysis of all the samples revealed that the AAD and hypertension groups clustered well. The heatmap suggests that the levels of metabolic biomarkers in the AAD group differed from those in the hypertension group.
Potential signaling pathways
To reveal the pathways of metabolites and their metabolic processes, MetaboAnalyst 4.01 was performed for pathway enrichment analysis (Figure 3). According to the KEGG and hierarchy pathway results, the major intervened pathways involved were ABC transporters, biosynthesis of amino acids, fructose and mannose metabolism, unsaturated fatty acids and fatty acid biosynthesis, and aminoacyl-tRNA biosynthesis (Figures 3A,B). Combined with the classification of differential metabolites, lipid metabolism (fatty acid biosynthesis, biosynthesis of unsaturated fatty acids, and linoleic acid metabolism), carbohydrate metabolism (galactose, fructose, and mannose metabolism), and membrane transport (ABC transporters) were the central pathways in the AAD group. In addition, two classical pathways, the mTOR signaling pathway, and aldosterone-regulated sodium reabsorption are worthy of attention. These results indicate that AAD may be affected by fatty acids, carbohydrate, and lipid metabolic pathways.
FIGURE 3
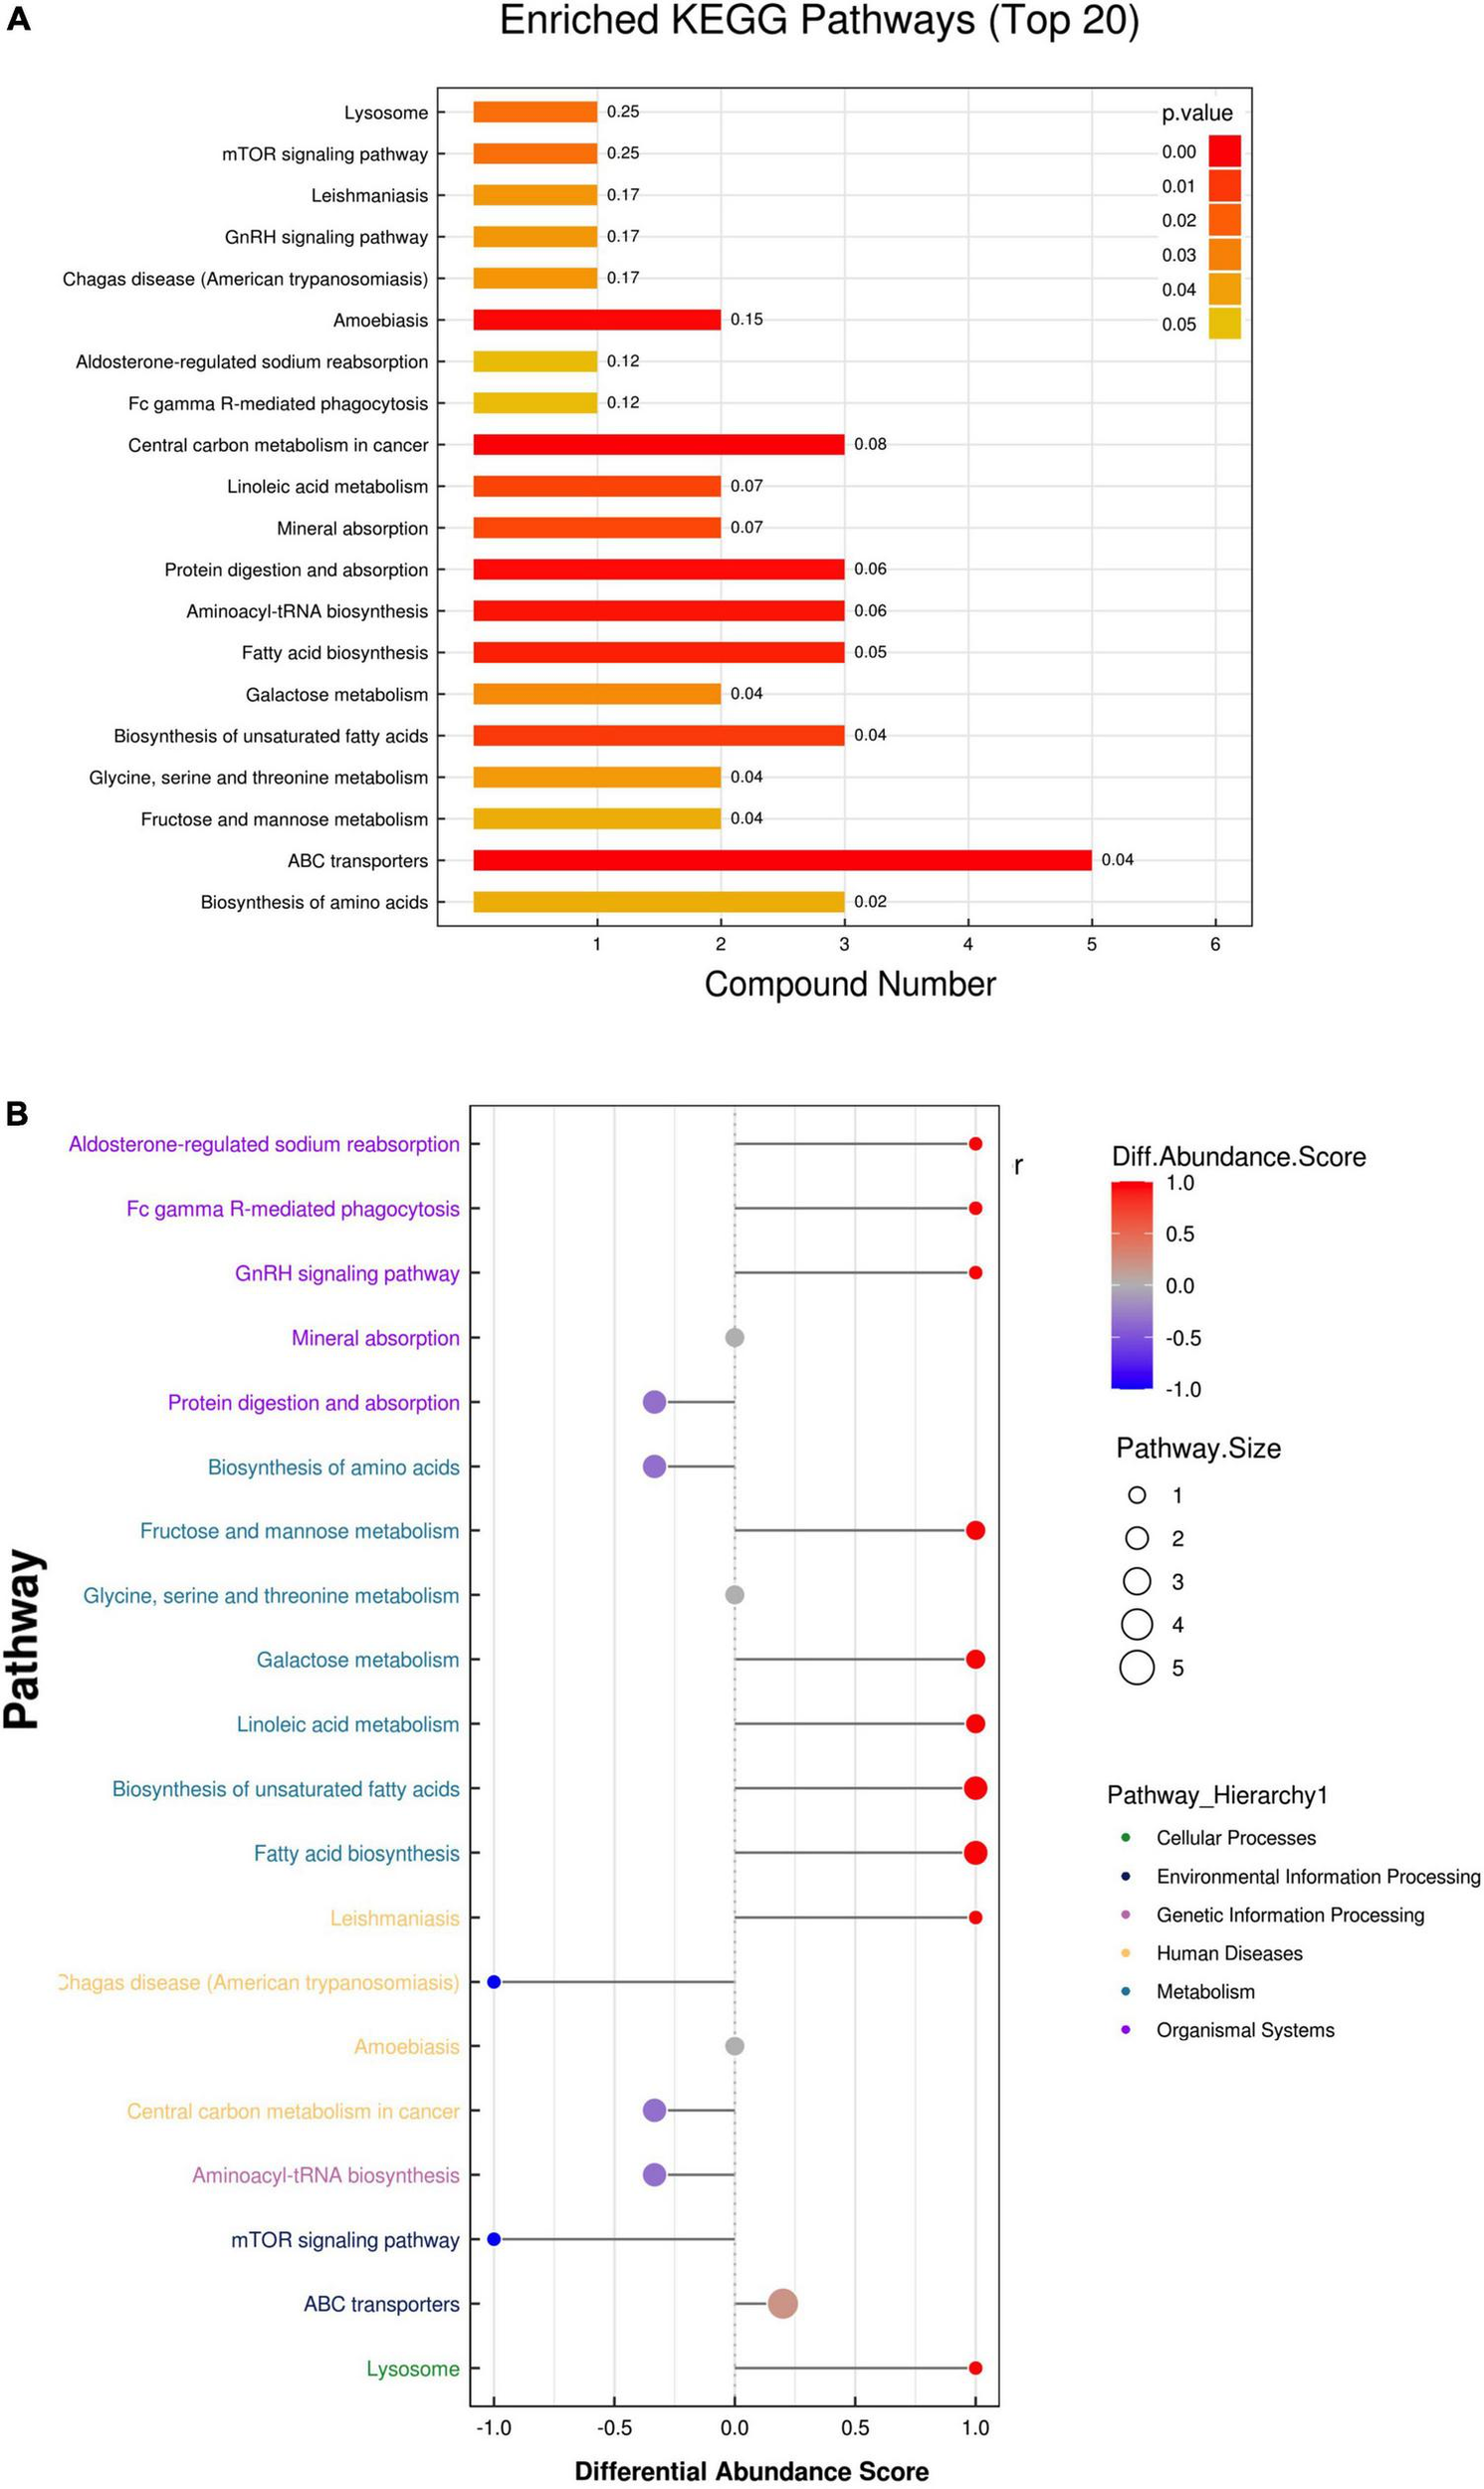
Enrichment analysis of the metabolic pathway of the two groups. (A) The enrichment analysis of the Kyoto Encyclopedia of Genes and Genomes (KEGG) showed the overview pathway of different endogenous metabolites between HP and AD groups. (B) Differential abundance score map for all differential metabolic pathways analyzed by Pathway Hierarchy.
Diagnostic accuracy of metabolites
Among the 26 differentially expressed metabolites, we found that three metabolites were upregulated with p < 0.05 and more than 1.5-fold change (Figures 4A–C). We then tested their ability to differentiate AAD from hypertension using the receiver operating characteristic (ROC) curve analysis. According to the ROC analysis, the diagnostic power of hydrocortisone was the highest among the three candidate metabolites [AUC: 0.9325; 95% confidence interval (CI): 0.8595–1.000] (Figure 4D), followed by that of dimethylglycine (AUC: 0.9200; 95%CI: 0.8313–1.000) (Figure 4E) and 2-methylbutyroylcarnitine (AUC: 0.6875; 95%CI: 0.5219–0.8531) (Figure 4F), indicating that hydrocortisone and dimethylglycine may be potential metabolic markers for diagnosing AAD in hypertension.
FIGURE 4
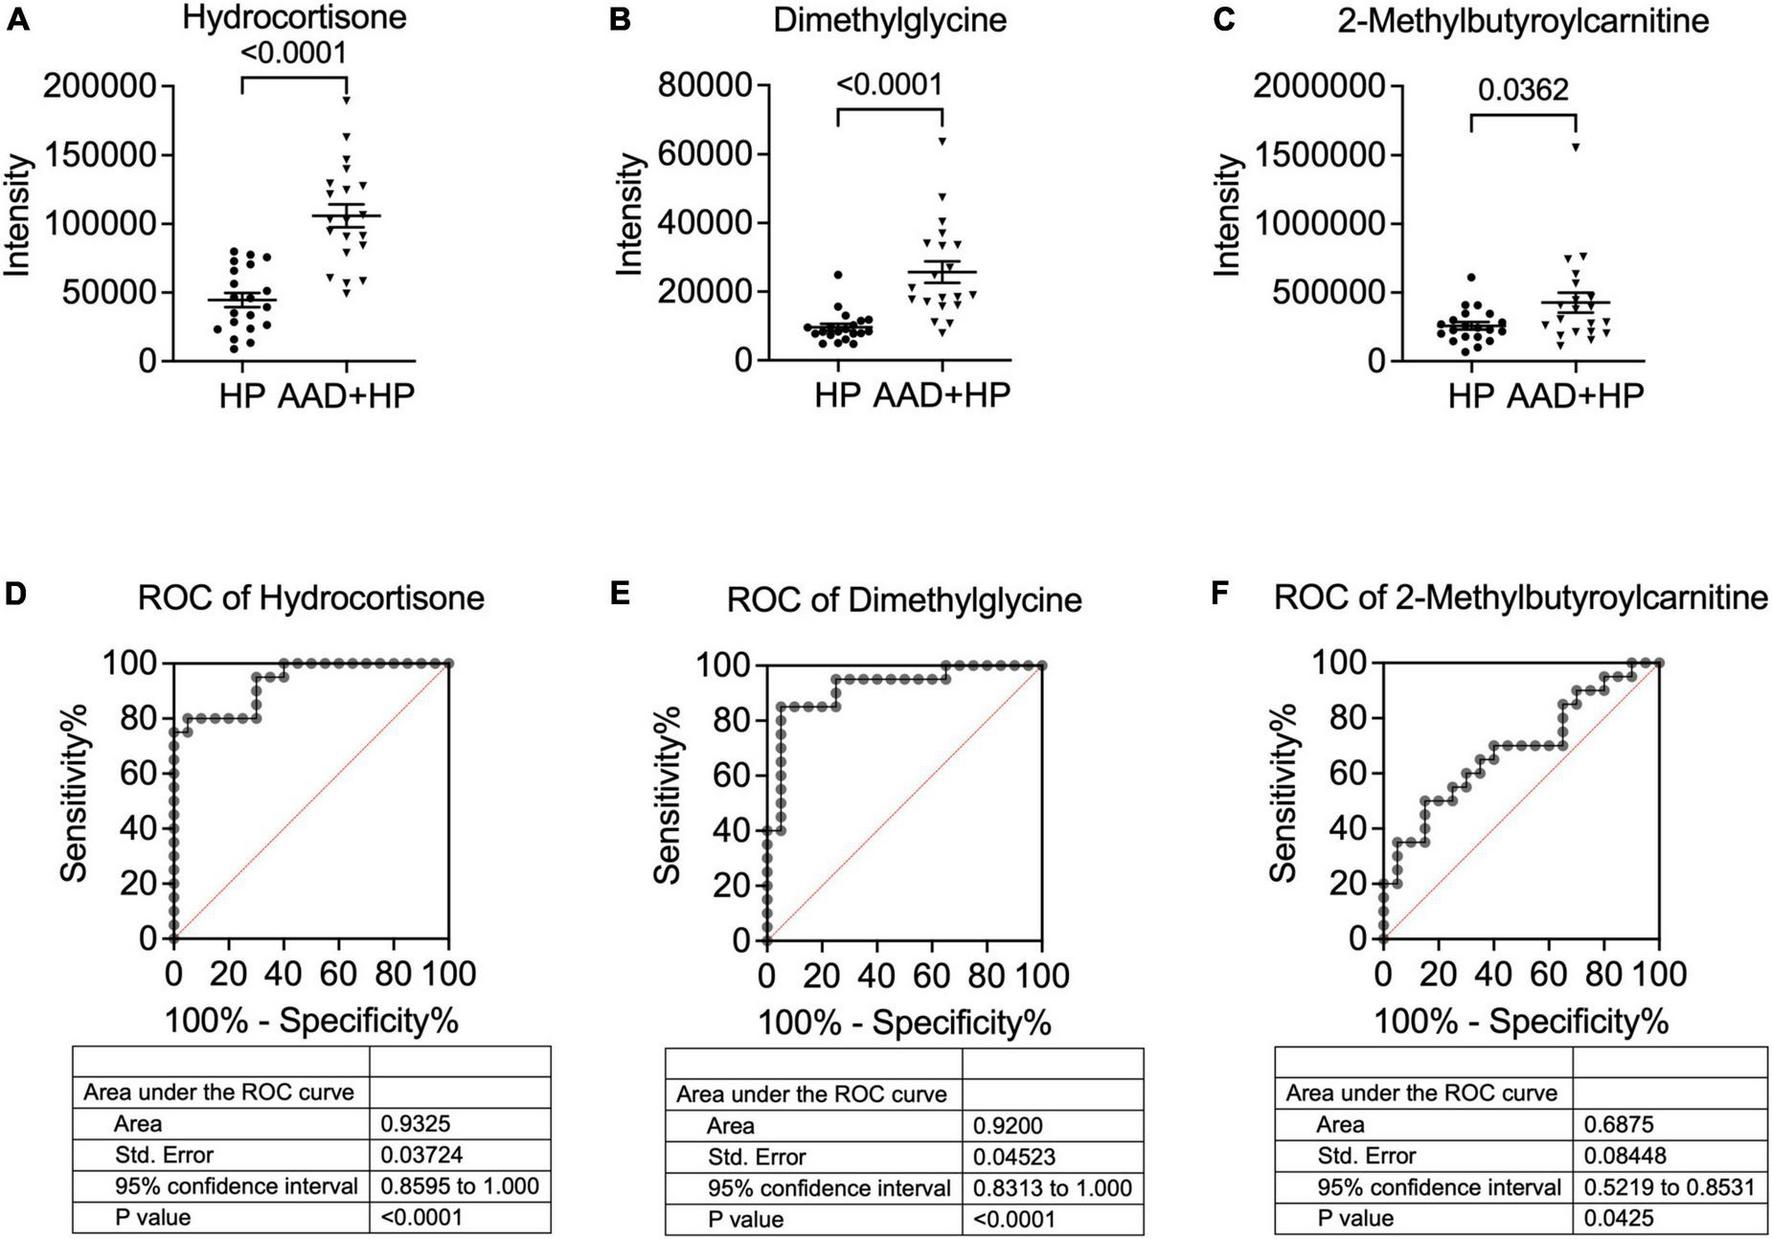
Concentration and ROC analysis of candidate metabolites in the two groups. Comparison of hydrocortisone blood levels. (A) dimethylglycine (B) and 2-methylbutyroylcarnitine (C) in patients with hypertension and AAD + hypertension. The ROC analysis showed that hydrocortisone (D) exhibited the highest AUC value, followed by dimethylglycine (E) and 2-Methylbutyroylcarnitine (F). AUC, Area under the curve; ROC, receiver operating characteristic.
Discussion
Acute aortic dissection (AAD), one of the most dangerous and fatal cardiovascular diseases (15), has an acute onset in severe conditions; the early mortality rate of untreated AAD is approximately 1–2% per hour (16). Dissection of the aortic wall can be caused by several factors such as genetic diseases and aortic valve devaluation, but the most common is hypertension (8, 16). In China, many people have hypertension. However, many of them are not well controlled because of the irregular use of antihypertensive drugs, which may lead to aortic dissection. Therefore, early screening and precise diagnosis of aortic dissection in patients with hypertension are critical for the treatment and prognosis of this disease.
Metabolomics is an extension of transcriptomics and proteomics that can directly and accurately reflect the physiological state of an organism (17). The differences in metabolic levels may be biomarkers for diagnosing diseases and exploring their severity, studying the biological and pathological processes of different conditions, and revealing their mechanisms and regulatory pathways. Although patients with AAD have low rates of previous vascular disease, including ischemic heart disease, diabetes mellitus, and peripheral arterial disease, previous observations have confirmed that hypertension is strongly associated with AAD (18, 19). Uncontrolled hypertension remains the most significant risk factor for AAD (3). Therefore, exploring the markers of AAD in patients with hypertension is crucial for the early diagnosis of aortic dissection. This study aimed to investigate the differential metabolites between patients with AAD (and hypertension) and patients with hypertension. We enrolled 20 patients with AAD who were also diagnosed with hypertension and 20 patients with hypertension as controls. After metabolomics and further analysis, 12 and 26 metabolites were found to have a significant difference in the positive and negative ion modes, respectively. Five metabolites were upregulated and seven were downregulated in the positive ion mode, and five were upregulated, and 21 were downregulated in the negative ion mode. In the enrichment pathway analysis, monosaccharides, fatty acids, and metabolic products of amino acids were different between patients with AAD and those with hypertension. Specifically, dimethylglycine, hydrocortisone,1,3,5(10)-Estratrien-3,17 beta-diol 18-glucosiduronate, DL-3-phenylacetic acid, 2-hydroxy-butanoic acid, D(-)-beta-hydroxybutyric acid, and 3-methoxy-4-hydroxyphenylglycol sulfate were up-regulated over 2-fold.
Many previous studies in the past decade have explored biomarkers for AAD using metabolomics. Cui et al. (20) demonstrated that plasma succinate concentrations distinguished patients with AAD from both healthy controls and patients with acute myocardial infarction or pulmonary embolism. Zeng et al. (2) found that trimethylamine N-oxide (TMAO) levels were increased in patients with AAD compared with those in healthy controls, which was positively correlated with C-reactive protein, interleukin-6, and D-dimer levels. In another previous study, the authors found a total of 236 differentially expressed metabolites in patients with AD compared with healthy participants, of which 142 were significantly upregulated and 64 significantly downregulated, and 165 differentially expressed metabolites in patients with AD compared with patients with hypertension, of which 109 were significantly downregulated and 56 were upregulated. They speculated that two of these metabolites [tetranor-PGE1 and 13, 14-dihydro-19 (R)-hydroxyPGE1] might serve as potential plasma biomarkers for AD (21). Zhou et al. indicated that LPCs and sphingolipids are significantly altered in patients with AAD, particularly in Stanford type A AAD, where several sphingolipids, such as sphingosine, phytosphingosine, and ceramide were significantly decreased (22). In a study of thoracic aortic dissection (TAD), the authors performed untargeted metabolomics to determine plasma metabolite concentrations in an aortic disease cohort. They found that C18-ceramide was significantly differentiated in patients with TAD, but not in patients with thoracic aortic aneurysms, which was confirmed by subsequent quantitative analysis of C18-ceramide in a validation cohort. The ceramide synthesis pathway was inhibited by myriocin-alleviated BAPN-induced aortic inflammation and dissection in mice. In vitro studies found that exogenous C18-ceramide promoted macrophage inflammation and matrix metalloproteinase (MMP) expression through the NLRP3-caspase 1 pathway (23). However, in our metabolomics results, the plasma levels of succinate, TMAO, tetranor-PGE1, 13, 14-dihydro-19 (R)-hydroxyPGE1, LPCs, and sphingolipids did not differ between patients with AAD and those with hypertension, indicating that these metabolites might not be critical markers for diagnosing AAD patients with hypertension.
In this study, fatty acid biosynthesis was identified as a critical pathway for AAD. Fatty acid synthesis occurs in both the cytosol and mitochondria of most organs, although one or the other predominates in a given organ. The spectrum of fatty acids synthesized by the whole aorta or its constituent subfractions is not notably different from that of other organs (24). Husi et al. found decreased glycolysis and fatty acid metabolism and a pronounced increase in vascularization, oxidative stress-response proteins, apoptosis modulators, and molecules involved in hypertrophy and hypertension (25). Carbohydrate metabolism (galactose, fructose, and mannose metabolisms) is another key pathway in the differentiation of patients with AAD and hypertension. A previous study showed that carbohydrate metabolism disturbances affected the wall of the aorta and the development of alimentary lipidosis in rabbits (26). The state of carbohydrate metabolism and the microcirculation in ischemic muscles of the extremities may regulate the embolism of the aorta (27). The increased deposition of cholesterol in the arterial intima may result in vascular dysfunction, which is a key event in the pathogenesis of atherosclerosis and aortic dissection. The ABC transporter family plays an important role in the balance between lipid accumulation and lipid removal from cells (28). Our results also demonstrate the critical role of ABC transporters in the early stages of AAD. Another important finding of the present study is that hydrocortisone and dimethylglycine showed the strongest relationship with type A AAD. Interestingly, dimethylglycine is also elevated in the blood of children with congenital heart defects and their mothers (29). Moreover, dimethylglycine is elevated in plasma and associated with and improved risk prediction of mortality in patients with suspected or verified coronary heart disease (30). Hydrocortisone is an essential regulator of aortic dysfunction and other cardiovascular diseases. The inhibition of vascular PGI2 by hydrocortisone has implications in the pathogenesis of steroid-related hypertension and atherosclerosis and the anti-inflammatory effect of steroids (31). Hydrocortisone also increased heart rate and blood pressure and reduced cardiovagal baroreflex sensitivity and heart rate variability in young men (32). Pretreatment with a stress dose of hydrocortisone but not a higher pharmacologic dose maintained a significantly higher approximate entropy after endotoxin exposure compared to a placebo (33). Our group and other results indicated that dimethylglycine and hydrocortisone play an important role in regulating heart or cardiovascular disorders.
Conclusion
In conclusion, our study provides new evidence that 38 metabolites differ between the type A AAD and hypertension groups. These metabolites are involved in lipid metabolism (fatty acid biosynthesis, biosynthesis of unsaturated fatty acids, and linoleic acid metabolism), carbohydrate metabolism (galactose, fructose, and mannose metabolism), and membrane transport (ABC transporters), thus regulating AAD progression. Hydrocortisone and dimethylglycine concentrations were significantly increased in type A AAD patients, with the highest area under the curve value, and may serve as potential biomarkers for AAD. These results are of great importance in the exploration of biomarkers and regulators for the early diagnosis and treatment of AAD; however, further in vitro and in vivo studies are required to evaluate the potential role of hydrocortisone and dimethylglycine and their related pathways in AAD.
Statements
Data availability statement
The raw data supporting the conclusions of this article will be made available by the authors, without undue reservation.
Ethics statement
The studies involving human participants were reviewed and approved by the Ethics Committee of Xiamen Cardiovascular Hospital of Xiamen University. The patients/participants provided their written informed consent to participate in this study.
Author contributions
JZ and H-FQ designed the experiments. X-BH and YH conducted the experiments. X-BH and GL prepared the manuscript. JZ, H-FQ, and X-JW supervised the study, revised the manuscript, and provided funding. E-RN and M-CY validated the results. All authors contributed to writing and editing the manuscript and read and approved the final manuscript.
Funding
This study was supported by the Science and Technology Project of the Xiamen Science and Technology Bureau, Fujian Province, China (grant no. 3502Z20184024).
Conflict of interest
The authors declare that the research was conducted in the absence of any commercial or financial relationships that could be construed as a potential conflict of interest.
Publisher’s note
All claims expressed in this article are solely those of the authors and do not necessarily represent those of their affiliated organizations, or those of the publisher, the editors and the reviewers. Any product that may be evaluated in this article, or claim that may be made by its manufacturer, is not guaranteed or endorsed by the publisher.
Abbreviations
- AAD
acute aortic dissection
- ROC
receiver operating characteristic
- AUC
area under the curve
- CTA
computed tomography angiography
- UHPLC
ultra-performance liquid chromatography
- PCA
principal component analysis
- PLS-DA
partial least squares discrimination analysis
- OPLS-DA
orthogonal partial least squares discriminant analysis
- TMAO
trimethylamine N-oxide
- MMP
matrix metalloproteinase
- QC
quality control.
Footnotes
References
1.
Komutrattananont P Mahakkanukrauh P Das S . Morphology of the human aorta and age-related changes: anatomical facts.Anat Cell Biol. (2019) 52:109–14. 10.5115/acb.2019.52.2.109
2.
Zeng Q Rong Y Li D Wu Z He Y Zhang H et al Identification of serum biomarker in acute aortic dissection by global and targeted metabolomics. Ann Vasc Surg. (2020) 68:497–504. 10.1016/j.avsg.2020.06.026
3.
Howard DP Banerjee A Fairhead JF Perkins J Silver LE Rothwell PM et al Population-based study of incidence and outcome of acute aortic dissection and premorbid risk factor control: 10-year results from the Oxford vascular study. Circulation. (2013) 127:2031–7. 10.1161/CIRCULATIONAHA.112.000483
4.
Nordon IM Hinchliffe RJ Loftus IM Thompson MM . Pathophysiology and epidemiology of abdominal aortic aneurysms.Nat Rev Cardiol. (2011) 8:92–102. 10.1038/nrcardio.2010.180
5.
Criado FJ . Aortic dissection: a 250-year perspective.Tex Heart Inst J. (2011) 38:694–700.
6.
Erbel R Aboyans V Boileau C Bossone E Bartolomeo RD Eggebrecht H et al 2014 ESC guidelines on the diagnosis and treatment of aortic diseases: document covering acute and chronic aortic diseases of the thoracic and abdominal aorta of the adult. The task force for the diagnosis and treatment of aortic diseases of the European society of cardiology (ESC). Eur Heart J. (2014) 35:2873–926. 10.1093/eurheartj/ehu281
7.
Lewington S Lacey B Clarke R Guo Y Kong XL Yang L et al The burden of hypertension and associated risk for cardiovascular mortality in China. JAMA Intern Med. (2016) 176:524–32. 10.1001/jamainternmed.2016.0190
8.
Nienaber CA Clough RE . Management of acute aortic dissection.Lancet. (2015) 385:800–11. 10.1016/S0140-6736(14)61005-9
9.
Fox CS Evans JC Larson MG Kannel WB Levy D . Temporal trends in coronary heart disease mortality and sudden cardiac death from 1950 to 1999: the Framingham heart study.Circulation. (2004) 110:522–7. 10.1161/01.CIR.0000136993.34344.41
10.
Giles MF Rothwell PM . Measuring the prevalence of stroke.Neuroepidemiology. (2008) 30:205–6. 10.1159/000126913
11.
De Leon Ayala IA Chen YF . Acute aortic dissection: an update.Kaohsiung J Med Sci. (2012) 28:299–305. 10.1016/j.kjms.2011.11.010
12.
Nie H Pan J An F Zheng C Zhang Q Zhan Q . Comprehensive analysis of serum metabolites profiles in acute radiation enteritis rats by untargeted metabolomics.Tohoku J Exp Med. (2021) 255:257–65. 10.1620/tjem.255.257
13.
Patteet L Maudens KE Sabbe B Morrens M De Doncker M Neels H . High throughput identification and quantification of 16 antipsychotics and 8 major metabolites in serum using ultra-high performance liquid chromatography-tandem mass spectrometry.Clin Chim Acta. (2014) 429:51–8. 10.1016/j.cca.2013.11.024
14.
Sim J Kim E Yang W Woo S In S . An LC-MS/MS method for the simultaneous determination of 15 antipsychotics and two metabolites in hair and its application to rat hair.Forensic Sci Int. (2017) 274:91–8. 10.1016/j.forsciint.2017.01.001
15.
Zhang K Qi Y Wang M Chen Q . Long non-coding RNA HIF1A-AS2 modulates the proliferation, migration, and phenotypic switch of aortic smooth muscle cells in aortic dissection via sponging microRNA-33b.Bioengineered. (2022) 13:6383–95. 10.1080/21655979.2022.2041868
16.
Cronin P Carlos RC Kazerooni EA Kelly AM Patel HJ Deeb GM et al Aortic branch artery pseudoaneurysms accompanying aortic dissection. Part III: natural history. J Vasc Interv Radiol. (2012) 23:859–65.e3. 10.1016/j.jvir.2012.03.012
17.
Zhao P Li J Yang L Li Y Tian Y Li S . Integration of transcriptomics, proteomics, metabolomics and systems pharmacology data to reveal the therapeutic mechanism underlying Chinese herbal Bufei Yishen formula for the treatment of chronic obstructive pulmonary disease.Mol Med Rep. (2018) 17:5247–57. 10.3892/mmr.2018.8480
18.
Golledge J Eagle KA . Acute aortic dissection.Lancet. (2008) 372:55–66. 10.1016/S0140-6736(08)60994-0
19.
Meszaros I Morocz J Szlavi J Schmidt J Tornoci L Nagy L et al Epidemiology and clinicopathology of aortic dissection. Chest. (2000) 117:1271–8. 10.1378/chest.117.5.1271
20.
Cui H Chen Y Li K Zhan R Zhao M Xu Y et al Untargeted metabolomics identifies succinate as a biomarker and therapeutic target in aortic aneurysm and dissection. Eur Heart J. (2021) 42:4373–85. 10.1093/eurheartj/ehab605
21.
Ren Y Tang Q Liu W Tang Y Zhu R Li B . Serum biomarker identification by mass spectrometry in acute aortic dissection.Cell Physiol Biochem. (2017) 44:2147–57. 10.1159/000485954
22.
Zhou X Wang R Zhang T Liu F Zhang W Wang G et al Identification of lysophosphatidylcholines and sphingolipids as potential biomarkers for acute aortic dissection via serum metabolomics. Eur J Vasc Endovasc Surg. (2019) 57:434–41. 10.1016/j.ejvs.2018.07.004
23.
Yang H Yang F Luo M Chen Q Liu X Zhang Y et al Metabolomic profile reveals that ceramide metabolic disturbance plays an important role in thoracic aortic dissection. Front Cardiovasc Med. (2022) 9:826861. 10.3389/fcvm.2022.826861
24.
Whereat AF . Fatty acid biosynthesis in aorta and heart.Adv Lipid Res. (1971) 9:119–59.
25.
Husi H Van Agtmael T Mullen W Bahlmann FH Schanstra JP Vlahou A et al Proteome-based systems biology analysis of the diabetic mouse aorta reveals major changes in fatty acid biosynthesis as potential hallmark in diabetes mellitus-associated vascular disease. Circ Cardiovasc Genet. (2014) 7:161–70. 10.1161/CIRCGENETICS.113.000196
26.
Bavina MV Ivanova GA Pozdiunina NM Vikhert AM . [The effect of carbohydrate metabolism disturbances on the wall of the aorta and on the development in it of alimentary lipoidosis in rabbits].Arkh Patol. (1966) 28:21–6.
27.
Kosnikova IV Abidov MS Karimov EA Khoroshaev VA . [State of carbohydrate metabolism and the microcirculation in ischemic muscles of the extremities in embolism of the aorta and the magistral arteries].Klin Khir. (1988) 7:25–6.
28.
Coisne C Hallier-Vanuxeem D Boucau MC Hachani J Tilloy S Bricout H et al Beta-cyclodextrins decrease cholesterol release and abc-associated transporter expression in smooth muscle cells and aortic endothelial cells. Front Physiol. (2016) 7:185. 10.3389/fphys.2016.00185
29.
Alsayed R Al Quobaili F Srour S Geisel J Obeid R . Elevated dimethylglycine in blood of children with congenital heart defects and their mothers.Metabolism. (2013) 62:1074–80. 10.1016/j.metabol.2013.01.024
30.
Svingen GF Schartum-Hansen H Ueland PM Pedersen ER Seifert R Ebbing M et al Elevated plasma dimethylglycine is a risk marker of mortality in patients with coronary heart disease. Eur J Prev Cardiol. (2015) 22:743–52. 10.1177/2047487314529351
31.
Jeremy JY Dandona P . Inhibition by hydrocortisone of prostacyclin synthesis by rat aorta and its reversal with RU486.Endocrinology. (1986) 119:661–5. 10.1210/endo-119-2-661
32.
Adlan AM Veldhuijzen van Zanten J Lip GYH Paton JFR Kitas GD Fisher JP . Acute hydrocortisone administration reduces cardiovagal baroreflex sensitivity and heart rate variability in young men.J Physiol. (2018) 596:4847–61. 10.1113/JP276644
33.
Rassias AJ Guyre PM Yeager MP . Hydrocortisone at stress-associated concentrations helps maintain human heart rate variability during subsequent endotoxin challenge.J Crit Care. (2011) 26:636.e1–5. 10.1016/j.jcrc.2011.01.009
Summary
Keywords
acute aortic dissection, hypertension, metabolites, lipid metabolism, dimethylglycine, hydrocortisone
Citation
Hao X-B, Han Y, Ni E-R, Ye M-C, Li G, Wu X-J, Qiang H-F and Zhao J (2022) Potential metabolomic biomarkers for the identification and diagnosis of type A acute aortic dissection in patients with hypertension. Front. Cardiovasc. Med. 9:1019598. doi: 10.3389/fcvm.2022.1019598
Received
15 August 2022
Accepted
14 October 2022
Published
07 November 2022
Volume
9 - 2022
Edited by
Heng Ma, Fourth Military Medical University, China
Reviewed by
Binshan Zha, First Affiliated Hospital of Anhui Medical University, China; Nanhu Quan, Jilin University, China; Dachun Xu, Tongji University, China
Updates
Copyright
© 2022 Hao, Han, Ni, Ye, Li, Wu, Qiang and Zhao.
This is an open-access article distributed under the terms of the Creative Commons Attribution License (CC BY). The use, distribution or reproduction in other forums is permitted, provided the original author(s) and the copyright owner(s) are credited and that the original publication in this journal is cited, in accordance with accepted academic practice. No use, distribution or reproduction is permitted which does not comply with these terms.
*Correspondence: Xi-Jie Wu, wxjusa@163.comHai-Feng Qiang, drhaifengq@139.comJun Zhao, zhaojia0327@126.com
†These authors have contributed equally to this work
This article was submitted to General Cardiovascular Medicine, a section of the journal Frontiers in Cardiovascular Medicine
Disclaimer
All claims expressed in this article are solely those of the authors and do not necessarily represent those of their affiliated organizations, or those of the publisher, the editors and the reviewers. Any product that may be evaluated in this article or claim that may be made by its manufacturer is not guaranteed or endorsed by the publisher.