Abstract
Objective:
To develop an optimal screening model to identify the individuals with a high risk of hypertension in China by comparing tree-based machine learning models, such as classification and regression tree, random forest, adaboost with a decision tree, extreme gradient boosting decision tree, and other machine learning models like an artificial neural network, naive Bayes, and traditional logistic regression models.
Methods:
A total of 4,287,407 adults participating in the national physical examination were included in the study. Features were selected using the least absolute shrinkage and selection operator regression. The Borderline synthetic minority over-sampling technique was used for data balance. Non-laboratory and semi-laboratory analyses were carried out in combination with the selected features. The tree-based machine learning models, other machine learning models, and traditional logistic regression models were constructed to identify individuals with hypertension, respectively. Top features selected using the best algorithm and the corresponding variable importance score were visualized.
Results:
A total of 24 variables were finally included for analyses after the least absolute shrinkage and selection operator regression model. The sample size of hypertensive patients in the training set was expanded from 689,025 to 2,312,160 using the borderline synthetic minority over-sampling technique algorithm. The extreme gradient boosting decision tree algorithm showed the best results (area under the receiver operating characteristic curve of non-laboratory: 0.893 and area under the receiver operating characteristic curve of semi-laboratory: 0.894). This study found that age, systolic blood pressure, waist circumference, diastolic blood pressure, albumin, drinking frequency, electrocardiogram, ethnicity (uyghur, hui, and other), body mass index, sex (female), exercise frequency, diabetes mellitus, and total bilirubin are important factors reflecting hypertension. Besides, some algorithms included in the semi-laboratory analyses showed less improvement in the predictive performance compared to the non-laboratory analyses.
Conclusion:
Using multiple methods, a more significant prediction model can be built, which discovers risk factors and provides new insights into the prediction and prevention of hypertension.
Introduction
Nowadays, hypertension has affected 1.13 billion people worldwide (1). It exacerbates the burden of stroke, ischemic heart disease, other vascular diseases, and kidney disease (2). The number of people with hypertension worldwide exceeded 1 billion in 2019, which was doubled since 1990 (3). In China, the proportion of adults with hypertension has increased substantially over the past 40 years, and people's awareness regarding hypertension, the diagnosis, treatment, and control rates of hypertension are low, especially in the western region (4, 5). Therefore, it is of vital importance to strengthen the pre-screening of hypertension and carry out preventive intervention and treatment for high-risk and potential groups (6).
The prediction model has been proven to be an effective and economical tool to identify individuals with a high risk of hypertension (7). However, many studies have confirmed that the risk prediction models developed for one population cannot be effectively applied to other populations (8–11). Although some hypertension risk prediction models have been established in China in the past 10 years (12–16), there were some disadvantages, such as small sample size and lack of important features (ethnicity and poor prediction effect), which limits the generalizability of models. Therefore, it is urgent to establish a hypertension prediction model with a good prediction effect and strong generalizability in China.
Machine learning (ML) is a collection of techniques that automatically learn features from data and do not require the data structure, and mainly includes classification and regression tree (CART), random forest (RF), extreme gradient boosting decision tree (XGBoost), naive Bayes (NB), and artificial neural network (ANN). ML shows an excellent performance in disease prediction in recent years (17, 18). The application of ML algorithms to predict hypertension can provide some new ideas for understanding the pathophysiological mechanisms underlying hypertension and for exploring therapeutic targets. However, some studies showed that the incremental predictive performance beyond standard methods might be limited (19–21), while others showed that there were no advantages of ML over classical statistical models, such as logistic regression (LR) (22, 23). In the aspect of hypertension prediction, most studies only test the predictive performance of ML models or LR models alone, without conducting comparative studies (13, 16, 24–26). Therefore, it is unclear whether the ML method is better than traditional classical statistical models in the prediction of potential hypertension populations.
Currently, no studies investigated the predictive ability of the semi-laboratory analyses and the non-laboratory analyses. Therefore, in this study, we constructed and compared the tree-based ML models, such as CART, RF, adaboost with decision tree (ADABoost), XGBoost, other ML models, such as NB and ANN, and traditional LR models based on non-laboratory and semi-laboratory analyses, respectively, aiming to develop optimal hypertension screening model for large populations. As we know, the hypertension screening model presented in this study is the first to be established by comparing various algorithms systematically and comprehensively with multi-ethnic and large samples.
Methods
Study population
The national physical examination (NPE) is a free physical examination provided by the Chinese government for all Xinjiang people. Epidemiologists and medical staff at Xinjiang Uygur Autonomous Region Center for Disease Control and Prevention have designed a standard physical examination form, which mainly consisted of a questionnaire survey, routine examinations, and laboratory tests in three parts. All examinations were conducted by a professional medical team with medical qualifications and fieldwork experience. All participants were required to take their unique identity document (ID) card, which was used as the only proof of identity.
All data were aggregated to the Health Management Hospital of Xinjiang Medical University. For routine examination, the items included standing height, weight, waist circumference (WC), heart rate (HR), blood pressure, and abdominal ultrasound. In addition, three 10 ml samples of non-fasting blood samples were collected into vacuum tubes, and then the samples were kept in a portable insulated cold box with ice packs and taken to a local research laboratory for immediate processing. Blood test indicators contained blood sugar and blood biochemistry.
The data in this study were collected from the NPE project, and a total of 4,336,239 people who had signed informed consent forms were included. The excluded criteria were (i) age < 18 years and (ii) the data missing rate > 20%. A total of 4,287,407 participants from 14 regions in Xinjiang Province were finally included in this study for further analysis after strict screening procedures. Detailed population distributions were as follows: Hotan (662,643), Ili (614,468), Aksu (590,630), Changji (339,019), Tacheng (266,494), Bayingolin Mongolia (206,897), Altay (184,948), Turpan (154,105), Bortala Mongolia (86,864), Hami (83,560), Kizilsu Kirgiz (82,078), Karamay (271), Kashgar (622,610), and Urumqi (392,820).
Furthermore, nearly 200 variables irrelevant to this study were deleted, such as names, home addresses, and contact numbers, and then the missing and extreme values of the remaining variables were processed. Continuous variables were imputed by means, while categorical variables were imputed by mode. Figure 1 shows the detailed analysis process. This study was conducted in accordance with the principles outlined in the “Helsinki Declaration” and was approved by the Ethics Committee and Institutional Review Committee of the Xinjiang Uygur Autonomous Region Center for Disease Control and Prevention.
Figure 1
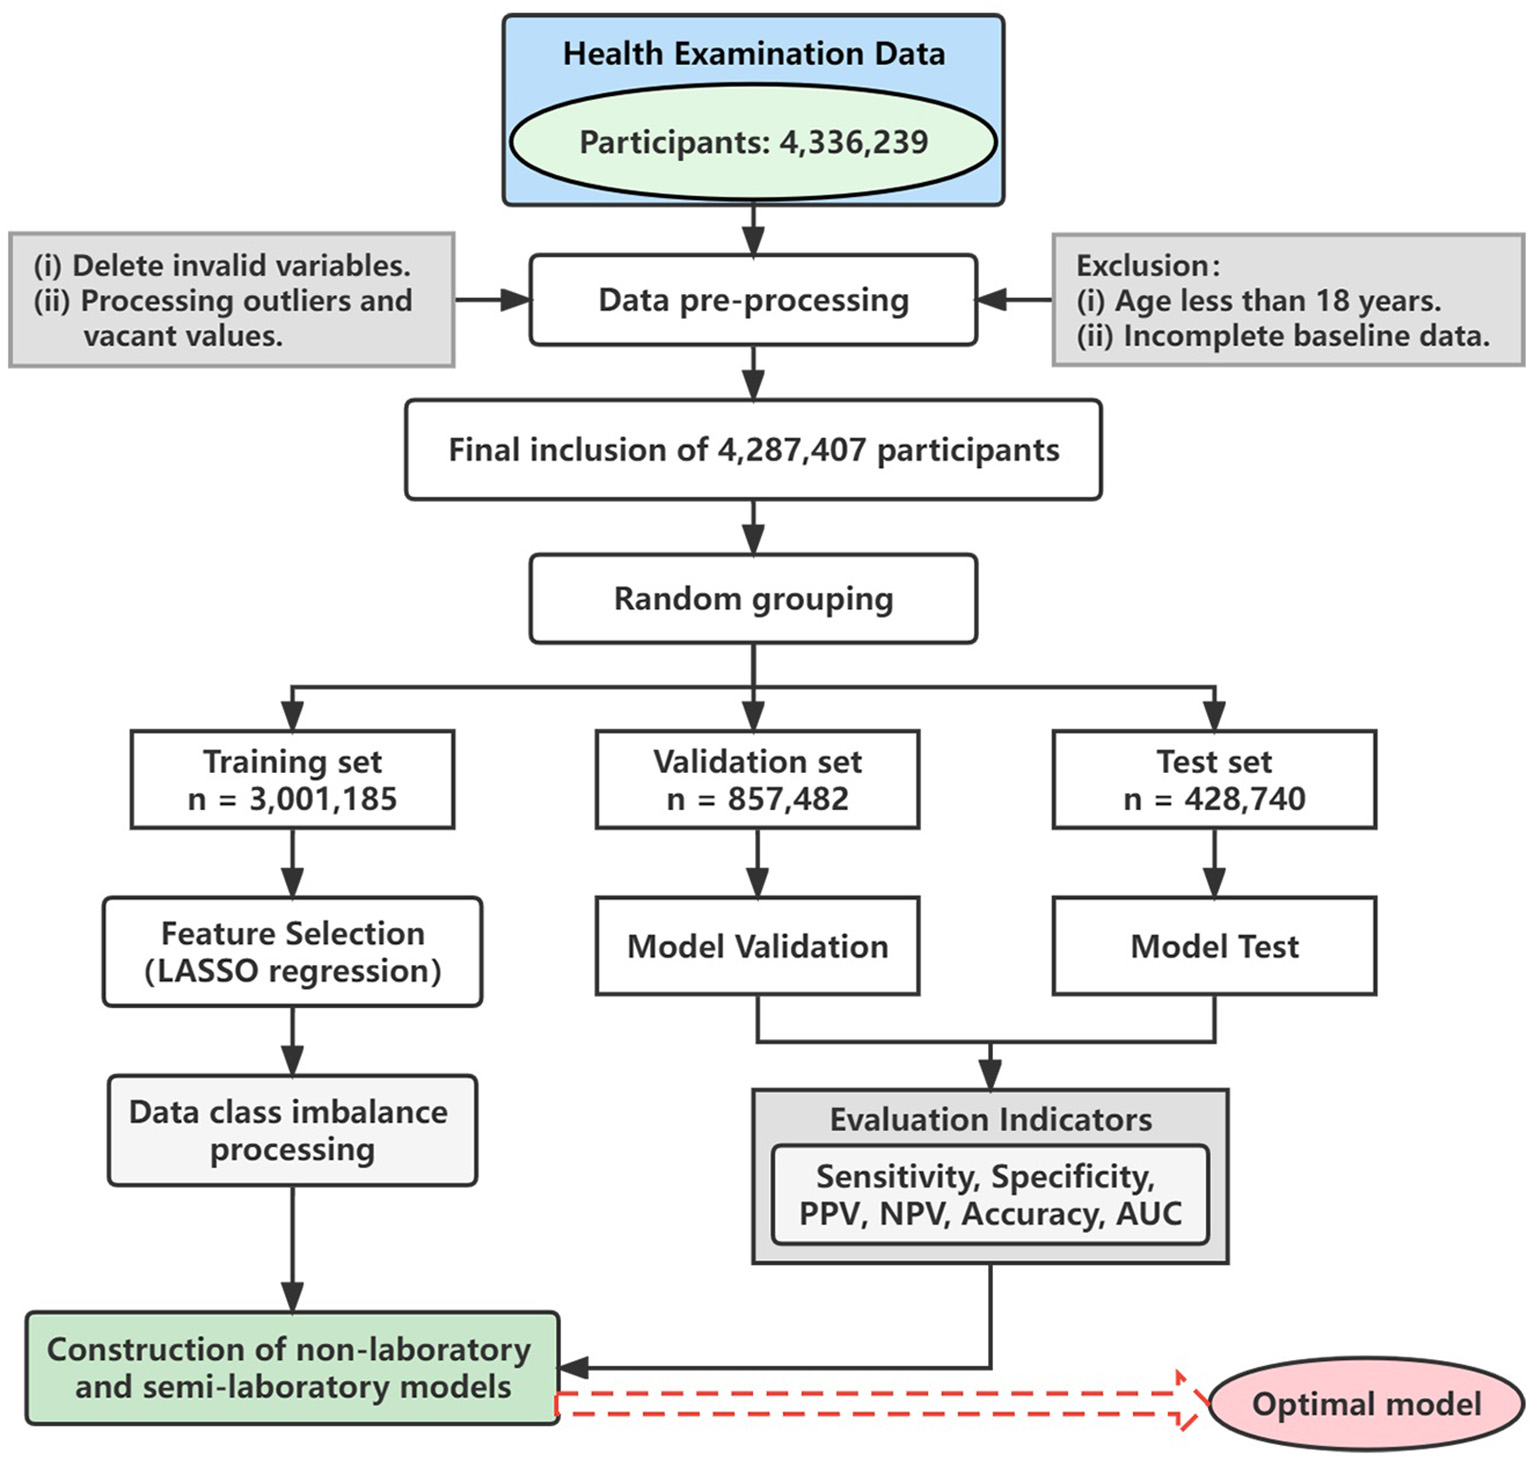
Flow chart. LASSO, least absolute shrinkage and selection operator; PPV, positive predictive value; NPV, negative predictive value; AUC, area under the receiver operating characteristic curve.
Definition of hypertension
Hypertension patients met the following criteria: systolic blood pressure (SBP) ≥ 140 mmHg and diastolic blood pressure (DBP) ≥ 90 mmHg in the absence of antihypertensive drugs, or someone with a hypertension history, though the blood pressure did not reach the above level when undertaking antihypertensive drugs.
Predictors considered
With the characteristics of large data size, multiple variables, and the existence of many outliers and gaps, pre-processing of the data is important. In total 30 variables from the three components were used to construct the predictive model and evaluate the potential risk factors of hypertension. Variables are listed in Table 1.
Table 1
| Data sources | Variable | Variable type |
|---|---|---|
| Questionnaire | Age | Continuous variable |
| Sex | Categorical variable (“male” or “female”) | |
| Ethnicity | Categorical variable (“han,” “uyghur,” “kazakh,” “hui,” “other ethnic groups”) | |
| EF | Categorical variable (“not exercising,” “occasionally,” “more than once a week,” “daily”) | |
| SS | Categorical variable (“never smoked,” “smoking,” “quit smoking”) | |
| DF | Categorical variable (“never,” “occasionall,” “often,” “every day”) | |
| DM | Categorical variable (yes or no) | |
| PH | Categorical variable (yes or no) | |
| Routine examination | Hight | Continuous variable |
| Weight | Continuous variable | |
| BMI | Continuous variable | |
| SBP | Continuous variable | |
| DBP | Continuous variable | |
| WC | Continuous variable | |
| ECG | Categorical variable (normal or abnormal) | |
| HR | Categorical variable (normal or abnormal) | |
| Laboratory test | HGB | Continuous variable |
| WBC | Continuous variable | |
| PLT | Continuous variable | |
| FBG | Continuous variable | |
| SGPT | Continuous variable | |
| SGOT | Continuous variable | |
| ALB | Continuous variable | |
| TBIL | Continuous variable | |
| SCR | Continuous variable | |
| BUN | Continuous variable | |
| TC | Continuous variable | |
| TG | Continuous variable | |
| LDLC | Continuous variable | |
| HDLC | Continuous variable |
Information description of included variables.
Height was measured to the nearest 0.5 cm and weight to the nearest 0.1 kg. The height-weight scale had been calibrated before using. Light clothes and no shoes were required for the participants. BMI was calculated as weight (Kg)/height2 (m2). EF, exercise frequency; SS, smoking status; DF, drinking frequency; DM, diabetes mellitus; PH, parental hypertension; BMI, body mass index; SBP, systolic blood pressure; DBP, diastolic blood pressure; WC, waist circumference; ECG, electrocardiogram; HR, heart rate; HGB, hemoglobin; WBC, white blood cell; PLT, platelet; FBG, fasting blood glucose; SGPT, serum glutamic-pyruvic transaminase; SGOT, serum glutamic-oxaloacetic transaminase; ALB, albumin; TBIL, total bilirubin; SCR, serum creatinine; BUN, blood urea nitrogen; TC, total cholesterol; TG, triglyceride; LDLC, low-density lipoprotein cholesterol; HDLC, high-density lipoprotein cholesterol.
Statistical analysis
Continuous variables were expressed as median (IQR: inter-quartile range), and categorical variables were expressed as counts (percentage). Variables were compared between hypertension and non-hypertension groups. The t-test or Mann–Whitney test was used for continuous variables, while for categorical variables, the chi-square test or Fisher's exact test was used. Statistical significance was inferred at a two-tailed P-value<0.05.
Grouping and feature selection
The population was randomly divided into the training set (3,001,185), the validation set (857,482), and the test set (428,740), with a ratio of 7: 2: 1. Then, the least absolute shrinkage and selection operator (LASSO) regression were used to select the variables in the training set (27). LASSO regression was characterized by variable selection and regularization while fitting a generalized linear model, which was suitable for continuous, binary, and multivariate discrete variables.
Data imbalance processing
In this study, the number of non-hypertension participants was larger than the hypertension participants, which indicates that the sample size was imbalanced, while minority classes were harder to predict using ML methods (28, 29). An over-sampling technique, that is, borderline synthetic minority over-sampling technique (Borderline-SMOTE), was used to deal with the negative influence due to the imbalanced classification problem.
The synthetic minority over-sampling technique (SMOTE) was introduced by Chawla et al. (30), as a way to deal with the minority classes in a dataset. The fundamental idea of this algorithm is to analyze and simulate, and add the new sample simulated artificially into the original dataset to balance the classes in the original data. But there were two obvious shortcomings of SMOTE: (1) prone to sample overlap and (2) the attribute characteristics and the distribution characteristics of adjacent samples are not considered. Therefore, many adaptive sampling methods are developed to solve the above limitations, among which the Borderline-SMOTE algorithm is the most representative one (31).
Borderline-SMOTE is an advanced over-sampling algorithm based on SMOTE, which uses minority class samples on the boundary to synthesize new samples, and therefore improves the class distribution of the samples. In Borderline-SMOTE sampling, the minority class samples are divided into three categories: safe, danger, and noise. Safe means more than half of the surrounding samples are minority class samples. Danger means that more than half of the surrounding samples are majority class samples, which are regarded as boundary samples. Besides, noise refers to the majority class of samples around the sample, which is regarded as noise. Finally, only the minority class samples that behave as danger are over-sampled.
Variable coding
The preprocessing.LabelEncoder algorithm of sklearn.preprocessing library in python software was used to digitize the labels, and preprocessing.OrdinalEncoder algorithm was used to digitize the orderly categorical variables of characteristics. The preprocessing.OneHotEncoder algorithm was used to convert the nominal variables to the dummy variables.
Prediction models
This study established three kinds of hypertension predictive models, including tree-based ML models (CART, RF, ADABoost, and XGBoost), other ML models (ANN and NB), and traditional LR models. On the basis of the above models, we analyzed non-laboratory and semi-laboratory features separately depending on whether blood test data were included or not.
The CART algorithm is based on tree arrangement and describes the classification process depending on input features. There were some advantages of CART, such as fast computing, high accuracy, no requirement of domain knowledge or parametric assumptions, and suitable for high-dimensional data, but it has some shortcomings, such as high variance and over-fitting phenomenon, which limits its practicality as an independent predictive model. RF is an algorithm that combines bagged ensemble learning theory with random subspace methods (32), aiming at constructing many independent evaluators and then selecting the results supported by most evaluators or choosing the mean values. ADABoost and XGBoost algorithms (33) aim at combining the power of the weak evaluator to predict the hard-to-evaluate samples repeatedly, in order to construct a strong evaluator.
The ANN is a computing system based on human brain neurons (34). ANN can deal with the interactions between complex and non-linear variables. ANN consists of a multi-hidden layer neural network and a single hidden layer neural network. Each layer contains some neurons connected by directed arcs with variable weights. In this study, the neural network contains three layers: the input layer accepts all risk factors, the hidden layer processes the information, and the output layer calculates the response. NB is a classical ML algorithm, which calculates the probabilities of each attribute by applying Bayes' rule and predicts the class based on the highest prior probability (35).
The LR is a generalized linear regression analysis model, and aims to find out the best fitting model to describe the relationship between the dependent variables and independent predictors (36). This model was most extensively applied because of the good effect of disease predictions.
Model evaluation
To optimize the model effect, we adjust the parameters of each model based on the learning curve and grid search, so as to find the optimal combination of parameters. Besides, we calculated the sensitivity, specificity, positive predictive value (PPV), negative predictive value (NPV), accuracy, Youden index, and area under the receiver operating characteristic (AUC) curve of each model based on the confusion matrix to evaluate the pros and cons.
Feature importance ranking
According to the results of the LR model, the absolute values of the regression model Z statistic (23, 37) were calculated and adjusted the sum to 1 (the higher the value, the greater the effect on hypertension). Then, the feature importance ranking plot of the LR model was drawn.
Machine Learning algorithms can also measure the importance of different features. Different from the odds ratio (OR) of the regression model, the machine algorithm cannot evaluate a simple explanatory value because the relationship fitted by the machine algorithm is complex. Therefore, the relationship is usually not directly generalized to any one parameter, and there is no causal relationship, not even a statistical explanation (18). This measure is usually viewed as the sorting of how important each variable is to the model fit, which is a method to generate hypotheses in order to identify the factors requiring further study and also provides insight into the factors having the greatest impact on predictions. Therefore, a feature importance ranking plot was drawn for the ML algorithm which showed the best prediction.
All analyses were carried out with the python 3.8.3 version. Null and outlier determination and interpolation were performed by the “Pandas” library, “NumPy” library, and “Matplotlib” library. Data imbalance was solved by the “Imlearn” library, and build and validate ML models by the “Sklearn” library. LASSO penalized LR was performed by the “Glmnet” package of the R software 4.1.0 version.
Results
Gender and age differences in hypertension
After pre-processing of data, 4,287,407 people were left, consisting of 2,009,970 men (46.9%) and 2,277,437 women (53.1%). From Table 2, we can observe that the prevalence of hypertension was 22.1% in men and 23.7% in women, and the prevalence of hypertension was higher in women than in men (P < 0.001). This study further analyzed the differences in the prevalence of hypertension in two genders with different age groups, and we found that in the 18–29 age group and 30–45 age group, men had a higher prevalence (P < 0.001), while in the 46–65 age group and over 65 age group, women had a higher prevalence (P < 0.001). The prevalence of hypertension increases sharply with age in both genders.
Table 2
| Variables | Total | Non–Hypertensive | Hypertension | Prevalence of hypertension | P-value |
|---|---|---|---|---|---|
| Sex, n(%) | <0.001 | ||||
| Female | 2,277,437 (53.1) | 1,736,267 (52.6) | 541,170 (54.9) | 23.7 | |
| Male | 2,009,970 (46.9) | 1,565,709 (47.4) | 444,261 (45.1) | 22.1 | |
| Age group, n(%) | |||||
| 18–29 | <0.001 | ||||
| Female | 273,841 (52.6) | 273,391 (52.7) | 450 (29.4) | 0.2 | |
| Male | 246,490 (47.4) | 245,411 (47.3) | 1,079 (70.6) | 0.4 | |
| 30–45 | <0.001 | ||||
| Female | 560,689 (53.9) | 538,282 (54.3) | 22,407 (46.3) | 4.0 | |
| Male | 479,894 (46.1) | 453,897 (45.7) | 25,997 (53.7) | 5.4 | |
| 46–65 | <0.001 | ||||
| Female | 1,054,532 (53.6) | 755,022 (52.5) | 299,510 (56.4) | 28.4 | |
| Male | 913,697 (46.4) | 682,213 (47.5) | 231,484 (43.6) | 25.3 | |
| 65 over | <0.001 | ||||
| Female | 388,375 (51.2) | 169,572 (47.9) | 218,803 (54.1) | 56.3 | |
| Male | 369,889 (48.8) | 184,188 (52.1) | 185,701 (45.9) | 50.2 |
Differences in the prevalence of hypertension between men and women in this study (N = 4,287,407).
Basic characteristics
The general characteristics of participants in this study are shown in Table 3. A total of 985,431 patients with hypertension were recruited. Compared with non-hypertension people, the median values of age, SBP, DBP, body mass index (BMI), WC, hemoglobin (HGB), white blood cell (WBC), fasting blood glucose (FBG), serum glutamic-pyruvic transaminase (SGPT), serum glutamic oxaloacetic transaminase (SGOT), serum creatinine (SCR), blood urea nitrogen (BUN), total cholesterol (TC), triglyceride (TG), and low-density lipoprotein cholesterol (LDLC) were higher in people with hypertension, and the latter are more likely to have parental hypertension (PH) and diabetes mellitus (DM). On the contrary, higher platelet (PLT) and higher albumin (ALB) levels were more common in participants without hypertension.
Table 3
| Characteristics |
Total
(n = 4,287,407) |
Non–Hypertensive
(n = 3,301,976) |
Hypertension
(n = 985,431) |
P –value |
|---|---|---|---|---|
| Age (median [IQR]) | 50.00 [38.00, 61.00] | 47.00 [34.00, 55.00] | 62.00 [54.00, 70.00] | <0.001 |
| Sex (%) | <0.001 | |||
| Female | 2,277,437 (53.1) | 1,736,267 (52.6) | 541,170 (54.9) | |
| Male | 2,009,970 (46.9) | 1,565,709 (47.4) | 444,261 (45.1) | |
| Ethnicity (%) | <0.001 | |||
| Han | 1,255,170 (29.3) | 983,889 (29.8) | 271,281 (27.5) | |
| Hui | 198,028 (4.6) | 151,551 (4.6) | 46,477 (4.7) | |
| Kazakh | 408,666 (9.5) | 307,380 (9.3) | 101,286 (10.3) | |
| Other nationalities | 138,776 (3.2) | 109,309 (3.3) | 29,467 (3.0) | |
| Uyghur | 2,286,767 (53.3) | 1,749,847 (53.0) | 536,920 (54.5) | |
| EF (%) | <0.001 | |||
| Daily | 301,849 (7.0) | 197,356 (6.0) | 104,493 (10.6) | |
| More than once a week | 91,594 (2.1) | 61,264 (1.9) | 30,330 (3.1) | |
| Not exercising | 3,751,779 (87.5) | 2,945,712 (89.2) | 806,067 (81.8) | |
| Occasionally | 142,185 (3.3) | 97,644 (3.0) | 44,541 (4.5) | |
| SS (%) | <0.001 | |||
| Never smoked | 3,820,572 (89.1) | 2,922,174 (88.5) | 898,398 (91.2) | |
| Quit smoking | 29,746 (0.7) | 19,743 (0.6) | 10,003 (1.0) | |
| Smoking | 437,089 (10.2) | 360,059 (10.9) | 77,030 (7.8) | |
| DF (%) | <0.001 | |||
| Every day | 5,235 (0.1) | 3,626 (0.1) | 1,609 (0.2) | |
| Never | 3,964,939 (92.5) | 3,036,309 (92.0) | 928,630 (94.2) | |
| Occasionall | 293,659 (6.8) | 242,935 (7.4) | 50,724 (5.1) | |
| Often | 23,574 (0.5) | 19,106 (0.6) | 4,468 (0.5) | |
| PH (%) | <0.001 | |||
| No | 4,085,273 (95.3) | 3,169,978 (96.0) | 915,295 (92.9) | |
| Yes | 202,134 (4.7) | 131,998 (4.0) | 70,136 (7.1) | |
| DM (%) | <0.001 | |||
| No | 4,003,394 (93.4) | 3,195,815 (96.8) | 807,579 (82.0) | |
| Yes | 284,013 (6.6) | 106,161 (3.2) | 177,852 (18.0) | |
| SBP (median [IQR]) | 120.00 [110.00, 130.00] | 120.00 [110.00, 126.00] | 126.00 [119.58, 140.00] | <0.001 |
| DBP (median [IQR]) | 72.00 [67.00, 80.00] | 70.00 [65.00, 80.00] | 80.00 [70.00, 90.00] | <0.001 |
| BMI (median [IQR]) | 24.80 [22.32, 27.44] | 24.29 [22.03, 26.93] | 26.06 [23.83, 29.00] | <0.001 |
| Wc (median [IQR]) | 86.00 [79.00, 95.00] | 85.00 [78.00, 92.00] | 91.00 [83.00, 100.00] | <0.001 |
| HR (%) | <0.001 | |||
| Abnormal | 39345 (0.9) | 28326 (0.9) | 11019 (1.1) | |
| Normal | 4248062 (99.1) | 3273650 (99.1) | 974412 (98.9) | |
| ECG (%) | <0.001 | |||
| Abnormal | 895654 (20.9) | 607733 (18.4) | 287921 (29.2) | |
| Normal | 3391753 (79.1) | 2694243 (81.6) | 697510 (70.8) | |
| HGB (median [IQR]) | 141.00 [129.00, 153.00] | 140.70 [128.00, 153.00] | 143.00 [132.00, 153.00] | <0.001 |
| WBC (median [IQR]) | 6.20 [5.25, 7.27] | 6.15 [5.20, 7.20] | 6.37 [5.36, 7.45] | <0.001 |
| PLT (median [IQR]) | 236.00 [198.00, 276.00] | 236.00 [199.00, 276.00] | 235.00 [196.00, 276.00] | <0.001 |
| FBG (median [IQR]) | 5.23 [4.74, 5.74] | 5.20 [4.69, 5.63] | 5.43 [4.94, 6.10] | <0.001 |
| SGPT (median [IQR]) | 20.90 [15.00, 28.70] | 20.90 [15.00, 28.90] | 21.00 [15.00, 28.30] | <0.001 |
| SGOT (median [IQR]) | 21.60 [17.40, 26.70] | 21.50 [17.30, 26.60] | 21.80 [17.60, 27.00] | <0.001 |
| ALB (median [IQR]) | 14.15 [14.15, 14.15] | 14.15 [14.15, 14.15] | 14.15 [14.15, 14.15] | <0.001 |
| TBIL (median [IQR]) | 12.71 [9.56, 15.17] | 12.71 [9.52, 15.20] | 12.71 [9.60, 15.02] | 0.008 |
| SCR (median [IQR]) | 65.50 [54.95, 78.00] | 65.20 [54.60, 77.60] | 66.40 [55.56, 78.70] | <0.001 |
| BUN (median [IQR]) | 4.95 [3.98, 5.99] | 4.89 [3.92, 5.90] | 5.11 [4.16, 6.21] | <0.001 |
| TC (median [IQR]) | 4.40 [3.76, 5.10] | 4.32 [3.70, 5.01] | 4.60 [3.99, 5.30] | <0.001 |
| TG (median [IQR]) | 1.22 [0.89, 1.68] | 1.20 [0.85, 1.61] | 1.34 [1.00, 1.89] | <0.001 |
| LDLC (median [IQR]) | 2.46 [1.95, 3.04] | 2.41 [1.92, 3.00] | 2.57 [2.03, 3.20] | <0.001 |
| HDLC (median [IQR]) | 1.33 [1.10, 1.64] | 1.33 [1.10, 1.64] | 1.32 [1.10, 1.63] | <0.001 |
Characteristics of participants in this study.
For continuous variables, the data were expressed as median [IQR: inter–quartile range], and for categorical variables, the data were expressed as counts (percentage). EF, exercise frequency; SS, smoking status; DF, drinking frequency; DM, diabetes mellitus; PH, parental hypertension; BMI, body mass index; SBP, systolic blood pressure; DBP, diastolic blood pressure; WC, waist circumference; ECG, electrocardiogram; HR, heart rate; HGB, hemoglobin; WBC, white blood cell; PLT, platelet; FBG, fasting blood glucose; SGPT, serum glutamic–pyruvic transaminase; SGOT, serum glutamic–oxaloacetic transaminase; ALB, albumin; TBIL, total bilirubin; SCR, serum creatinine; BUN, blood urea nitrogen; TC, total cholesterol; TG, triglyceride; LDLC, low–density lipoprotein cholesterol; HDLC, high–density lipoprotein cholesterol.
Features extraction
In this study, the LASSO regression model was used to select the features of the training set data. The results show that there were 24 variables with non-zero coefficients in the LASSO regression model (Figure 2), including sex, age, ethnicity, SBP, DBP, BMI, WC, exercise frequency (EF), drinking frequency (DF), PH, DM, HGB, WBC, PLT, FBG, electrocardiogram (ECG), SGOT, ALB, total bilirubin (TBIL), BUN, TC, TG, LDLC, and high-density lipoprotein cholesterol (HDLC). These 24 variables were used in three types of hypertension prediction models.
Figure 2
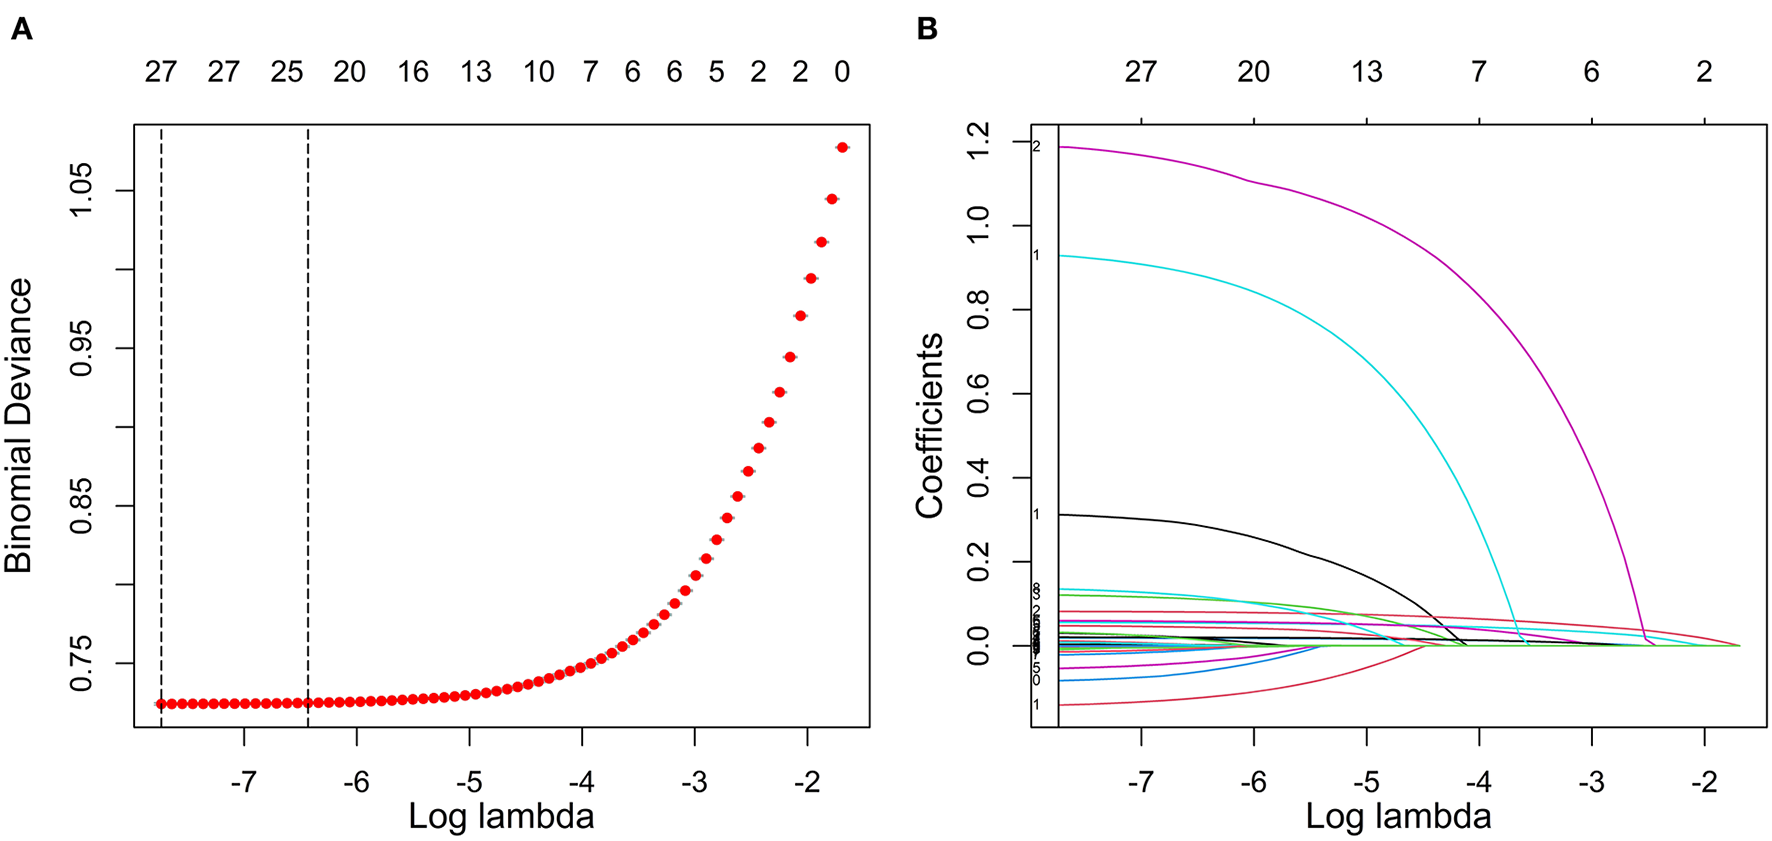
Feature selection using LASSO regression in the training set. (A) Cross-validation was performed 10 times to select the optimal parameters (lambda) of the LASSO model. (B) LASSO coefficient profile of 24 characteristics. In the LASSO algorithm, with the change of lambda, the trajectory of each hypertension-related characteristic coefficient is observed in the LASSO coefficient profile. LASSO, least absolute shrinkage and selection operator.
Class balance
The sample size of hypertensive patients in the training set was expanded to 2,312,160 by the Borderline-SMOTE algorithm, and finally, 4,624,320 non-hypertensive and hypertensive samples were obtained (Table 4).
Table 4
| Dataset | Non–Hypertensive/Hypertensive | Ratio | Description |
|---|---|---|---|
| Training set data | 2,312,160/689,025 | 3.36:1 | Original data with full instances |
| Borderline–SMOTE data | 2,312,160/2,312,160 | 1:1 | Dataset is balanced utilizing Borderline–SMOTE oversampling |
Borderline–SMOTE over–sampling balanced dataset description.
Tuning of parameters
In the non-laboratory and semi-laboratory analyses, we optimally adjusted the training set parameters of the four “tree” models, and listed the score (accuracy) of each parameter under the different models in the validation set. The results showed that, on the basis of the optimization of the other parameters, the “tree” depths of CART, RF, ADABoost, and XGBoost in the non-laboratory analyses were 24, 40, 5, and 6, respectively (Figure 3) while in the semi-laboratory analyses were 22, 44, 7, and 5, respectively (Figure 4). Thus, a relatively economical and accurate classification tree model is obtained, respectively.
Figure 3
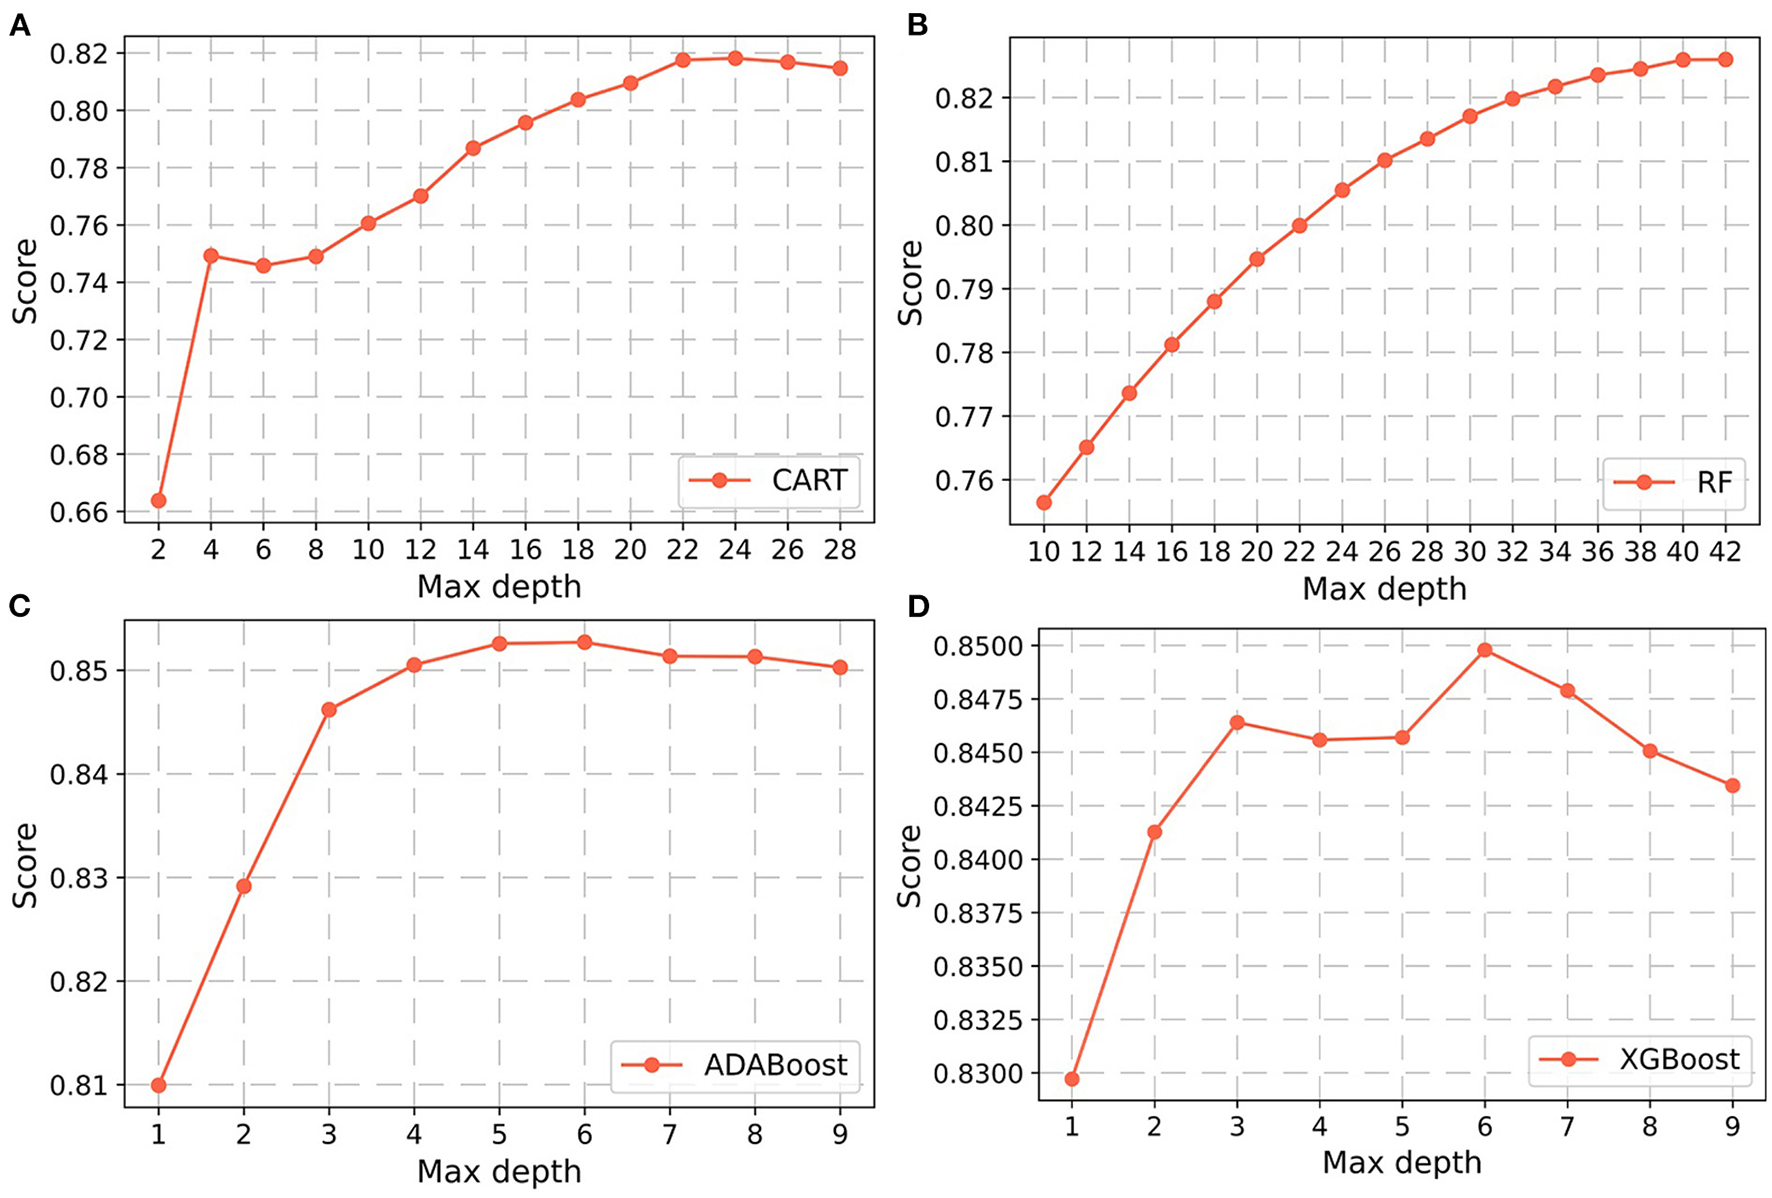
Parameter selection for four non-laboratory prediction models. Using the learning curves for (A) CART. (B) RF. (C) ADABoost, and (D) XGBoost respectively, the scores (accuracy) of each algorithm at different tree depths are shown in Figure. Abbreviations: CART, classification and regression tree; RF, random forest; ADABoost, adaboost with decision tree; XGBoost, extreme gradient boosting decision tree.
Figure 4
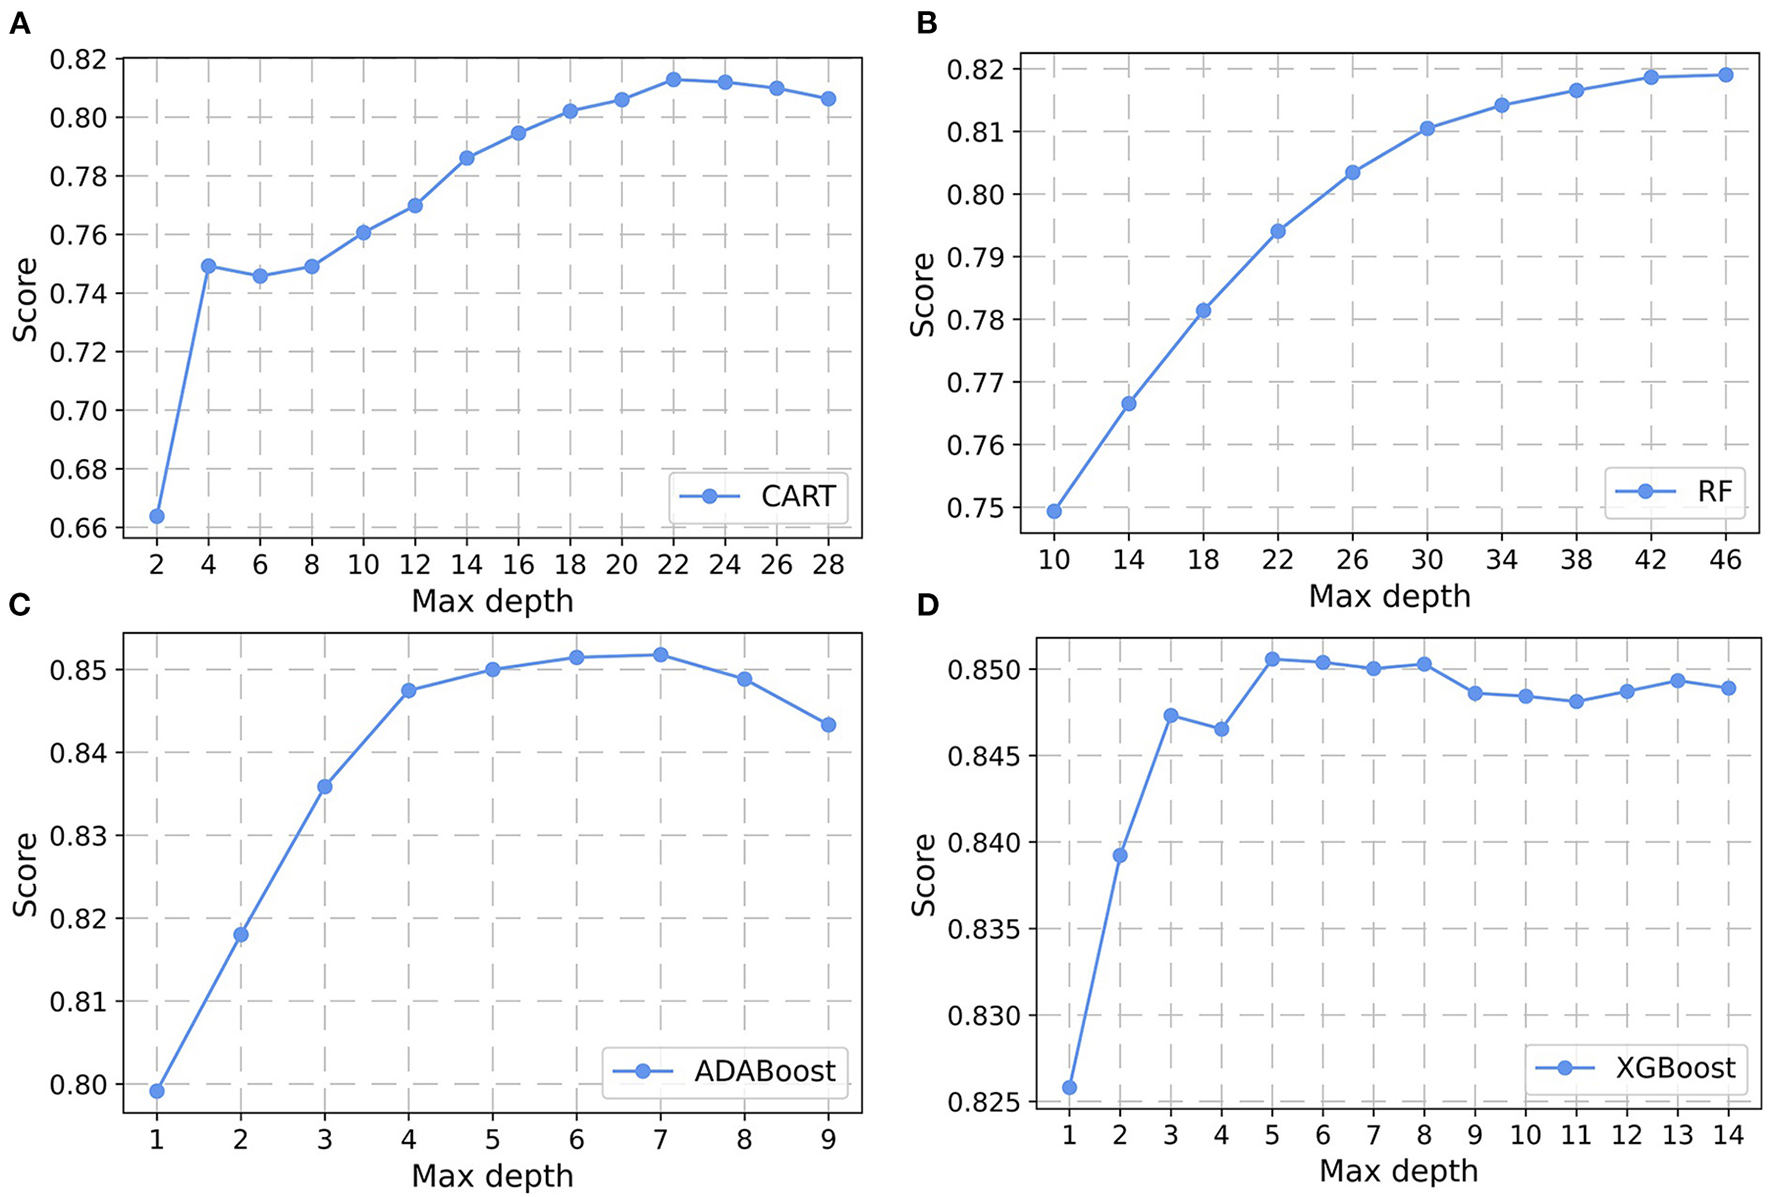
Parameter selection for four semi-laboratory prediction models. Using the learning curves for (A) CART. (B) RF. (C) ADABoost, and (D) XGBoost, respectively, the scores (accuracy) of each algorithm at different tree depths are shown in Figure. CART, classification and regression tree; RF, random forest; ADABoost, adaboost with decision tree; XGBoost, extreme gradient boosting decision tree.
Comparison of model performance
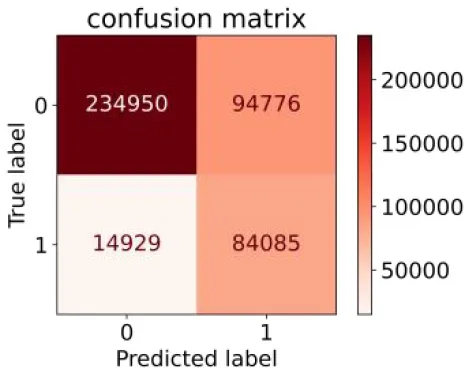
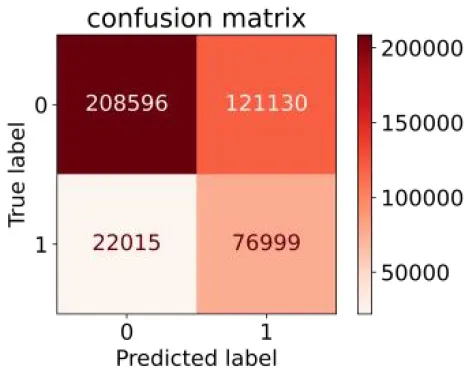
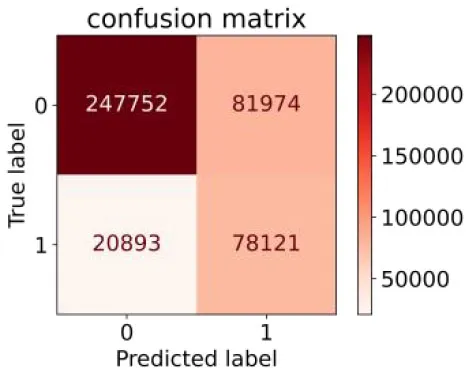
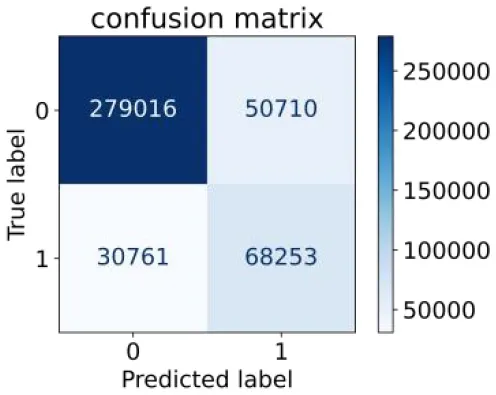
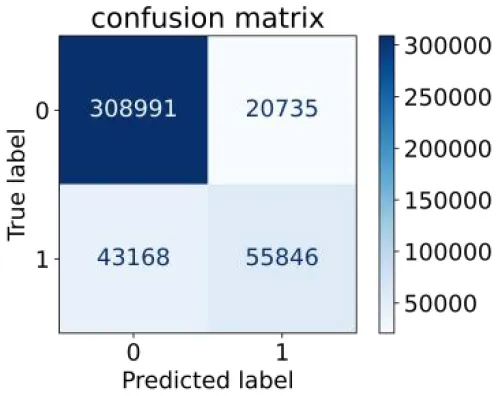
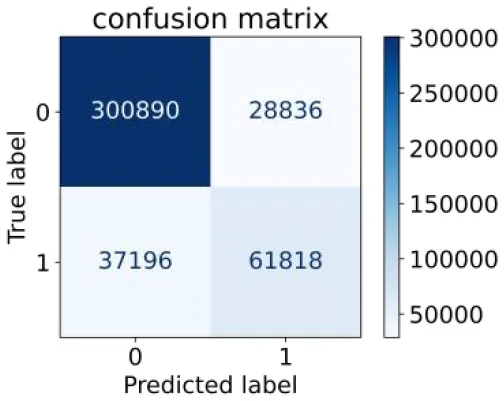
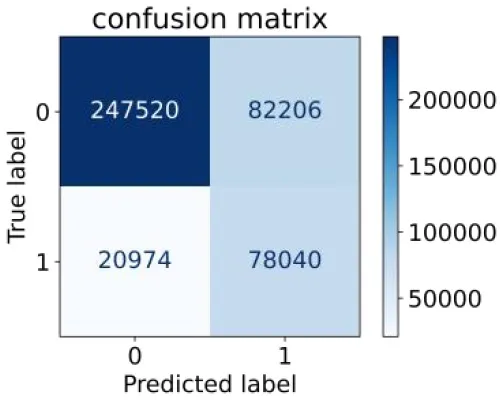
We constructed three classification models of tree-based ML models (CART, RF, ADABoost, and XGBoost), other ML models (ANN and NB), and traditional classical models (LR) in this study. Supplementary Tables S1, S2 presented the algorithm performances of non-laboratory and semi-laboratory analyses in the validation set, respectively. Tables 5, 6 presented the algorithm performances of non-laboratory and semi-laboratory analyses in the test set, respectively. The heat map showed the confusion matrix, where the larger the value, the darker the color of the area, i.e., the color of the TN and TP areas were closer to red or blue. On the contrary, the lighter the color of the FN and FP regions, the higher the accuracy of the classification model. XGBoost algorithm had a great performance in predicting the risk of hypertension in a large population of China, whose AUC of non-laboratory and semi-laboratory was 0.893 and 0.894, respectively. The NB algorithm was less effective in predicting hypertension. Some of the algorithms (RF, ADABoost, and XGBoost) in the semi-laboratory analysis incorporating blood test data showed little improvement in predictive performance compared to the non-laboratory analysis. Supplementary Figures S1, S2, and Figure 5 show the receiver operating characteristic (ROC) curve of all classifiers.
Table 5
| Models | Sub–Algorithms | Confusion matrix | Sensitivity | Specificity | PPV | NPV | Accuracy | AUC |
|---|---|---|---|---|---|---|---|---|
| Tree–based ML models | CART |
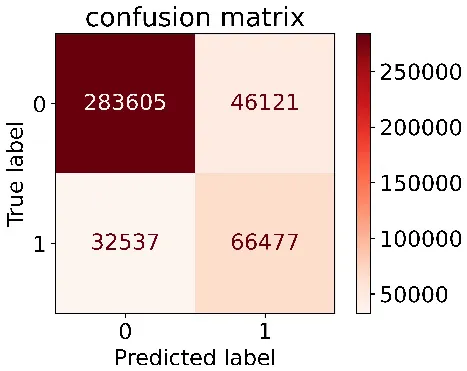
|
0.671 | 0.860 | 0.590 | 0.897 | 0.817 | 0.852 |
| RF |
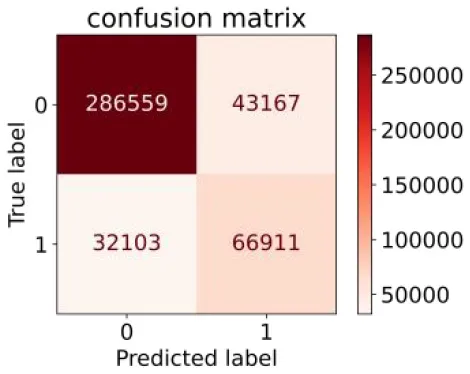
|
0.676 | 0.869 | 0.608 | 0.899 | 0.824 | 0.883 | |
| ADABoost |
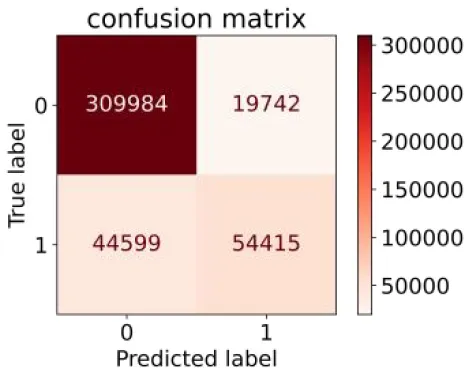
|
0.550 | 0.940 | 0.734 | 0.874 | 0.850 | 0.892 | |
| XGBoost |
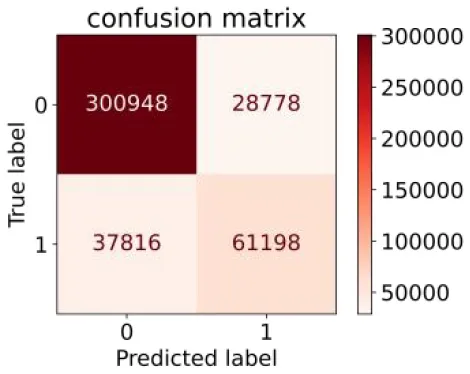
|
0.618 | 0.913 | 0.680 | 0.888 | 0.845 | 0.893 | |
| Other methods–based ML models | ANN |
|
0.849 | 0.713 | 0.470 | 0.940 | 0.744 | 0.859 |
| NB |
|
0.778 | 0.633 | 0.389 | 0.905 | 0.666 | 0.765 | |
| Classic Model | LR |
|
0.789 | 0.751 | 0.488 | 0.922 | 0.760 | 0.848 |
Performance of each algorithm in the test set for non–laboratory analysis (n = 428,740).
ML, machine learning; CART, classification and regression tree; RF, random forest; ADABoost, adaboost with decision tree; XGBoost, extreme gradient boosting decision tree; ANN, artificial neural network; NB, naive Bayes; LR, logistic regression; AUC, the area under the receiver operating characteristic curve.
Table 6
| Models |
Sub–
Algorithms |
Confusion matrix | Sensitivity | Specificity | PPV | NPV | Accuracy | AUC |
|---|---|---|---|---|---|---|---|---|
| Tree–based ML models | CART |
|
0.689 | 0.846 | 0.574 | 0.901 | 0.810 | 0.850 |
| RF |

|
0.709 | 0.852 | 0.590 | 0.907 | 0.819 | 0.885 | |
| ADABoost |
|
0.564 | 0.937 | 0.729 | 0.877 | 0.850 | 0.893 | |
| XGBoost |
|
0.624 | 0.913 | 0.682 | 0.890 | 0.846 | 0.894 | |
| Other methods–based ML models | ANN |
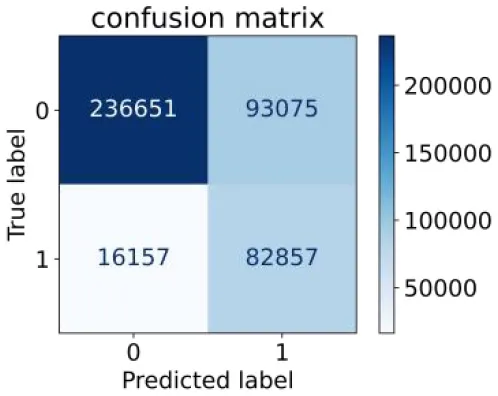
|
0.837 | 0.718 | 0.471 | 0.936 | 0.745 | 0.858 |
| NB |
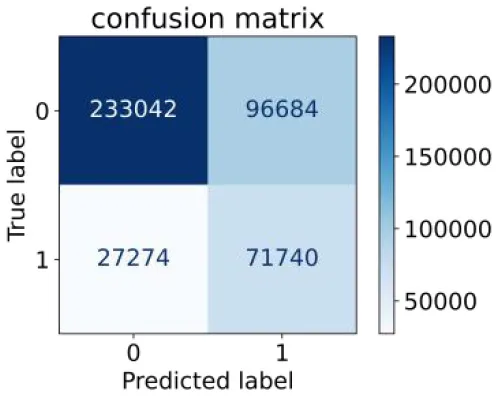
|
0.725 | 0.707 | 0.426 | 0.895 | 0.711 | 0.763 | |
| Classic Model | LR |
|
0.788 | 0.751 | 0.487 | 0.922 | 0.759 | 0.846 |
Performance of each algorithm in the test set for semi–laboratory analysis (n = 428,740).
ML, machine learning; CART, classification and regression tree; RF, random forest; ADABoost, adaboost with decision tree; XGBoost, extreme gradient boosting decision tree; ANN, artificial neural network; NB, naive Bayes; LR, logistic regression; AUC, the area under the receiver operating characteristic curve.
Figure 5
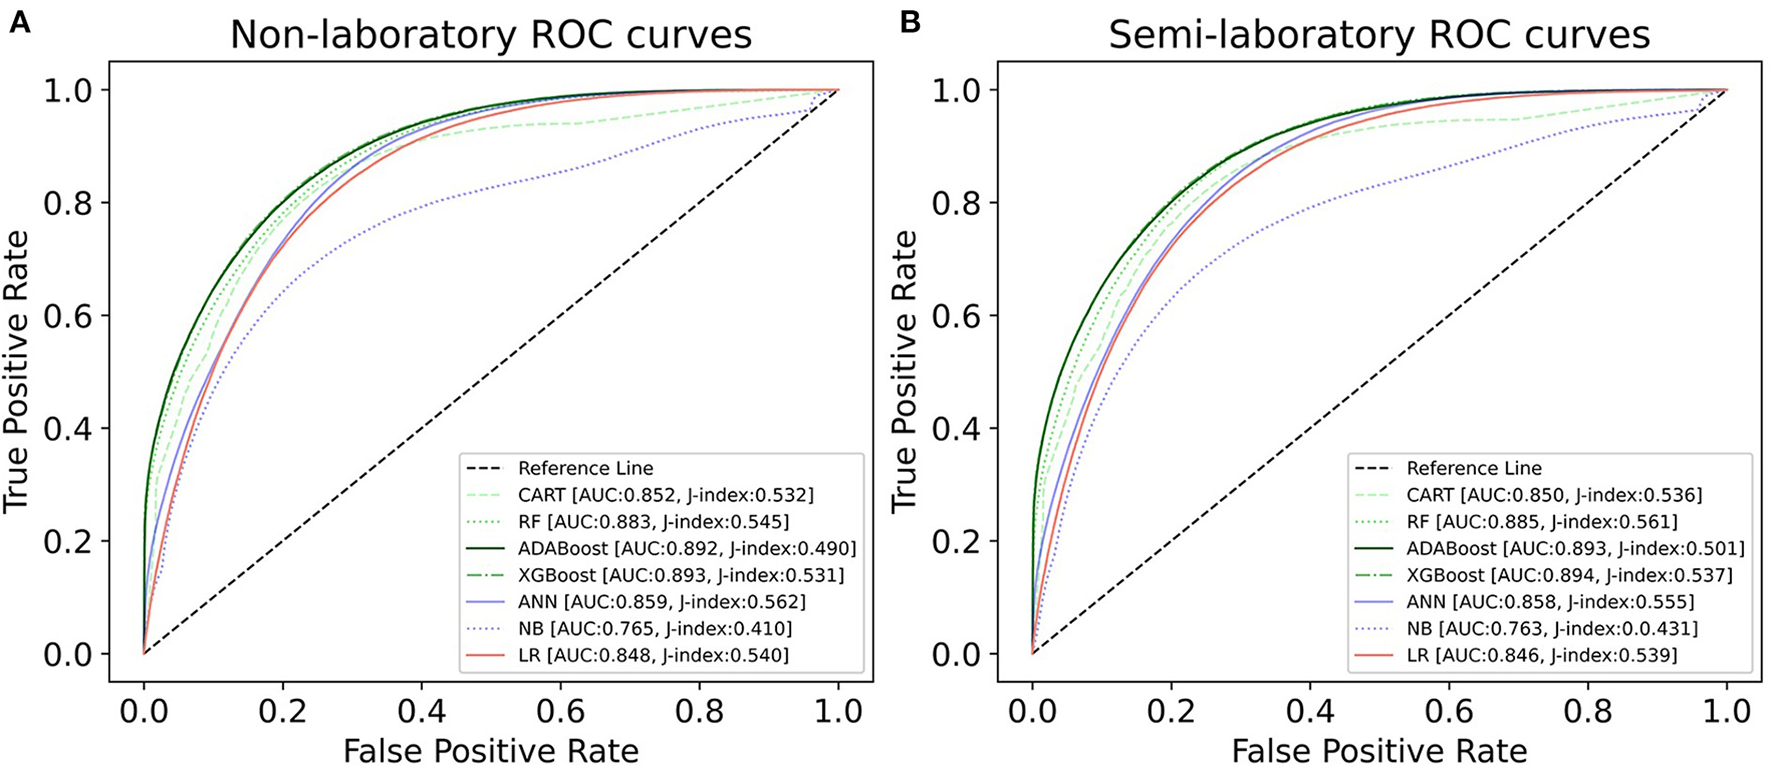
ROC curves for each classification algorithm for the non-laboratory and semi-laboratory models. (A) Non-laboratory model. (B) Semi-laboratory model. Youden's J-index combines sensitivity and specificity into a single measure (sensitivity + specificity−1) and has a value between 0 and 1. In a perfect test, Youden's index equals 1. ROC, receiver operating characteristic; CART, classification and regression tree; RF, random forest; ADABoost, adaboost with decision tree; XGBoost, extreme gradient boosting decision tree; ANN, artificial neural network; NB, naive Bayes; LR, logistic regression; AUC, the area under the ROC curve.
Importance of features
In this study, the importance of each feature was ranked by the LR model (Figure 6), and it was found that age, DBP, ECG, SBP, BMI, DF, sex (female), WC, ethnicity (uyghur, hui, and other), and FBG were the factors that had a greater impact on hypertension. Afterward, feature importance ranking was conducted for the ML algorithms which performed best in the non-laboratory analyses and semi-laboratory analyses.
Figure 6
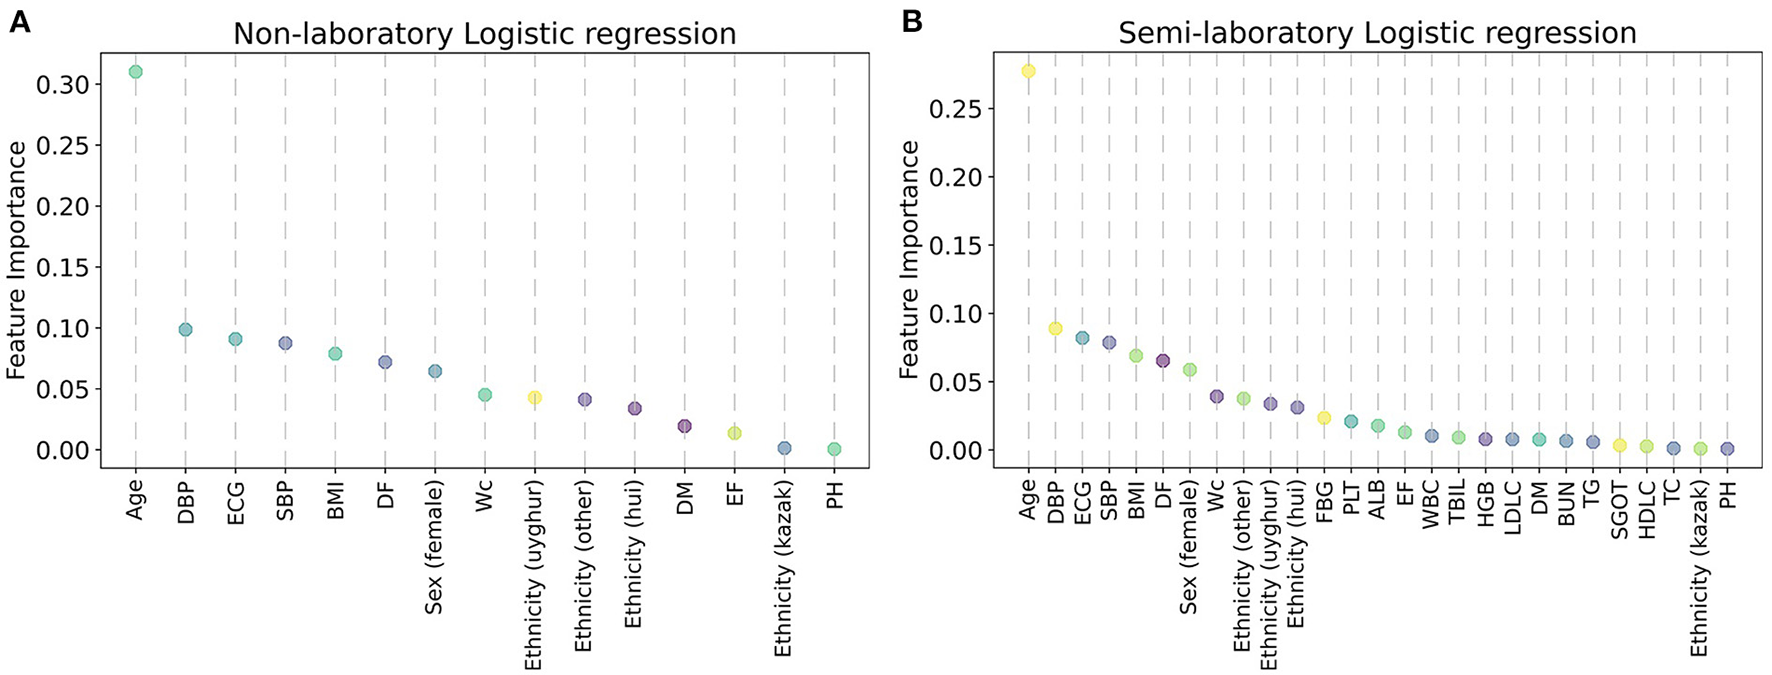
Variable importance of the predictors for the predictive models for hypertension, using logistic regression. (A) Non-laboratory model. (B) Semi-laboratory model. The variable importance was calculated using the absolute z-statistic of each predictor. SBP, systolic blood pressure; WC, waist circumference; DBP, diastolic blood pressure; ALB, albumin; DF, drinking frequency; ECG, electrocardiogram; BMI, body mass index; EF, exercise frequency; DM, diabetes mellitus; TBIL, total bilirubin; SGOT, serum glutamic-oxaloacetic transaminase; TG, triglyceride; HGB, hemoglobin; PH, parental hypertension; WBC, white blood cell; FBG, fasting blood glucose; HDLC, high density lipoprotein cholesterol; TC, total cholesterol; LDLC, low density lipoprotein cholesterol; BUN, blood urea nitrogen; PLT, platelet; Sex (female) and Sex (male) are dummy variables of sex; ethnicity (uyghur), ethnicity (hui), ethnicity (other), and ethnicity (kazak) are dummy variables of ethnicity.
In conclusion, considering the results of LR and XGBoost, age, SBP, WC, DBP, ALB, DF, ECG, ethnicity (uyghur, hui, and other), BMI, sex (female), EF, DM, TBIL, and FBG were identified as important factors of hypertension.
Finally, the algorithm architecture proposed in the paper is shown in Figure 8. We have constructed the optimal XGBoost algorithm based on non-laboratory and semi-laboratory influencing factors to achieve the prediction of hypertension prevalence in a large-scale population in Xinjiang.
XGBoost provides three ways to calculate the importance of each feature, and “gain” was chosen as the calculation method of feature contribution, because it could easily find the most direct features. It was found that age, SBP, WC, ECG, DBP, ethnicity (uyghur and other nationalities), DF, DM, and sex (female) were identified as the top 10 most important factors in the non-laboratory analyses with XGBoost algorithms, while age, SBP, WC, DBP, ALB, DF, ECG, ethnicity (uyghur, hui, and other nationalities), BMI, sex (female), EF, DM, and TBIL were identified as the top 15 most important features in the semi-laboratory analyses with the XGBoost algorithms (Figure 7).
Figure 7
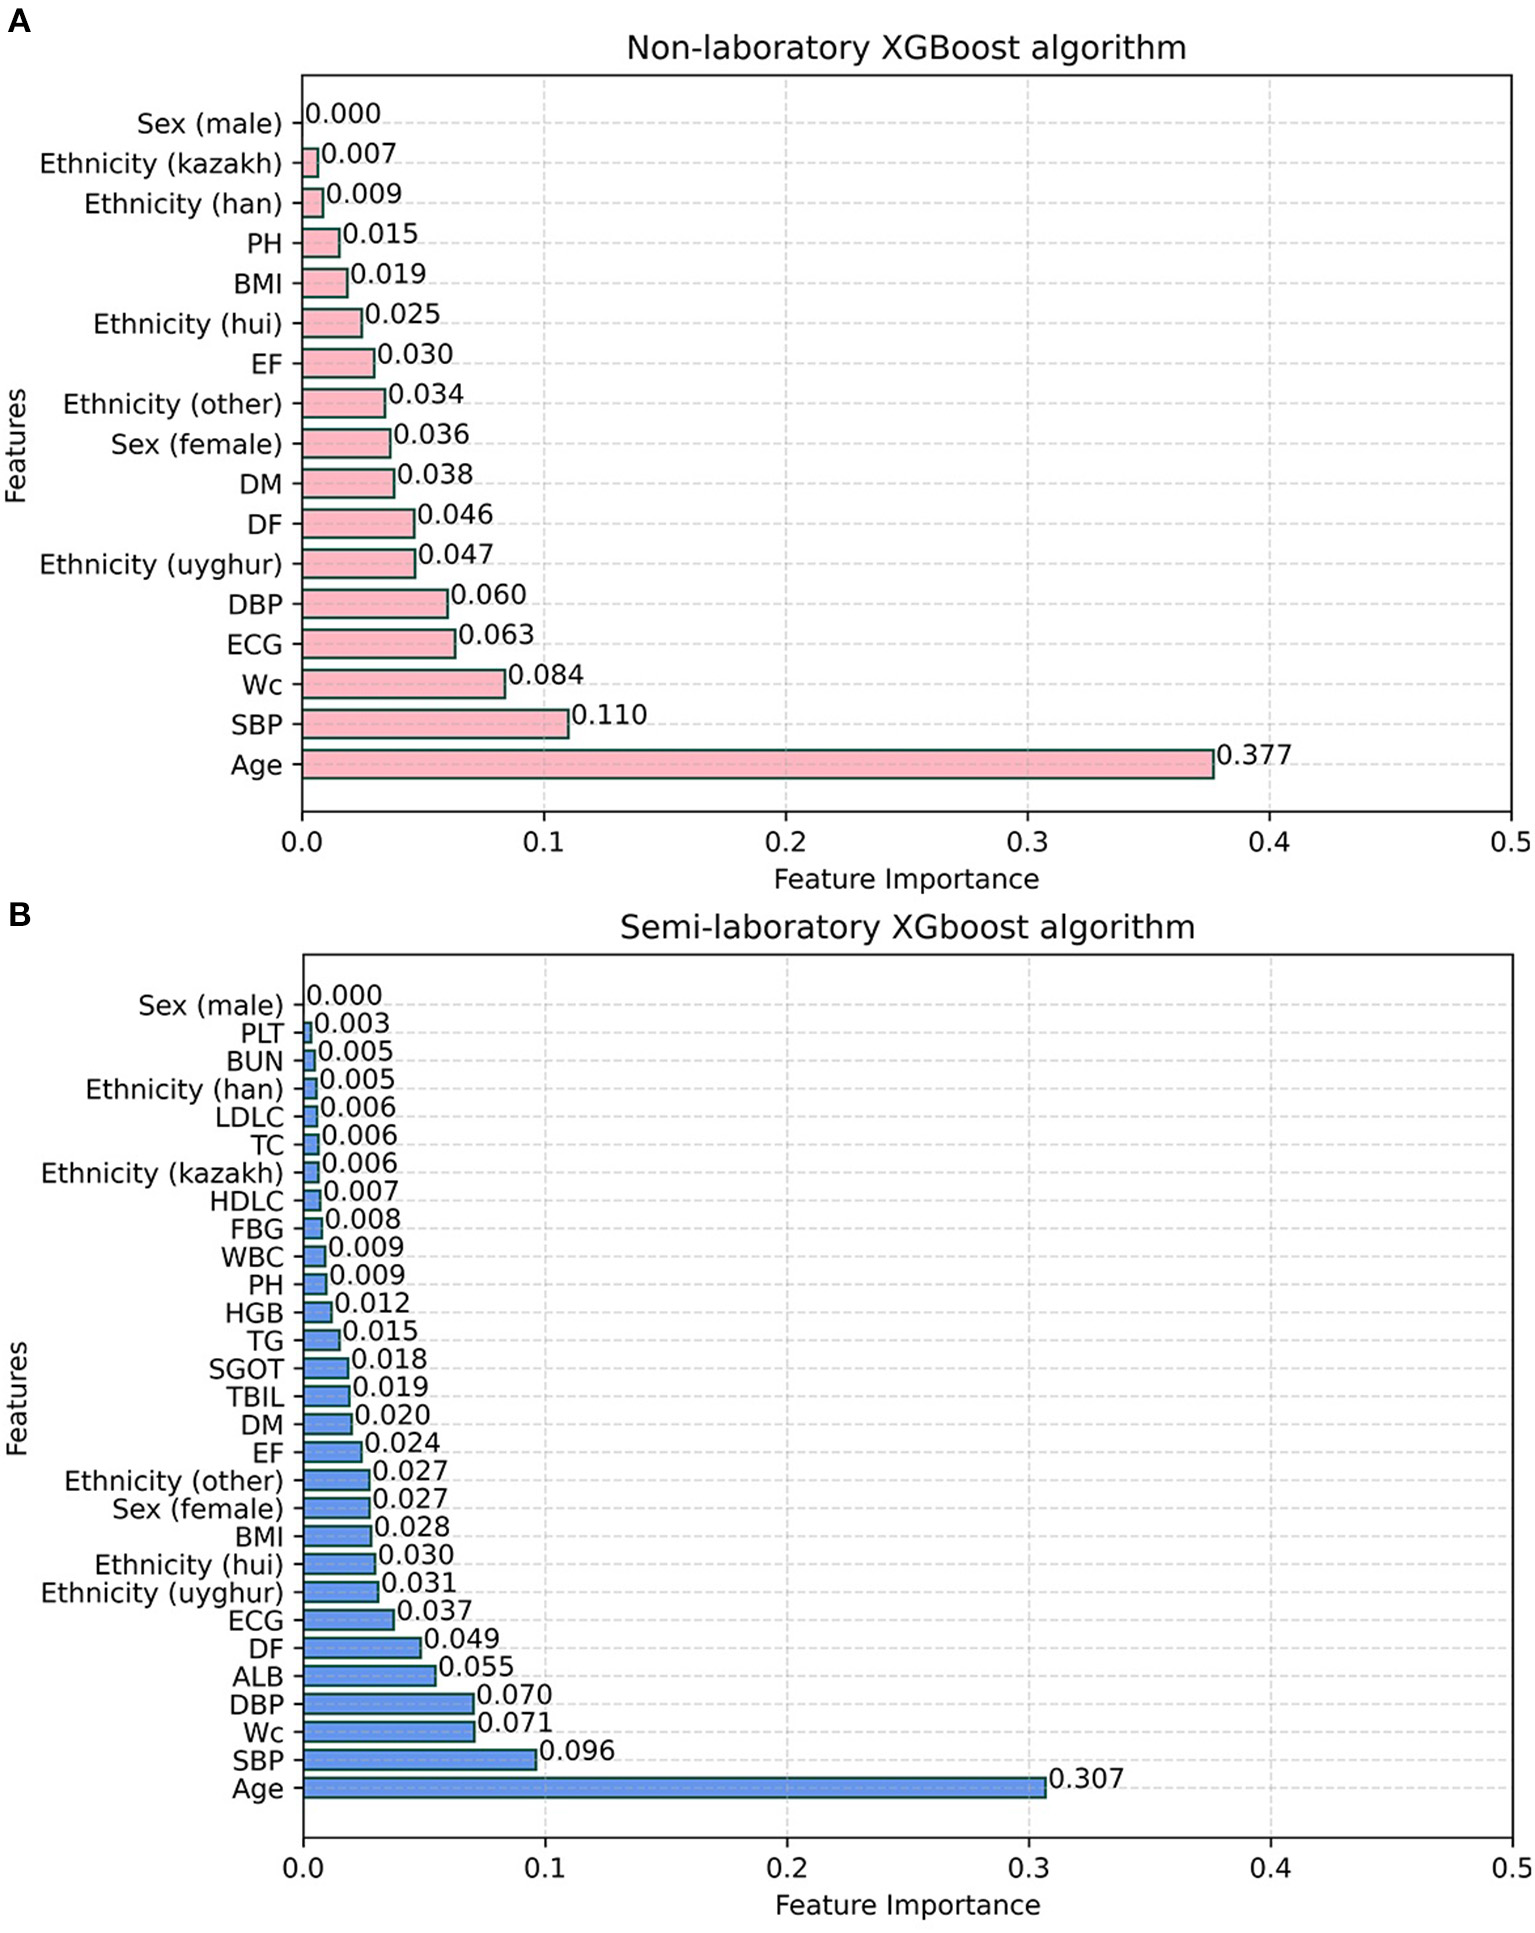
Feature importance of XGBoost algorithm. (A) Non-laboratory model. (B) Semi-laboratory model. SBP, systolic blood pressure; WC, waist circumference; DBP, diastolic blood pressure; ALB, albumin; DF, drinking frequency; ECG, electrocardiogram; BMI, body mass index; EF, exercise frequency; DM, diabetes mellitus; TBIL, total bilirubin; SGOT, serum glutamic-oxaloacetic transaminase; TG, triglyceride; HGB, hemoglobin; PH, parental hypertension; WBC, white blood cell; FBG, fasting blood glucose; HDLC, high density lipoprotein cholesterol; TC, total cholesterol; LDLC, low density lipoprotein cholesterol; BUN, blood urea nitrogen; PLT, platelet; Sex (female) and Sex (male) are dummy variables of sex; ethnicity (uyghur), ethnicity (hui), ethnicity (other), and ethnicity (kazak) are dummy variables of ethnicity.
Figure 8
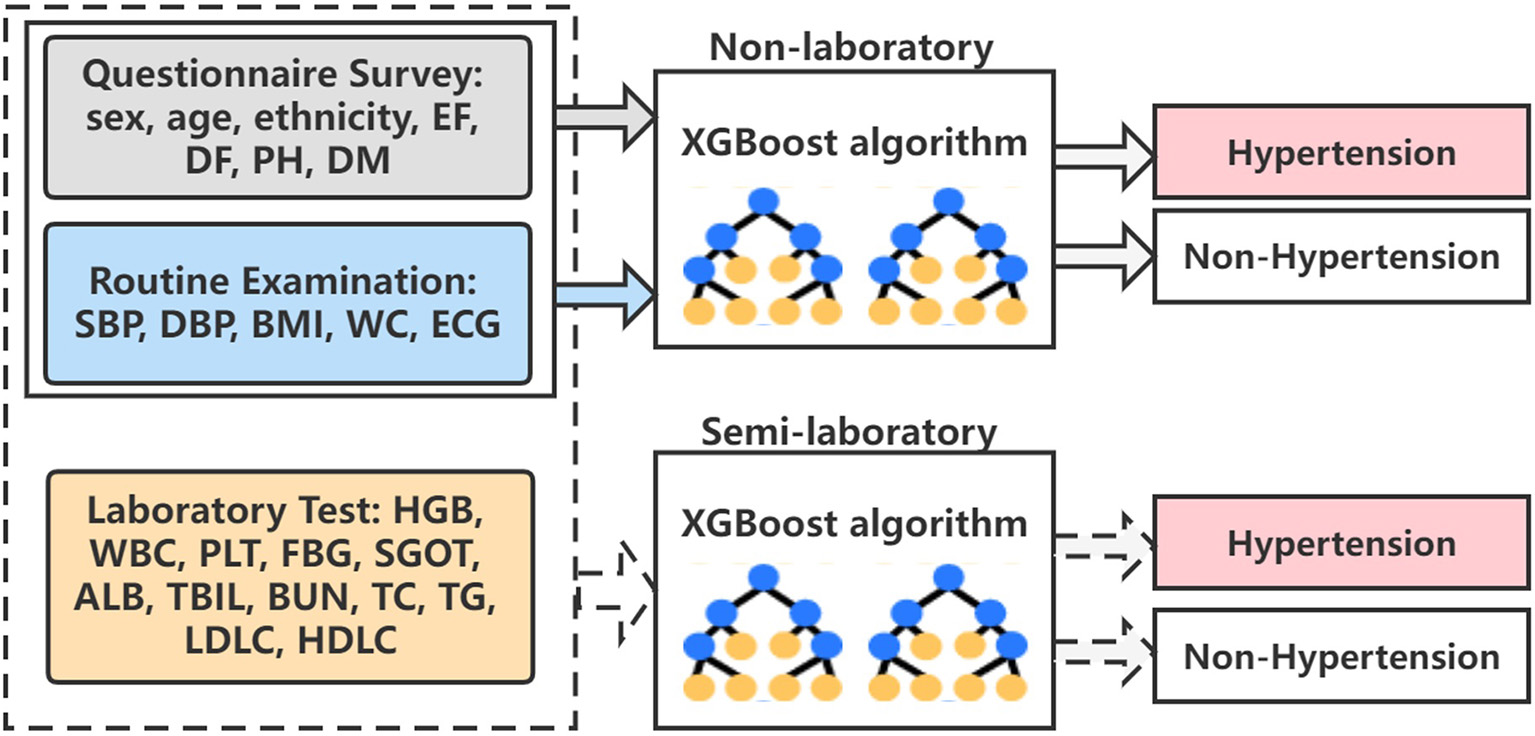
The overall algorithm architecture diagram. EF, exercise frequency; DF, drinking frequency; PH, parental hypertension; DM, diabetes mellitus; SBP, systolic blood pressure; DBP, diastolic blood pressure; BMI, body mass index; WC, waist circumference; ECG, electrocardiogram; HGB, hemoglobin; WBC, white blood cell; PLT, platelet; FBG, fasting blood glucose; SGOT, serum glutamic-oxaloacetic transaminase; ALB, albumin; TBIL, total bilirubin; BUN, blood urea nitrogen; TC, total cholesterol; TG, triglyceride; LDLC, low density lipoprotein cholesterol; HDLC, high density lipoprotein cholesterol.
Discussion
Between 2012 and 2015, the prevalence of hypertension in China was increasing to a high level (46.4%) according to the 2017 American College of Cardiology/American Heart Association guidelines (38). However, the control and treatment of hypertension are not perfect enough, and people's awareness regarding hypertension was lacking (39). Identifying these potential hypertension patients and initiating appropriate treatment are of priority. In this study, we incorporated 4,287,407 adults who had national physical examinations for non-laboratory and semi-laboratory analyses, respectively, and figured out an optimal prediction of hypertension risk in a large Chinese population by comparing tree-based ML models (CART, RF, ADABoost, and XGBoost), other ML models (NB and ANN), and traditional LR models.
Hypertension is a significant public health issue. The ability to predict the risk of developing hypertension could contribute to disease prevention strategies. At present, many models for hypertension have been established, which show good predicting results. However, these models are limited to a specific population (40–44) or disease (45–47). For example, Xu Y et al. (41) established a prediction model for hypertension in the Xinjiang kazak population by using 14 predictors, including age, smoking, alcohol consumption, baseline BMI, baseline DBP, baseline SBP, daily salt intake, and yak butter intake. Kanegae H et al. (43) developed a high-precision prediction model for hypertension based on artificial intelligence by incorporating age, BMI, WC, SDP, DBP, Cardio-Ankle vascular index, uric acid, and other factors. Qi H et al. (45) established a micro-RNA screening and prediction model for salt-sensitive hypertension at the miRNA molecular level. Factors unique to these studies may be the main reason why the model achieves good predictive results in different populations. The classic hypertension prediction model Framingham Risk Score (FRS) (7) believes that age, sex, SDP, DBP, BMI, PH, and smoking are important influencing factors of hypertension. FRS has been verified in European population studies and has shown good differentiation and calibration (9). Carson AP et al. (40) also applied it to the prediction and assessment of hypertension risk in young people and achieved good results. However, a study about the FRS model indicated that it is not suitable for the Chinese population (11). Therefore, this study included ethnicity, WC, EF, ECG, DM, and other characteristics based on FRS, which gained good predicting results.
It has been widely confirmed that the prevalence of hypertension in different genders was diverse (48–51). This study showed that differences existed between the two genders. In the age groups of 18–29 and 30–45, the prevalence of hypertension in men was significantly higher than in women, while in the 46–65 and over 65 age groups, an opposite trend was observed. This difference might be due to hormonal differences or lifestyle differences (50, 52). Studies have shown that the blood pressure of premenopausal women was often lower than that of men of the same age. After menopause, the prevalence of hypertension in women gradually increased, and after the age of 65, the prevalence of hypertension in women was significantly higher than in men (51, 53). The above findings indicated that there were gender differences in the underlying pathological mechanisms of hypertension.
Previous studies have demonstrated differences in the prevalence of hypertension between different ethnicities (54–57) and confirmed that ethnicity could be a predictor of hypertension (58). Therefore, ethnicity was incorporated into the prediction model, and the results also indicated that it could be an important predictor of hypertension in the Chinese population, especially in uygur, hui, and other nationalities.
According to the World Health Organization (WHO), the global increase in the prevalence of hypertension has been attributed to persistent stress, excess weight, physical inactivity, harmful alcohol consumption, and an unhealthy diet (59). Also, our model also proved that WC, BMI, EF, and DF are important influencing factors of hypertension. Our findings also suggest that ECG was an important predictor of hypertension, which was consistent with other studies (60–62). The pathogenesis of DM and hypertension mutually promote and influence each other (63–65), which makes the prediction models have a general limitation and may not be applicable to the DM population (7, 13, 66). In order to avoid this deficiency, this important factor was considered in the inclusion of risk factors and was included as a predictor of hypertension, and the results also showed its important role in predicting hypertension. The semi-laboratory analyses of this study showed that ALB levels were important influencing features of hypertension. Hypertension is associated with endothelial dysfunction, insulin resistance, inflammation, and oxidative stress (67, 68), while ALB has anti-inflammatory and antioxidant effects (69). The study by Oda E et al. (70) also showed the same findings about ALB as our study. A report published by Nilsson PM in 2019 showed that after multiple adjustments for age, sex, body mass index, smoking, drinking habits, dyslipidemia, chronic kidney disease, and blood uric acid, fasting blood glucose at a high baseline level was an independent risk marker for new-onset hypertension. Afterward, TatSumi et al. (71) showed that fasting blood glucose was a good predictor of hypertension through a 5-year cohort study, which was consistent with our findings.
This study implied that the semi-laboratory analyses incorporating blood test indicators did not show a significant improvement in predictive performance compared to the non-laboratory analyses. The feature importance ranking plot of the XGBoost algorithm also showed that the blood test factors were not very important for the identification of hypertension.
There are several advantages to this study. First, this study was based on a large amount of population data in China, which was highly generalizable and representative. In addition, our dataset included multiple major ethnic groups in China, which better assessed the characteristics of the Chinese population. Besides, we carried out both non-laboratory analyses and semi-laboratory analyses, respectively, and found two optimal models that were suitable for people in different regions. Especially, in non-laboratory analyses, simple and easily available variables were used to build a predictive model with high performance, which saves blood testing and extra manpower, as well as greatly promotes the diagnosis and screening of hypertension in economically underdeveloped remote areas (15). We obtained a satisfied predictive effect of our models, for example, the AUC values of XGBoost were 0.893 and 0.894, respectively. As far as we know, the effects of our model were better than most of the known models, which might be due to the fact that the model was built on many features and included a big sample.
There are several limitations to this study. First, the causal relationship cannot be analyzed from the cross-sectional data of the health screening component, which needs to be further verified in future studies. Second, the data of this study were based on the physical examination data of residents in the Xinjiang region of China, which may limit the extrapolation of results. Third, EF, DF, and DM are all based on a questionnaire survey, and participants reported themselves through recall, which can lead to memory errors. Considering privacy and other reasons, participants failed to truthfully fill in their DM status, so the prevalence of diabetes was underestimated. Finally, in the current study, only self-reported parental history of hypertension was available. A previous study indicated that children's self-reported parental history of hypertension had a high positive predictive value but a low negative predictive value, suggesting that more participants may classify their parents as normotensive while their parents were actually hypertensive (72).
Conclusion
In summary, on the basis of a cross-sectional study involving 4,287,407 participants, we carried out the non-laboratory and semi-laboratory analyses, by constructing the tree-based ML models, other ML models, and traditional LR model and obtaining the optimal algorithm for predicting the risk of hypertension in a large-scale Chinese population. This study showed that tree-based ML models (XGBoost algorithm) performed excellently in identifying hypertensive patients, while blood test factors had little effect on improving the hypertension prediction model. As we know, this study is the first one to establish non-laboratory and semi-laboratory hypertension prediction models on the basis of multi-ethnic and large samples by systematically and comprehensively comparing various algorithms, which provided a new approach to the prediction and prevention of hypertension.
Funding
This work was supported by the National Key Research and Development Program of China [No. 2018YFC0116900], the National Natural Science Foundation of China (NSFC) [No. 61876194], the Key Research and Development Program of Guangdong Province, China [No. 2018B010109006], the Science and Technology Innovation Special Project of Guangdong Province, China [No. 202011020004], and the Natural Science Foundation of Guangdong Province, China [No. 2021A1515011897].
Publisher's note
All claims expressed in this article are solely those of the authors and do not necessarily represent those of their affiliated organizations, or those of the publisher, the editors and the reviewers. Any product that may be evaluated in this article, or claim that may be made by its manufacturer, is not guaranteed or endorsed by the publisher.
Statements
Data availability statement
The original contributions presented in the study are included in the article/Supplementary materials, further inquiries can be directed to the corresponding authors.
Ethics statement
The studies involving human participants were reviewed and approved by this study was conducted in accordance with the principles outlined in the Helsinki Declaration and was approved by the Ethics Committee and Institutional Review Committee of the Xinjiang Uygur Autonomous Region Center for Disease Control and Prevention. The patients/participants provided their written informed consent to participate in this study.
Author contributions
YiZ and YW conceived the study. WJ and YuZ collected the data. WJ and YC performed the statistical analyses. WJ and YuZ drafted the manuscript. YiZ critically reviewed and edited the manuscript. All authors contributed to data analysis, drafting, and revising of the article, gave final approval of the version to be published, agreed on the journal to which the article has been submitted, and agree to be accountable for all aspects of the work.
Acknowledgments
Thanks to the health commission of Xinjiang Uygur Autonomous Region and the Health Management Institute of Xinjiang Medical University for data support. Thanks to all the participants for their help.
Conflict of interest
The authors declare that the research was conducted in the absence of any commercial or financial relationships that could be construed as a potential conflict of interest.
Supplementary material
The Supplementary Material for this article can be found online at: https://www.frontiersin.org/articles/10.3389/fcvm.2022.928948/full#supplementary-material
References
1.
NCD Risk Factor Collaboration (NCD-RisC) . Worldwide trends in blood pressure from 1975 to 2015: a pooled analysis of 1479 population-based measurement studies with 19·1 million participants. Lancet. (2017) 389:37–55. 10.1016/S0140-6736(16)31919-5
2.
Olsen MH Angell SY Asma S Boutouyrie P Burger D Chirinos JA et al . A call to action and a lifecourse strategy to address the global burden of raised blood pressure on current and future generations: the Lancet Commission on hypertension. Lancet. (2016) 388:2665–712. 10.1016/S0140-6736(16)31134-5
3.
NCD Risk Factor Collaboration (NCD-RisC) . Worldwide trends in hypertension prevalence and progress in treatment and control from 1990 to 2019: a pooled analysis of 1201 population-representative studies with 104 million participants. Lancet. (2021) 398:957–80. 10.1016/S0140-6736(21)01330-1
4.
Li W Gu H Teo KK Bo J Wang Y Yang J et al . Hypertension prevalence, awareness, treatment, and control in 115 rural and urban communities involving 47 000 people from China. J Hypertens. (2016) 34:39–46. 10.1097/HJH.0000000000000745
5.
Lewington S Lacey B Clarke R Guo Y Kong XL Yang L et al . The Burden of Hypertension and Associated Risk for Cardiovascular Mortality in China. JAMA Intern Med. (2016) 176:524–32. 10.1001/jamainternmed.2016.0190
6.
Li D Lv J Liu F Liu P Yang X Feng Y et al . Hypertension burden and control in mainland China: analysis of nationwide data 2003-2012. Int J Cardiol. (2015) 184:637–44. 10.1016/j.ijcard.2015.03.045
7.
Parikh NI Pencina MJ Wang TJ Benjamin EJ Lanier KJ Levy D et al . A risk score for predicting near-term incidence of hypertension: the Framingham Heart Study. Ann Intern Med. (2008) 148:102–10. 10.7326/0003-4819-148-2-200801150-00005
8.
Hajifathalian K Ueda P Lu Y Woodward M Ahmadvand A Aguilar-Salinas CA et al . A novel risk score to predict cardiovascular disease risk in national populations (Globorisk): a pooled analysis of prospective cohorts and health examination surveys. Lancet Diabetes Endocrinol. (2015) 3:339–55. 10.1016/S2213-8587(15)00081-9
9.
Kivimäki M Batty GD Singh-Manoux A Ferrie JE Tabak AG Jokela M et al . Validating the Framingham hypertension risk score: results from the Whitehall II study. Hypertension. (2009) 54:496–501. 10.1161/HYPERTENSIONAHA.109.132373
10.
Muntner P Woodward M Mann DM Shimbo D Michos ED Blumenthal RS et al . Comparison of the framingham heart study hypertension model with blood pressure alone in the prediction of risk of hypertension: the multi-ethnic study of atherosclerosis. Hypertension. (2010) 55:1339–45. 10.1161/HYPERTENSIONAHA.109.149609
11.
Zheng L Sun Z Zhang X Li J Hu D Chen J et al . Predictive value for the rural Chinese population of the Framingham hypertension risk model: results from Liaoning Province. Am J Hypertens. (2014) 27:409–14. 10.1093/ajh/hpt229
12.
Niu M Wang Y Zhang L Tu R Liu X Hou J et al . Identifying the predictive effectiveness of a genetic risk score for incident hypertension using machine learning methods among populations in rural China. Hypertens Res. (2021) 44:1483–91. 10.1038/s41440-021-00738-7
13.
Chen Y Wang C Liu Y Yuan Z Zhang W Li X et al . Incident hypertension and its prediction model in a prospective northern urban Han Chinese Cohort Study. J Hum Hypertens. (2016) 30:794–800. 10.1038/jhh.2016.23
14.
Du M Yin S Wang P Wang X Wu J Xue M et al . Self-reported hypertension in Northern China: a cross-sectional study of a risk prediction model and age trends. BMC Health Serv Res. (2018) 18:475. 10.1186/s12913-018-3279-3
15.
Xu F Zhu J Sun N Wang L Xie C Tang Q et al . Development and validation of prediction models for hypertension risks in rural Chinese populations. J Glob Health. (2019) 9:020601. 10.7189/jogh.09.020601
16.
Ren Z Rao B Xie S Li A Wang L Cui G et al . A novel predicted model for hypertension based on a large cross-sectional study. Sci Rep. (2020) 10:10615. 10.1038/s41598-020-64980-8
17.
Churpek MM Yuen TC Winslow C Meltzer DO Kattan MW Edelson DP . Multicenter comparison of machine learning methods and conventional regression for predicting clinical deterioration on the wards. Crit Care Med. (2016) 44:368–74. 10.1097/CCM.0000000000001571
18.
Goldstein BA Navar AM Carter RE . Moving beyond regression techniques in cardiovascular risk prediction: applying machine learning to address analytic challenges. Eur Heart J. (2017) 38:1805–14. 10.1093/eurheartj/ehw302
19.
Selker HP Griffith JL Patil S Long WJ D'Agostino RB . A comparison of performance of mathematical predictive methods for medical diagnosis: identifying acute cardiac ischemia among emergency department patients. J Investig Med. (1995) 43:468–76.
20.
Wade NJ . Chapter 32: sensory and perceptual disorders. Handb Clin Neurol. (2010) 95:489–500. 10.1016/S0072-9752(08)02132-5
21.
Choi SB Kim WJ Yoo TK Park JS Chung JW Lee YH et al . Screening for prediabetes using machine learning models. Comput Math Methods Med. (2014) 2014:618976. 10.1155/2014/618976
22.
Christodoulou E Ma J Collins GS Steyerberg EW Verbakel JY Van Calster B et al . systematic review shows no performance benefit of machine learning over logistic regression for clinical prediction models. J Clin Epidemiol. (2019) 110:12–22. 10.1016/j.jclinepi.2019.02.004
23.
Nusinovici S Tham YC Chak Yan MY Wei Ting DS Li J Sabanayagam C et al . Logistic regression was as good as machine learning for predicting major chronic diseases. J Clin Epidemiol. (2020) 122:56–69. 10.1016/j.jclinepi.2020.03.002
24.
Sakr S Elshawi R Ahmed A Qureshi WT Brawner C Keteyian S et al . Using machine learning on cardiorespiratory fitness data for predicting hypertension: The Henry Ford ExercIse Testing (FIT) Project. PLoS ONE. (2018) 13:e0195344. 10.1371/journal.pone.0195344
25.
Lafreniere D Zulkernine F Barber D Martin K . Using machine learning to predict hypertension from a clinical dataset.2016 IEEE Symposium Series on Computational Intelligence (SSCI) IEEE. (2016).
26.
Kublanov VS Dolganov AY Belo D Gamboa H . Comparison of machine learning methods for the arterial hypertension diagnostics. Appl Bionics Biomech. (2017) 2017:5985479. 10.1155/2017/5985479
27.
Liu J Sun D Chen L Fang Z Song W Guo D et al . Radiomics analysis of dynamic contrast-enhanced magnetic resonance imaging for the prediction of sentinel lymph node metastasis in breast cancer. Front Oncol. (2019) 9:980. 10.3389/fonc.2019.00980
28.
Lee BJ Ku B Nam J Pham DD Kim JY . Prediction of fasting plasma glucose status using anthropometric measures for diagnosing type 2 diabetes. IEEE J Biomed Health Inform. (2014) 18:555–61. 10.1109/JBHI.2013.2264509
29.
Yu H Yang X Zheng S Sun C . Active learning from imbalanced data: a solution of online weighted extreme learning machine. IEEE Trans Neural Netw Learn Syst. (2019) 30:1088–103. 10.1109/TNNLS.2018.2855446
30.
Chawla NV Bowyer KW Hall LO Kegelmeyer WP . SMOTE Synthetic Minority Over-Sampling Technique. J Artificial Intelligence Res. (2002) 16:321–57. 10.1613/jair.953
31.
Wang KJ Adrian AM Chen KH Wang KM . A hybrid classifier combining Borderline-SMOTE with AIRS algorithm for estimating brain metastasis from lung cancer: a case study in Taiwan. Comput Methods Programs Biomed. (2015) 119:63–76. 10.1016/j.cmpb.2015.03.003
32.
Breiman L . Random forests, machine learning 45. J Clin Microbiol. (2001) 2:199–228. 10.1023/A:1010933404324
33.
Freund Y Schapire R E A . Decision-Theoretic generalization of on-line learning and an application to boosting. J Computer Sys Sci. (1997). 55, 1:119–39. 10.1006/jcss.1997.1504
34.
Eladia María P. Ale Hampl J Havel . Artificial neural networks in medical diagnosis. J Applied Biomed. (2013) 11:47–58. 10.2478/v10136-012-0031-x
35.
Dugan TM Mukhopadhyay S Carroll A Downs S . Machine learning techniques for prediction of early childhood obesity. Appl Clin Inform. (2015) 6:506–20. 10.4338/ACI-2015-03-RA-0036
36.
Bagley SC White H Golomb BA . Logistic regression in the medical literature: standards for use and reporting, with particular attention to one medical domain. J Clin Epidemiol. (2001) 54:979–85. 10.1016/s0895-4356(01)00372-9
37.
Mahmoudian M Venäläinen MS Klén R Elo LL . Stable iterative variable selection. Bioinformatics. (2021) 37:4810–7. 10.1093/bioinformatics/btab501
38.
Wang Z Chen Z Zhang L Wang X Hao G Zhang Z et al . Status of hypertension in China: results from the China Hypertension survey, 2012-2015. Circulation. (2018) 137:2344–56. 10.1161/CIRCULATIONAHA.117.032380
39.
Lu J Lu Y Wang X Li X Linderman GC Wu C et al . Prevalence, awareness, treatment, and control of hypertension in China: data from 1·7 million adults in a population-based screening study (China PEACE Million Persons Project). Lancet. (2017) 390:2549–58. 10.1016/S0140-6736(17)32478-9
40.
Carson AP Lewis CE Jacobs DR Jr Peralta CA Steffen LM Bower JK et al . Evaluating the Framingham hypertension risk prediction model in young adults: the Coronary Artery Risk Development in Young Adults (CARDIA) study. Hypertension. (2013) 62:1015–20. 10.1161/HYPERTENSIONAHA.113.01539
41.
Xu Y Liu J Wang J Fan Q Luo Y Zhan H et al . Establishment and verification of a nomogram prediction model of hypertension risk in Xinjiang Kazakhs. Medicine (Baltimore). (2021) 100:e27600. 10.1097/MD.0000000000027600
42.
Cogswell R Kobashigawa E McGlothlin D Shaw R De Marco T . Validation of the Registry to Evaluate Early and Long-Term Pulmonary Arterial Hypertension Disease Management (REVEAL) pulmonary hypertension prediction model in a unique population and utility in the prediction of long-term survival. J Heart Lung Transplant. (2012) 31:1165–70. 10.1016/j.healun.2012.08.009
43.
Kanegae H Suzuki K Fukatani K Ito T Harada N Kario K . Highly precise risk prediction model for new-onset hypertension using artificial intelligence techniques. J Clin Hypertens (Greenwich). (2020) 22:445–50. 10.1111/jch.13759
44.
Kanegae H Oikawa T Suzuki K Okawara Y Kario K . Developing and validating a new precise risk-prediction model for new-onset hypertension: the Jichi Genki hypertension prediction model (JG model). J Clin Hypertens (Greenwich). (2018) 20:880–90. 10.1111/jch.13270
45.
Qi H Liu Z Liu B Cao H Sun W Yan Y et al . micro-RNA screening and prediction model construction for diagnosis of salt-sensitive essential hypertension. Medicine (Baltimore). (2017) 96:e6417. 10.1097/MD.0000000000006417
46.
Cogswell R Pritzker M De Marco T . Performance of the REVEAL pulmonary arterial hypertension prediction model using non-invasive and routinely measured parameters. J Heart Lung Transplant. (2014) 33:382–7. 10.1016/j.healun.2013.12.015
47.
Qin L Zhang Y Yang X Wang H . Development of the prediction model for hypertension in patients with idiopathic inflammatory myopathies. J Clin Hypertens (Greenwich). (2021) 23:1556–66. 10.1111/jch.14267
48.
Gillis EE Sullivan JC . Sex differences in hypertension: recent advances. Hypertension. (2016) 68:1322–7. 10.1161/HYPERTENSIONAHA.116.06602
49.
Di Pilla M Bruno RM Taddei S Virdis A . Gender differences in the relationships between psychosocial factors and hypertension. Maturitas. (2016) 93:58–64. 10.1016/j.maturitas.2016.06.003
50.
Bruno RM Pucci G Rosticci M Guarino L Guglielmo C Agabiti Rosei C et al . Association between lifestyle and systemic arterial hypertension in young adults: a national, survey-based, cross-sectional study. High Blood Press Cardiovasc Prev. (2016) 23:31–40. 10.1007/s40292-016-0135-6
51.
Yanes LL Reckelhoff JF . Postmenopausal hypertension. Am J Hypertens. (2011) 24:740–9. 10.1038/ajh.2011.71
52.
Roger VL Go AS Lloyd-Jones DM Benjamin EJ Berry JD Borden WB et al . Heart disease and stroke statistics−2012 update: a report from the American Heart Association. Circulation. (2012) 125:e2–e220. 10.1161/CIR.0b013e31823ac046
53.
Gu Q Burt VL Paulose-Ram R Dillon CF . Gender differences in hypertension treatment, drug utilization patterns, and blood pressure control among US adults with hypertension: data from the National Health and Nutrition Examination Survey 1999-2004. Am J Hypertens. (2008) 21:789–98. 10.1038/ajh.2008.185
54.
Joint Committee for Guideline Revision . 2018 Chinese Guidelines for Prevention and Treatment of Hypertension-A report of the Revision Committee of Chinese Guidelines for Prevention and Treatment of Hypertension. J Geriatr Cardiol. (2019) 16:182–241. 10.11909/j.issn.1671-5411.2019.03.014
55.
Sun Z Zheng L Zhang X Li J Hu D Sun Y . Ethnic differences in the incidence of hypertension among rural Chinese adults: results from Liaoning Province. PLoS ONE. (2014) 9:e86867. 10.1371/journal.pone.0086867
56.
Heizhati M Wang L Yao X Li M Hong J Luo Q et al . Prevalence, awareness, treatment and control of hypertension in various ethnic groups (Hui, Kazakh, Kyrgyz, Mongolian, Tajik) in Xinjiang, Northwest China. Blood Press. (2020) 29:276–84. 10.1080/08037051.2020.1745055
57.
Paynter NP Cook NR Everett BM Sesso HD Buring JE Ridker PM . Prediction of incident hypertension risk in women with currently normal blood pressure. Am J Med. (2009) 122:464–71. 10.1016/j.amjmed.2008.10.034
58.
Organization W H . A Global Brief on Hypertension: Silent Killer, Global Public Health Crisis: World Health Day 2013. World Health Organization. (2013).
59.
Kautzky-Willer A Dorner T Jensby A Rieder A . Women show a closer association between educational level and hypertension or diabetes mellitus than males: a secondary analysis from the Austrian HIS. BMC Public Health. (2012) 12:392. 10.1186/1471-2458-12-392
60.
Tedesco MA Di Salvo G Caputo S Natale F Ratti G Iarussi D et al . Educational level and hypertension: how socioeconomic differences condition health care. J Hum Hypertens. (2001) 15:727–31. 10.1038/sj.jhh.1001249
61.
Duarte CD Wannier SR Cohen AK Glymour MM Ream RK Yen IH et al . Lifecourse educational trajectories and hypertension in midlife: an application of sequence analysis. J Gerontol A Biol Sci Med Sci. (2022) 77:383–91. 10.1093/gerona/glab249
62.
Santisteban MM Iadecola C . Hypertension, dietary salt and cognitive impairment. J Cereb Blood Flow Metab. (2018) 38:2112–28. 10.1177/0271678X18803374
63.
Grossman A Grossman E . Blood pressure control in type 2 diabetic patients. Cardiovasc Diabetol. (2017) 16:3. 10.1186/s12933-016-0485-3
64.
Yano Y Kario K . Nocturnal blood pressure, morning blood pressure surge, and cerebrovascular events. Curr Hypertens Rep. (2012) 14:219–27. 10.1007/s11906-012-0261-z
65.
Deng X Hou H Wang X Li Q Li X Yang Z et al . Development and validation of a nomogram to better predict hypertension based on a 10-year retrospective cohort study in China. Elife. (2021) 10:e66419. 10.7554/eLife.66419
66.
Katagiri H Yamada T Oka Y . Adiposity and cardiovascular disorders: disturbance of the regulatory system consisting of humoral and neuronal signals. Circ Res. (2007) 101:27–39. 10.1161/CIRCRESAHA.107.151621
67.
Oda E . Metabolic syndrome: its history, mechanisms, and limitations. Acta Diabetol. (2012) 49:89–95. 10.1007/s00592-011-0309-6
68.
Halliwell B . Albumin–an important extracellular antioxidant?Biochem Pharmacol. (1988) 37:569–71. 10.1016/0006-2952(88)90126-8
69.
Oda E . Decreased serum albumin predicts hypertension in a Japanese health screening population. Intern Med. (2014) 53:655–60. 10.2169/internalmedicine.53.1894
70.
Nilsson PM . Blood glucose and hypertension development: the hen and egg controversy. J Hypertens. (2019) 37:11–2. 10.1097/HJH.0000000000001946
71.
Tatsumi Y Morimoto A Asayama K Sonoda N Miyamatsu N Ohno Y et al . Fasting blood glucose predicts incidence of hypertension independent of HbA1c levels and insulin resistance in middle-aged Japanese: the Saku study. Am J Hypertens. (2019) 32:1178–85. 10.1093/ajh/hpz123
72.
Murabito JM Nam BH D'Agostino RB Sr Lloyd-Jones DM O'Donnell CJ Wilson PW . Accuracy of offspring reports of parental cardiovascular disease history: the Framingham Offspring Study. Ann Intern Med. (2004) 140:434–40. 10.7326/0003-4819-140-6-200403160-00010
Summary
Keywords
hypertension, machine learning, prediction model, classifier, LASSO
Citation
Ji W, Zhang Y, Cheng Y, Wang Y and Zhou Y (2022) Development and validation of prediction models for hypertension risks: A cross-sectional study based on 4,287,407 participants. Front. Cardiovasc. Med. 9:928948. doi: 10.3389/fcvm.2022.928948
Received
26 April 2022
Accepted
29 August 2022
Published
26 September 2022
Volume
9 - 2022
Edited by
Guido Iaccarino, University of Naples Federico II, Italy
Reviewed by
Gaetano Santulli, Albert Einstein College of Medicine, United States; Hao Tian, Southern Methodist University, United States
Updates
Copyright
© 2022 Ji, Zhang, Cheng, Wang and Zhou.
This is an open-access article distributed under the terms of the Creative Commons Attribution License (CC BY). The use, distribution or reproduction in other forums is permitted, provided the original author(s) and the copyright owner(s) are credited and that the original publication in this journal is cited, in accordance with accepted academic practice. No use, distribution or reproduction is permitted which does not comply with these terms.
*Correspondence: Yushan Wang wangyus8877@163.comYi Zhou zhouyi@mail.sysu.edu.cn
†These authors have contributed equally to this work
This article was submitted to Hypertension, a section of the journal Frontiers in Cardiovascular Medicine
Disclaimer
All claims expressed in this article are solely those of the authors and do not necessarily represent those of their affiliated organizations, or those of the publisher, the editors and the reviewers. Any product that may be evaluated in this article or claim that may be made by its manufacturer is not guaranteed or endorsed by the publisher.