Abstract
Circulating endothelial progenitor cells (EPCs) play an important role in the repair processes of damaged vessels, favoring re-endothelization of stented vessels to minimize restenosis. EPCs number and function is diminished in patients with type 2 diabetes, a known risk factor for restenosis. Considering the impact of EPCs in vascular injury repair, we conducted a meta-analysis of microarray to assess the transcriptomic profile and determine target genes during the differentiation process of EPCs into mature ECs. Five microarray datasets, including 13 EPC and 12 EC samples were analyzed, using the online tool ExpressAnalyst. Differentially expressed genes (DEGs) analysis was done by Limma method, with an | log2FC| > 1 and FDR < 0.05. Combined p-value by Fisher exact method was computed for the intersection of datasets. There were 3,267 DEGs, 1,539 up-regulated and 1,728 down-regulated in EPCs, with 407 common DEGs in at least four datasets. Kyoto Encyclopedia of Genes and Genomes (KEGG) analysis showed enrichment for terms related to “AGE-RAGE signaling pathway in diabetic complications.” Intersection of common DEGs, KEGG pathways genes and genes in protein-protein interaction network (PPI) identified four key genes, two up-regulated (IL1B and STAT5A) and two down-regulated (IL6 and MAPK11). MicroRNA enrichment analysis of common DEGs depicted five hub microRNA targeting 175 DEGs, including STAT5A, IL6 and MAPK11, with hsa-miR-124 as common regulator. This group of genes and microRNAs could serve as biomarkers of EPCs differentiation during coronary stenting as well as potential therapeutic targets to improve stent re-endothelization, especially in diabetic patients.
Introduction
Circulating endothelial progenitor cells (EPCs) are a heterogeneous group of circulatory cells that play an important role in the repair processes in damaged tissues (1). EPCs are mobilized from the bone marrow into the circulation in response to tissue damage (2) and have the capacity to home to injured blood vessels and differentiate in mature endothelial cells (ECs) (3).
In the context of acute coronary syndrome treated with percutaneous coronary intervention (PCI) there is a profound damage of the vascular wall (4). Coronary stenting results in clinical or subclinical neointima formation with stent restenosis in about 30% of patients (5). Coronary stenting cause a burst of EPCs within 24 h when comparing to balloon angioplasty (6). Drug eluting stents (DES) avoid neointima formation by vascular smooth muscle cells, but also target ECs, limiting stent re-endothelization and favoring in-stent restenosis and thrombosis (7).
EPCs have been extensively investigated for their capacity to modulate neointimal formation in PCI (8). Recruiting EPCs into the stent with CD34 + (9) or CD133 + (10) antibodies promote early re-endothelization while reducing the risk of stent thrombosis and in-stent restenosis (11) when comparing with bare metal stents (BMS) (12).
Reduction of EPCs has been proposed as a novel mechanism of cardiovascular disease in type 2 diabetes. In comparison with normoglycemic patients, diabetic patients have a significant reduction of EPCs number and function with increased apoptosis (13). Another investigation described impaired number, migration, CXCR4 expression, and nitric oxide (NO) production in EPCs from diabetes patients and were further reduced in patients with coexisting coronary artery disease. The expression of CXCR4 and activation of Pi3K/Akt/eNOS signaling cascade were suppressed in cultured EPCs treated with hyperglycemia and oxidized LDL (14).
A recent meta-analysis showed that lower baseline EPCs count has been associated with a significantly greater occurrence of in-stent restenosis (HR 1.33; 95% CI 0.97–1.82, P = 0.045). Nevertheless, in EPCs-capturing DES, target lesion revascularization was significantly more common than with standard DES (15).
Considering the theoretical and practical impact of EPCs in vascular injury repair, we conducted a meta-analysis of microarray to assess the transcriptomic profile and determine targets genes during the differentiation process of EPC into mature EC.
Materials and methods
Data compilation and processing
We queried the Gene Expression Omnibus (GEO) repository using the following terms: “endothelial progenitor” [All Fields] AND “Homo sapiens” [porgn: txid9606] AND “Expression profiling by array” [Filter]. Datasets were manually curated to select those studies comparing EPCs and ECs. Five datasets: GSE25979, GSE20283, GSE46328, GSE2040, and GSE54969 were selected for further processing (Table 1). Only samples of interest were included, excluding cells subjected to any treatment. Three studies used Affimetrix array and two used Illumina platform. Thirteen samples of early EPCs and twelve samples of ECs were included. Individual datasets were analyzed with G2R online tool (16).
TABLE 1
| GEO accession number | Platform | Total genes | EPCs/ ECs |
| GSE25979 | Affymetrix Human Exon 1.0 ST Array | 22,011 | 3/4 |
| GSE20283 | Illumina HumanWG-6 v3.0 expression BeadChip | 21,815 | 3/1 |
| GSE46328 | Illumina HumanHT-12 V3.0 expression BeadChip | 48,803 | 2/2 |
| GSE2040 | Affymetrix Human Genome U95 version 2 Array | 12,554 | 3/3 |
| GSE54969 | Affymetrix Human Gene 1.0 ST Array | 33,298 | 2/2 |
Gene expression omnibus (GEO) datasets used for this study.
EPCs, Circulating endothelial progenitor cells; ECs, Endothelial cells.
Assessment of differentially expressed genes
Meta-analysis of microarray was performed using the online tool ExpressAnalyst (17). Unprocessed data with array intensities were used as input and variance stabilizing normalization in combination with quantile normalization was performed (18). Study batch effect was adjusted using ComBat to compare information from different platforms (19). Differential expression analysis was done by Limma method, with an absolute log2FC > 1 (20). The cut-off p-values were adjusted using the Benjamini–Hochberg’s False Discovery Rate (FDR) < 0.05 (21). The combined p-value by Fisher exact method was computed for the intersection of datasets (22).
Functional enrichment analysis of differentially expressed genes
Functional enrichment analysis of DEGs [GO and Kyoto Encyclopedia of Genes and Genomes (KEGG)] was carried out using KOBAS v3.0 (23); Fisher’s exact test was used to calculate p-values. The pathways with FDR ≤ 0.05 were defined as the significantly enriched pathways. DEGs in at least four databases were intersected with genes in principal pathways to select biologically significant genes (key genes).
Protein-protein interaction network construction
DEGs that were significantly dysregulated in four databases were included in the PPI. The online search tool STRING (24) was used to construct the network, setting a combined score of ≥ 0.7. Cytoscape v3.7.2 was used to visualize the PPI network, and significant enriched interactions were selected by CytoHubba using maximum clique centrality score (MCC) (25).
Micro ribonucleic acid enrichment analysis
We explored the microRNAs associated to our set of DEGs in TargetScan (26) and miRTarBase (27) databases, setting a threshold of minimum number of miRNA-target interactions > 2 and FDR < 0.05. The network was constructed in Cytoscape and intersected with the set of DEGs in at least four datasets. The key nodes were extracted by CytoHubba.
Results
Identification of differentially expressed genes in endothelial progenitor cells vs. mature endothelial cells
Preprocessed and normalized data were downloaded from the National Center for Biotechnology Information GEO website. Description of each dataset is available on Table 1. Two datasets were processed with Illumina platform and three datasets with Affimetrix. A total of 13 EPCs and 12 ECs samples were included for further analysis.
GEO2R tool analysis for DEGs between EPCs and ECs on each dataset is presented using volcano plots (Figures 1A–E). Significantly dysregulated genes were defined as absolute log2FC > 1.0 and adjusted p-value < 0.05. There were 2,881 DEGs in GSE25979 (1,715 down and 1,166 up-regulated); 3,151 DEGs in GSE20283 (1,670 down and 1,481 up-regulated); 3,867 DEGs in GSE46328 (2,199 down and 1,668 up-regulated); 919 DEGs in GSE2040 (513 down and 406 up-regulated); and 385 DEGs in GSE54969 (215 down and 170 up-regulated).
FIGURE 1
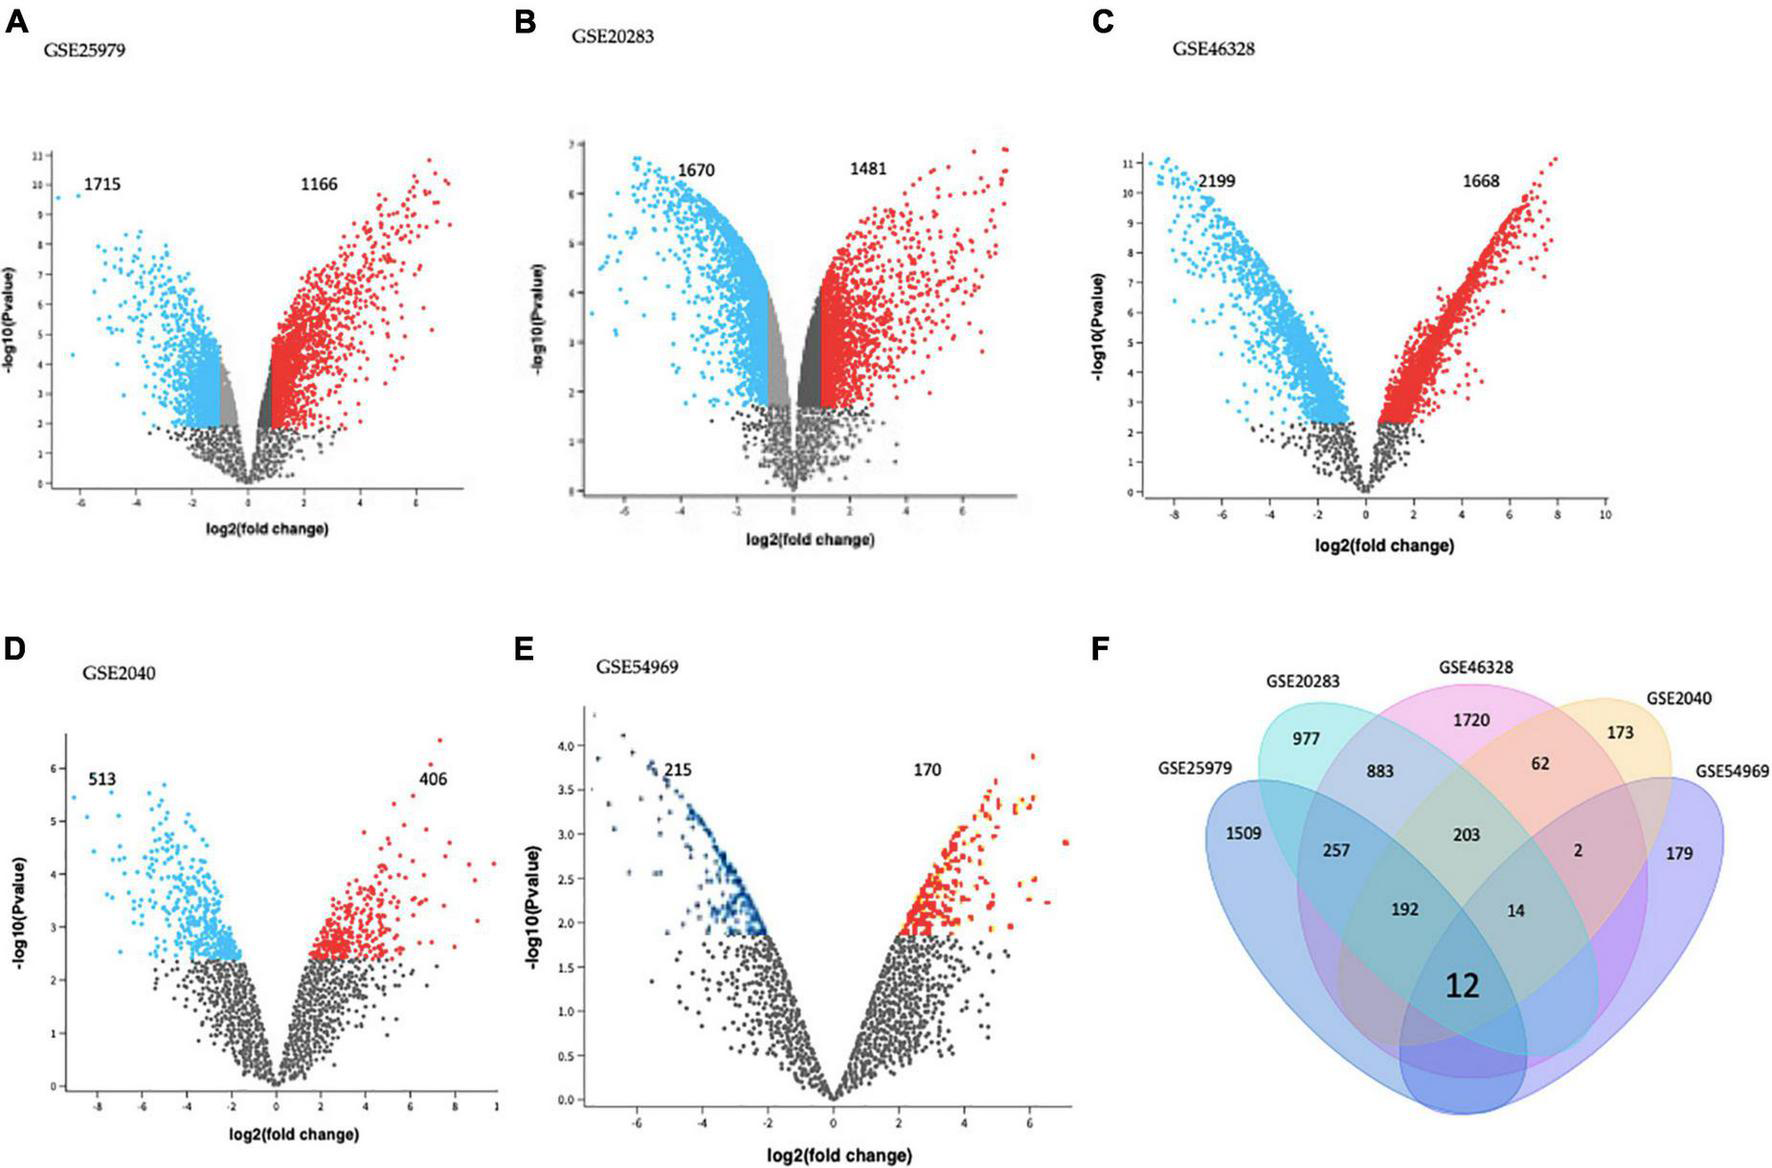
Differentially expressed genes (DEGs) on (A) GSE25979, (B) GSE20283, (C) GSE46328, (D) GSE2040, and (E) GSE54969 datasets. GEO2R online tool was used to identify DEGs for each dataset with | log2FC| > 1.0 and adjusted p-value < 0.05; red dots and blue dots represents the significantly down-regulated and up-regulated DEGs on EPCs, respectively. (F) Common DEGs before meta-analysis, by simple crossing each dataset, visualized through a Venn diagram. Twelve genes were dysregulated with the intersection of the five datasets.
Intersection of each dataset is shown in Figure 1F as a Venn diagram. Almost 63% of all DEGs were dysregulated in individual datasets. Only twelve genes were commonly dysregulated in all datasets.
Meta-analysis of microarrays was performed using the online tool ExpressAnalyst. Differential expression analysis was done by Limma method. The cut off p-values were adjusted using the Benjamini–Hochberg’s FDR < 0.05.
The combined p-value for the intersection of datasets was computed by Fisher exact method and DEGs surviving the analysis were plotted in a cord diagram. There were 38 common DEGs in the meta-analysis, 10 up-regulated and 28 down-regulated genes in EPCs (Figure 2).
FIGURE 2
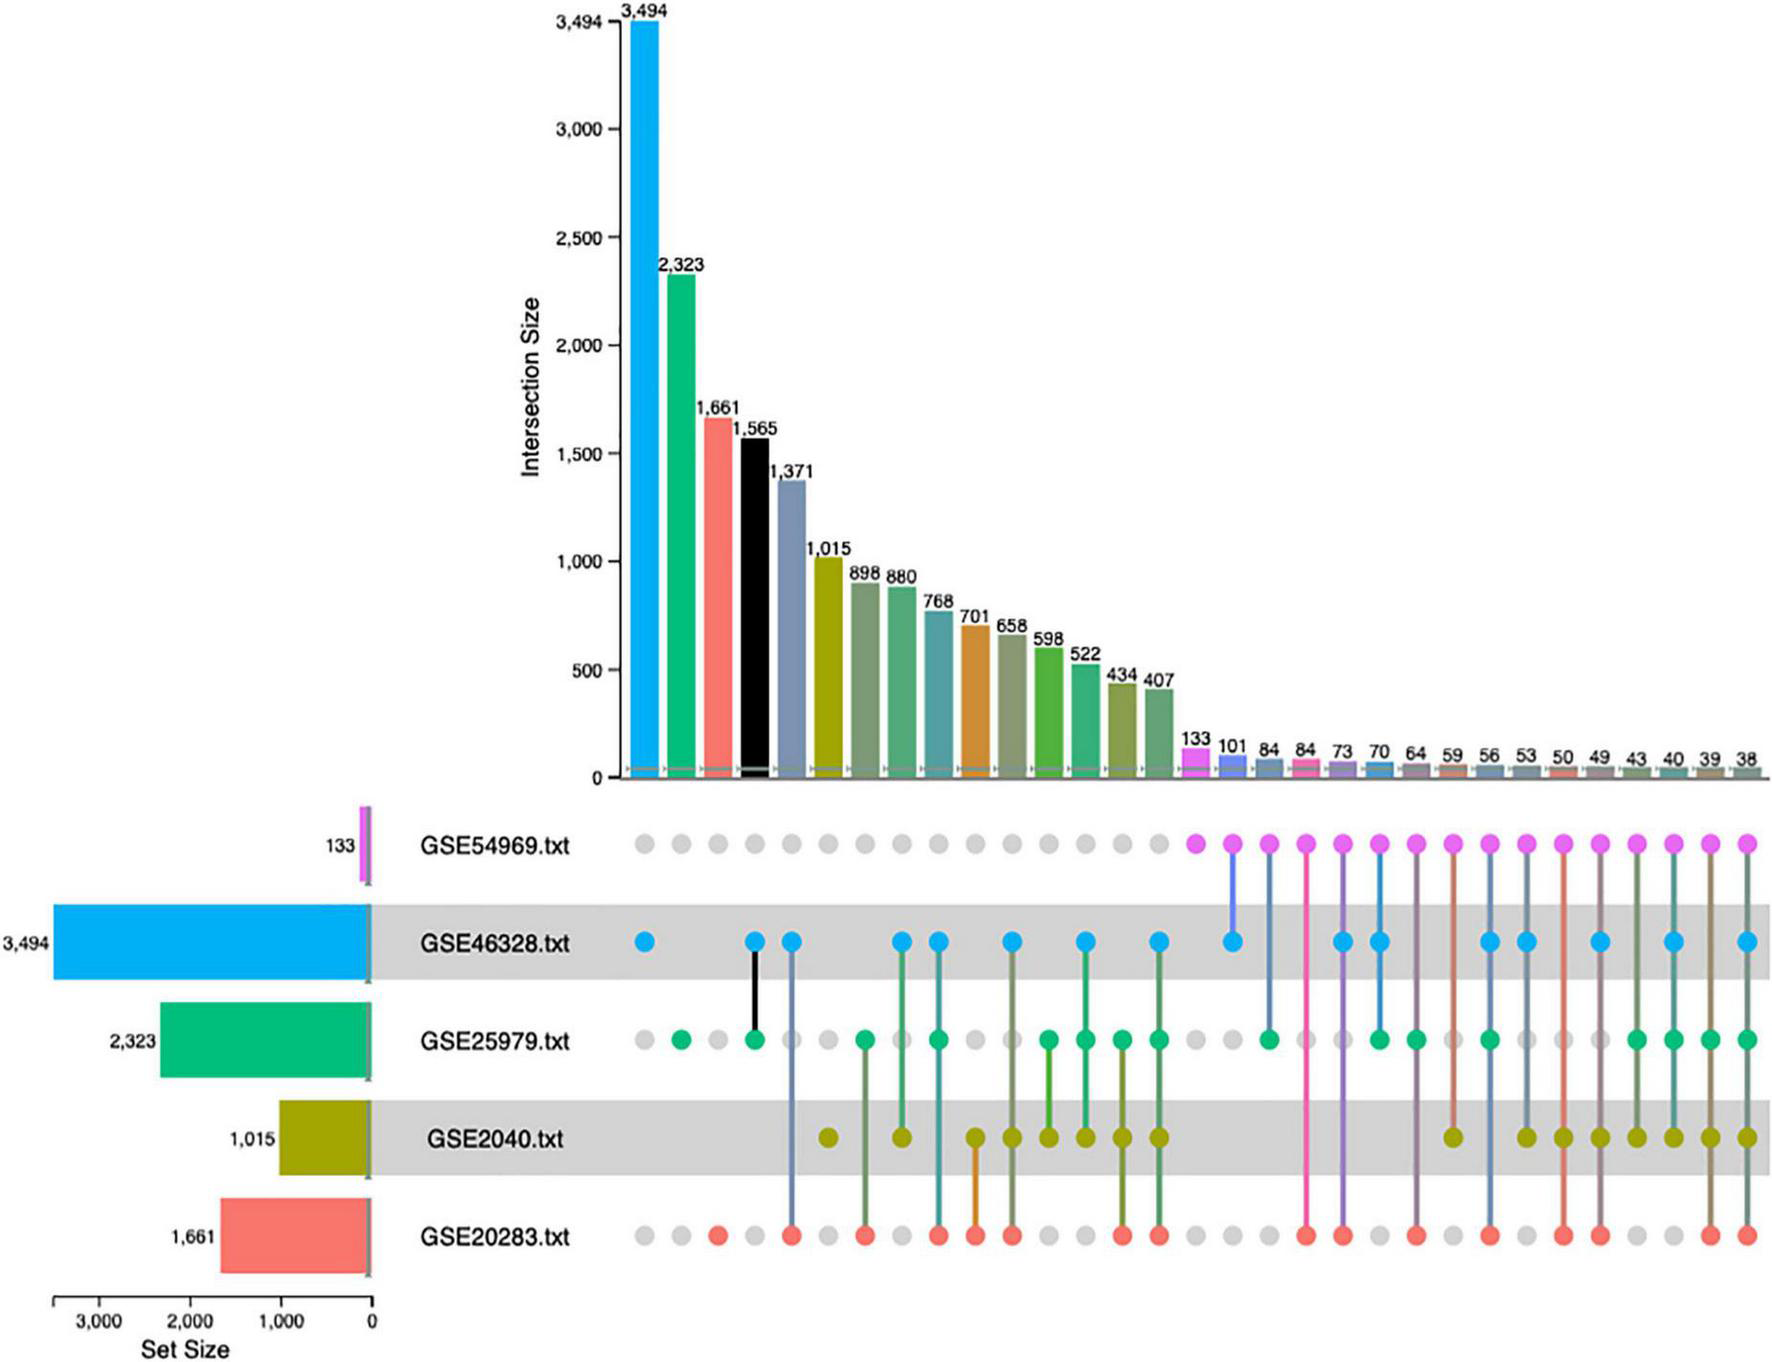
Up-set plot detailing the number of common elements among microarray datasets. Horizontal bars indicate the number of significant differentially expressed genes (DEGs) in each study. The vertical bars indicate the common elements in the sets, indicated with dots under each bar. The single points represent the number of unique elements in each group. There were 38 genes commonly dysregulated in the five datasets.
Top differentially expressed genes in the meta-analysis and functional annotation
The meta-analysis identified 3,267 DEGs (Supplementary Table 1), 1,539 up-regulated and 1,728 down-regulated in EPCs. Figure 3 shows the top 100 up-regulated (panel A) and the top 100 down-regulated genes (panel B), with a uniform expression level among cell type.
FIGURE 3
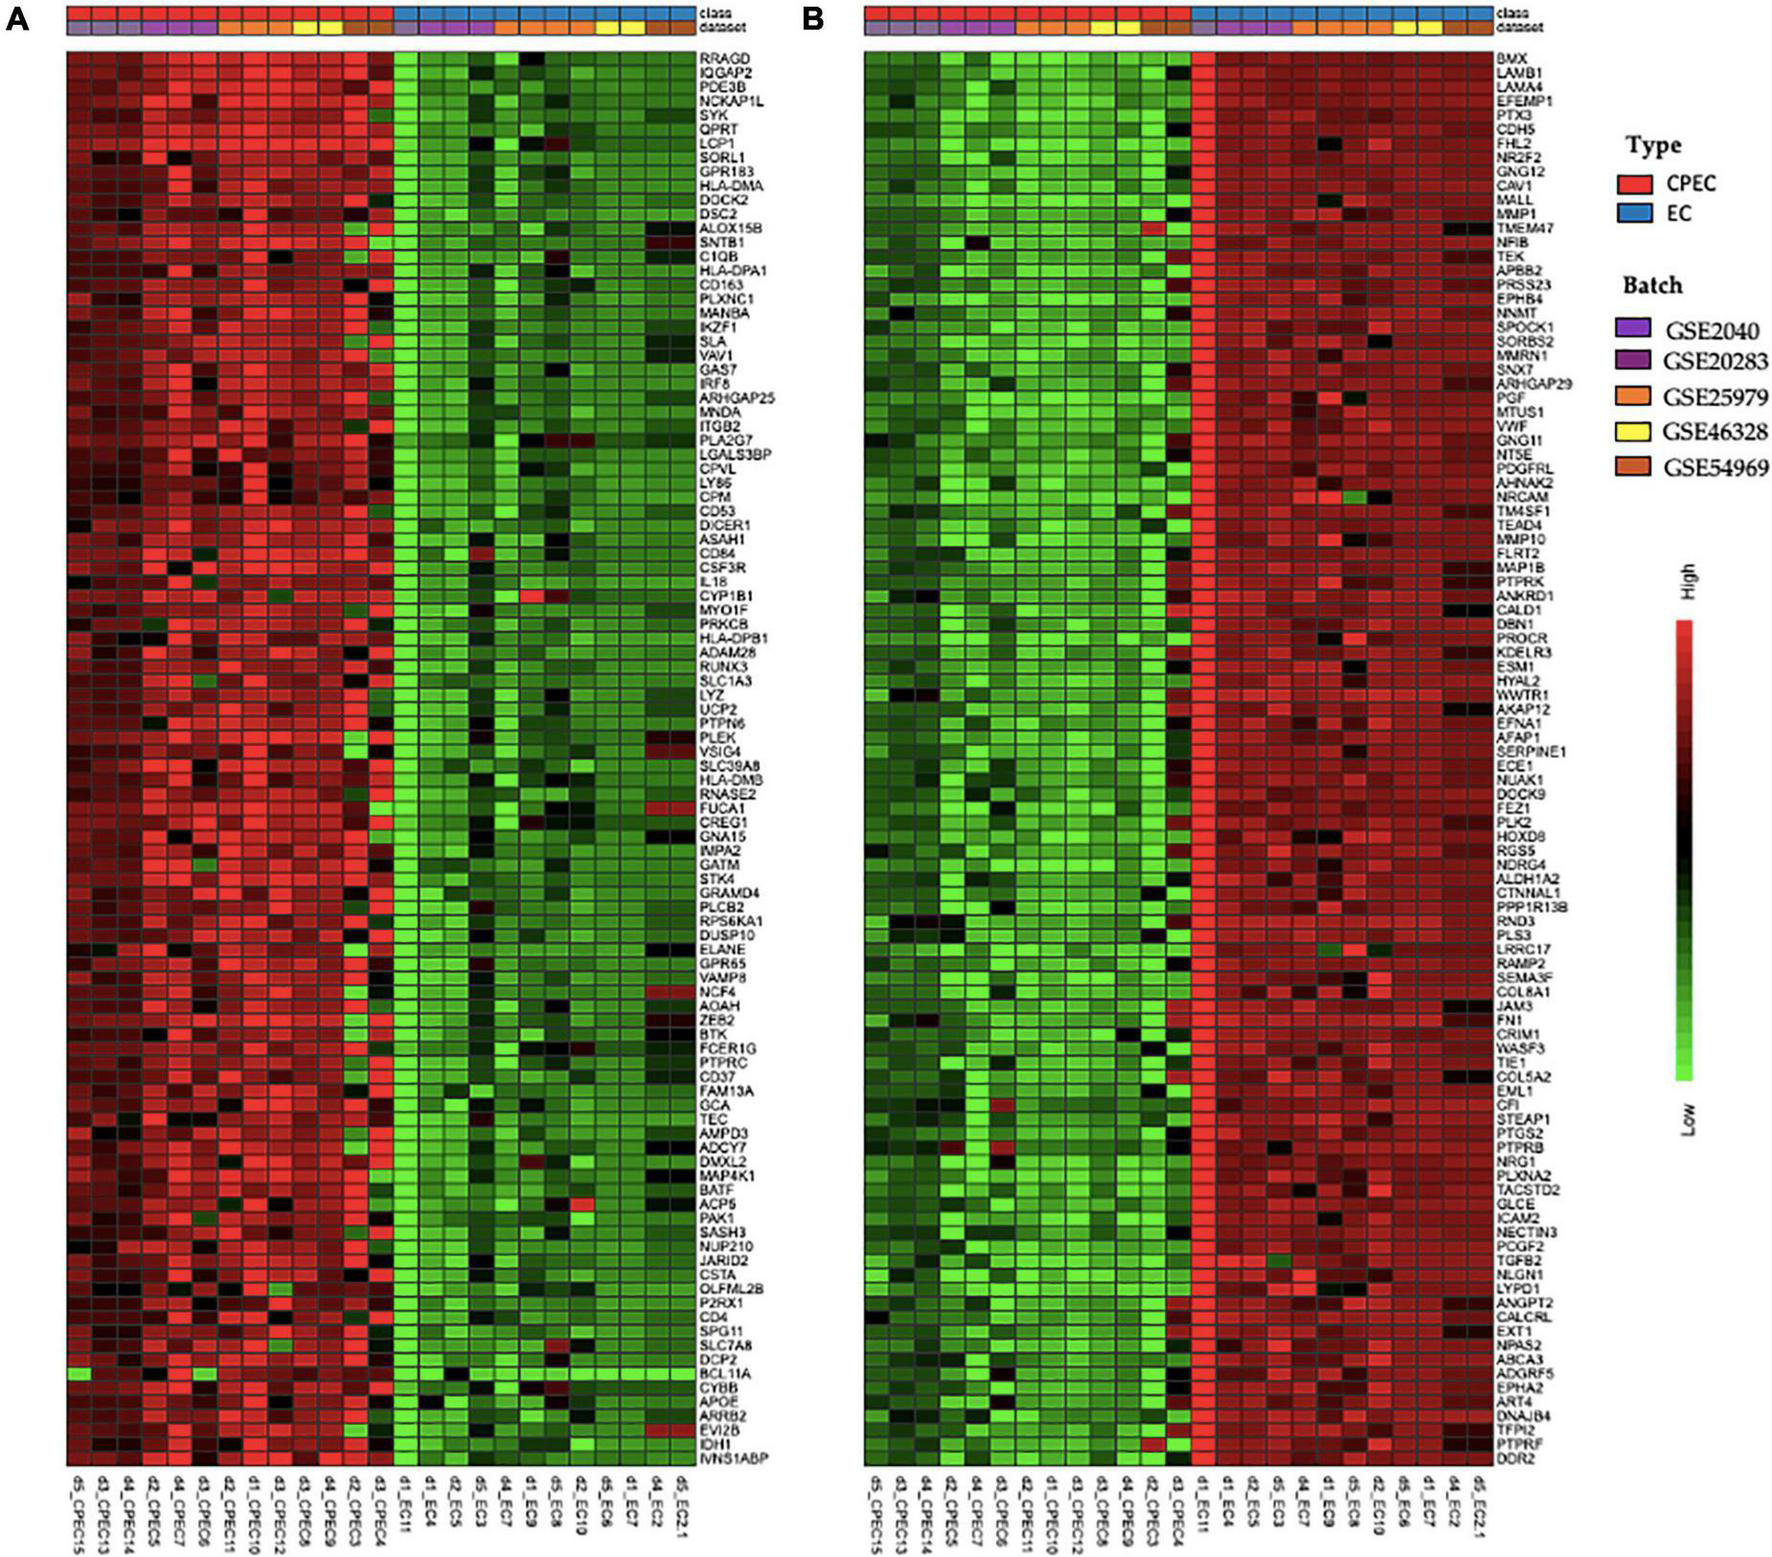
Hierarchical clustering of top 100 up-regulated DEGs (A) and top 100 down-regulated DEGs in EPCs (B). Green and red color represent z-score expression levels, light green is the lowest and dark red is the highest value. Samples were grouped by type (EPCs and ECs) and batch. Genes were clustered by Ward method.
GO analysis of DEGs (Figure 4A) shows significant enrichment for terms related to cell activation (GO: 0001775), regulation of immune system process (GO: 0002682), de-methylation (GO: 0070988). While analysis of KEGG terms (Figure 4B) showed significant enrichment of “PI3K-Akt signaling pathway,” “AGE-RAGE signaling pathway in diabetic complications” and “TNF signaling pathway,” among the principal functional pathways (Supplementary Table 2).
FIGURE 4
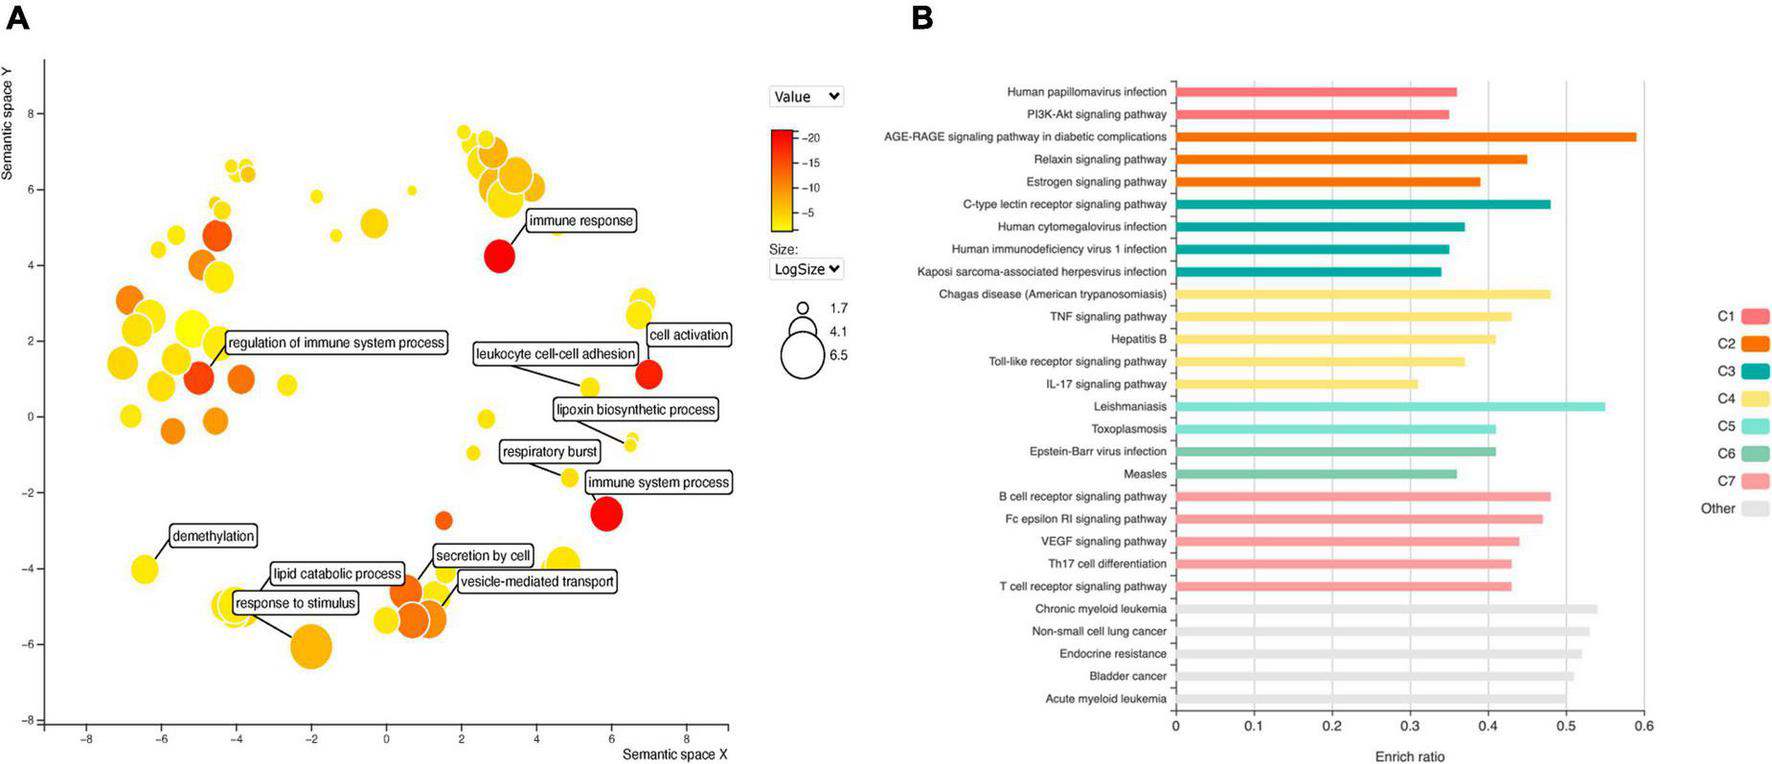
Gene ontology (GO) analysis (A) for DEGs in EPCs. Color intensity represents adjusted p-value, circle size the number or genes. The main biological processes are depicted in the graph. Functional enrichment of KEGG terms (B). Color represents clusters of DEGs and bar length the enrichment ratio.
Diabetes is one of the most important risk factors for stent restenosis; and advanced glycation end (AGE) products have a paramount importance in diabetes induced cardiovascular complications. Moreover, EPCs mobilization and homing are hampered in diabetic patients. Thus, we intersect top DEGs expressed in at least four datasets with genes overrepresented in the principal KEGG pathways, including “AGE-RAGE signaling pathway in diabetic complications”. We selected two up-regulated genes: IL1B and STAT5A; and two down-regulated: IL6 and MAPK11.
Protein-protein interaction network analysis
We conducted a PPI network analysis to explore the most significant clusters for 407 DEG. The STRING database version 11.5 was used to obtain significant interactions and resulting network was visualized in Cytoscape (Figure 5A). The MCC (maximum clique centrality) method from the CytoHubba app in Cytoscape was used to screen for key proteins (Figure 5B). There were 157 nodes, 234 edges and PPI enrichment p-value < 1.0e–16. The most connected hubs were HCK and VAV1 among up-regulated genes; and SHC1 and PLCG1 among down-regulated genes. The four selected genes (IL1B, STAT5A, IL6, and MAPK11) were also retained in this analysis.
FIGURE 5
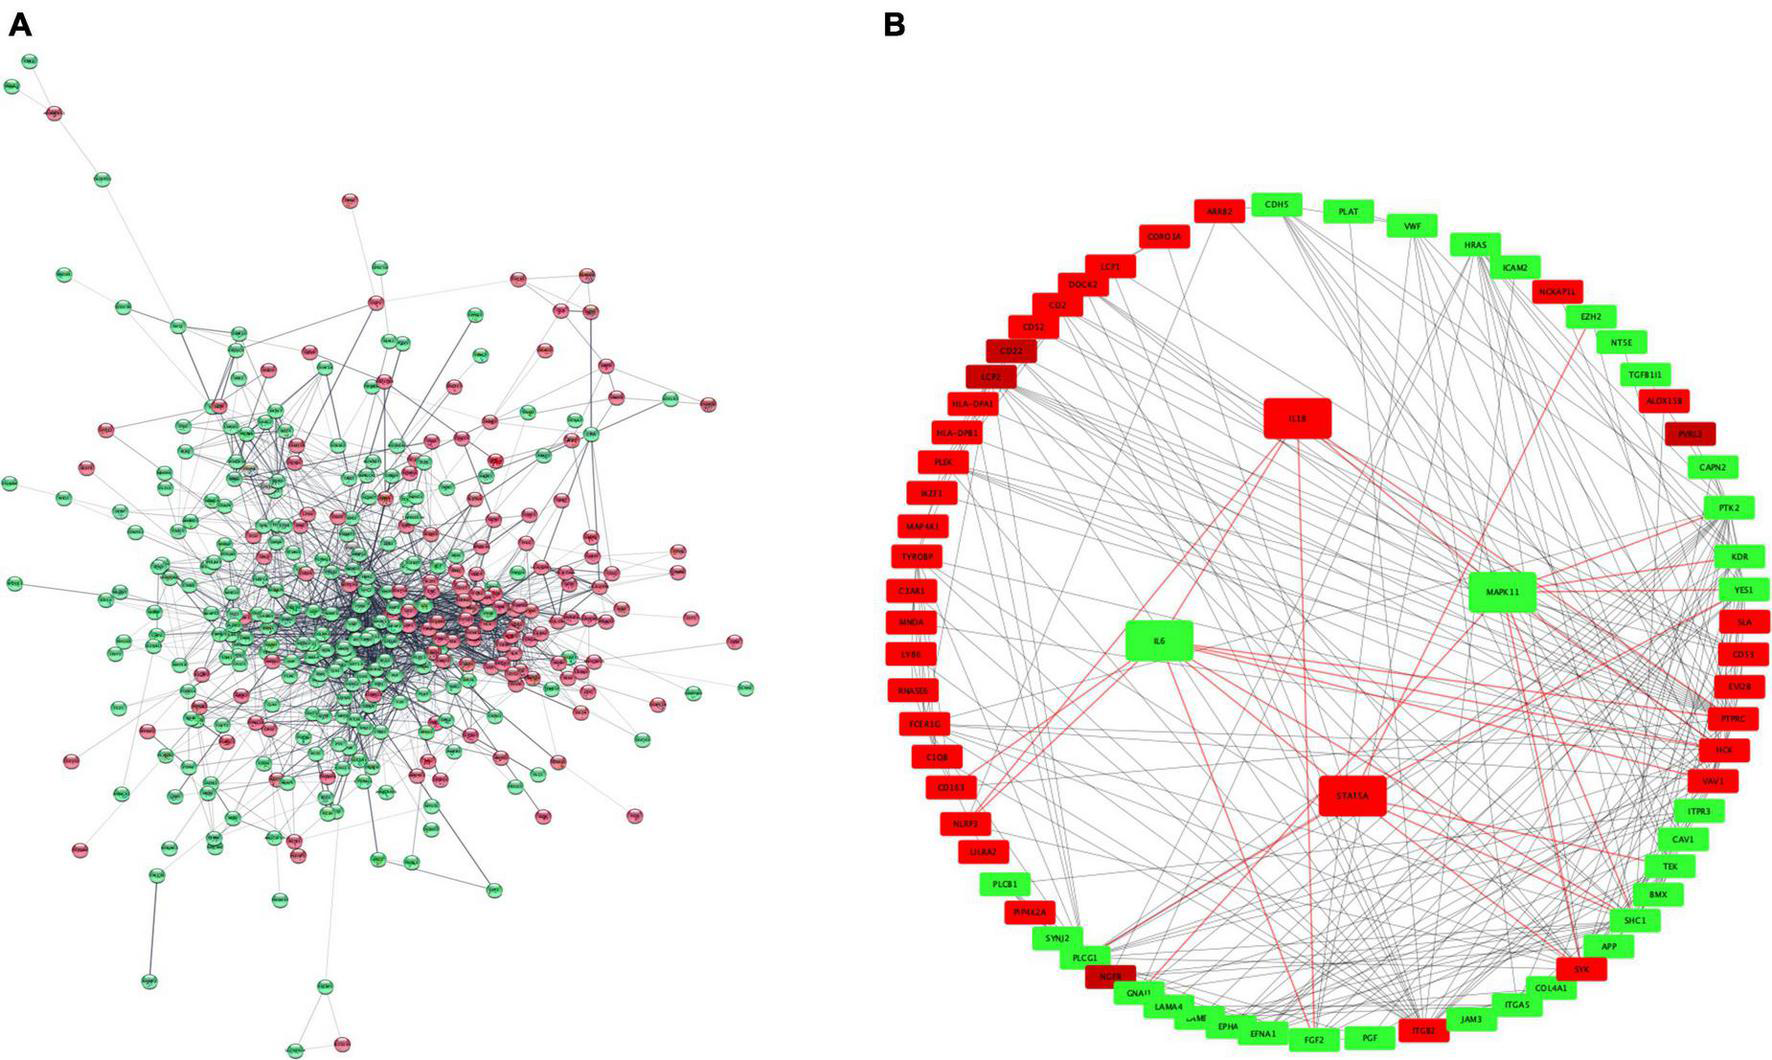
PPI network representation of 407 DEGs (A). The network was constructed by STRING and visualized in Cytoscape. Hub proteins network (B) according to CytoHubba MCC coefficient. Red and green color represent upregulated and downregulated proteins. PPI, protein-protein interaction; MCC, maximum clique centrality. Red color represents up-regulated genes and green color down-regulated.
Micro ribonucleic acid enrichment analysis
MicroRNAs are key epigenetic regulators that modulate cell fate by means of post-transcriptional repression of gene expression. We explored microRNAs associated to our set of DEGs in TargetScan and miRTarBase databases. There were 96 microRNAs targeting 2,605 DE mRNAs, with 12,915 interactions. Intersection with the top dysregulated genes is shown in Figure 6A, with 96 microRNAs interacting with 285 DE mRNAs. Five hub microRNAs (hsa-miR-1, hsa-miR-16, hsa-miR-26b, hsa-miR-92, and hsa-miR-124) were selected (Figure 6B), targeting 175 mRNAs with 1,463 interactions. Among targeted DEGs there were STAT5A, IL6 and MAPK11. IL-6 gene was regulated by seven microRNAs, STAT5A was regulated by three microRNAs and MAPK11 only by one microRNA. MicroRNA hsa-miR-124 was a common regulator of STAT5A, IL6, and MAPK11.
FIGURE 6
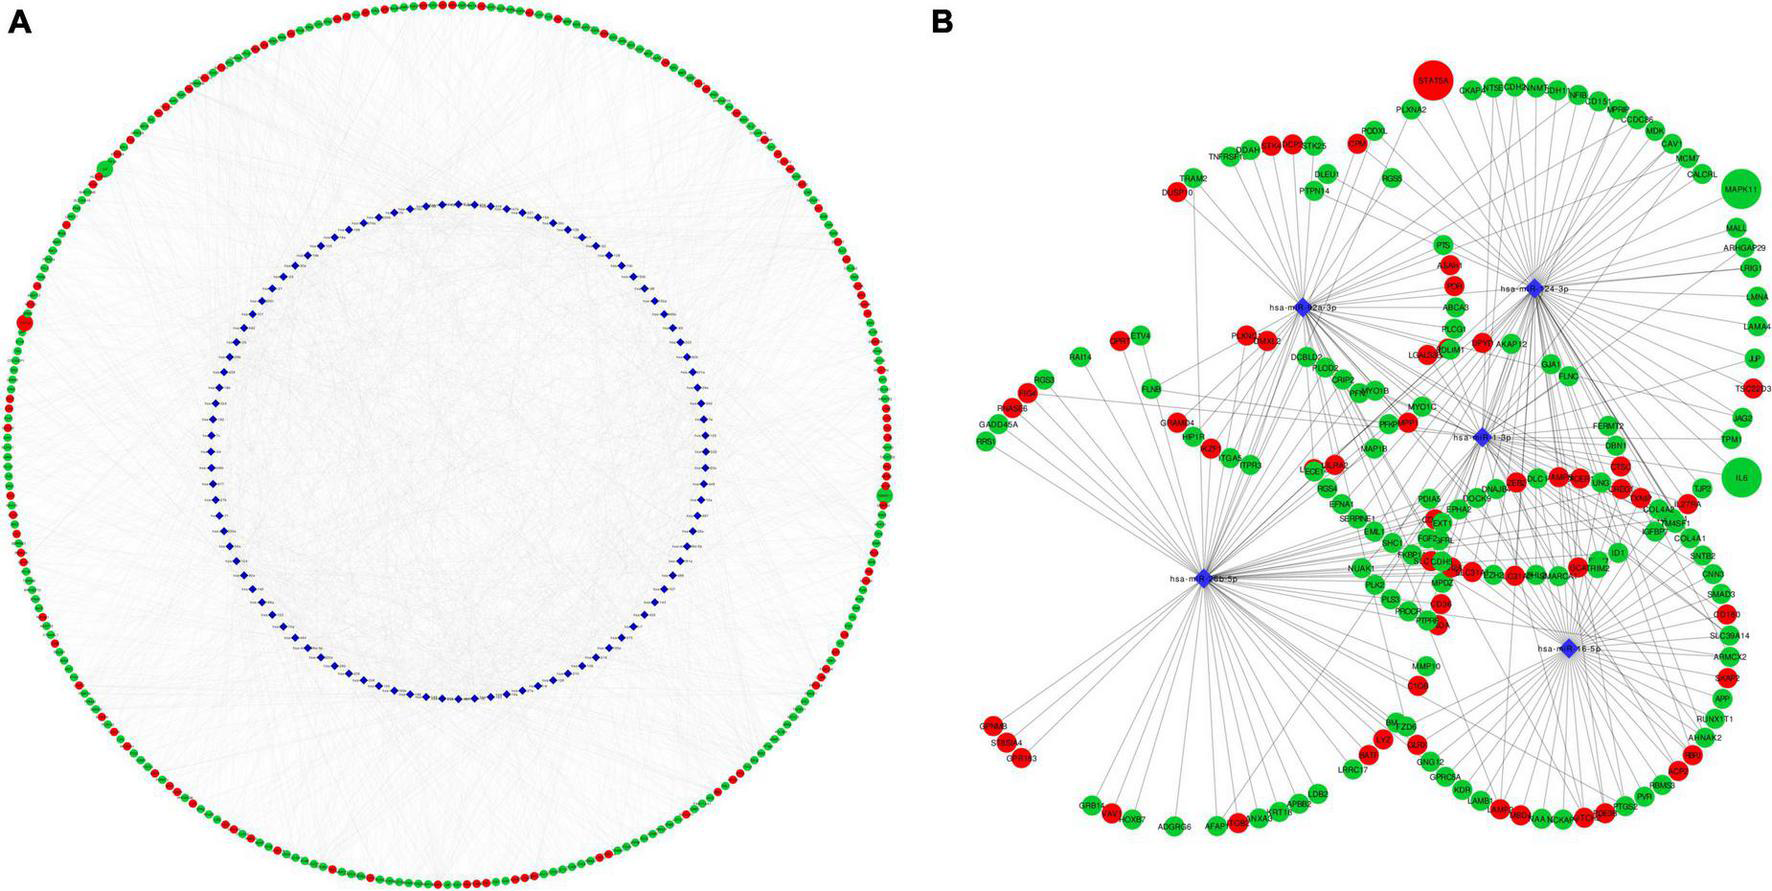
Network representation of microRNA-mRNA target interactions. (A) Shows interactions between 96 MicroRNA and 285 DEG in EPCs. Hub microRNAs were selected according to CytoHubba MCC coefficient (B). IL6, STAT5A and MAPK11 are highlighted in larger size. Red color rep-resents up-regulated genes and green color down-regulated. Circle represents mRNA and blue diamond’s represents microRNA. MCC, maximum clique centrality.
Discussion
Microarray meta-analysis is an useful strategy to reveal new associations between genes and pathological states, it is the first step of a pipeline for the discovery of new drugs or biomarkers (28). The approach used allowed us to compare a large amount of transcripts from 25 samples in two different platforms (Illumina and Affymetrix) (29).
Meta-analysis was superior than the individual dataset analysis to detect significant DEGs. Simple merging of datasets detected twelve common DEGs to all datasets, while meta-analysis detected 38. Data normalization and batch effect correction allowed comparison among multiple samples increasing the sensibility of the detection protocol (30).
EPCs are pluripotent stem cells derived from bone marrow, with the ability to home to sites of endothelial denudation (31). Considering that EPCs are extremely rare in circulating blood, ex vivo expansion culture systems are used to select rare EPCs using whole blood peripheral mononuclear cells (PBMCs). PBMCs are platted in fibronectin-coated dishes and exposed to growing factors (32). Early EPCs appear within 4–7 days of culture, show a limited proliferating potential for long term culture, and disappear after 2 weeks in in vitro conditions. They express both endothelial and monocytic markers, have a low expression of endothelial nitric oxide synthase (eNOS) and VEGFR-2 and release proangiogenic growth factors, as confirmed by transcriptomic data. Late EPCs develop from 2 to 3 weeks after plating and show a cobblestone appearance like mature ECs, expressing only endothelial markers. They show a long life span and rapidly replicate from several cells to a colony becoming a monolayer (33).
There is still a significant controversy regarding the origin of EPCs, their role and function once they migrate into the vessel. These CD34 + CD133 + early EPCs are intensively recruited after vascular injury but their proliferative potential and capacity to form mature ECs is limited. They appear to support vascular repair indirectly via paracrine secretory activities. On the other hand, late EPCs are capable of maturing into functioning endothelium. These cells have a higher proliferative potential and express CD31 + and KDR + (34). Comparison between early and late EPCs has also shown many dysregulated genes and proteins. These dissimilarities were pointed out by Kukumberg et al. by combining transcriptomic, proteomic and electron microscopy images analysis (35).
Due to the described differences, we only selected early EPCs samples from the datasets for further meta-analysis, as there were only three samples of late EPCs available.
EPCs are increased during vascular injury induced by balloon angioplasty and stenting, and its levels correlate with patient’s outcome (36). Patients with peripheral artery disease exhibit less EPCs, especially if associated with diabetes (37). Type 2 diabetes is one of the main clinical risk factors for vascular dysfunction and stent restenosis increasing the odds to 2–4-fold (38). In diabetic patients there is a diminished amount of EPCs, and an altered function of these cells due to premature differentiation, accelerated by hyperglycemia and increased oxidative stress (39).
The amplified inflammation in diabetes lead to increased bone marrow cell turnover, inhibiting the distribution of EPCs to ischemic tissues (40). There is also an insufficient release of marrow-stimulating factors, such as VEGFR and SDF-1, which results in downregulation of hypoxia-inducible factor (HIF-1) through the PI3K-AKT-eNOS pathway (41).
PI3K-AKT signaling pathway plays a central role in cellular physiology by mediating growth factor signals during critical cellular processes, such as glucose homeostasis, lipid metabolism, protein synthesis and cell proliferation and survival (42). VEGF and statins induce EPCs differentiation by stimulation the PI3K-AKT pathway (43). In diabetic mice, aerobic and resistance training increased PI3K-AKT pathways, improving the proliferation and adherence capacities of EPCs (44). In patients with diabetes, exercise improved in vivo endothelial repair capacity of EPCs by increased NO production and reduced superoxide anion level (45).
AGE products are heterogeneous groups of irreversible adducts produced by non-enzymatic glycation and glycoxidation of proteins, nucleic acid with reducing sugars (46). AGE interacts with RAGE to produce reactive oxygen species that activates nuclear factor kappa-B (NF-kB) and numerous proinflammatory genes of cytokines such as tumor necrosis factor-α (TNF-α), interleukins as IL6, and adhesion molecules (47). In an animal model, AGE-RAGE induced osteoblast differentiation of EPCs, mediated by p38, MAPK, and JNK signaling, promoting accelerated atherosclerosis (48). Enrichment of PI3K-AKT and AGE-RAGE signaling pathway for DEGs detected in meta-analysis reinforce the biological significance of our findings.
Hyperglycemia can induce EPC dysfunction triggering inflammation via SDF-1β/CXCR7–AMPK pathway resulting in secretion of IL6. Exendin-4, a glucagon-like peptide-1 analog could revert inhibitory effects of hyperglycemia, modulating inflammatory imbalance, restoring EPC viability and biological capacities (49).
IL6 was downregulated among EPC in our study, its potential interaction with several microRNAs (hsa-miR-1, hsa-miR-9, hsa-miR-107, hsa-miR-124, hsa-miR-98, hsa-miR-155, hsa-let-7c), seems an interesting approach to modulate EPC function.
STAT5A is part of the JAK-STAT pathway, it can form tetramers in addition to dimers. The cytokines that activate STAT5A mainly include IL3, IL2 as well as grown factors (EGF, EPO, GM-CSF, TPO, and PDGF). The biological functions of STAT5A include: (1) Regulation of growth and development. (2) Regulation of the immune system. (3) Regulation of tumor immunity. (4) Regulation of cell growth, differentiation, and apoptosis (50).
In EPCs isolated from type 2 diabetic patients there is an inhibition of STAT5/PPARγ transcriptional complex, leading to inactivation of Cyclin D1 and cell cycle arrest. Constitutive activation of STAT5 restore EPCs proliferation. The authors demonstrated that STAT5A is crucial for gene targeting and EPCs fate and the mechanisms of EPCs dysfunction in diabetic patients (51).
MicroRNA enrichment analysis detected hsa-miR-221, hsa-miR-222, and hsa-miR-124 targeting STAT5A. In breast cancer cells, repression of hsa-miR-221 and hsa-miR-222 were associated to overexpression of STAT5A conferring a more aggressive tumor phenotype (52). In hyperglycemic induced damage of mesangial cells, hsa-miR-222 transfer via extracellular vesicle, derived in STAT5A repression, protecting cells from hyperglycemic injury (53).
The p38 MAPK family is composed of α, β (MAPK11), γ and δ, isoforms which are encoded by separate genes. These kinases transduce extracellular signals and coordinate the cellular responses needed for adaptation and survival. However, in cardiovascular and other disease states, these same systems can trigger maladaptive responses that aggravate, rather than alleviate, the disease (54). Its activation in ECs leads to actin remodeling, angiogenesis, DNA damage response and thereby has major impact on cardiovascular homeostasis, and on cancer progression (55).
Seeger et al. showed that p38 MAPK plays a pivotal role in the signal transduction pathways regulating the number of EPCs. EPCs from patients with coronary artery disease had significantly higher basal p38-phosphorylation levels compared with healthy subjects. Additionally, TNF-α and glucose induced a dose- and time-dependent activation of the p38 MAP kinase in healthy EPCs. Treatment with SB203580, an inhibitor of p38-kinase could reverse impaired capacity for neovascularization and augmented EPCs number (56).
Other study demonstrated the deleterious effect of hyperglycemia on EPCs via p38 MAPK phosphorylation. The exposure of cultured EPCs to high glucose significantly accelerated the rate of senescence compared with that in osmolar control during culture. The phosphorylation of p38 MAPK in EPCs was increased by glucose compared with control in a dose-dependent manner. Hyperglycemia-induced EPC senescence was significantly inhibited by the addition of an inhibitor of the p38 MAPK, SB203580 (57).
Hsa-miR-124 has been shown to target p38 MAPK in silico as well as in experimental models (58). The expression levels of hsa-miR-124 and p38 MAPK showed and inverse correlation in patients with coronary artery disease with over expression of p38 MAPK and repression of hsa-miR-124. Furthermore hsa-miR-124 transduction in macrophages inhibited apoptosis via targeting p38 MAPK signaling pathway in atherosclerosis development (59).
Chang et al. deciphered the microRNA profile of EPCs (early and late) and ECs by small RNA sequencing. Of note, among top five selected microRNAs, only hsa-miR-124 was overexpressed in early EPCs, with null expression in late EPCs and ECs (60).
Conclusion
The present study guided to the identification of a set of mRNAs dysregulated during the differentiation of circulating early EPCs into mature ECs, specially related to AGE/RAGE signaling pathway in diabetic complications. Furthermore, a group of microRNAs potentially associated with key differentially expressed mRNAs was highlighted. We hypothesize that overexpression of hsa-miR-124 might repress IL6 and p38β/MAPK11, allowing EPCs differentiation into mature ECs.
This group of genes could serve as biomarkers of EPCs differentiation during coronary stenting as well as potential therapeutic targets to improve stent re-endothelization, especially in diabetic patients. However, further studies are needed to validate and explore the impact of the proposed genes on EPCs.
Statements
Data availability statement
The datasets presented in this study can be found in online repositories. The names of the repository/repositories and accession number(s) can be found in the article/Supplementary material.
Author contributions
AA and LS: conceptualization. AA: methodology, formal analysis, investigation, data curation, writing—original draft preparation, and visualization. LS: resources, writing—review and editing, supervision, project administration, and funding acquisition. Both authors have read and agreed to the published version of the manuscript.
Funding
This research was supported by FONDECYT-ANID, Chile (Grant no. 1171765), the Dirección de Investigación-Universidad de La Frontera, Temuco, Chile (Grant no. DI20-0092), and the CONICYT Scholarship (Grant no. 63140032).
Conflict of interest
The authors declare that the research was conducted in the absence of any commercial or financial relationships that could be construed as a potential conflict of interest.
Publisher’s note
All claims expressed in this article are solely those of the authors and do not necessarily represent those of their affiliated organizations, or those of the publisher, the editors and the reviewers. Any product that may be evaluated in this article, or claim that may be made by its manufacturer, is not guaranteed or endorsed by the publisher.
Supplementary material
The Supplementary Material for this article can be found online at: https://www.frontiersin.org/articles/10.3389/fcvm.2022.964721/full#supplementary-material
References
1.
Pelliccia F Cianfrocca C Rosano G Mercuro G Speciale G Pasceri V . Role of endothelial progenitor cells in restenosis and progression of coronary atherosclerosis after percutaneous coronary intervention a prospective study.JACC Cardiovasc. Interv. (2010) 3:78–86. 10.1016/j.jcin.2009.10.020
2.
Chen L Ackerman R Saleh M Gotlinger KH Kessler M Mendelowitz LG et al 20-HETE regulates the angiogenic functions of human endothelial progenitor cells and contributes to angiogenesis in vivo. J Pharmacol Exp Ther. (2014) 348:442–51. 10.1124/jpet.113.210120
3.
Yoder MC . Human endothelial progenitor cells.Cold Spring Harb Perspect Med. (2012) 2:a006692. 10.1101/cshperspect.a006692
4.
Mitra AK Agrawal DK . In stent restenosis: bane of the stent era.J Clin Pathol. (2006) 59:232–9. 10.1136/jcp.2005.025742
5.
Ino Y Kubo T Tanaka A Liu Y Tanimoto T Kitabata H et al Comparison of vascular response between everolimus-eluting stent and bare metal stent implantation in ST-segment elevation myocardial infarction assessed by optical coherence tomography. Eur Heart J Cardiovasc Imaging. (2015) 16:513–20. 10.1093/ehjci/jeu227
6.
Gao M Yao Q Liu Y Sun F Ma Y Sun G . Association between mobilization of circulating endothelial progenitor cells and time or degree of injury from angioplasty in patients with exertional angina: a prospective study.Exp Ther Med. (2015) 10:809–15. 10.3892/etm.2015.2571
7.
Habib A Finn AV . Endothelialization of drug eluting stents and its impact on dual anti-platelet therapy duration.Pharmacol Res. (2015) 93:22–7. 10.1016/j.phrs.2014.12.003
8.
Benvenuto P Neves MAD Blaszykowski C Romaschin A Chung T Kim SR et al Adlayer-mediated antibody immobilization to stainless steel for potential application to endothelial progenitor cell capture. Langmuir. (2015) 31:5423–31. 10.1021/acs.langmuir.5b00812
9.
Scacciatella P D’Amico M Pennone M Conrotto F Meliga E Usmiani T et al Effects of EPC capture stent and CD34+mobilization in acute myocardial infarction. Minerva Cardioangiol. (2013) 61:211–9.
10.
Zhang SX Zhang F Feng B Fan QY Yang F Shang DB et al Hematopoietic stem cell capture and directional differentiation into vascular endothelial cells for metal stent-coated chitosan/hyaluronic acid loading CD133 antibody. Tissue Eng Part A. (2015) 21:1173–83. 10.1089/ten.TEA.2014.0352
11.
Woudstra P de Winter RJ Beijk MA . Next-generation DES: the COMBO dual therapy stent with Genous endothelial progenitor capturing technology and an abluminal sirolimus matrix.Expert Rev Med Dev. (2014) 11:121–35. 10.1586/17434440.2014.882046
12.
Wojakowski W Pyrlik A Król M Buszman P Ochała A Milewski K et al Circulating endothelial progenitor cells are inversely correlated with in-stent restenosis in patients with non-ST-segment elevation acute coronary syndromes treated with EPC-capture stents (JACK-EPC trial). Minerva Cardioangiol. (2013) 61:301–11.
13.
Fadini GP Boscaro E de Kreutzenberg S Agostini C Seeger F Dimmeler S et al Time course and mechanisms of circulating progenitor cell reduction in the natural history of type 2 diabetes. Diabetes Care. (2010) 33:1097–102. 10.2337/dc09-1999
14.
Hamed S Brenner B Abassi Z Aharon A Daoud D Roguin A . Hyperglycemia and oxidized-LDL exert a deleterious effect on endothelial progenitor cell migration in type 2 diabetes mellitus.Thromb Res. (2010) 126:166–74. 10.1016/j.thromres.2010.03.002
15.
Pelliccia F Pasceri V Zimarino M De Luca G De Caterina R Mehran R et al Endothelial progenitor cells in coronary atherosclerosis and percutaneous coronary intervention: a systematic review and meta-analysis. Cardiovasc Revasc Med. (2022) 2:94–9. 10.1016/j.carrev.2022.02.025
16.
Clough E Barrett T . The gene expression omnibus database.Methods Mol Biol. (2016) 1418:93–110. 10.1007/978-1-4939-3578-9_5
17.
Zhou G Soufan O Ewald J Hancock RE Basu N Xia J . NetworkAnalyst 3.0: a visual analytics platform for comprehensive gene expression profiling and meta-analysis.Nucleic Acids Res. (2019) 47:W234–41. 10.1093/nar/gkz240
18.
Välikangas T Suomi T Elo LL . A systematic evaluation of normalization methods in quantitative label-free proteomics.Brief Bioinform. (2018) 19:1–11.
19.
Zindler T Frieling H Neyazi A Bleich S Friedel E . Simulating combat: How batch correction can lead to the systematic introduction of false positive results in DNA methylation microarray studies.BMC Bioinformatics. (2020) 21:271. 10.1186/s12859-020-03559-6
20.
Smyth GK . Linear models and empirical bayes methods for assessing differential expression in microarray experiments.Stat Appl Genet Mol Biol. (2004) 3:Article3. 10.2202/1544-6115.1027
21.
Benjamini Y Drai D Elmer G Kafkafi N Golani I . Controlling the false discovery rate in behavior genetics research.Behav Brain Res. (2001) 125:279–84. 10.1016/S0166-4328(01)00297-2
22.
Yoon S Baik B Park T Nam D . Powerful p-value combination methods to detect incomplete association.Sci Rep. (2021) 11:6980. 10.1038/s41598-021-86465-y
23.
Bu D Luo H Huo P Wang Z Zhang S He Z et al KOBAS-i: intelligent prioritization and exploratory visualization of biological functions for gene enrichment analysis. Nucleic Acids Res. (2021) 49:W317–25. 10.1093/nar/gkab447
24.
Szklarczyk D Gable AL Nastou KC Lyon D Kirsch R Pyysalo S et al The STRING database in 2021: customizable protein-protein networks, and functional characterization of user-uploaded gene/measurement sets. Nucleic Acids Res. (2021) 49:D605–12. 10.1093/nar/gkaa1074
25.
Shannon P Markiel A Ozier O Baliga NS Wang JT Ramage D et al Cytoscape: a software environment for integrated models of biomolecular interaction networks. Genome Res. (2003) 13:2498–504. 10.1101/gr.1239303
26.
McGeary SE Lin KS Shi CY Pham TM Bisaria N Kelley GM et al The biochemical basis of microRNA targeting efficacy. Science. (2019) 366:eaav1741. 10.1126/science.aav1741
27.
Huang HY Lin YC Li J Huang KY Shrestha S Hong HC et al miRTarBase 2020: updates to the experimentally validated microRNA-target interaction database. Nucleic Acids Res. (2020) 48:D148–54. 10.1093/nar/gkz896
28.
Ma TZ Liang FM Tseng GC . Biomarker detection and categorization in ribonucleic acid sequencing meta-analysis using Bayesian hierarchical models.J R Stat Soc Series C Appl Stat. (2017) 66:847–67. 10.1111/rssc.12199
29.
Tseng GC Ghosh D Feingold E . Comprehensive literature review and statistical considerations for microarray meta-analysis.Nucleic Acids Res. (2012) 40:3785–99. 10.1093/nar/gkr1265
30.
Müller C Schillert A Röthemeier C Trégouët DA Proust C Binder H et al Removing batch effects from longitudinal gene expression – quantile normalization plus combat as best approach for microarray transcriptome data. PLoS One. (2016) 11:e0156594. 10.1371/journal.pone.0156594
31.
Patel J Donovan P Khosrotehrani K . Concise review: functional definition of endothelial progenitor cells: a molecular perspective.Stem Cells Transl Med. (2016) 5:1302–6. 10.5966/sctm.2016-0066
32.
Murohara T . Cord blood-derived early outgrowth endothelial progenitor cells.Microvasc Res. (2010) 79:174–7. 10.1016/j.mvr.2010.01.008
33.
Salybekov AA Kobayashi S Asahara T . Characterization of endothelial progenitor cell: past, present, and future.Int J Mol Sci. (2022) 23:7697. 10.3390/ijms23147697
34.
Gori T . Restenosis after coronary stent implantation: cellular mechanisms and potential of endothelial progenitor cells (a short guide for the interventional cardiologist).Cells. (2022) 11:2094. 10.3390/cells11132094
35.
Kukumberg M Zaw AM Wong DHC Toh CM Chan BPL Seet RCS et al Characterization and functional assessment of endothelial progenitor cells in ischemic stroke patients. Stem Cell Rev Rep. (2021) 17:952–67. 10.1007/s12015-020-10064-z
36.
Montenegro FS Correia M Muccillo F Souza E Silva CG De Lorenzo A . Associations between endothelial progenitor cells, clinical characteristics and coronary restenosis in patients undergoing percutaneous coronary artery intervention.BMC Res Notes. (2018) 11:278. 10.1186/s13104-018-3401-y
37.
Hayek SS MacNamara J Tahhan AS Awad M Yadalam A Ko YA et al Circulating progenitor cells identify peripheral arterial disease in patients with coronary artery disease. Circ Res. (2016) 119:564–71. 10.1161/CIRCRESAHA.116.308802
38.
Wilson S Mone P Kansakar U Jankauskas SS Donkor K Adebayo A et al Diabetes and restenosis. Cardiovasc Diabetol. (2022) 21:23. 10.1186/s12933-022-01460-5
39.
Loomans CJ van Haperen R Duijs JM Verseyden C de Crom R Leenen PJ et al Differentiation of bone marrow-derived endothelial progenitor cells is shifted into a proinflammatory phenotype by hyperglycemia. Mol Med. (2009) 15:152–9. 10.2119/molmed.2009.00032
40.
Fadini GP Ferraro F Quaini F Asahara T Madeddu P . Concise review: diabetes, the bone marrow niche, and impaired vascular regeneration.Stem Cells Transl Med. (2014) 3:949–57. 10.5966/sctm.2014-0052
41.
Catrina SB Zheng X . Hypoxia and hypoxia-inducible factors in diabetes and its complications.Diabetologia. (2021) 64:709–16. 10.1007/s00125-021-05380-z
42.
Huang X Liu G Guo J Su Z . The PI3K/AKT pathway in obesity and type 2 diabetes.Int J Biol Sci. (2018) 14:1483–96. 10.7150/ijbs.27173
43.
Dimmeler S Aicher A Vasa M Mildner-Rihm C Adler K Tiemann M et al HMG-CoA reductase inhibitors (statins) increase endothelial progenitor cells via the PI 3-kinase/Akt pathway. J Clin Invest. (2001) 108:391–7. 10.1172/JCI13152
44.
Zhai L Liu Y Zhao W Chen Q Guo T Wei W et al Aerobic and resistance training enhances endothelial progenitor cell function via upregulation of caveolin-1 in mice with type 2 diabetes. Stem Cell Res Ther. (2020) 11:10. 10.1186/s13287-019-1527-z
45.
Xie-Zukauskas H Das J Short BL Gutkind JS Ray PE . Heparin inhibits angiotensin II-induced vasoconstriction on isolated mouse mesenteric resistance arteries through Rho-A- and PKA-dependent pathways.Vascular Pharmacology. (2013) 58:313–8. 10.1016/j.vph.2012.12.003
46.
Khan MI Rath S Adhami VM Mukhtar H . Hypoxia driven glycation: mechanisms and therapeutic opportunities.Semin Cancer Biol. (2018) 49:75–82. 10.1016/j.semcancer.2017.05.008
47.
Prasad K . AGE-RAGE stress and coronary artery disease.Int J Angiol. (2021) 30:4–14. 10.1055/s-0040-1721813
48.
Wang Y Jiang C Shang Z Qiu G Yuan G Xu K et al AGEs/RAGE promote osteogenic differentiation in rat bone marrow-derived endothelial progenitor cells via MAPK signaling. J Diabetes Res. (2022) 2022:4067812. 10.1155/2022/4067812
49.
Yang Y Zhou Y Wang Y Wei X Wu L Wang T et al Exendin-4 reverses high glucose-induced endothelial progenitor cell dysfunction via SDF-1β/CXCR7-AMPK/p38-MAPK/IL-6 axis. Acta Diabetol. (2020) 57:1315–26. 10.1007/s00592-020-01551-3
50.
Hu X Li J Fu M Zhao X Wang W . The JAK/STAT signaling pathway: from bench to clinic.Signal Transduct Target Ther. (2021) 6:402. 10.1038/s41392-021-00791-1
51.
Trombetta A Togliatto G Rosso A Dentelli P Olgasi C Cotogni P et al Increase of palmitic acid concentration impairs endothelial progenitor cell and bone marrow-derived progenitor cell bioavailability: role of the STAT5/PPARγ transcriptional complex. Diabetes. (2013) 62:1245–57. 10.2337/db12-0646
52.
Dentelli P Traversa M Rosso A Togliatto G Olgasi C Marchiò C et al miR-221/222 control luminal breast cancer tumor progression by regulating different targets. Cell Cycle. (2014) 13:1811–26. 10.4161/cc.28758
53.
Gallo S Gili M Lombardo G Rossetti A Rosso A Dentelli P et al Stem cell-derived, microrna-carrying extracellular vesicles: a novel approach to interfering with mesangial cell collagen production in a hyperglycaemic setting. PLoS One. (2016) 11:e0162417. 10.1371/journal.pone.0162417
54.
Martin ED Bassi R Marber MS . p38 MAPK in cardioprotection – are we there yet?Br J Pharmacol. (2015) 172:2101–13. 10.1111/bph.12901
55.
Corre I Paris F Huot J . The p38 pathway, a major pleiotropic cascade that transduces stress and metastatic signals in endothelial cells.Oncotarget. (2017) 8:55684–714. 10.18632/oncotarget.18264
56.
Seeger FH Haendeler J Walter DH Rochwalsky U Reinhold J Urbich C et al p38 mitogen-activated protein kinase downregulates endothelial progenitor cells. Circulation. (2005) 111:1184–91. 10.1161/01.CIR.0000157156.85397.A1
57.
Kuki S Imanishi T Kobayashi K Matsuo Y Obana M Akasaka T . Hyperglycemia accelerated endothelial progenitor cell senescence via the activation of p38 mitogen-activated protein kinase.Circ J. (2006) 70:1076–81. 10.1253/circj.70.1076
58.
Lawson SK Dobrikova EY Shveygert M Gromeier M . p38α mitogen-activated protein kinase depletion and repression of signal transduction to translation machinery by miR-124 and –128 in neurons.Mol Cell Biol. (2013) 33:127–35. 10.1128/MCB.00695-12
59.
Liang X Wang L Wang M Liu Z Liu X Zhang B et al MicroRNA-124 inhibits macrophage cell apoptosis via targeting p38/MAPK signaling pathway in atherosclerosis development. Aging. (2020) 12:13005–22. 10.18632/aging.103387
60.
Chang TY Huang TS Wang HW Chang SJ Lo HH Chiu YL et al miRNome traits analysis on endothelial lineage cells discloses biomarker potential circulating microRNAs which affect progenitor activities. BMC Genomics. (2014) 15:802. 10.1186/1471-2164-15-802
Summary
Keywords
circulating progenitor endothelial cells, stent restenosis, diabetes, microarray meta-analysis, micro-RNA
Citation
Arencibia A and Salazar LA (2022) Microarray meta-analysis reveals IL6 and p38β/MAPK11 as potential targets of hsa-miR-124 in endothelial progenitor cells: Implications for stent re-endothelization in diabetic patients. Front. Cardiovasc. Med. 9:964721. doi: 10.3389/fcvm.2022.964721
Received
08 June 2022
Accepted
25 August 2022
Published
13 September 2022
Volume
9 - 2022
Edited by
Christoph D. Rau, University of North Carolina at Chapel Hill, United States
Reviewed by
Mohamed Essameldin Abdelgawad, Helwan University, Egypt; Qing Feng, Nanjing Medical University, China
Updates
Copyright
© 2022 Arencibia and Salazar.
This is an open-access article distributed under the terms of the Creative Commons Attribution License (CC BY). The use, distribution or reproduction in other forums is permitted, provided the original author(s) and the copyright owner(s) are credited and that the original publication in this journal is cited, in accordance with accepted academic practice. No use, distribution or reproduction is permitted which does not comply with these terms.
*Correspondence: Luis A. Salazar, luis.salazar@ufrontera.cl
This article was submitted to Cardiovascular Genetics and Systems Medicine, a section of the journal Frontiers in Cardiovascular Medicine
Disclaimer
All claims expressed in this article are solely those of the authors and do not necessarily represent those of their affiliated organizations, or those of the publisher, the editors and the reviewers. Any product that may be evaluated in this article or claim that may be made by its manufacturer is not guaranteed or endorsed by the publisher.