 Ying Shan1,2†
 Yucong Zhang3†
 Yanping Zhao1†
 Yueqi Lu1
 Bangwei Chen1,4
 Liuqiao Yang1,5Cong Tan1
 Yong Bai1Yu Sang3Juehan Liu1
 Min Jian1Lei Ruan3
 Cuntai Zhang3*
 Tao Li1*
- 1BGI-Shenzhen, Shenzhen, China
- 2Peking University Shenzhen Hospital, Clinical Research Academy, Shenzhen, China
- 3Department of Geriatrics, Tongji Medical College, Tongji Hospital, Huazhong University of Science and Technology, Wuhan, China
- 4School of Biology and Biological Engineering, South China University of Technology, Guangzhou, China
- 5College of Life Sciences, University of Chinese Academy of Sciences, Beijing, China
Background: Death due to cardiovascular diseases (CVD) increased significantly in China. One possible way to reduce CVD is to identify people at risk and provide targeted intervention. We aim to develop and validate a CVD risk prediction model for Chinese males (CVDMCM) to help clinicians identify those males at risk of CVD and provide targeted intervention.
Methods: We conducted a retrospective cohort study of 2,331 Chinese males without CVD at baseline to develop and internally validate the CVDMCM. These participants had a baseline physical examination record (2008–2016) and at least one revisit record by September 2019. With the full cohort, we conducted three models: A model with Framingham CVD risk model predictors; a model with predictors selected by univariate cox proportional hazard model adjusted for age; and a model with predictors selected by LASSO algorithm. Among them, the optimal model, CVDMCM, was obtained based on the Akaike information criterion, the Brier's score, and Harrell's C statistic. Then, CVDMCM, the Framingham CVD risk model, and the Wu's simplified model were all validated and compared. All the validation was carried out by bootstrap resampling strategy (TRIPOD statement type 1b) with the full cohort with 1,000 repetitions.
Results: CVDMCM's Harrell's C statistic was 0.769 (95% CI: 0.738–0.799), and D statistic was 4.738 (95% CI: 3.270–6.864). The results of Harrell's C statistic, D statistic and calibration plot demonstrated that CVDMCM outperformed the Framingham CVD model and Wu's simplified model for 4-year CVD risk prediction.
Conclusions: We developed and internally validated CVDMCM, which predicted 4-year CVD risk for Chinese males with a better performance than Framingham CVD model and Wu's simplified model. In addition, we developed a web calculator–calCVDrisk for physicians to conveniently generate CVD risk scores and identify those males with a higher risk of CVD.
Introduction
According to the World Health Organization, cardiovascular diseases (CVD) are the leading cause of global mortality, accounting for an estimated 17.9 million deaths (31% of all deaths) each year worldwide with an estimated 523 million prevalent CVD cases in 2019 (1). CVD is also the leading cause of death in China, accounting for 45.9% and 43.6% of all deaths in rural and urban China respectively in 2019 (2). This is more alarming given the proportion of CVD death among all death causes in China used to be 12.8% in 1957 and 35.8% in 1990 (3). China also has the highest CVD burdens internationally, with an estimated 330 million people living with CVD in 2019 (2, 4).
To reduce the CVD burden, one possible solution is to identify those at higher risk of CVD and offer them appropriate advice for a healthier lifestyle. Thus, numerous prediction models have been developed globally to estimate the risk of CVD, including the Framingham (5–7), SCORE (8), ASSIGN (9), and QRISK models (10, 11). These models were constructed based on data of mainly Caucasian participants rather than Asians, thus, may not be applicable among Chinese. Wu et al. worked out a prediction model based on the USA-PRC Collaborative Study of Cardiovascular and Cardiopulmonary Epidemiology (USA-PRC study) cohort and used the China Multicenter Collaborative Study of Cardiovascular Epidemiology (MUCA) cohort for validation (12). Yang et al. constructed a prediction model for atherosclerotic CVD (China-PAR) and externally evaluated in two independent Chinese cohort (13). All these models used a 10-year prediction period, which may seem too long for those at risk to take immediate actions. An estimated risk score in a near future (e.g., within five years) might provide a more powerful warning for the early assessment and intervention for CVDs. It was reported that adherence to a healthy lifestyle could lower the CVD burden substantially in the Chinese population (14). Researches showed that males were at higher risk of CVD than females (15, 16), thus we decided to develop a CVD risk prediction model for Chinese males (CVDMCM) that could be used by clinicians easily.
In this study, we conducted a retrospective cohort study using physical examination data from Tongji Hospital in Wuhan, Hubei Province, China. With the cohort, CVDMCM was developed following the Transparent Reporting of a multivariable prediction model for Individual Prognosis or Diagnosis (TRIPOD) statement (17). CVDMCM was internally validated and compared with established models, namely the Framingham CVD risk model and Wu's simplified prediction model (12, 18).
Methods
Study design
We conducted a retrospective cohort study to develop CVDMCM. The participants were Chinese males from the general population going through annual physical examination at Tongji Hospital in Wuhan, Hubei Province in central China. The physical examination department of Tongji Hospital is the biggest physical examination center in Wuhan.
Inclusion and exclusion criteria: we included Chinese males aged 30–74 years old who took physical examinations at Tongji Hospital between 2008 and 2016 and had at least one revisit record by September 2019. The baseline record was defined as the first time a participant took the examination between 2008 and 2016. At baseline, participants with the following conditions were excluded: those with a congenital heart disease and ischemic stroke, other heart diseases (i.e., rheumatic heart disease), a malignant tumor, or a history of liver or kidney failure. If the participants had more than one revisit record and no outcome event occurred by September 2019, we used their last revisit date and their free-of-CVD status. If there was an event by September 2019, we used their CVD event reporting date and CVD event status.
The study was approved by the Medical Ethics Committee at Tongji Medical College, Huazhong University of Science and Technology who waived the written informed consents (TJ-IRB20191215). Participants identified with CVD would be recommended to go to see the doctor. No intervention was provided in the physical examination center.
Potential predictors
Based on prior knowledge, we included 17 potential predictors, including lifestyle characteristics, clinical measurements, and medical history indicators collected by the trained doctors at the physical examination center of Tongji Hospital through standardized in-person interviews (19). The potential predictors included both classic ones, such as those in the Framingham CVD model, and more modern ones, such as ankle brachial index (ABI) and brachial-ankle pulse wave velocity (baPWV). Specific measuring protocols are listed in the Supplementary material. The quadratic terms of predictors, such as systolic blood pressure (SBP), diastolic blood pressure (DBP), body mass index (BMI), and glycated hemoglobin A1c (HbA1c) were considered. The interaction effects between age and the predictors were also assessed because the effects of some factors may change with age.
Outcomes
The CVD outcomes included coronary heart disease (CHD) and ischemic stroke. CHD was mainly diagnosed according to symptoms (mainly angina) and electrocardiography or coronary angiography. Echocardiogram, exercise stress test, coronary artery calcium scan, cardiac catheterization or chest x-ray were also used in some patients to assist the diagnosis of CHD. Patients who self-reported having coronary heart disease, coronary artery bypass grafting, coronary stent implantation, percutaneous coronary intervention, or percutaneous transluminal coronary angioplasty in the follow-up visits were also considered to have CHD. Ischemic stroke was diagnosed according to symptoms and cerebral infarction and confirmed by computed tomography or magnetic resonance imaging.
Sample size
We calculated the minimum sample size required for the prediction model according to Riley's guidance (20). By treating CVD occurrences as time-to-event outcomes, sample size calculations were provided to (S1) estimate the overall outcome proportion with precision in follow-up (S2), target a shrinkage factor of 0.9, and (S3) target small optimism of 0.05 in the apparent R2. Based on the three criteria, sample size in the cohort larger than the calculated minimum sample size required was considered as sufficient. The details are shown below:
We used R 4.1.3 package “pmsampsize” for criteria S1, S2, and S3 where the anticipated R2 value was assumed to be 0.25, according to existing CVD risk prediction models shown in Siontis et al., with up to 20 parameters (21). Siontis et al. illustrated R2 statistics of 12 existing CVD risk prediction models, and all the R2 statistics are higher than 0.25 (21). Therefore, we made a conservative choice of R2 of 0.20. For the convenience of clinical application, the number of parameters in the final model tends to be no more than 10. Again, to be conservative, we set the model with up to 20 parameters. The mean follow-up and the overall event rate were calculated in our study cohort. The timepoint of interest for prediction using the newly developed CVDMCM was 4 years.
Model development
First, physical examination records which met our inclusion criteria were exported from the electronic medical record system of Tongji Hospital. We then excluded the participants who met the exclusion criteria. A retrospective cohort was established afterwards. To deal with the missing data, we applied multiple imputations to the raw data (22). The imputations were implemented with Multivariate Imputation by Chained Equations (MICE) package in R software (23) and a single imputation dataset was used. The imputation methods were predictive mean matching (PMM) for continuous data, and logistic regression (Log-Reg) for binary data. Then, we examined the baseline characteristics for the cohorts, summarized categorical data with frequencies and percentages, as well as summarized continuous data with means and standard deviations (if normally distributed) or medians and interquartile ranges (if not normally distributed).
We constructed three models. Model 1 was constructed using multivariable Cox proportional hazards regression by the predictors the same as Framingham Risk Score for Hard Coronary Heart Disease, including age, smoking status, total cholesterol, HDL, SBP, antihypertension drug usage. The predictors in Model 2 and 3 were selected by the age-adjusted univariable Cox proportional hazards regression, and the LASSO algorithm, respectively. In LASSO, the hyperparameter lambda was the one provided minimum mean cross-validated error in the 10-fold cross validation. Then the multivariable Cox proportional hazards regressions were carried out with the corresponding selected predictors to construct the model 2 and 3. In the Cox proportional hazards regression models, we assessed the proportional hazards assumption of each predictor by examining the plots of the scaled Schoenfeld residuals against time. Any non-random pattern in the plots suggested a violation of the proportional hazard's assumptions, if not fulfilled follow-up time was split accordingly.
High-risk individuals was defined as having a risk higher than the age-standardized CVD prevalence rate of Chinese males in literature (24, 25). This would provide physicians with a cutoff to inform those individuals with high CVD risk score to change their lifestyle, take more physical activities, and pay close attention to their cardiovascular health.
Validation and model performance evaluation
All the CVDMCMs were internally evaluated in the dataset with 1,000 times bootstrap as TRIPOD statement recommended (type 1b) (26). We compared the three models in three aspects: the overall goodness of fit was assessed by AIC; the Calibration was evaluated by Brier score; and the discrimination was examined by the Harrell's C-index. In this study, AIC was calculated by AIC function in stats R package; Brier score was calculated by brier function in ModelMetrics R package; and Harrell's C-index was calculated by cindex function in dynpred R package.
The optimal model, CVDMCM was compared with the Framingham CVD risk model and the simplified model in Wu et al. (12, 18). We generated calibration plots based on the predicted and 4-year observed CVD risks. The samples were grouped into deciles according to the estimated risks. In each decile, the expected risk was calculated by taking the mean value of the estimated risks of the samples, while the observed risk was the percentage of CVD occurred at the four-year time point. Discrimination was also compared via calculation of Harrell's C statistic and D statistic. For the model to be acceptable, its Harrell's C statistic should be at least 0.7. If its Harrell's C statistic is over 0.9, it shows that the model has excellent predictive power (27). The D statistic is also a measure of discrimination. A higher value of D statistic indicates better discrimination (28). Harrell's C statistic and D statistic were calculated using concordance.index function and D.index function in R package survcomp, respectively.
All the analyses were performed using R Statistical Software, version 4.1.3. The R code is provided in Supplementary material.
Results
Participants characteristics
Initially, 2,470 participants met the inclusion criteria. From those 2,470 participants, we excluded 139 participants who met the exclusion criteria, which made 2,331 participants remained in this study. The study flow diagram could be found in Figure 1. All predictors that were considered as candidates for model development were listed in the Table 1. Table 1 showed that the participants were followed for a median of 4.0 years. The median baseline age of the participants was 52 years old with the interquartile range (IQR) of 46–58 years old. The baseline age of the 130 participants who had CVD events during the follow-up was 62 (IQR: 57–66) years old, while the baseline age of the 2,201 participants without CVD events was 51 (IQR: 46–58) years old. The incidence rate of CVD per 1,000 person-years was 13.16 (95% CI: 11.00–15.63).
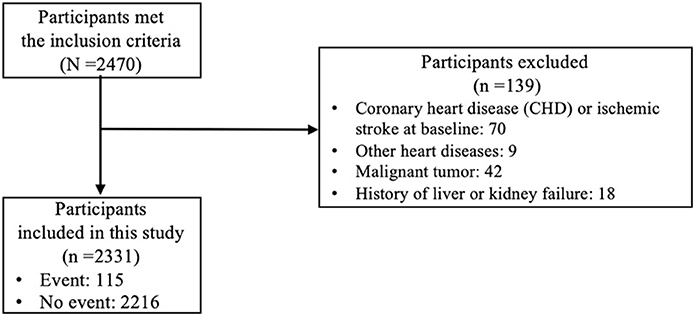
Figure 1. Study flow diagram.
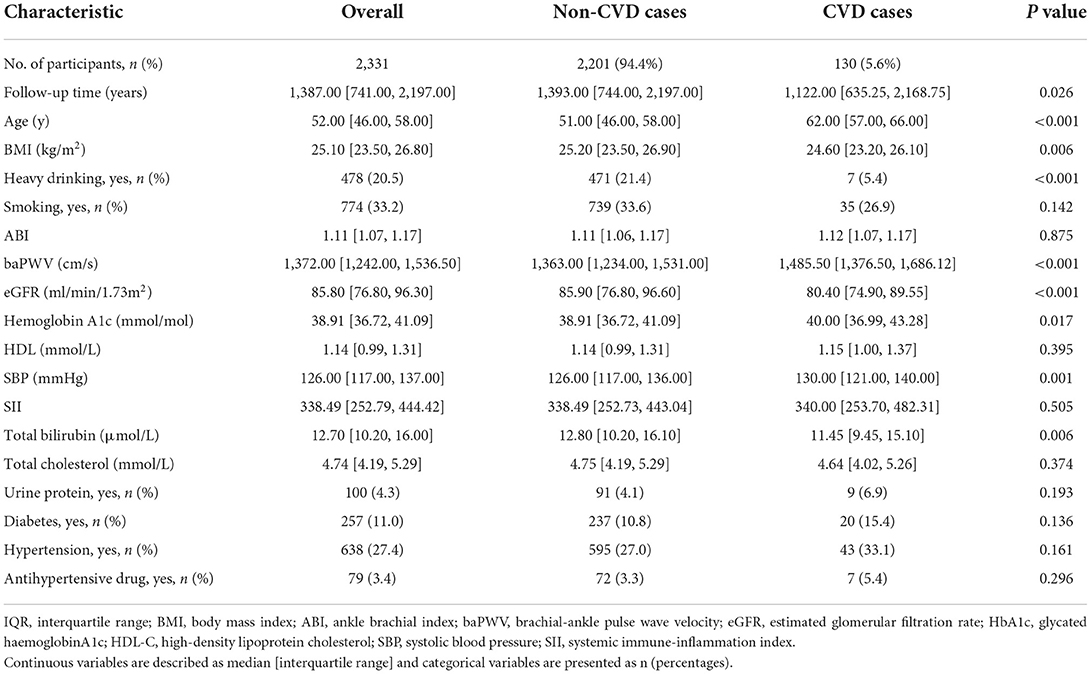
Table 1. Baseline characteristics.
Sample size calculation
Then, we calculated the minimum sample size required by using pmsampsize R package with the parameters of R2 value assumed to be 0.20 with up to 20 parameters. The mean follow-up of 4.23 years and the overall event rate of 0.049 were obtained in our study cohort. The timepoint of interest was 4 years. The calculated minimum sample size required was 796, which indicated that the sample size in the cohort of 2,331 was sufficient.
Model construction, comparison and internally validation
Three models were developed and compared. In all the three models, proportional hazard assumption was satisfied. In model 2, five predictors (predictors were age, smoking status, log-transformed total bilirubin, ABI, SBP, and the interaction of age and SBP) were associated with CVD in the age-adjusted univariate Cox regressions, thus were selected. The results of age-adjusted univariable statistics were provided in Supplementary Table 1. In model 3, the weights of predictors were shrunk to 0, except for the following predictors: hyperlipidemia drug usage, age, BMI, BMI2, average platelet volume, log total bilirubin, ABI, interaction of age and alcohol consumptions, interaction of age and smoking, interaction of age and urine protein, interaction term of age and fasting glucose, and interaction of age and DBP.
All the CVDMCMs were internally evaluated in the whole dataset with 1,000 times bootstrap. The results were shown in Table 2. Compared to model 1 and 3, Model 2 was optimal with the smallest AIC (1,689.981, 95% CI: 1,471.859–1,965.492), BIC (1,706.728, 95% CI: 1,477.919–1,964.533) and Brier's score (0.05, 95% CI: 0.044–0.057), and the biggest Harrell's C statistic (0.769, 95% CI: 0.738–0.799). In addition, Model 2 contained less predictors than the other models, thus, more convenient for clinical usage. Thus, we selected model 2 as the final CVDMCM. The model is shown below:
We calculated the age-standardized CVD prevalence rate of Chinese males according to Liu et al., which was 3.14 (23). An individual with an estimated risk higher than 3.14% is defined as a high-risk individual. In the cohort, 1,053 out of 2,331 individuals would be classified in the high-risk group.
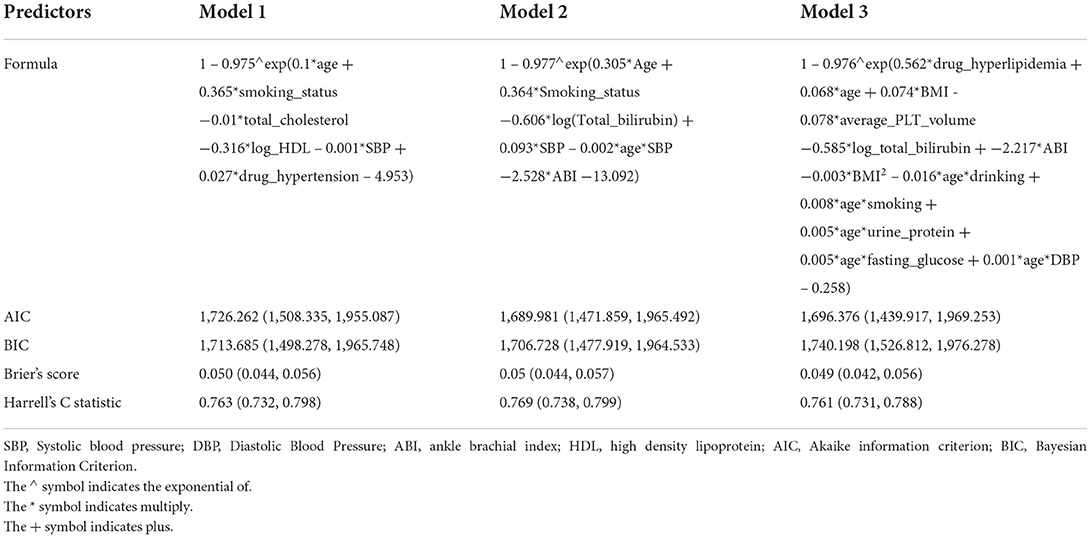
Table 2. The comparison results of the three models.
Compared the CVDMCM with Framingham and Wu's model
We then compared the CVDMCM model performance with Framingham and Wu's model by bootstrap resampling the full cohort with 1,000 replicates. We first compared the predictors of CVDMCM, the Framingham CVD risk model, and Wu's model. As shown in Table 3, the predictors used in all three models included age, smoking status, and SBP. Compared with Framingham and Wu's models, CVDMCM included more modern predictors, such as ABI and Total bilirubin. We then compared the calibration of the 3 models. As shown in Figure 2, CVDMCM demonstrated higher agreement between 4-year predicted risk and observed risk, which indicated better calibration than the Framingham and Wu's simplified model. Finally, discrimination was assessed via Harrell's C statistic and D statistic. As shown in Table 4, CVDMCM performed better than the Framingham CVD risk model and Wu's simplified model with higher Harrell's C statistic of 0.769 (CI: 0.738, 0.799), and D statistic of 4.738 (CI: 3.270–6.864). The Harrell's C statistic of CVDMCM was significantly higher than that of Framingham CVD risk model and that of Wu's simplified model with both of the one-sided P-values smaller than 0.001.
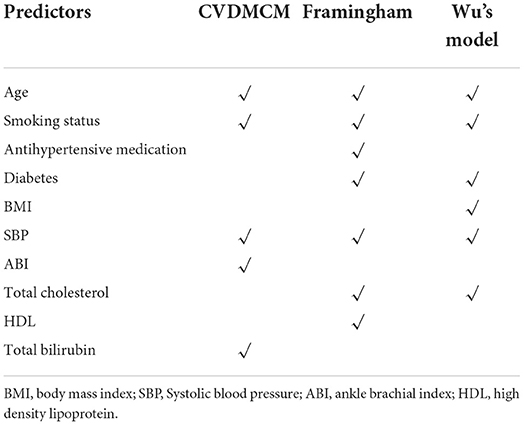
Table 3. Predictors used in CVDMCM, the Framingham and Wu's model for males.
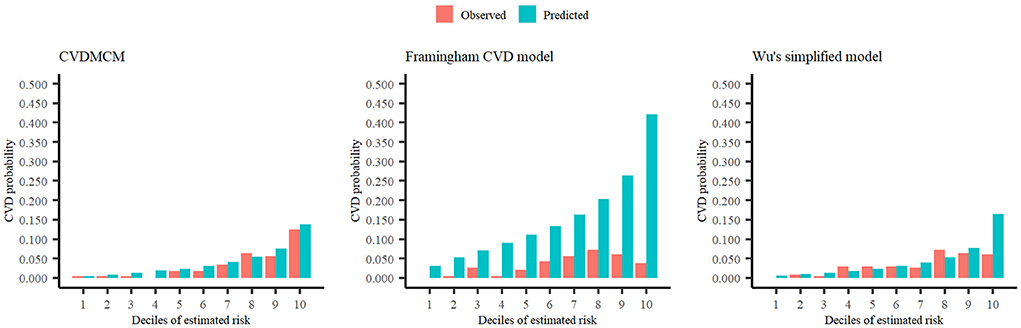
Figure 2. Calibration plots of CVDMCM, the Framingham CVD risk model, and Wu's simplified model for observed and predicted 4-year risks of CVD using a validation dataset.
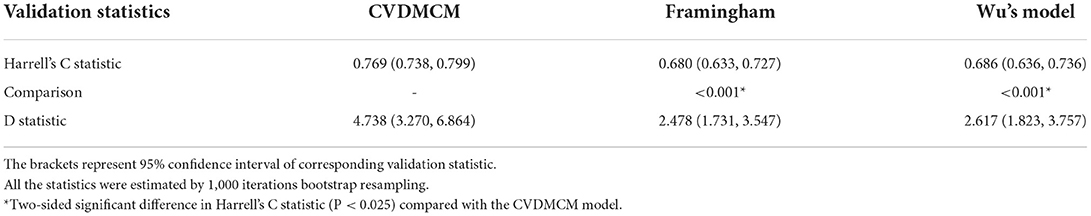
Table 4. Performance of CVDMCM, the Framingham and Wu's model in the validation cohort for predicting 4-year risk of CVD.
Model illustration
For an easier application of CVDMCM among the clinicians, we provided one example of an individual Mr. X's 4-year CVD risk. A 54-year-old Chinese man, Mr. X, who is a non-smoker with a total bilirubin of 12.30 μmol/L, ABI of 3.39, and SBP of 130mmHg, has a 4-year CVD risk of 2.39%. The calculation is shown below:
So, the 4-year CVD risk is
Since his CVD risk is lower than 3.14%, he would be classified in the low-risk group. If someone has a CVD risk calculated higher than 3.14%, he would be classified in the high-risk group, and the physicians taking the physical examination could advise him for a healthier lifestyle. To make the CVDMCM more convenient for the physicians, we have developed an online calculator calCVDrisk (https://ctan2020.github.io/-calCVDrisk-/) for the physicians to simply enter the parameters obtained from the physical examinations, and the calculator would report the score for the physicians to assess the CVD risks.
Discussion
Through this retrospective cohort study, we developed and validated a CVD risk prediction model CVDMCM. Unlike models with tens of predictors, CVDMCM had only five predictors (age, smoking status, total bilirubin, ABI, and SBP) and demonstrated a better performance than that of the Framingham CVD risk model and Wu's simplified model in the internal validation by bootstrap resampling the full cohort as found in Harrell's C statistic, D statistic, and calibration plot (12, 18).
There were several strengths of this study. First, we targeted a comparatively high-risk population for CVD, namely Chinese males. Given that CVD is the leading cause of death in China accounting for over 43.6% of all deaths in China, which was an increase from 12.8% in 1957 and 35.8% in 1990, immediate action is needed to change the increasing trend (3). Among the Chinese population, Chinese males were at higher risk of CVD (16). Thus, we decided to work on a model for the Chinese males in this study. Secondly, we used a 4-year prediction model. Previously, CVD prediction models were often 10-year risks, which may seem too long for those at risk to take immediate actions (8, 12, 13, 18). We hypothesized that an estimated risk score in 4 years could provide a more powerful early warning for the lifestyle change. Thirdly, the models were selected by data driven strategy according to AIC, AUC, and R2 indices, which was more objective. Fourth, for an easier application of our finding, we have developed an online calculator calCVDrisk for physicians to assess the CVD risk scores among those taking physical examinations.
Compared with the classic CVD models, such as the Framingham (5–7), SCORE (8), ASSIGN (9), and QRISK models (10, 11), CVDMCM was developed using Chinese males' data, which is more applicable in China. A previous study reported that CVD models should better be developed among specific populations (29). Although Wu's model is a very well designed one among the Chinese, it was published 15 years ago, thus, did not include more modern predictors such as ABI and baPWV. ABI was found as one of the five predictors in CVDMCM. ABI has become widely used in modern clinical practice and has been reported to be a sensitive measurement of CVD risk. Alves-Cabratosa et al. reported that low ABI would increase the risk of acute myocardial infarction and ischemic stroke among asymptomatic people, as well as people with diabetes and previously-diagnosed CVD (30). Velescu et al. showed that adding ABI to the Framingham CVD risk model would improve the capacity of predicting CVD events in northeastern Spain population (31). The baPWV, a parameter for the arterial stiffness assessment, has been reported as a CVD risk predictor in Japanese population (32). Therefore, we included ABI and baPWV as candidate predictors for CVDMCM in our study.
In our study, individuals in CVD group had older age, higher baPWV, lower eGFR, higher hemoglobin A1c, higher SBP, lower total bilirubin than those in Non-CVD group. Higher baPWV indicates arteriosclerosis, and higher hemoglobin A1c indicates abnormal glucose metabolism. These two indicators have been proven to be associated with higher risk of CVDs (32, 33). Lower eGFR indicates worse renal function, which may be the results of arteriosclerosis (34) or abnormal glucose metabolism (35). However, after adjusting for covariates, in the final CVDMCM model, age, smoking and SBP were included as positive predictor of CVDs, and total bilirubin and ABI were included as negative predictor. Age, smoking and SBP are well-recognized risk factor of CVDs. Interestingly, serum total bilirubin was included in the CVDMCM model but not diabetes mellitus or total cholesterol. A meta-analysis demonstrates that higher serum total bilirubin was an independent protective factor, independent of traditional risk factors, for arteriosclerotic CVDs and negatively associated with the prognosis of stroke, acute myocardial infarction, and peripheral arterial disease, but positively associated with in-hospital cardiovascular death and major adverse cardiac events (36). Similarly, total bilirubin was also a negative predictor of CVDs in our study. Bilirubin is an endogenous antioxidant, which resists for oxidative modification of low-density lipoprotein cholesterol, participates in clearing reactive oxygen species (ROS), and increases the ability of serum cholesterol dissolution (37, 38). Bilirubin can effectively block the generation of cellular ROS, and further prevent the formation of atherosclerotic plaque. Moreover, bilirubin partly inhibits the induction of complement through anti-apoptosis (39), regulates the activity of various T lymphocytes (40) and the production of proinflammatory cytokines (41).
Total cholesterol and diabetes mellitus were not included in the model. Zhu et al. indicated that aging is considered as a major risk factor for development of type 2 diabetes (42). Nunes et al. showed that age triggered increased plasma concentrations of triglycerides, cholesterol, low-density lipoproteins and lower capacity of high-density lipoproteins to remove cellular cholesterol in humans (43). Therefore, in our study, age as a potential confounder might remove the effect of total cholesterol and diabetes mellitus to the CVD endpoint when adjusting for covariates.
To better utilize CVDMCM, we developed an online calculator calCVDrisk for physicians to calculate the CVD risk of a Chinese male when taking the physical examination. We expect that CVDMCM will be promising in the application as it is a simple model with only five predictors. A previous study has shown that physicians were more willing to use simpler models in clinical practice than more complex ones when they had comparable performance (44). The estimated 4-year CVD risk will let people be alert to their cardiovascular health. A prospective cohort is under plan to use CVDMCM to detect those at higher risk of CVD to further validate the model at the physical examination department of Tongji Hospital. If the results are promising, we would advocate this application in major physical examination departments in China.
We believe that the CVDMCM could be helpful for medical doctors in the physical examination departments in China to identify those at higher risks of CVD in 4 years. For health care providers, the integration of a better CVD risk prediction model in their workflow would enable them to track the health statuses of those with high-risk scores so that doctors could provide advice for lifestyle changes and potentially help reduce CVD risks in those patients.
We admit that there are some limitations of this study. First, our model was targeting Chinese males only. As people of different ethnical background would have different risk factors, it is better to have tailor-made models for different populations. No females were included as our aim was to construct the CVD prediction model of Chinese male, given their higher risk of developing CVD (45). Second, there's no CVD caused mortality record in our data. Thus, Framingham CVD risk model and Wu's model may not be comparable. The conclusion of the better performance of CVDMCM model is based on the different end-point events. We did not compare CVDMCM to China-PAR due to lack of predictors in our physical examination data (13). Third, there is inevitably selection bias by choosing the participants taking physical examinations. They might take better care of their health than those who do not take regular physical examinations. A model to identify those at higher risk of CVD with appropriate lifestyle change advice might work with this population, as they pay more attention to their health and are more likely to follow the doctors' advice and modify their lifestyles than those who do not regularly take physical examinations. If the model works for this population, we could test it on other populations in the future. Fourth, the data obtained from electronic medical records from only one hospital may induce selection bias because it may not represent the general population of China. However, as Tongji Hospital locates in the city of Wuhan, which is considered as the geographic midpoint of China, the location might well represent the majority of Chinese cities with patients coming from all over China. The electronic medical records are from the physical examination department of Tongji Hospital, which is the biggest physical examination center in Wuhan where various groups of people choose to go to take the medical examination. Thus, the data may well represent Chinese males. Fifth, the diagnosis methods for CHD varied among different patients, some patients might undergo several kinds of examinations before the diagnosis. Although coronary angiography is a gold-standard examination for the diagnosis of CHD, some CHD patients were still diagnosed by symptoms, electrocardiography and some other examinations or tests without coronary angiography. These may bring potential bias. Sixth, the study has a bias of a loss to follow-up, which should be improved in future studies. Seventh, due to the retrospective and observational nature of our study, participants were not fully further investigated to unambiguously determine cardiovascular end points, which may bring bias. Last but not least, death information was not recorded in this study, thus, we were not able to take death as competing risks into account. However, an existing of competing risks overestimates the risks (46). This phenomenon was not presented in the calibration plot, which indicated that omitting the competing risks did not affect the prediction model much.
Conclusion
We conducted a retrospective cohort study for developing and validating a novel CVD prediction model, CVDMCM. CVDMCM predicted 4-year CVD risk with a better performance than that of the Framingham CVD model and with fewer predictors than those involved in the Wu's simplified model. Thus, this model could be helpful in clinical practices to detect patients at higher risk of CVD, providing appropriate feedback for patients' health.
Data availability statement
The raw data supporting the conclusions of this article will be made available by the authors, without undue reservation.
Ethics statement
The studies involving human participants were reviewed and approved by Medical Ethics Committee at Tongji Medical College, Huazhong University of Science and Technology. The patients/participants provided their written informed consent to participate in this study.
Author contributions
YSh, YaZ, CZ, and TL conceived the project and designed the research study. LR, YuZ, and YSa collected the data of the cohort. CT developed the website. YSh, YL, BC, and LY analyzed data. YSh, YuZ, YaZ, YL, BC, YB, and JL wrote the manuscript. All authors contributed to the article and approved the submitted version.
Funding
This work was supported by the National Key Research and Development Program of China (Grant Number 2020YFC2008002) and Major Technology Innovation of Hubei Province (Program No. 2019ACA141).
Acknowledgments
We would like to thank the general practitioners, especially those at the Department of Geriatrics of Tongji Hospital, Tongji Medical College, Huazhong University of Science and Technology for their dedication, commitment, and contribution.
Conflict of interest
YSh, YaZ, YL, BC, LY, CT, YB, JL, MJ, and TL were employed by BGI-Shenzhen.
The remaining authors declare that the research was conducted in the absence of any commercial or financial relationships that could be construed as a potential conflict of interest.
Publisher's note
All claims expressed in this article are solely those of the authors and do not necessarily represent those of their affiliated organizations, or those of the publisher, the editors and the reviewers. Any product that may be evaluated in this article, or claim that may be made by its manufacturer, is not guaranteed or endorsed by the publisher.
Author disclaimer
The contents do not reflect official views from the Hubei provincial government.
Supplementary material
The Supplementary Material for this article can be found online at: https://www.frontiersin.org/articles/10.3389/fcvm.2022.967097/full#supplementary-material
References
1. Yang Z, Su J, Peng X, Wu N, A. Decline in HIV and syphilis epidemics in chinese female sex workers (2000-2011): a systematic review and meta-analysis. PLoS ONE. (2013) 8:e82451. doi: 10.1371/journal.pone.0082451
2. The Writing Committee of the Report on Cardiovascular Health and Diseases in China. Report on Cardiovascular Health and Diseases in China 2019: an Updated Summary. Chin Med J. (2020) 35:573–603. doi: 10.3967/bes2022.079
3. Khor GL. Cardiovascular epidemiology in the Asia-Pacific region. Asia Pac J Clin Nutr. (2001) 10:76–80. doi: 10.1046/j.1440-6047.2001.00230.x
4. Zhao D, Liu J, Wang M, Zhang X, Zhou M. Epidemiology of cardiovascular disease in China: current features and implications. Nat Rev Cardiol. (2019) 16:203–12. doi: 10.1038/s41569-018-0119-4
5. Anderson KM, Odell PM, Wilson PW, Kannel WB. Cardiovascular disease risk profiles. Am Heart J. (1991) 121:293–8. doi: 10.1016/0002-8703(91)90861-B
6. Anderson KM, Wilson PW, Odell PM, Kannel WB. An updated coronary risk profile. A statement for health professionals. Circulation. (1991) 83:356–62. doi: 10.1161/01.CIR.83.1.356
7. Wilson PW, D'Agostino RB, Levy D, Belanger AM, Silbershatz H, Kannel WB. Prediction of coronary heart disease using risk factor categories. Circulation. (1998) 97:1837–47. doi: 10.1161/01.CIR.97.18.1837
8. Conroy RM, Pyorala K, Fitzgerald AP, Sans S, Menotti A, De Backer G, et al. Estimation of ten-year risk of fatal cardiovascular disease in Europe: the SCORE project. Eur Heart J. (2003) 24:987–1003. doi: 10.1016/S0195-668X(03)00114-3
9. Woodward M, Brindle P, Tunstall-Pedoe H, Sgor. Adding social deprivation and family history to cardiovascular risk assessment: the ASSIGN score from the Scottish Heart Health Extended Cohort (SHHEC). Heart. (2007) 93:172–6. doi: 10.1136/hrt.2006.108167
10. Hippisley-Cox J, Coupland C, Robson J, Brindle P. Derivation, validation, and evaluation of a new QRISK model to estimate lifetime risk of cardiovascular disease: cohort study using QResearch database. BMJ. (2010) 341:c6624. doi: 10.1136/bmj.c6624
11. Hippisley-Cox J, Coupland C, Vinogradova Y, Robson J, May M, Brindle P. Derivation and validation of QRISK, a new cardiovascular disease risk score for the United Kingdom: prospective open cohort study. BMJ. (2007) 335:136. doi: 10.1136/bmj.39261.471806.55
12. Wu Y, Liu X, Li X, Li Y, Zhao L, Chen Z, et al. Estimation of 10-year risk of fatal and nonfatal ischemic cardiovascular diseases in Chinese adults. Circulation. (2006) 114:2217–25. doi: 10.1161/CIRCULATIONAHA.105.607499
13. Yang X, Li J, Hu D, Chen J, Li Y, Huang J, et al. Predicting the 10-year risks of atherosclerotic cardiovascular disease in chinese population: the China-PAR project (Prediction for ASCVD Risk in China). Circulation. (2016) 134:1430–40. doi: 10.1161/CIRCULATIONAHA.116.022367
14. Lv J, Yu C, Guo Y, Bian Z, Yang L, Chen Y, et al. Adherence to healthy lifestyle and cardiovascular diseases in the chinese population. J Am Coll Cardiol. (2017) 69:1116–25. doi: 10.1016/j.jacc.2016.11.076
15. Perez-Lopez FR, Larrad-Mur L, Kallen A, Chedraui P, Taylor HS. Gender differences in cardiovascular disease: hormonal and biochemical influences. Reprod Sci. (2010) 17:511–31. doi: 10.1177/1933719110367829
16. Yang ZJ, Liu J, Ge JP, Chen L, Zhao ZG, Yang WY, et al. Prevalence of cardiovascular disease risk factor in the Chinese population: the 2007-2008 China National Diabetes and Metabolic Disorders Study. Eur Heart J. (2012) 33:213–20. doi: 10.1093/eurheartj/ehr205
17. Collins GS, Reitsma JB, Altman DG, Moons KG. Transparent reporting of a multivariable prediction model for individual prognosis or diagnosis (TRIPOD): the TRIPOD statement. Bmj. (2015) 350:g7594. doi: 10.1136/bmj.g7594
18. D'Agostino RB, Vasan RS, Pencina MJ, Wolf PA, Cobain M, Massaro JM, et al. General cardiovascular risk profile for use in primary care: the Framingham. Heart Study Circulation. (2008) 117:743–53. doi: 10.1161/CIRCULATIONAHA.107.699579
19. Joseph Loscalzo M-H. Harrison's Cardiovascular Medicine. 3rd ed. McGraw-Hill Professional (2016).
20. Riley RD, Ensor J, Snell KIE, Harrell FE, Martin GP, Reitsma JB, et al. Calculating the sample size required for developing a clinical prediction model. BMJ. (2020) 368:m441. doi: 10.1136/bmj.m441
21. Siontis GC, Tzoulaki I, Siontis KC, Ioannidis JP. Comparisons of established risk prediction models for cardiovascular disease: systematic review. BMJ. (2012) 344:e3318. doi: 10.1136/bmj.e3318
22. Yucel RM. Multiple imputation inference for multivariate multilevel continuous data with ignorable non-response. Philos Trans A Math Phys Eng Sci. (2008) 366:2389–403. doi: 10.1098/rsta.2008.0038
23. Buuren S, Groothuis-Oudshoorn C. MICE: multivariate imputation by chained equations in R. J Stat Softw. (2011) 45:1–67. doi: 10.18637/jss.v045.i03
24. Shan Y, Tromp G, Kuivaniemi H, Smelser DT, Verma SS, Ritchie MD, et al. Genetic risk models: influence of model size on risk estimates and precision. Genet Epidemiol. (2017) 41:282–96. doi: 10.1002/gepi.22035
25. Liu S, Li Y, Zeng X, Wang H, Yin P, Wang L, et al. Burden of cardiovascular diseases in China, 1990-2016: findings from the 2016 global burden of disease study. JAMA Cardiol. (2019) 4:342–52. doi: 10.1001/jamacardio.2019.0295
26. Collins GS, Reitsma JB, Altman DG, Moons KG. Transparent reporting of a multivariable prediction model for individual prognosis or diagnosis (TRIPOD). Ann Intern Med. (2015) 162:735–6. doi: 10.7326/L15-5093-2
27. Swets JA. Measuring the accuracy of diagnostic systems. Science (New York, NY). (1988) 240:1285–93. doi: 10.1126/science.3287615
28. Hippisley-Cox J, Coupland C, Brindle P. Development and validation of QRISK3 risk prediction algorithms to estimate future risk of cardiovascular disease: prospective cohort study. BMJ. (2017) 357:j2099. doi: 10.1136/bmj.j2099
29. Damen JA, Pajouheshnia R, Heus P, Moons KGM, Reitsma JB, Scholten R, et al. Performance of the Framingham risk models and pooled cohort equations for predicting 10-year risk of cardiovascular disease: a systematic review and meta-analysis. BMC Med. (2019) 17:109. doi: 10.1186/s12916-019-1340-7
30. Alves-Cabratosa L, Garcia-Gil M, Comas-Cufi M, Blanch J, Ponjoan A, Marti-Lluch R, et al. Role of low ankle-brachial index in cardiovascular and mortality risk compared with major risk conditions. J Clin Med. (2019) 8:870. doi: 10.3390/jcm8060870
31. Velescu A, Clara A, Penafiel J, Ramos R, Marti R, Grau M, et al. Adding low ankle brachial index to classical risk factors improves the prediction of major cardiovascular events. The REGICOR study. Atherosclerosis. (2015) 241:357–63. doi: 10.1016/j.atherosclerosis.2015.05.017
32. Ohkuma T, Ninomiya T, Tomiyama H, Kario K, Hoshide S, Kita Y, et al. Brachial-ankle pulse wave velocity and the risk prediction of cardiovascular disease: an individual participant data meta-analysis. Hypertension. (2017) 69:1045–52. doi: 10.1161/HYPERTENSIONAHA.117.09097
33. Simic S, Svagusa T, Prkacin I, Bulum T. Relationship between hemoglobin A1c and serum troponin in patients with diabetes and cardiovascular events. J Diabetes Metab Disord. (2019) 18:693–704. doi: 10.1007/s40200-019-00460-9
34. Inserra F, Forcada P, Castellaro A, Castellaro C. Chronic kidney disease and arterial stiffness: a two-way path. Front Med (Lausanne). (2021) 8:765924. doi: 10.3389/fmed.2021.765924
35. Hassanein M, Shafi T. Assessment of glycemia in chronic kidney disease. BMC Med. (2022) 20:117. doi: 10.1186/s12916-022-02316-1
36. Lan Y, Liu H, Liu J, Zhao H, Wang H. Is serum total bilirubin a predictor of prognosis in arteriosclerotic cardiovascular disease? A meta-analysis. Medicine (Baltimore). (2019) 98:e17544. doi: 10.1097/MD.0000000000017544
37. Breimer LH, Wannamethee G, Ebrahim S, Shaper AG. Serum bilirubin and risk of ischemic heart disease in middle-aged British men. Clin Chem. (1995) 41:1504–8. doi: 10.1093/clinchem/41.10.1504
38. Schwertner HA, Jackson WG, Tolan G. Association of low serum concentration of bilirubin with increased risk of coronary artery disease. Clin Chem. (1994) 40:18–23. doi: 10.1093/clinchem/40.1.18
39. Basiglio CL, Arriaga SM, Pelusa F, Almara AM, Kapitulnik J, Mottino AD. Complement activation and disease: protective effects of hyperbilirubinaemia. Clin Sci (Lond). (2009) 118:99–113. doi: 10.1042/CS20080540
40. Haga Y, Tempero MA, Zetterman RK. Unconjugated bilirubin inhibits in vitro cytotoxic T lymphocyte activity of human lymphocytes. Biochim Biophys Acta. (1996) 1317:65–70. doi: 10.1016/0925-4439(96)00039-7
41. Wallner M, Marculescu R, Doberer D, Wolzt M, Wagner O, Vitek L, et al. Protection from age-related increase in lipid biomarkers and inflammation contributes to cardiovascular protection in Gilbert's syndrome. Clin Sci (Lond). (2013) 125:257–64. doi: 10.1042/CS20120661
42. Zhu M, Liu X, Liu W, Lu Y, Cheng J, Chen Y. Beta cell aging and age-related diabetes. Aging (Albany NY). (2021) 13:7691–706. doi: 10.18632/aging.202593
43. Nunes VS, da Silva Ferreira G, Quintao ECR. Cholesterol metabolism in aging simultaneously altered in liver and nervous system. Aging (Albany NY). (2022) 14:1549–61. doi: 10.18632/aging.203880
44. Brand EC, Elias SG, Minderhoud IM, van der Veen JJ, Baert FJ, Laharie D, et al. Systematic review and external validation of prediction models based on symptoms and biomarkers for identifying endoscopic activity in crohn's disease. Clin Gastroenterol Hepatol. (2020) 18:1704–18. doi: 10.1016/j.cgh.2019.12.014
45. Fu X, Xu T. Interpretation of annual report on cardiovascular health and diseases in China 2019. Cardiol Discover. (2019). 4:269–84. doi: 10.1097/CD9.0000000000000040
Keywords: cardiovascular diseases, prediction model, Chinese males, retrospective cohort study, chronic disease prevention
Citation: Shan Y, Zhang Y, Zhao Y, Lu Y, Chen B, Yang L, Tan C, Bai Y, Sang Y, Liu J, Jian M, Ruan L, Zhang C and Li T (2022) Development and validation of a cardiovascular diseases risk prediction model for Chinese males (CVDMCM). Front. Cardiovasc. Med. 9:967097. doi: 10.3389/fcvm.2022.967097
Received: 16 June 2022; Accepted: 02 November 2022;
Published: 18 November 2022.
Edited by:
Ajay Gupta, Queen Mary University of London, United KingdomReviewed by:
Nikolai Paul Pace, University of Malta, MaltaStefan Gross, University Medicine Greifswald, Germany
Maryam Keshtkar Jahromi, Johns Hopkins University, United States
Copyright © 2022 Shan, Zhang, Zhao, Lu, Chen, Yang, Tan, Bai, Sang, Liu, Jian, Ruan, Zhang and Li. This is an open-access article distributed under the terms of the Creative Commons Attribution License (CC BY). The use, distribution or reproduction in other forums is permitted, provided the original author(s) and the copyright owner(s) are credited and that the original publication in this journal is cited, in accordance with accepted academic practice. No use, distribution or reproduction is permitted which does not comply with these terms.
*Correspondence: Tao Li, bGl0YW8yQGdlbm9taWNzLmNu; Cuntai Zhang, Y3R6aGFuZzA0MjVAMTYzLmNvbQ==
†These authors have contributed equally to this work