 Tong Yu
 Jialin Song2,†
- 1Pharmacy Laboratory, College of Pharmacy, Shenyang Pharmaceutical University, Benxi, China
- 2Microbiology laboratory, College of Life Sciences and Pharmacy, Shenyang Pharmaceutical University, Benxi, China
- 3Department of Encephalopathy, Internal Medicine Department, Liaoning University of Traditional Chinese Medicine Affiliated Second Hospital, Shenyang, China
- 4Electrical Engineering, Information Engineering College, Shenyang University of Chemical Technology, Shenyang, China
Objective: Post-thrombotic syndrome (PTS) is the most common long-term complication in patients with deep venous thrombosis, and the prevention of PTS remains a major challenge in clinical practice. Some studies have explored early predictors and constructed corresponding prediction models, whereas their specific application and predictive value are controversial. Therefore, we conducted this systematic evaluation and meta-analysis to investigate the incidence of PTS and the feasibility of early prediction.
Methods: We systematically searched databases of PubMed, Embase, Cochrane and Web of Science up to April 7, 2023. Newcastle-Ottawa Scale (NOS) was used to evaluate the quality of the included articles, and the OR values of the predictors in multi-factor logistic regression were pooled to assess whether they could be used as effective independent predictors.
Results: We systematically included 20 articles involving 8,512 subjects, with a predominant onset of PTS between 6 and 72 months, with a 2-year incidence of 37.5% (95% CI: 27.8–47.7%). The results for the early predictors were as follows: old age OR = 1.840 (95% CI: 1.410–2.402), obesity or overweight OR = 1.721 (95% CI: 1.245–2.378), proximal deep vein thrombosis OR = 2.335 (95% CI: 1.855–2.938), history of venous thromboembolism OR = 3.593 (95% CI: 1.738–7.240), history of smoking OR = 2.051 (95% CI: 1.305–3.224), varicose veins OR = 2.405 (95% CI: 1.344–4.304), and baseline Villalta score OR = 1.095(95% CI: 1.056–1.135). Meanwhile, gender, unprovoked DVT and insufficient anticoagulation were not independent predictors. Seven studies constructed risk prediction models. In the training set, the c-index of the prediction models was 0.77 (95% CI: 0.74–0.80) with a sensitivity of 0.75 (95% CI: 0.68–0.81) and specificity of 0.69 (95% CI: 0.60–0.77). In the validation set, the c-index, sensitivity and specificity of the prediction models were 0.74(95% CI: 0.69–0.79), 0.71(95% CI: 0.64–0.78) and 0.72(95% CI: 0.67–0.76), respectively.
Conclusions: With a high incidence after venous thrombosis, PTS is a complication that cannot be ignored in patients with venous thrombosis. Risk prediction scoring based on early model construction is a feasible option, which helps to identify the patient's condition and develop an individualized prevention program to reduce the risk of PTS.
1. Introduction
Post-thrombotic syndrome (PTS) is a chronic and common complication of deep vein thrombosis (DVT) (1), mainly caused by damage to the blood vessel wall and the obstruction of venous return due to venous thrombosis (2). The main symptoms of PTS include edema, lower extremity pain, pigmentation changes, skin pruritus, ulcers, etc., but early DVT is usually asymptomatic, resulting in inadequate or delayed diagnosis due to a lack of awareness of risk factors and symptoms. Meanwhile, PTS can cause severe disability and impaired quality of life and require significant health care costs (1, 3).
Global, multicenter epidemiological data on PTS are lacking, but studies have shown that the cumulative incidence of PTS plateaus 1–2 years after onset and that the incidence of severe PTS, including venous ulcers, continues to accumulate, with up to one-third of patients developing the disease at 6 years (4). A study (5) showed that in the United States National Hospital Discharge Survey during 2007–2009, annual VTE-related hospitalizations involved 547,596 adult patients out of a population of 307 million. At the same time, the pathophysiological changes in PTS include a complex series of processes, and endoluminal treatment alone cannot resolve all of the patient's signs and symptoms, and the recurrence rate after surgery is extremely high. Therefore, improving the level of DVT prevention and treatment is essential to reduce PTS.
With the rapid development of the medical environment and medical technology, systematic knowledge of the incidence of PTS can help develop prevention and control strategies for the disease in clinical practice. There is currently a lack of evidence-based proof and comprehensive understanding of the onset and early predictors of PTS, as well as a lack of clinically validated risk prediction tools for the early prediction of PTS, which poses a serious challenge to the clinical prevention and management of PTS (6). In this context, researchers have started to explore valid predictors and attempted to construct risk assessment tools based on these valid predictors, while the predictive value and predictors of these risk assessment tools are controversial. Hence, we conducted this systematic evaluation and meta-analysis to describe disease incidence from an evidence-based perspective and to comprehensively summarize the predictive value of effective independent predictors and prediction models constructed based on predictors, in order to provide a valuable reference for the evaluation of subsequent risk prediction models.
2. Methods
2.1. Study registration
The present study was conducted in accordance with the Preferred Reporting Items for Systematic Reviews and Meta-Analyses (PRISMA 2020) and prospectively registered on PROSPERO (ID: CRD42023417848).
2.2. Eligibility criteria
Inclusion criteria:
(1) Patients with confirmed deep venous thrombosis were included in the study (Figure 1);
(2) The study types were RCTs, case-control studies, cohort studies, and nested case-control studies;
(3) The prediction model of PTS was completely constructed or the risk factor analysis of PTS was conducted;
(4) In the research of prediction model, the studies without external validation were also included in this systematic review;
(5) Research on different types of machine learning published on the same dataset;
(6) Included literature reported in English.
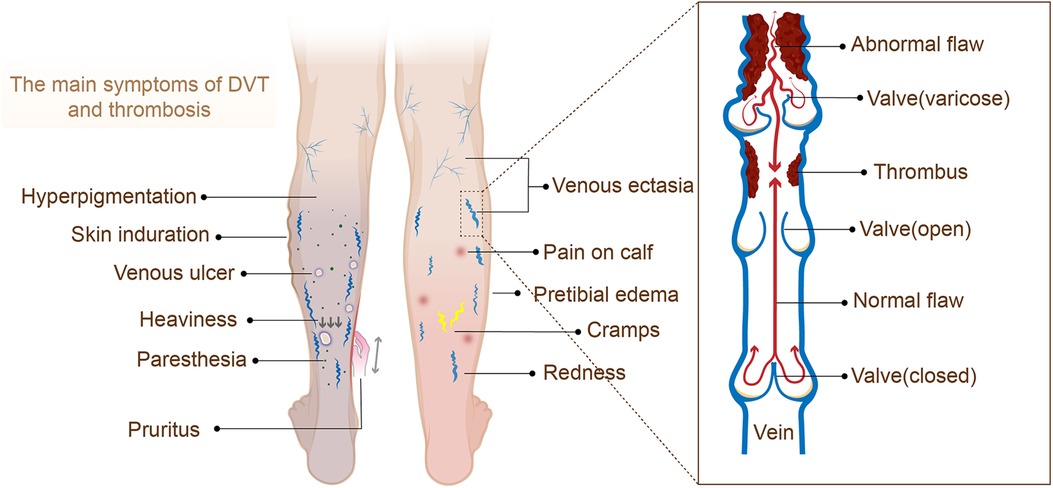
Figure 1. The main symptoms of DVT and thrombosis.
Exclusion criteria:
(7) The research types were meta-analyses, reviews, guidelines, expert opinions, etc.;
(8) Risk factor analysis was not performed and a complete machine learning model was not constructed;
(9) Studies with rather small sample sizes (<50 cases);
(10) Validation studies of mature scales alone;
2.3. Data sources and search strategy
We systematically searched PubMed, Embase, Cochrane and Web of Science databases until 7 April 2023. The search was conducted in the form of subject terms and free words, with no restrictions on regions. The detailed search strategies are shown in Supplementary Material S1.
2.4. Study selection and data extraction
In this systematic review, EndNote was first used to de-duplicate the retrieved literature, and then we initially screened eligible original studies by reading the titles and abstracts and downloaded their full text. Next, we further read the full text to screen the original studies that met the requirements of our review.
Before data extraction, a standardized spreadsheet was used to develop a data extraction plan. The extraction information included title, first author, publication year, author's country, study type, patient source, background disease, diagnostic criteria for post-thrombotic syndrome, follow-up duration, number of post-thrombotic syndrome cases, the total number of cases, number of post-thrombotic syndrome cases in the training set, the total number of cases in the training set, generation method of the validation set, overfitting method, number of post-thrombotic syndrome cases in the validation set, the total number of cases in the validation set, missing value processing method, variable screening, type of model used, modeling variables.
The above literature screening was carried out by two investigators (Tong Yu and Jialin Song). After the completion of cross-checking, the third researcher (Lingke Yu) was asked to assist in adjudicating if there was any dispute.
2.5. Assessment of study quality
The original types of studies included in our systematic review were cohort or case-control studies, and thus we adopted the Newcastle-Ottawa Scale (NOS) to evaluate the quality of the included original studies (7). The variable applies to cohort studies and pathologically controlled studies, and the quality evaluation is mainly conducted from eight questions in three fields. Except for the full score of 2 points for comparability, the full score of the remaining seven questions is 1 point. A score of 7 to 9 was considered a high-quality study and a score of 4 to 7 was defined as a moderate-quality study.
For this study, two evaluators (Tong Yu and Jialin Song) performed a risk of bias assessment using NOS and cross-checked. If there was any discrepancy in the evaluation, the third evaluator (Wanlin Deng) was invited to participate in the decision.
2.6. Outcomes
In this systematic review, we pooled the incidence rates in cohort studies. The incidence of PTS was calculated as the percentage of subjects with PTS in each cohort study. The odds ratio (OR) of each predictor was derived from multivariate logistic/cox regression or ORs adjusted for other confounders. The c-index, sensitivity, and specificity of the prediction model constructed based on these predictors were used to reflect its overall accuracy. The primary outcomes encompassed the incidence of PTS and the c-index, sensitivity, and specificity of the prediction model. The secondary outcome was the ORs of predictors under multivariate analysis.
2.7. Synthesis methods
When performing independent predictor analyses, to avoid the influence of confounding factors, we extracted ORs from multivariate logistic/cox regressions from original studies or those adjusted for other confounding factors for meta-analysis. A random-effects model was used when the heterogeneity index I2 > 50% in the meta-analysis of the OR of the predictors and subgroup analysis was performed according to the different levels of each predictor.
In addition, our outcome measures included indicators to evaluate the accuracy of the machine learning model (c-index, sensitivity, and specificity). When evaluating the c-index, we prioritized the use of a random-effects model for data processing due to differences in the inclusion of variables and inconsistent parameters across machine-learning models.
For the c-index with missing 95% confidence intervals and standard errors, we referred to the study of Debray TP et al. (8) and estimated the standard errors. Also, we performed a meta-analysis of sensitivity and specificity using a bivariate mixed-effects model. The meta-analysis of this study was conducted based on R4.2.0 (R development Core Team, Vienna, http://www.R-project.org).
3. Results
3.1. Study selection
A total of 2,375 papers were retrieved, 603 of which were duplicates, and 28 eligible studies were included according to the titles and abstracts. Twenty studies (9–28) were retained after full-text review. The literature screening process is shown in Figure 2.
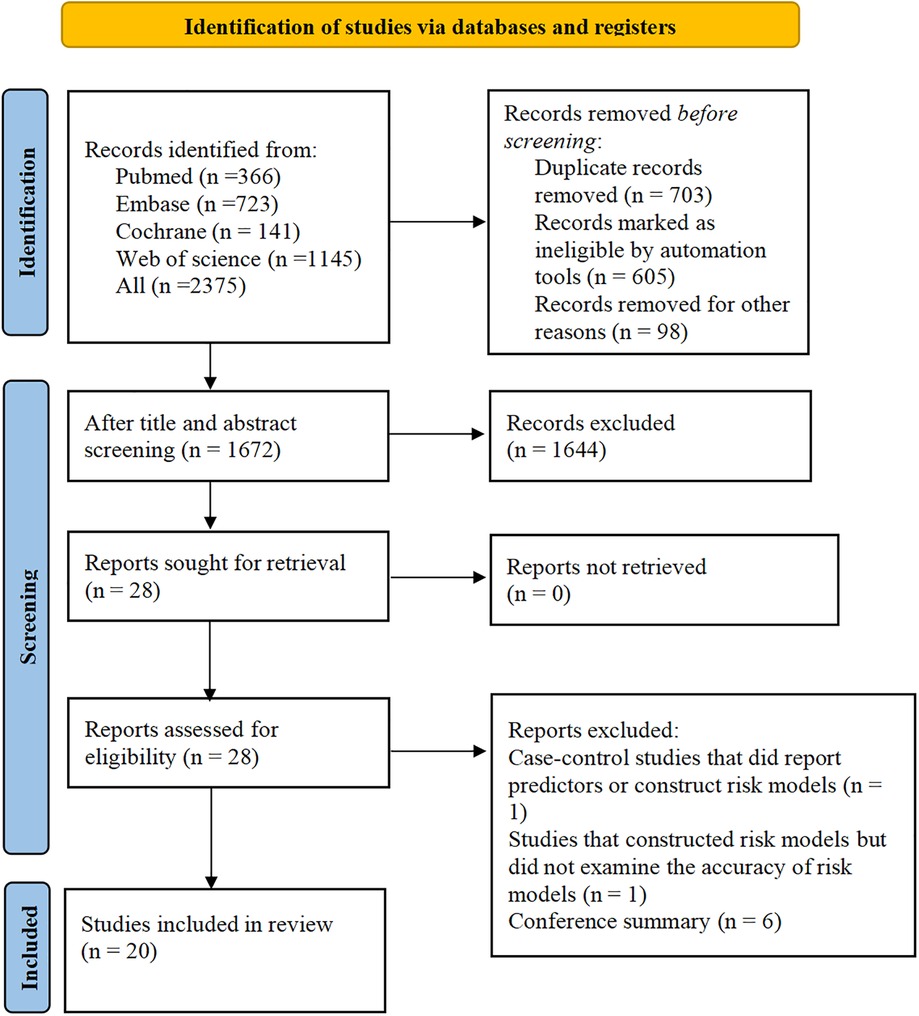
Figure 2. Literature selection process.
3.2. Study characteristics
The present study included 20 studies altogether, with a total number of 8,512 cases and 3,219 cases of morbidities. The period of publication is mainly from 2016 to 2023. The countries of publication included China (9, 11, 12, 18, 21), Norway (10, 28), Canada (13), the Netherlands (14, 16, 25), Japan (15), Indonesia (17), Australia (19), Switzerland (20), Israel (22, 23), Pakistan (24) and Poland (26, 27). For the background of morbidity, only one of the studies (10) reported a background of pregnancy-related venous thrombosis, while the remaining 19 had a background of deep vein thrombosis (DVT). As for the diagnostic criteria of PTS, two studies (14, 15) used the CEAP score (CEAP score ≥3) and the remaining 18 used the Villalta score (Villalta score ≥5). Among the 18 studies adopting the Villalta score, four used a new scale developed on the basis of the Villalta score to assess PTS, one (18) employed the Villalta score combined with the APTSD score, two (22, 23) used the Villalta score with SOX-PTS score, and one (16) used Villalta score and LET grading score. The follow-up period of the articles ranged from 3 months to 72 months. Seven articles (9, 11, 12, 18, 21, 25) constructed risk prediction tools with independent validation sets, with a total of 21 prediction models constructed, which were mainly based on logistic regression. Sixteen of the included articles were cohort studies. Table 1 shows the basic information.
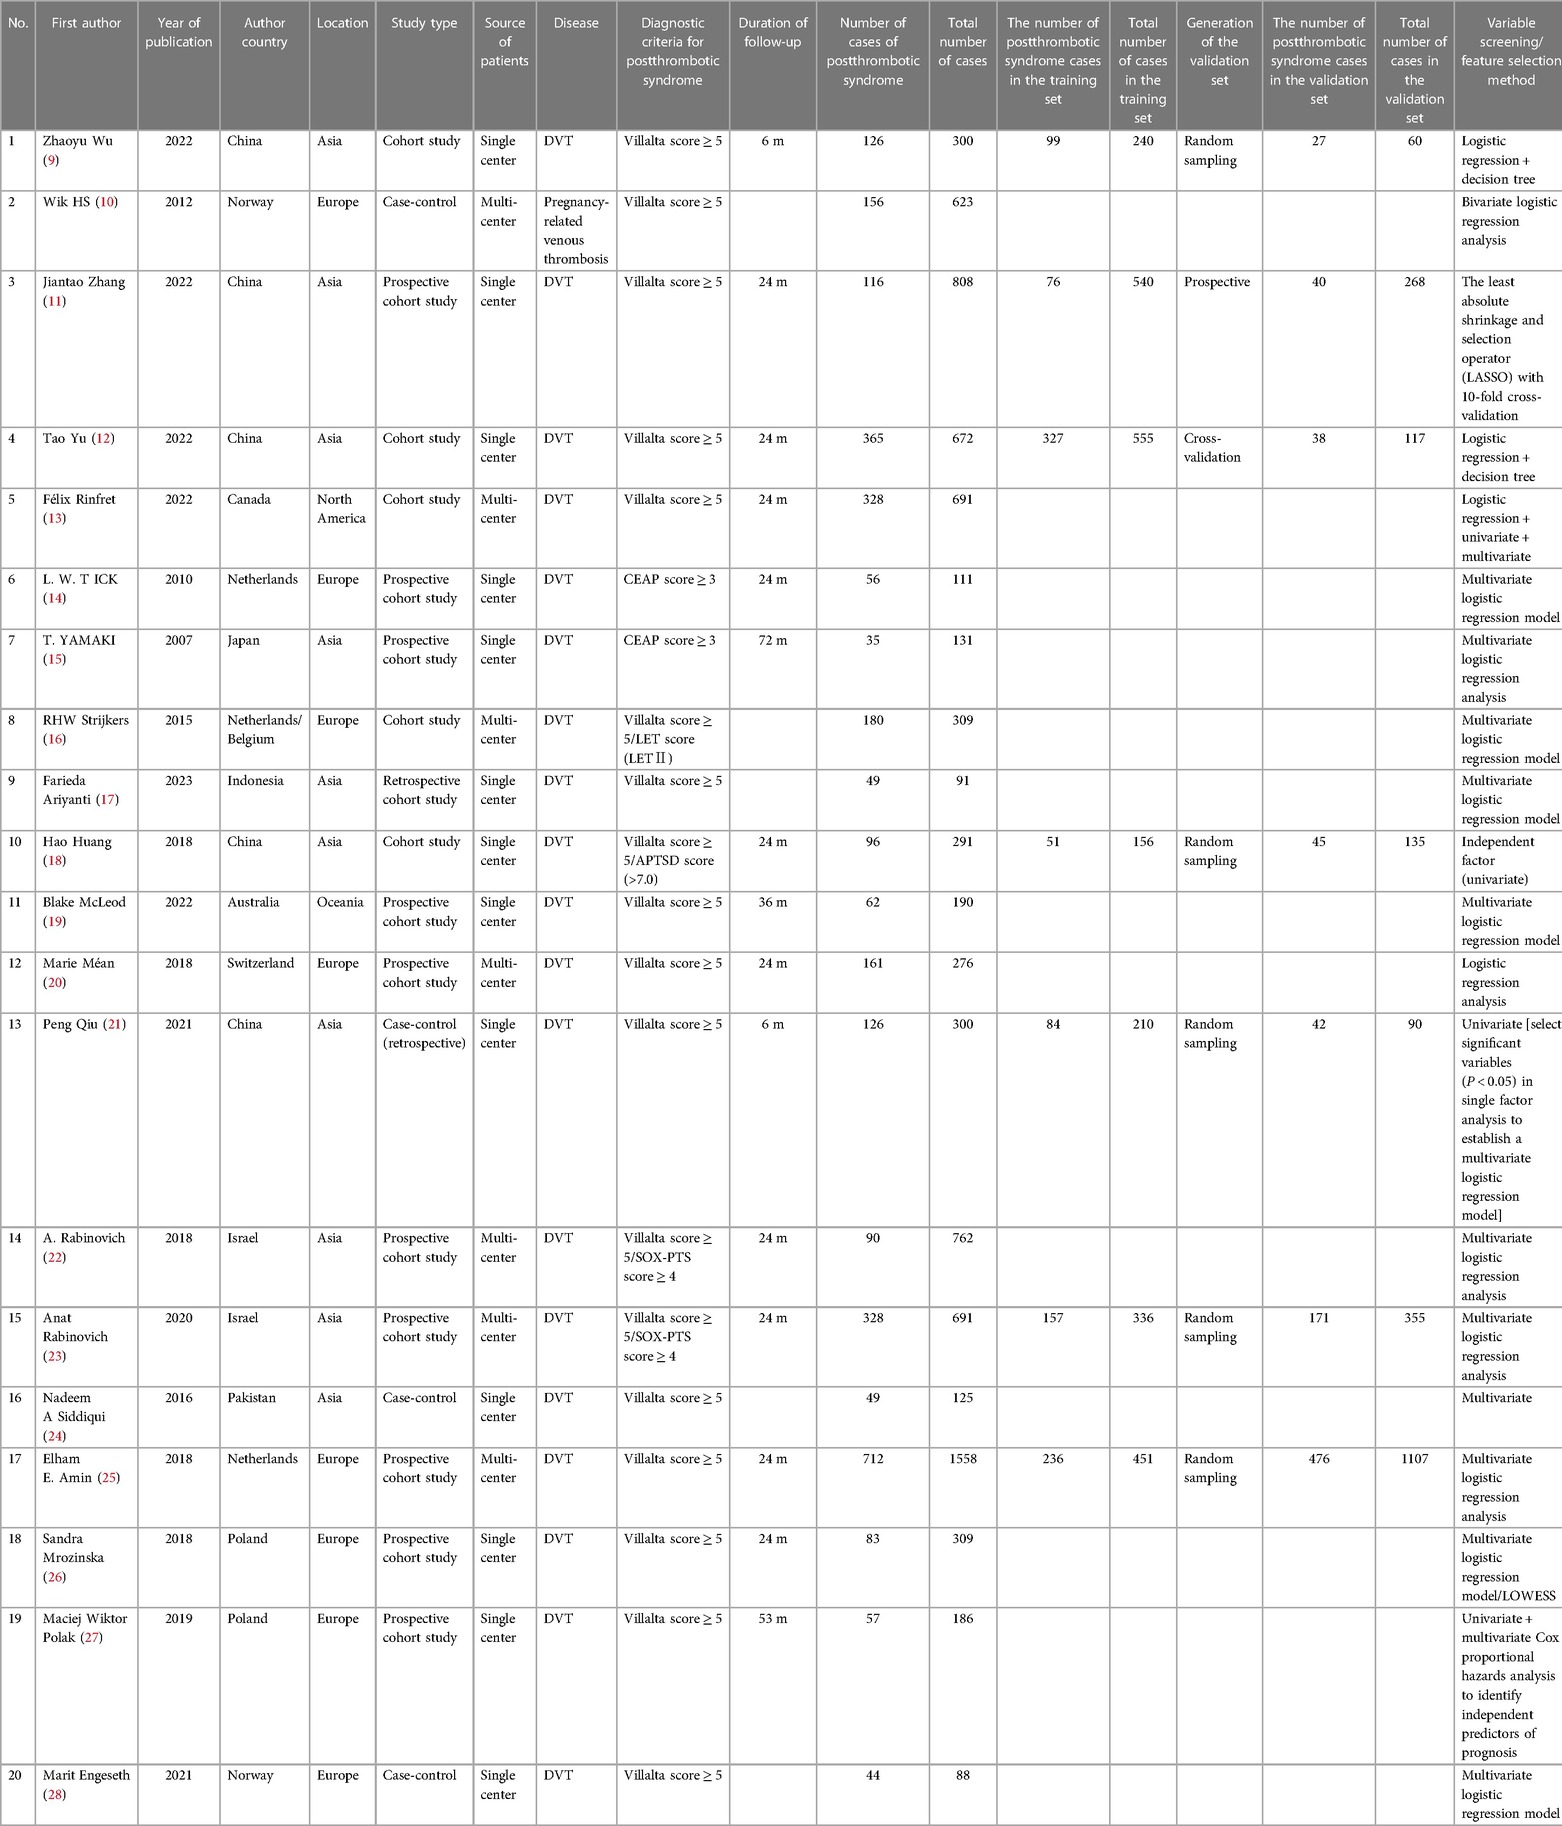
Table 1. Basic characteristics of the included studies.
3.3. Assessment of study quality
Newcastle-Ottawa Scale (NOS) was used to evaluate the quality of the included articles. There were six 9-point articles, seven 8-point articles, six 7-point articles, and one 6-point article. In the cohort studies, scores were not obtained mainly in the three areas of representativeness of the exposure cohort, assessment of outcome events, and completeness of follow-up. In case-control studies, there were no scores for control selection and non-response rates. The specific assessment results are provided in Table 2.
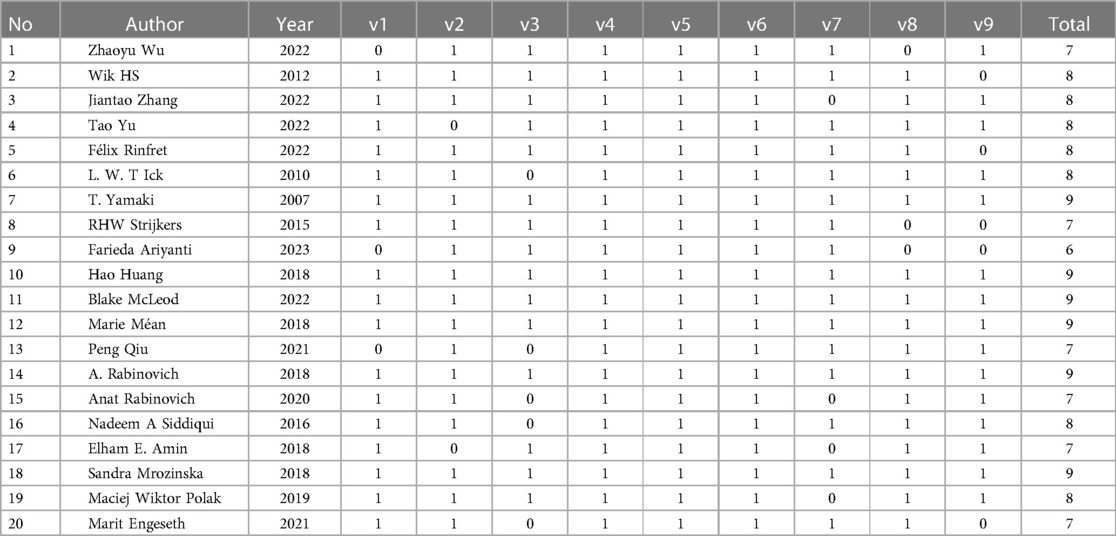
Table 2. Results of quality evaluation of the included literature by NOS scale.
3.4. Meta-analysis
3.4.1. Incidence of post-thrombotic syndrome
3.4.1.1. Synthesized results
In the 16 cohort studies, the incidence of PTS was followed up for a maximum of 2 years, with a 2-year incidence of 37.5% (95%CI, 27.8–47.7%). In addition, there were differences in the incidence rates among countries within 2 years (Range: 26.86%−58.33%). Funnel plots showed the presence of publication bias between studies, while Begg's test and Egger's test revealed no publication bias between studies (Begg's test P = 0.928, Egger's test P = 0.096), as shown in Table 3, Figure 3 and Supplementary Figures S1–S2.
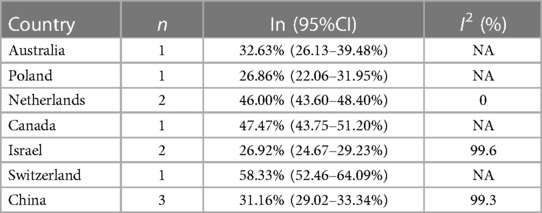
Table 3. Two-year incidence of PTS in different countries.
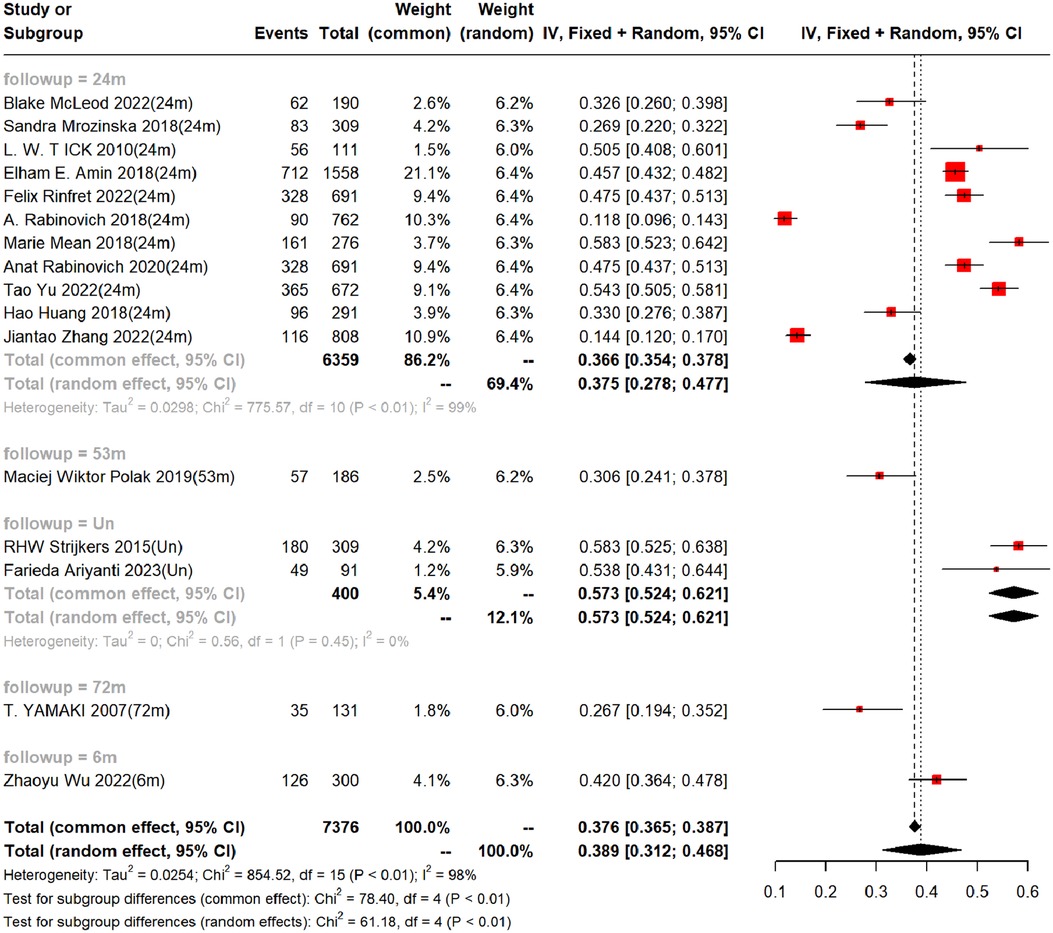
Figure 3. Incidence of PTS at different follow-up times. (Un- indicates no follow-up time described).
3.4.2. Independent predictors
These articles covered 51 predictors, with independent predictors primarily including old age, BMI, location of deep vein thrombosis, history of venous thrombosis, history of smoking, SOX-PTS score, varicose veins, and Villalta score. The OR values of these predictors were: old age OR = 1.840 (95% CI: 1.410–2.402; I2 = 49%), obesity or overweight OR = 1.721 (95% CI: 1.245–2.378; I2 = 56%), proximal deep vein thrombosis OR = 2.335 (95% CI: 1.855–2.938; I2 = 0%), history of venous thrombosis OR = 3.593 (95% CI: 1.738–7.240; I2 = 68%), history of smoking OR = 2.051 (95% CI: 1.305–3.224; I2 = 7%), SOX -PTS score ≥4 OR = 4.806 (95% CI:2.921–7. 908; I2 = 0%), varicose veins OR = 2.405 (95% CI:1.344–4.304; I2 = 81%), and persistent increase in baseline Villalta score OR = 1.095 (95% CI:1.056–1.135; I2 = 34%). We also found that gender, unprovoked DVT, and inadequate anticoagulation were not independent predictors (Table 4 and Supplementary Figures S3–S8).
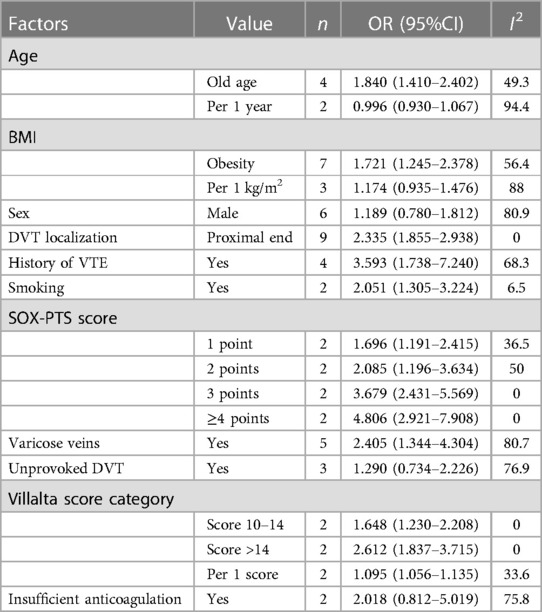
Table 4. Meta-analysis results of early independent predictors of PTS.
Moreover, among the remaining 39 predictors, we found that there was only one study for each predictor, and the results of these predictors need to be carefully interpreted. The detailed results are shown in Supplementary Material S2.
3.4.3. Accuracy of the prediction model
Seven studies constructed risk prediction models. Most of them were nomograms constructed by logistic regression, covering a few other models such as decision trees, random forest, XGBoost, and GBDT. In the training set (Figures 4, 5), the c-index of the prediction models was 0.77 (95%CI: 0.74–0.80), the sensitivity was 0.75 (95%CI: 0.68–0.81) and the specificity was 0.69 (95%CI:0.60–0.77). In the validation set (Figures 4, 6), the c-index, sensitivity and specificity of the prediction models were 0.74 (95%CI: 0.69–0.79), 0.71 (95%CI: 0.64–0.78) and 0.72 (95% CI: 0.67–0.76), respectively. The detailed data are provided in Supplementary Tables S1, S2.
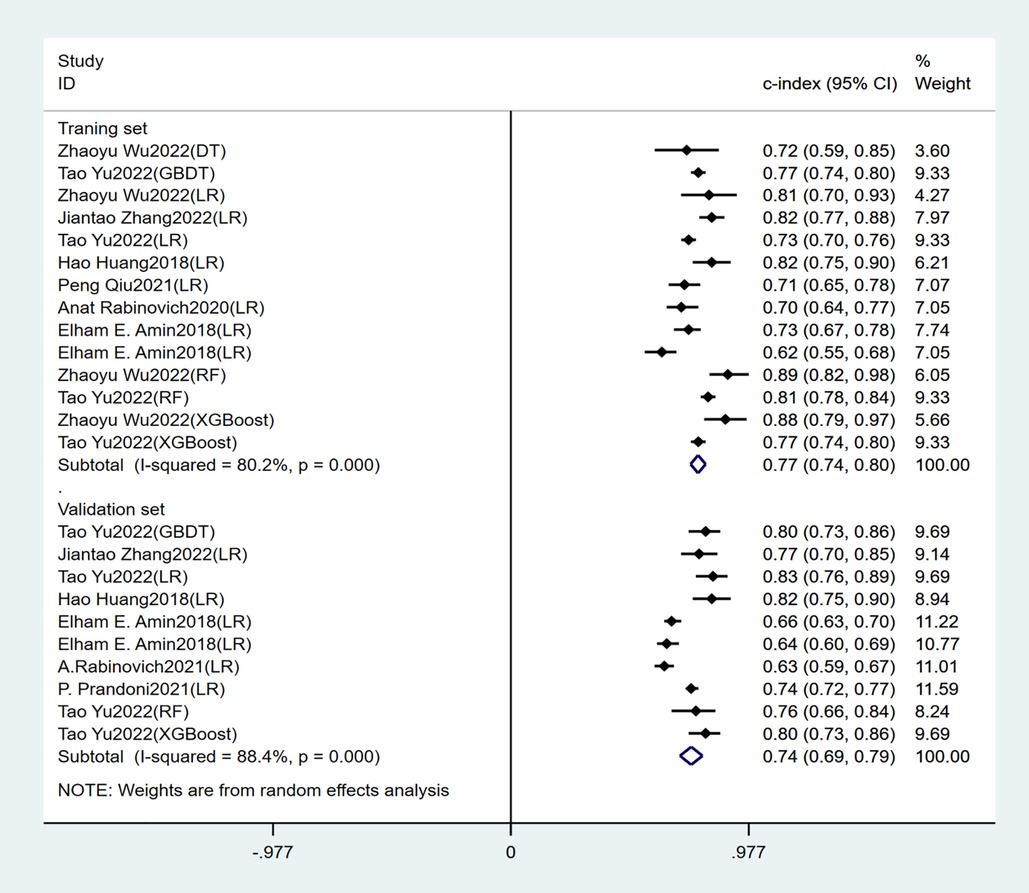
Figure 4. C-index of the training and validation sets of the early-constructed models.
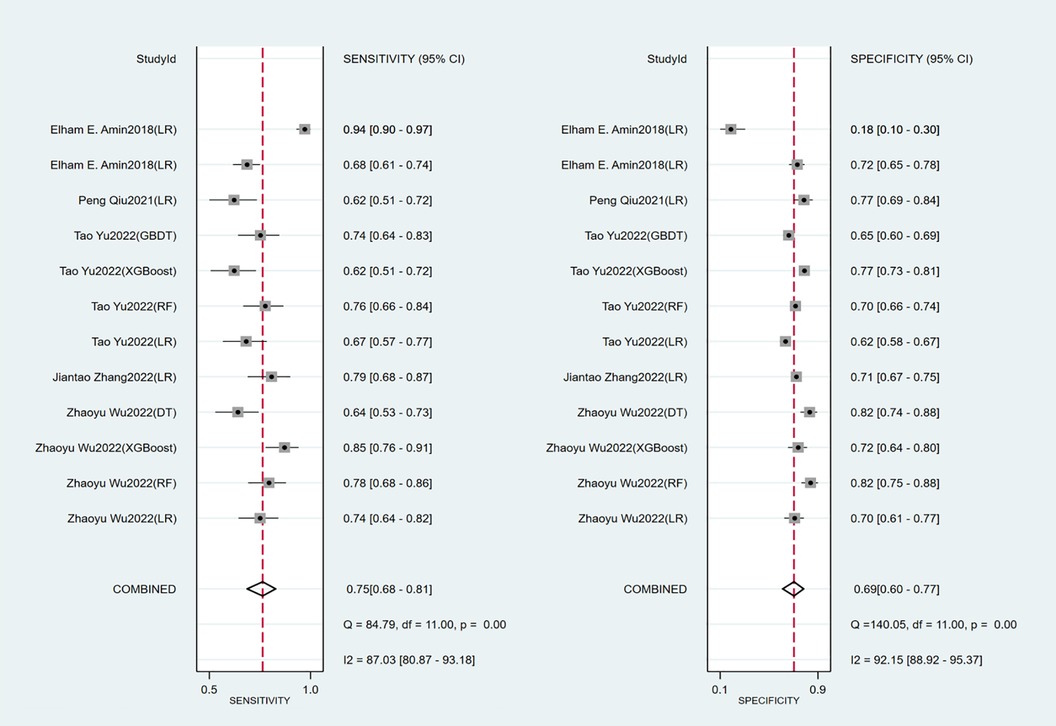
Figure 5. Sensitivity and specificity of the training set of the early-constructed models.
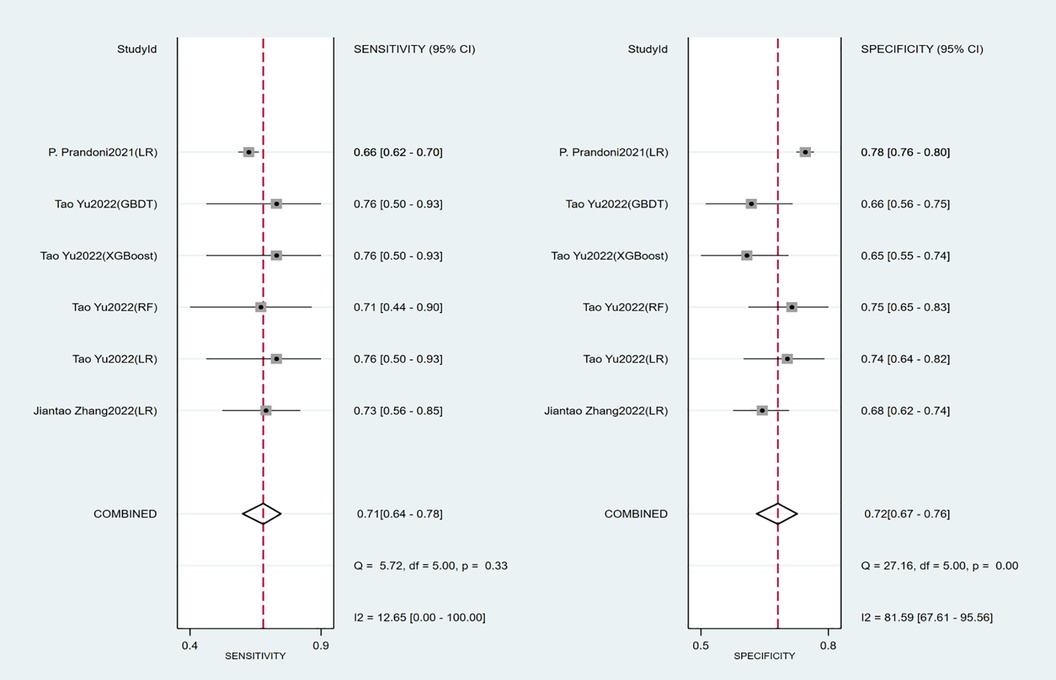
Figure 6. Sensitivity and specificity of the validation set of the early-constructed models.
4. Discussion
4.1. Summary of the main findings
Our study showed that the follow-up of PTS was mainly within 3 years, with a focus on 2-year incidence. The incidence of PTS in our study was 37.5% (95% CI: 27.8–47.7%). We also found huge differences in incidence rates among countries, which may be related to the level of medical treatment and local concern, and We should increase awareness of clinical prevention and control of PTS.
Independent predictors in our systematic review included old age, BMI, DVT location, history of venous thrombosis, smoking history, SOX-PTS score, varicose veins, and baseline Villalta score. The prediction models constructed based on these predictors had good accuracy, with a c-index of 0.77 (95% CI: 0.74–0.80), sensitivity of 0.75 (95% CI: 0.68–0.81), and specificity of 0.69 (95% CI: 0.60–0.77) in the training set. In the validation set, the c-index, sensitivity and specificity of the prediction models were 0.74 (95% CI: 0.69–0.79), 0.71 (95% CI: 0.64–0.78) and 0.72 (95% CI: 0.67–0.76) respectively.
4.2. Comparison with previous studies
Most reviews on PTS focus on summarizing relevant studies on PTS (e.g., long-term therapy (29), anticoagulant selection (30), catheter therapy (31, 32), etc.), describing and explaining the main results, findings and trends of the studies, and drawing conclusions from them. The PTS reviews describe the pathophysiology, risk factors, diagnosis, prevention, and treatment of PTS to improve our understanding of the disease and guide treatment.
As found in the review, two articles [(Kearon et al., 2020 (29) and Kruger et al., 2019 (30)] proposed male as an risk factor of PTS, which is contradictory with our findings. In this study, male OR = 1.189 (95%CI; 0.780–1.812) was not a risk factor of PTS. Meanwhile, Iding AFJ et al., 2023 (33) noted in their study that estrogen use in women reduces the incidence of PTS, so further research is needed to determine whether gender can be used as an independent predictor. Unprovoked DVT is DVT occurring in the absence of a transient risk factor. And the review of Kruger et al. (2019) described unprovoked DVT as an independent predictor, which differs from our findings, as in this paper unprovoked DVT OR = 1.291 (95% CI; 0.742–2.246) could not be regarded as an independent predictor. However, it has been suggested in one article (33) that Unprovoked DVT is closely related to the patient's cardiovascular disease. Therefore, it can be inferred that whether Unprovoked DVT can be an independent predictor is inextricably linked to the status of its study patients.The above may be due to the heterogeneity of the DVT patient population in the studies that included the above predictors and the diversity of clinical manifestations of PTS, leading to different results for independent predictors (34). Based on the present study and several previous studies, the main independent predictors of PTS were old age, obesity, proximal DVT, venous thromboembolism history, and baseline Villalta score. Therefore, the remaining controversial predictors require more research to explore the independent predictors of PTS.
Galanaud et al. 2018 (35), Kearon et al. 2020, INOVICH et al. 2017 (36), and Makedonov et al. 2020 (37) all noted in their studies that the prevalence of PTS was about 20%–50%, of which 5%–10% of patients would develop severe PTS. Kruger et al. 2019 (30) pointed out in a study that the incidence of PTS was 40%. In a meta-analysis (38) on the combined risk of PTS, mainly the risk of PTS caused by distal venous thrombosis, it was estimated that 20% of patients with venous thrombosis would develop PTS, among which 20% would develop severe PTS. The main background of this study is proximal venous thrombosis, the prevalence of which is 37.5% in this paper, probably due to differences in study countries, study populations, tools used to assess PTS, and the time interval between DVT and PTS assessment, making the prevalence of PTS reported in the studies highly variable.
Meanwhile, PTS is mentioned in several studies as significantly reducing the quality of life and being expensive, so early prediction and intervention for PTS is an important direction for treatment (30, 36, 37, 39). Development of risk predictors to predict the risk of PTS at the time of diagnosis of DVT is also ongoing to help guide the long-term treatment of patients with DVT (36). The purpose of this systematic meta-analysis was to comprehensively analyze data on incidence, predictors, and the accuracy and feasibility of predictive models from multiple studies so as to evaluate the predictive value of predictors and machine learning-based predictive models. This study allows us to further explore the causes of morbidity fluctuations, analyze the value of independent predictors and provide a reference for the development of more accurate and reliable machine prediction models, and the conclusions obtained can contribute to future relevant medical decision-making and disease prevention and treatment.
4.3. Advantages and limitations of the study
In this review, a consensus was reached by two independent reviewers at the literature selection stage to reduce the risk of selection bias. Further, this study is the first to focus on the incidence and predictors of PTS from the perspective of a systematic review. A comprehensive analysis of multiple independent predictors eliminates bias and noise in the study, thus estimating the overall effects and confidence intervals more accurately. Meanwhile, by examining the heterogeneity and consistency in different studies, the accuracy and feasibility of the early prediction models of PTS were further revealed, and the reliability of the conclusions was improved.
There are also some limitations in this paper. The number of cases in our included cohort studies was small, which may be due to the insufficient attention paid to venous thrombosis in clinical practice or some countries. Also, some of the predictors were included in a small number of literature reports and need to be interpreted with caution. Among the included literature, a small part of them have built risk prediction models, and thus more large-sample studies are needed for verification.
5. Conclusions
As a complication that cannot be ignored in patients with venous thrombosis, PTS not only has a significant impact on the quality of life, but also causes important health and economic issues. In this case, risk prediction scoring based on early model construction is a feasible scheme, which enables more accurate prediction of diseases with the support of data, so that both physicians and patients can make timely and targeted treatment and preventive measures.
Data availability statement
The original contributions presented in the study are included in the article/Supplementary Material, further inquiries can be directed to the corresponding author.
Author contributions
Conceptualization: TY; Methodology: TY and WD; Formal analysis and investigation: TY, JS, LY and WD; Writing original draft preparation: TY and JS; Writing review and editing: TY; Supervision: TY, and all authors commented on previous versions of the manuscript. All authors contributed to the article and approved the submitted version.
Conflict of interest
The authors declare that the research was conducted in the absence of any commercial or financial relationships that could be construed as a potential conflict of interest.
Publisher's note
All claims expressed in this article are solely those of the authors and do not necessarily represent those of their affiliated organizations, or those of the publisher, the editors and the reviewers. Any product that may be evaluated in this article, or claim that may be made by its manufacturer, is not guaranteed or endorsed by the publisher.
Supplementary material
The Supplementary Material for this article can be found online at: https://www.frontiersin.org/articles/10.3389/fcvm.2023.1250480/full#supplementary-material
References
1. Kahn SR, Shbaklo H, Lamping DL, Holcroft CA, Shrier I, Miron MJ, et al. Determinants of health-related quality of life during the 2 years following deep vein thrombosis. J Thromb Haemost. (2008) 6(7):1105–12. doi: 10.1111/j.1538-7836.2008.03002.x
2. Henke P, Sharma S, Wakefield T, Myers D, Obi A. Insights from experimental post-thrombotic syndrome and potential for novel therapies. Transl Res. (2020) 225:95–104. doi: 10.1016/j.trsl.2020.05.005
3. Duffett L. Deep venous thrombosis. Ann Intern Med. (2022) 175(9):Itc129–itc44. doi: 10.7326/AITC202209200
4. Baldwin MJ, Moore HM, Rudarakanchana N, Gohel M, Davies AH. Post-thrombotic syndrome: a clinical review. J Thromb Haemost. (2013) 11(5):795–805. doi: 10.1111/jth.12180
5. Venous thromboembolism in adult hospitalizations—united States, 2007−2009. MMWR Morb Mortal Wkly Rep. (2012) 61(22):401–4.22672974
6. Kahn SR. The post-thrombotic syndrome: progress and pitfalls. Br J Haematol. (2006) 134(4):357–65. doi: 10.1111/j.1365-2141.2006.06200.x
7. Wells GA, Shea B, O’Connell D, Peterson J, Welch V, Losos M, et al. The Newcastle-Ottawa Scale (NOS) for assessing the quality of nonrandomised studies in meta-analyses. Oxford (2000). Available at: https://www3.med.unipmn.it/dispense_ebm/2009-2010/Corso%20Perfezionamento%20EBM_Faggiano/NOS_oxford.pdf.
8. Debray TP, Damen JA, Riley RD, Snell K, Reitsma JB, Hooft L, et al. A framework for meta-analysis of prediction model studies with binary and time-to-event outcomes. Stat Methods Med Res. (2019) 28(9):2768–86. doi: 10.1177/0962280218785504
9. Wu Z, Li Y, Lei J, Qiu P, Liu H, Yang X, et al. Developing and optimizing a machine learning predictive model for post-thrombotic syndrome in a longitudinal cohort of patients with proximal deep venous thrombosis. J Vasc Surg Venous Lymphat Disord. (2023) 11(3):555–64. e5. doi: 10.1016/j.jvsv.2022.12.006
10. Wik HS, Jacobsen AF, Sandvik L, Sandset PM. Prevalence and predictors for post-thrombotic syndrome 3 to 16 years after pregnancy-related venous thrombosis: a population-based, cross-sectional, case-control study. J Thromb Haemost. (2012) 10(5):840–7. doi: 10.1111/j.1538-7836.2012.04690.x
11. Zhang J, Ma F, Yao J, Hao B, Xu H, Guo X, et al. Development and validation of a clinical prediction model for post thrombotic syndrome following anticoagulant therapy for acute deep venous thrombosis. Thromb Res. (2022) 214:68–75. doi: 10.1016/j.thromres.2022.04.003
12. Yu T, Shen R, You G, Lv L, Kang S, Wang X, et al. Machine learning-based prediction of the post-thrombotic syndrome: model development and validation study. Front Cardiovasc Med. (2022) 9:990788. doi: 10.3389/fcvm.2022.990788
13. Rinfret F, Gu CS, Vedantham S, Kahn SR. New and known predictors of the postthrombotic syndrome: a subanalysis of the ATTRACT trial. Res Pract Thromb Haemost. (2022) 6(6):e12796. doi: 10.1002/rth2.12796
14. Tick LW, Doggen CJ, Rosendaal FR, Faber WR, Bousema MT, Mackaay AJ, et al. Predictors of the post-thrombotic syndrome with non-invasive venous examinations in patients 6 weeks after a first episode of deep vein thrombosis. J Thromb Haemost. (2010) 8(12):2685–92. doi: 10.1111/j.1538-7836.2010.04065.x
15. Yamaki T, Nozaki M, Sakurai H, Takeuchi M, Soejima K, Kono T. High peak reflux velocity in the proximal deep veins is a strong predictor of advanced post-thrombotic sequelae. J Thromb Haemost. (2007) 5(2):305–12. doi: 10.1111/j.1538-7836.2007.02345.x
16. Strijkers RH, Arnoldussen CW, Wittens CH. Validation of the LET classification. Phlebology. (2015) 30(1 Suppl):14–9. doi: 10.1177/0268355515569133
17. Ariyanti F, Sukrisman L, Antono D, Harimurti K. The risk for post-thrombotic syndrome of subjects with deep vein thrombosis in an Indonesian referral hospital: a retrospective cohort study. Thromb J. (2023) 21(1):38. doi: 10.1186/s12959-023-00482-7
18. Huang H, Gu JP, Shi HF, Shi WY, Lu JY, Chen L, et al. Assessment of the probability of post-thrombotic syndrome in patients with lower extremity deep venous thrombosis. Sci Rep. (2018) 8(1):12663. doi: 10.1038/s41598-018-30645-w
19. McLeod B, Lim HY, Nandurkar H, Ho P, Wang J. Overall hemostatic potential assay detects risk of progression to post-thrombotic syndrome in anticoagulated patients following deep vein thrombosis. Diagnostics (Basel, Switzerland). (2022) 12(12):3165. doi: 10.3390/diagnostics12123165
20. Méan M, Limacher A, Alatri A, Aujesky D, Mazzolai L. Derivation and validation of a prediction model for risk stratification of post-thrombotic syndrome in elderly patients with a first deep vein thrombosis. Thromb Haemost. (2018) 118(8):1419–27. doi: 10.1055/s-0038-1661392
21. Qiu P, Liu J, Wan F, Chen Y, Ye K, Qin J, et al. A predictive model for postthrombotic syndrome in proximal deep vein thrombosis patients. Ann Transl Med. (2021) 9(7):558. doi: 10.21037/atm-20-3239
22. Rabinovich A, Ducruet T, Kahn SR. Development of a clinical prediction model for the postthrombotic syndrome in a prospective cohort of patients with proximal deep vein thrombosis. J Thromb Haemost. (2018) 16(2):262–70. doi: 10.1111/jth.13909
23. Rabinovich A, Gu CS, Vedantham S, Kearon C, Goldhaber SZ, Gornik HL, et al. External validation of the SOX-PTS score in a prospective multicenter trial of patients with proximal deep vein thrombosis. J Thromb Haemost. (2020) 18(6):1381–9. doi: 10.1111/jth.14791
24. Siddiqui NA, Sophie Z, Zafar F, Soares D, Naz I. Predictors for the development of post-thrombotic syndrome in patients with primary lower limb deep venous thrombosis: a case-control study. Vascular. (2017) 25(1):10–8. doi: 10.1177/1708538116636250
25. Amin EE, van Kuijk SMJ, Joore MA, Prandoni P, Ten Cate H, Ten Cate-Hoek AJ. Development and validation of a practical two-step prediction model and clinical risk score for post-thrombotic syndrome. Thromb Haemost. (2018) 118(7):1242–9. doi: 10.1055/s-0038-1655743
26. Mrozinska S, Cieslik J, Broniatowska E, Undas A. Elevated leptin and decreased adiponectin independently predict the post-thrombotic syndrome in obese and non-obese patients. Sci Rep. (2018) 8(1):6938. doi: 10.1038/s41598-018-25135-y
27. Polak MW, Siudut J, Plens K, Undas A. Prothrombotic clot properties can predict venous ulcers in patients following deep vein thrombosis: a cohort study. J Thromb Thrombolysis. (2019) 48(4):603–9. doi: 10.1007/s11239-019-01914-w
28. Engeseth M, Enden T, Sandset PM, Wik HS. Predictors of long-term post-thrombotic syndrome following high proximal deep vein thrombosis: a cross-sectional study. Thromb J. (2021) 19(1):3. doi: 10.1186/s12959-020-00253-8
29. Kearon C, Kahn SR. Long-term treatment of venous thromboembolism. Blood. (2020) 135(5):317–25. doi: 10.1182/blood.2019002364
30. Kruger PC, Eikelboom JW, Douketis JD, Hankey GJ. Deep vein thrombosis: update on diagnosis and management. Med J Aust. (2019) 210(11):516–24. doi: 10.5694/mja2.50201
31. Kim KA, Choi SY, Kim R. Endovascular treatment for lower extremity deep vein thrombosis: an overview. Korean J Radiol. (2021) 22(6):931–43. doi: 10.3348/kjr.2020.0675
32. Thukral S, Vedantham S. Catheter-Based therapies and other management strategies for deep vein thrombosis and post-thrombotic syndrome. J Clin Med. (2020) 9(5):1439. doi: 10.3390/jcm9051439
33. Iding AFJ, Pallares Robles A, Ten Cate V, Ten Cate H, Wild PS, Ten Cate-Hoek AJ. Exploring phenotypes of deep vein thrombosis in relation to clinical outcomes beyond recurrence. J Thromb Haemost. (2023) 21(5):1238–47. doi: 10.1016/j.jtha.2023.01.025
34. Urbanek T, Labropoulos N. Can we predict and prevent the postthrombotic syndrome? VASA Z Gefasskrankheiten. (2021) 50(1):11–21. doi: 10.1024/0301-1526/a000932
35. Galanaud JP, Monreal M, Kahn SR. Epidemiology of the post-thrombotic syndrome. Thromb Res. (2018) 164:100–9. doi: 10.1016/j.thromres.2017.07.026
36. Rabinovich A, Kahn SR. The postthrombotic syndrome: current evidence and future challenges. J Thromb Haemost. (2017) 15(2):230–41. doi: 10.1111/jth.13569
37. Makedonov I, Kahn SR, Galanaud JP. Prevention and management of the post-thrombotic syndrome. J Clin Med. (2020) 9(4):923. doi: 10.3390/jcm9040923
38. Turner BRH, Thapar A, Jasionowska S, Javed A, Machin M, Lawton R, et al. Systematic review and meta-analysis of the pooled rate of post-thrombotic syndrome after isolated distal deep venous thrombosis. Eur J Vasc Endovasc Surg. (2023) 65(2):291–7. doi: 10.1016/j.ejvs.2022.10.018
Keywords: post-thrombotic syndrome, venous thrombosis, model prediction, meta-analysis, prospective cohort study
Citation: Yu T, Song J, Yu L and Deng W (2023) A systematic evaluation and meta-analysis of early prediction of post-thrombotic syndrome. Front. Cardiovasc. Med. 10:1250480. doi: 10.3389/fcvm.2023.1250480
Received: 30 June 2023; Accepted: 11 August 2023;
Published: 24 August 2023.
Edited by:
Luca Spiezia, University of Padua, ItalyReviewed by:
Kirill Lobastov, Pirogov Russian National Research Medical University, RussiaAnna Poretto, University of Padua, Italy
© 2023 Yu, Song, Yu and Deng. This is an open-access article distributed under the terms of the Creative Commons Attribution License (CC BY). The use, distribution or reproduction in other forums is permitted, provided the original author(s) and the copyright owner(s) are credited and that the original publication in this journal is cited, in accordance with accepted academic practice. No use, distribution or reproduction is permitted which does not comply with these terms.
*Correspondence: Tong Yu eXQxMzIxNzcyMTgxQDE2My5jb20=
†These authors have contributed equally to this work and share second authorship