Abstract
Background:
Few studies have examined the relationship between nutritional status, as assessed by the Prognostic Nutrition Index (PNI), and incident cardiovascular mortality and all-cause mortality, particularly in hypertensive patients. This study aimed to examine the association between PNI and cardiovascular mortality and all-cause mortality in Americans with hypertension.
Methods:
Data from this retrospective cohort study were obtained from the National Health and Nutrition Examination (NHANES) 1999–2016. Using data of The NHANES Public-Use Linked Mortality Files to assess all-cause mortality (ACM) and cardiovascular mortality (CVM). After excluding participants younger than 18 years, without hypertension, and with missing follow-up data, a total of 18,189 cases were included in this study. Persons with hypertension were divided by PNI into 4 groups: Q1 (PNI < 49.0), Q2 (PNI: 49.0–52.5), Q3 (PNI: 52.5–55.5), and Q4 (PNI > 55.5). We used the Cox proportional hazard regression model to explore the predictive role of PNI on ACM and CVM in American adults with hypertension. Restricted cubic spline (RCS) curves to investigate the existence of a dose-response linear relationship between them.
Result:
During a median follow-up period of 89 months, a total of 1,444 (7.94%) cardiovascular deaths occurred and 5,171 (28.43%) all-cause deaths occurred. Multifactorial COX regression analysis showed all-cause mortality [hazard ratio (HR): 0.584, 95% CI: 0.523–0.652, p < 0.001] and cardiovascular mortality (HR: 0.435, 95% CI: 0.349–0.541, p < 0.001) associated with Q4 group risk of malnutrition in PNI compared to Q1 group. RCS curves showed a nonlinear relationship between PNI and all-cause mortality and cardiovascular mortality (both non-linear p < 0.001).
Conclusions:
Lower PNI levels are associated with mortality in patients with hypertension. PNI may be a predictor of all-cause mortality and cardiovascular mortality risk in patients with hypertension.
1 Introduction
As a common chronic disease, hypertension is a major public health problem and the greatest attributable risk factor for death worldwide (1). It is also a major modifiable risk factor for cardiovascular disease (CVD) and accounts for approximately 45% of global CVD morbidity and mortality (2, 3). Recently, there has been a sustained increase in the prevalence of hypertension globally. The current prevalence of hypertension is approximately 25% among adults and is expected to reach 29% by 2025, equating to approximately 1.55 billion people (4, 5).
Essential hypertension (EHTN) is the most common type of hypertension, accounting for 90%–95% of all cases. EHTN does not have a clear etiology but results from the combined effects of multiple factors (6). Its causes involve genetic susceptibility and environmental influences, while its pathophysiological mechanisms are associated with dysregulation of systems such as the renin-angiotensin-aldosterone system (RAAS), sympathetic nervous activity, and hormonal secretion (7, 8). Furthermore, research has indicated that inflammation is also a critical mechanism in hypertension, characterized by elevated levels of pro-inflammatory cytokines. In many chronic systemic diseases, impaired nutritional status is linked to increased morbidity and mortality (9). Numerous studies have indicated that immunological and nutritional statuses are closely related to cardiovascular progression and prognosis (10, 11). Body mass index (BMI), serum albumin (ALB) level, and pre-albumin (PA) levels are the most commonly used indexes to clinically evaluate nutritional status (12). However, these single indexes have limited clinical application. In recent years, research on the prognostic nutritional index (PNI) has become extremely popular. It was reported that PNI, calculated by serum albumin levels and peripheral lymphocyte, could reflect the nutritional and immunological status (13).
PNI was widely examined in patients with malignancy and in those undergoing surgery (14). Recently, this novel, composite, and objective marker of immunonutritional status indicator was shown to predict mortality in patients with ST elevated myocardial infarction (STEMI), acute heart failure (HF), and stable angina pectoris (SAP) (15, 16). However, the relationship between immunonutritional status and hypertensive cardiac disease has not been studied yet. Therefore, this study aimed to examine the association between PNI and cardiovascular mortality and all-cause mortality in Americans with hypertension.
2 Methods
2.1 Study population
This is a retrospective cohort study that utilized data from the National Health and Nutrition Examination Survey (NHANES). NHANES gathers information from participants every two years. The dataset employed in this study encompasses data from nine NHANES cycles spanning from 1999 to 2016. For this investigation, individuals under the age of 18 were excluded (n = 38,884), as were participants without hypertension (n = 32,635). Furthermore, cases with missing follow-up data (n = 828), serum albumin (n = 1,352), and lymphocytes (n = 174) were excluded, resulting in a final sample of 18,189 individuals (Figure 1). This research received support from the National Center for Health Statistics Research Ethics Review Board, and all participants provided written informed consent.
Figure 1
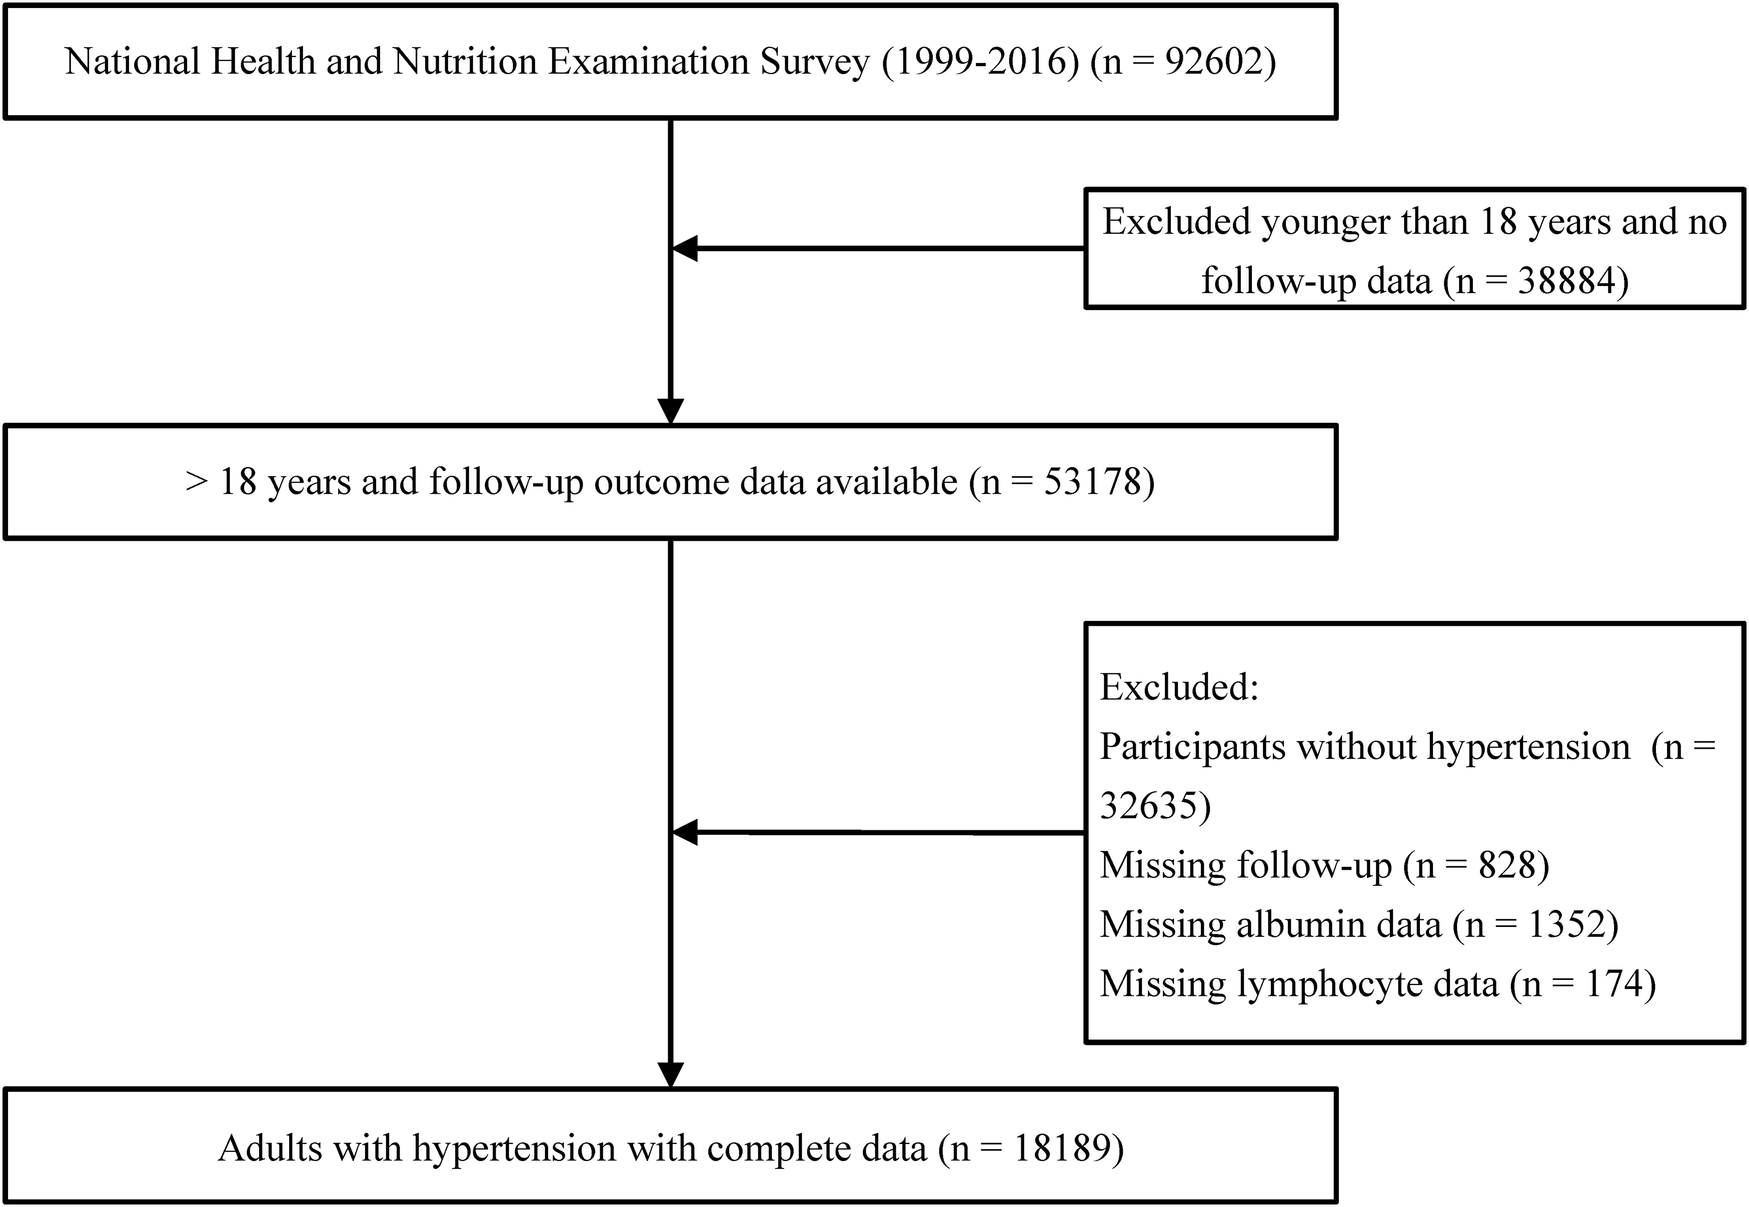
Flow diagram of patient selection.
2.2 Diagnostic criteria for hypertension
First, information regarding hypertension history and the use of antihypertensive medications was collected using a structured questionnaire. Additionally, trained physicians carefully recorded blood pressure readings from the upper arm using a mercury sphygmomanometer. Each participant's blood pressure was measured three consecutive times after resting quietly in a seated position for at least 5 min. The average of these three readings was calculated as the participant's blood pressure. Hypertension was diagnosed if any of the following criteria were met (17): an average systolic blood pressure (SBP) ≥ 140 mmHg, an average diastolic blood pressure (DBP) ≥ 90 mmHg, self-reported history of hypertension, or previous use of antihypertensive medications.
2.3 Nutritional status assessment
In this study, the nutritional status of hypertensive participants was primarily assessed using the PNI. The PNI was calculated using the following formula: serum albumin (g/L) + 5 × total lymphocyte count (109 /L) (18). Additionally, the Geriatric Nutritional Risk Index (GNRI) (19) and Controlling Nutritional Status (CONUT) (20) were separately calculated to compare the results with other scores.
2.5 Covariate collection
To minimize confounding bias, we conducted data analysis by selecting covariates that might influence all-cause mortality in hypertensive patients, based on clinical experience and previous literature (21–23). General demographic information included age, gender, marital status, education, and race. The physical examination encompassed diastolic blood pressure, systolic blood pressure, weight, height, and body mass index (BMI). In addition, we collected a history of a number of lifestyle habits or diseases that may affect hypertension, which included smoking, alcohol consumption, physical activity, use of antihypertensive drugs, diabetes mellitus, cardiovascular disease (CVD), and kidney disease. Further, we collected some laboratory markers that may affect hypertension, which include lymphocytes, neutrophils, serum creatinine, serum uric acid, triglyceride, cholesterol, HDL cholesterol, LDL cholesterol, albumin, and c-reactive protein (CRP). Physical activity status was assessed by the metabolic equivalent of task (MET) and categorized as ideal, moderate, and poor. Based on self-report, smoking history was categorized as present, former, and never. Drinking status is categorized as never, former, mild, moderate or heavy. Cardiovascular disease is defined as having any heart attack, angina, congestive heart failure (CHF), coronary heart disease (CHD), or stroke. Diabetes mellitus was determined by self-reported physician diagnosis, use of glucose-lowering medication or insulin, fasting blood glucose level equal to or greater than 7.0 mmol/L, glycosylated hemoglobin (HbA1c) level greater than 6.5%, random blood glucose level, and two-hour oral glucose tolerance test (OGTT) blood glucose level equal to or greater than 11.1 mmol/L. The estimated glomerular filtration rate (eGFR) was calculated using the CKD Epidemiology Collaboration equation (24). Patients were categorized into two groups based on their eGFR levels: the mild decline group (30–59 ml/min/1.73 m2) and the moderate to severe decline group (<30 ml/min/1.73 m2).
2.6 Evaluation of follow-up results
The study examined two primary outcomes: cardiovascular mortality and all-cause mortality. All-cause mortality was defined as death resulting from any cause. Cardiovascular deaths were identified by referencing the International Statistical Classification of Diseases, 10th Revision (ICD-10) codes I00-I09, I11, I13, and I20-I51. We employed the NHANES public-use linked mortality file as of December 31, 2019. This connection was established through the use of a probabilistic matching algorithm, linking the National Center for Health Statistics (NCHS) with the National Death Index (NDI) (25).
2.7 Statistical analysis
In adherence to NHANES Analytical Guidelines, we accounted for complex sampling designs and sample sizes during data analysis (26). Sample weights were calculated to enhance data representativeness. Continuous variables were expressed as weighted mean ± standard deviation, and differences between groups were evaluated using one-way ANOVA. Categorical variables were presented as frequencies and percentages and compared using Rao-Scott's χ2 test. Kaplan-Meier curves and log-rank tests were employed to assess the survival probability in hypertensive individuals based on PNI levels. The Cox regression model was utilized to calculate hazard ratios (HR) and 95% confidence intervals (CI) in order to investigate the relationship between PNI and the prevalence of all-cause and cardiovascular mortality. The reference category for PNI was the categorical normal group (>49). Three adjustment models were applied: Model 1 adjusted for age, ethnicity, marital status, education, gender, diabetes mellitus, cardiovascular disease, chronic kidney disease, physical activity. Model 2: adjusted for Model 1 + uric acid, triglycerides, HDL, LDL, CRP, neutrophils, creatinine. Model 3: adjusted for Model 2 + medication (beta-blockers, ACEI/ARB, calcium channel blockers, diuretics, statins). To explore the continuous relationship between PNI and all-cause and cardiovascular mortality in hypertensive patients, we applied a Cox-restricted cubic spline model at the 5th, 35th, 65th, and 95th percentiles of PNI. Subgroup analyses were conducted to assess the significance of PNI in different populations. All statistical analyses were carried out using the R (version 4.2.3) and python (version 3.11.4). A two-sided p-value of less than 0.05 was considered indicative of a statistically significant difference.
3 Results
3.1 Participant characteristics according to nutrition risk
In this study, we focused on data from nine consecutive NHANES cycles (1999–2016), surveying a total of 18,189 patients with hypertension who completed an interview and underwent MEC screening in the United States. Based on weighted analyses, the mean age of participants was 56.6 years, with 9,230 males and 8,959 females.84.6% had a high school education or higher. The majority of participants were non-Hispanic whites (47.0%). Participants with lower levels of PNI tended to be older and were more likely to be male, with higher prevalence of CVD, diabetes mellitus, and CKD (P < 0.05). Notably, higher body mass index was associated with lower levels of PNI (P < 0.05). Regarding blood biochemical factors, participants with lower PNI had higher serum creatinine and CRP levels and lower neutrophil counts (P < 0.05). In addition, there was no significant difference in educational level among malnutrition risk groups (P > 0.05), while marital status, blood pressure, physical activity, drinking status, smoking status, drug utilization had statistically significant differences (P < 0.05). The baseline characteristics of the participants are summarized in Table 1.
Table 1
| Characteristics | Overall | Q1 (<49.0) | Q2 (49.0–52.5) | Q3 (52.5–55.5) | Q4 (>55.5) | P-value |
|---|---|---|---|---|---|---|
| N = 18,189 | N = 4,580 | N = 5,160 | N = 4,010 | N = 4,439 | ||
| PNI | 52.9 ± 0.1 | 46.5 ± 0.0 | 51.1 ± 0.0 | 54.2 ± 0.0 | 59.0 ± 0.1 | <0.001 |
| General information | ||||||
| Age, years | 56.6 ± 0.2 | 62.3 ± 0.3 | 58.2 ± 0.3 | 55.5 ± 0.4 | 51.1 ± 0.4 | <0.001 |
| BMI, kg/m2 | 30.7 ± 0.1 | 31.5 ± 0.2 | 30.8 ± 0.1 | 30.3 ± 0.1 | 30.2 ± 0.1 | <0.001 |
| Gender | <0.001 | |||||
| Male | 9,230 (50.7) | 2,504 (58.1) | 2,691 (53.3) | 1,988 (49.0) | 2,047 (44.6) | |
| Female | 8,959 (49.3) | 2,076 (41.9) | 2,469 (46.7) | 2,022 (51.0) | 2,392 (55.4) | |
| Ethnic | <0.001 | |||||
| Non-Hispanic white | 8,547 (47) | 2,246 (71.0) | 2,490 (73.0) | 1,839 (71.5) | 1,972 (70.7) | |
| Non-Hispanic black | 4,408 (24.2) | 1,312 (16.7) | 1,231 (12.7) | 886 (11.5) | 979 (11.3) | |
| Mexican American | 2,758 (15.2) | 522 (4.2) | 789 (5.3) | 678 (6.3) | 769 (6.5) | |
| Other race | 2,476 (13.6) | 500 (8.0) | 650 (9.0) | 607 (10.8) | 719 (11.4) | |
| Marital status | <0.001 | |||||
| Cohabitation | 10,472 (57.6) | 2,428 (58.9) | 3,003 (62.7) | 2,404 (65.2) | 2,637 (63.7) | |
| Solitary | 5,563 (30.6) | 1,688 (32.1) | 1,591 (26.7) | 1,148 (23.7) | 1,136 (22.1) | |
| Never married | 2,154 (11.8) | 464 (9.1) | 566 (10.6) | 458 (11.1) | 666 (14.2) | |
| Education levels | 0.100 | |||||
| High school or above | 15,396 (84.6) | 3,874 (91.3) | 4,366 (92.1) | 3,405 (92.8) | 3,751 (92.3) | |
| Less than High School | 2,793 (15.4) | 706 (8.7) | 794 (7.9) | 605 (7.2) | 688 (7.7) | |
| Medical situation | ||||||
| SBP, mmHg | 134.4 ± 0.2 | 135.5 ± 0.5 | 134.2 ± 0.4 | 133.7 ± 0.4 | 134.1 ± 0.4 | 0.025 |
| DBP, mmHg | 74.0 ± 0.2 | 70.6 ± 0.3 | 73.8 ± 0.3 | 74.4 ± 0.3 | 76.7 ± 0.3 | <0.001 |
| Physical activity | 0.001 | |||||
| Poor | 7,460 (41) | 2,045 (43.5) | 2,103 (39.3) | 1,567 (38.6) | 1,745 (38.8) | |
| Intermediate | 9,192 (50.5) | 2,225 (49.4) | 2,625 (52.3) | 2,083 (52.5) | 2,259 (51.5) | |
| Ideal | 1,537 (8.5) | 310 (7.1) | 432 (8.5) | 360 (8.8) | 435 (9.8) | |
| Cardiovascular Disease | 3,716 (20.4) | 1,301 (25.7) | 1,097 (18.4) | 686 (14.9) | 632 (11.5) | <0.001 |
| Diabetes | 5,237 (28.8) | 1,504 (28.3) | 1,460 (23.5) | 1,083 (22.2) | 1,190 (20.2) | <0.001 |
| Chronic kidney disease | <0.001 | |||||
| Mild | 2,821 (12.97) | 1,075 (21.04) | 823 (13.74) | 517 (11.07) | 406 (7.12) | |
| Moderate to severe | 399 (1.47) | 220 (3.63) | 104 (1.38) | 45 (0.70) | 30 (0.42) | |
| Drinking status | <0.001 | |||||
| Never | 4,089 (22.5) | 1,123 (21.4) | 1,170 (18.0) | 837 (16.9) | 959 (17.6) | |
| Former | 4,282 (23.5) | 1,251 (25.1) | 1,194 (19.7) | 901 (19.3) | 936 (18.0) | |
| Mild | 5,466 (30.1) | 1,353 (33.2) | 1,628 (36.3) | 1,265 (35.3) | 1,220 (30.1) | |
| Moderate or heavy | 4,352 (23.9) | 853 (20.3) | 1,168 (26.0) | 1,007 (28.5) | 1,324 (34.2) | |
| Smoking status | <0.001 | |||||
| Never | 9,175 (50.4) | 2,307 (50.3) | 2,665 (51.6) | 2,037 (49.1) | 2,166 (47.2) | |
| Former | 5,674 (31.2) | 1,645 (36.1) | 1,679 (32.4) | 1,206 (31.5) | 1,144 (26.3) | |
| Now | 3,340 (18.4) | 628 (13.6) | 816 (16.0) | 767 (19.3) | 1,129 (26.6) | |
| Drug utilization | ||||||
| Beta-blockers | 13,885 (76.3) | 3,179 (69.7) | 3,897 (75.7) | 3,148 (78.5) | 3,661 (83.8) | <0.001 |
| CCB | 14,487 (79.6) | 3,536 (80.2) | 4,124 (82.6) | 3,213 (82.7) | 3,614 (85.2) | <0.001 |
| ACEI/ARB | 10,823 (59.5) | 2,517 (54.5) | 2,997 (58.5) | 2,441 (60.7) | 2,868 (66.8) | <0.001 |
| Diuretics | 12,854 (70.7) | 2,949 (65.2) | 3,634 (71.1) | 2,885 (72.5) | 3,386 (78.1) | <0.001 |
| Statins | 12,985 (71.4) | 3,165 (68.9) | 3,634 (70.5) | 2,873 (72.2) | 3,313 (76.4) | <0.001 |
| Laboratory examinations | ||||||
| Neutrophil, 109 /L | 2.08 ± 0.01 | 1.49 ± 0.01 | 1.84 ± 0.01 | 2.16 ± 0.01 | 2.78 ± 0.02 | <0.001 |
| Lymphocyte, 109 /L | 4.44 ± 0.02 | 4.34 ± 0.03 | 4.24 ± 0.03 | 4.41 ± 0.04 | 4.76 ± 0.04 | <0.001 |
| Cr, μmol/L | 83.63 ± 0.46 | 92.66 ± 1.31 | 83.03 ± 0.84 | 80.75 ± 0.62 | 79.25 ± 0.42 | <0.001 |
| UA, μmol/L | 343.83 ± 0.98 | 341.67 ± 1.82 | 340.02 ± 1.74 | 344.59 ± 1.79 | 348.98 ± 2.00 | 0.002 |
| TG, mmol/L | 2.20 ± 0.02 | 1.83 ± 0.03 | 2.06 ± 0.03 | 2.24 ± 0.04 | 2.61 ± 0.05 | <0.001 |
| TC, mmol/L | 5.18 ± 0.01 | 4.94 ± 0.02 | 5.12 ± 0.02 | 5.24 ± 0.02 | 5.39 ± 0.03 | <0.001 |
| HDL-C, mmol/L | 1.35 ± 0.00 | 1.40 ± 0.01 | 1.37 ± 0.01 | 1.34 ± 0.01 | 1.30 ± 0.01 | <0.001 |
| LDL-C, mmol/L | 2.83 ± 0.01 | 2.70 ± 0.02 | 2.81 ± 0.02 | 2.88 ± 0.02 | 2.90 ± 0.02 | <0.001 |
| Albumin, g/L | 42.48 ± 0.05 | 39.03 ± 0.05 | 41.91 ± 0.05 | 43.41 ± 0.05 | 45.12 ± 0.06 | <0.001 |
| CRP, mg/dl | 0.47 ± 0.01 | 0.74 ± 0.02 | 0.43 ± 0.01 | 0.39 ± 0.01 | 0.36 ± 0.01 | <0.001 |
Baseline characteristics of the study population according to the quartiles of the PNI.
Continuous variables are expressed as weighted mean ± standard deviation and categorical variables are expressed as frequencies (weighted percentages).
PNI, prognostic nutrition index; BMI, body mass index; LDL-C, low-density lipoprotein cholesterol; HDL-C, high-density lipoprotein cholesterol; CRP, C-reactive protein; SBP, systolic blood pressure; DBP, diastolic blood pressure; CCB, calcium channel antagonist; ACEI/ARB, angiotensin-converting enzyme inhibitors/angiotensin II receptor antagonists.
3.2 The relationship between PNI and mortality
During a median follow-up time of 103 months, a total of 5,171 (28.43%) hypertensive patients experienced all-cause mortality, 1,444 (7.94%) cardiovascular mortality. Kaplan–Meier curves suggest that hypertensive patients with higher PNI have lower mortality, both all-cause and cardiovascular mortality, in the quartile subgroup of PNI (Figure 2). COX proportional hazard regression analysis showed that PNI was a protective factor for all-cause mortality and cardiovascular mortality, with hazard ratios of 0.906 (95% CI, 0.898–0.913, P < 0.001) and 0.878 (95% CI, 0.865–0.892, P < 0.001), respectively. Multivariate regression analysis revealed that every one-point increase in PNI was associated with 5%–7% reduction in the risk of all-cause mortality and cardiovascular mortality After adjusting for confounding factors of sex, age, underlying disease, clinical biochemical parameters, and medication history, PNI remained a protective factor for all-cause mortality (HR: 0.953, 95CI: 0.945–0.961, P < 0.001) and cardiovascular mortality (HR: 0.928, 95CI: 0.908–0.949, P < 0.001). When PNI was assessed by quartile and compared with quartile 1 (<49.0), the hazard ratio for all-cause mortality cardiovascular mortality were <1 for quartile 2 (49.0–52.5), quartile 3 (52.5–55.5) and quartile 4 (>55.5) before and after adjustment for covariates, and the P trend was <0.001 (Table 2). In a fully adjusted restricted cubic spline regression analysis model accounting for potential confounders, we discovered an intriguing L-shaped association between PNI and both all-cause and cardiovascular mortality among hypertensive patients (with all nonlinear p values < 0.001). Notably, as PNI values increased, there was a progressive decrease in both all-cause mortality and cardiovascular mortality (Figure 3).
Figure 2
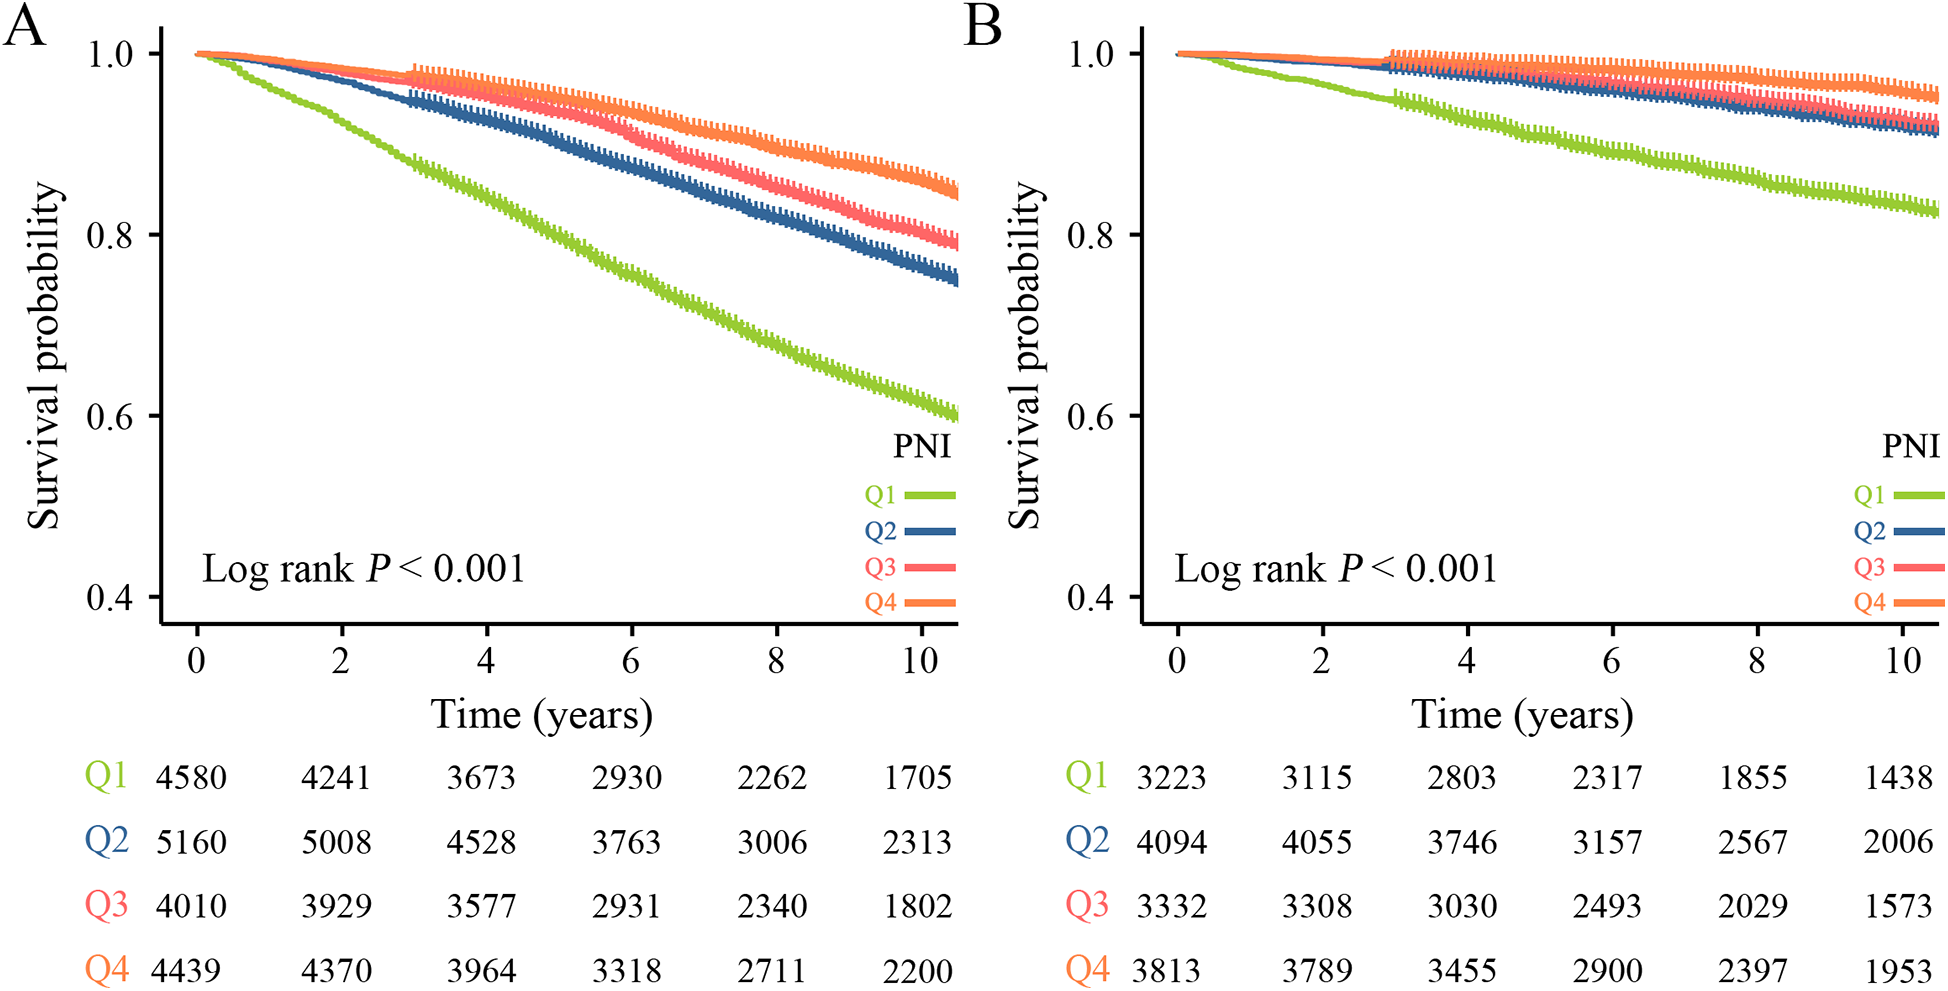
Kaplan–Meier survival curve for mortality across the PNI. (A) All-cause mortality. (B) Cardiovascular mortality.
Table 2
| Characteristics | Crude model | Model 1 | Model 2 | Model 3 | ||||
|---|---|---|---|---|---|---|---|---|
| HR 95% CI | P-value | HR 95% CI | P-value | HR 95% CI | P-value | HR 95% CI | P-value | |
| All-cause mortality | ||||||||
| PNI | 0.906 (0.898,0.913) | <0.001 | 0.953 (0.945,0.961) | <0.001 | 0.958 (0.949,0.966) | <0.001 | 0.953 (0.945,0.961) | <0.001 |
| Quartiles | ||||||||
| Q1 (<49.0) | Reference | Reference | Reference | |||||
| Q2 (49.0–52.5) | 0.526 (0.483,0.572) | <0.001 | 0.691 (0.638,0.750) | <0.001 | 0.720 (0.663,0.783) | <0.001 | 0.721 (0.658,0.789) | <0.001 |
| Q3 (52.5–55.5) | 0.426 (0.387,0.468) | <0.001 | 0.677 (0.615,0.744) | <0.001 | 0.705 (0.640,0.778) | <0.001 | 0.690 (0.626,0.761) | <0.001 |
| Q4 (>55.5) | 0.309 (0.279,0.342) | <0.001 | 0.594 (0.535,0.659) | <0.001 | 0.624 (0.560,0.694) | <0.001 | 0.584 (0.523,0.652) | <0.001 |
| P for trend | <0.001 | <0.001 | <0.001 | <0.001 | ||||
| Cardiovascular mortality | ||||||||
| PNI | 0.878 (0.865,0.892) | <0.001 | 0.933 (0.918,0.948) | <0.001 | 0.924 (0.904,0.944) | <0.001 | 0.928 (0.908,0.949) | <0.001 |
| Quartiles | ||||||||
| Q1 (<49.0) | Reference | Reference | Reference | |||||
| Q2 (49.0–52.5) | 0.396 (0.340,0.461) | <0.001 | 0.557 (0.478,0.650) | <0.001 | 0.574 (0.493,0.668) | <0.001 | 0.590 (0.501,0.695) | <0.001 |
| Q3 (52.5–55.5) | 0.357 (0.302,0.423) | <0.001 | 0.626 (0.526,0.747) | <0.001 | 0.634 (0.533,0.755) | <0.001 | 0.632 (0.531,0.752) | <0.001 |
| Q4 (>55.5) | 0.200 (0.162,0.248) | <0.001 | 0.438 (0.353,0.543) | <0.001 | 0.440 (0.356,0.544) | <0.001 | 0.435 (0.349,0.541) | <0.001 |
| P for trend | <0.001 | <0.001 | <0.001 | <0.001 | ||||
Cox proportional hazard regression analysis of mortality in participants with PNI and hypertension.
PNI, prognostic nutritional index; HR, hazard ratio; CI, confidence interval.
Crude model: adjusted for none.
Model 1: adjusted for age, ethnicity, marital status, education, gender, diabetes mellitus, cardiovascular disease, chronic kidney disease, physical activity.
Model 2: adjusted for Model 1 + uric acid, triglycerides, HDL, LDL, CRP, neutrophils, creatinine.
Model 3: adjusted for Model 2 + medication (beta-blockers, ACEI/ARB, calcium channel blockers, diuretics, statins).
Figure 3
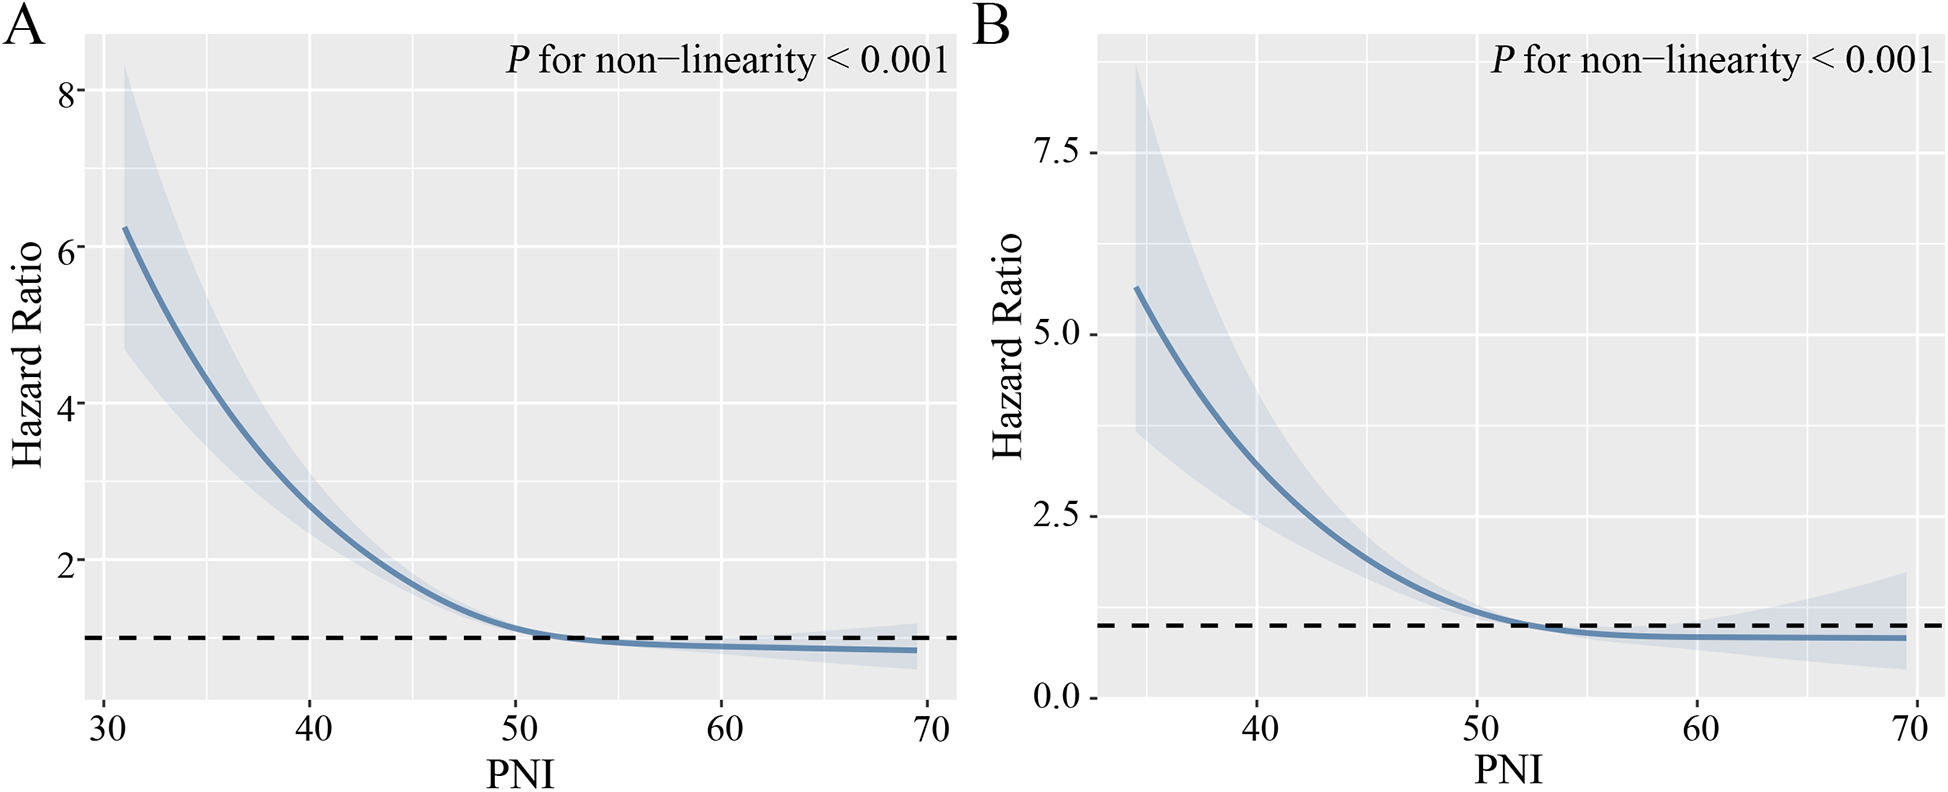
Non-linear relationship between PNI and mortality. (A) All-cause mortality. (B) Cardiovascular mortality. Adjust for age, gender, ethnicity, marital status, physical activity, smoking, drinking, diabetes mellitus, cardiovascular disease, chronic kidney disease, diastolic blood pressure, systolic blood pressure, serum uric acid, triglycerides, HDL-C, LDL-C, C-reactive protein, and medication (beta-blockers, ACEI/ARB, calcium channel blockers, diuretics, statins).
3.3 Subgroup analysis
This study further analyzed PNI in subgroups of different age groups, gender, physical activity, smoking, alcohol consumption, and chronic diseases (Figure 4). The results showed that PNI was protective against all-cause mortality and cardiovascular death in all subgroups. Notably, we observed an interaction between PNI and both all-cause and cardiovascular deaths in gender (both P for interaction <0.001). In addition, no significant association of PNI with cardiovascular mortality was observed in both age >80 years and chronic kidney disease (moderate to severe) (P > 0.05).
Figure 4
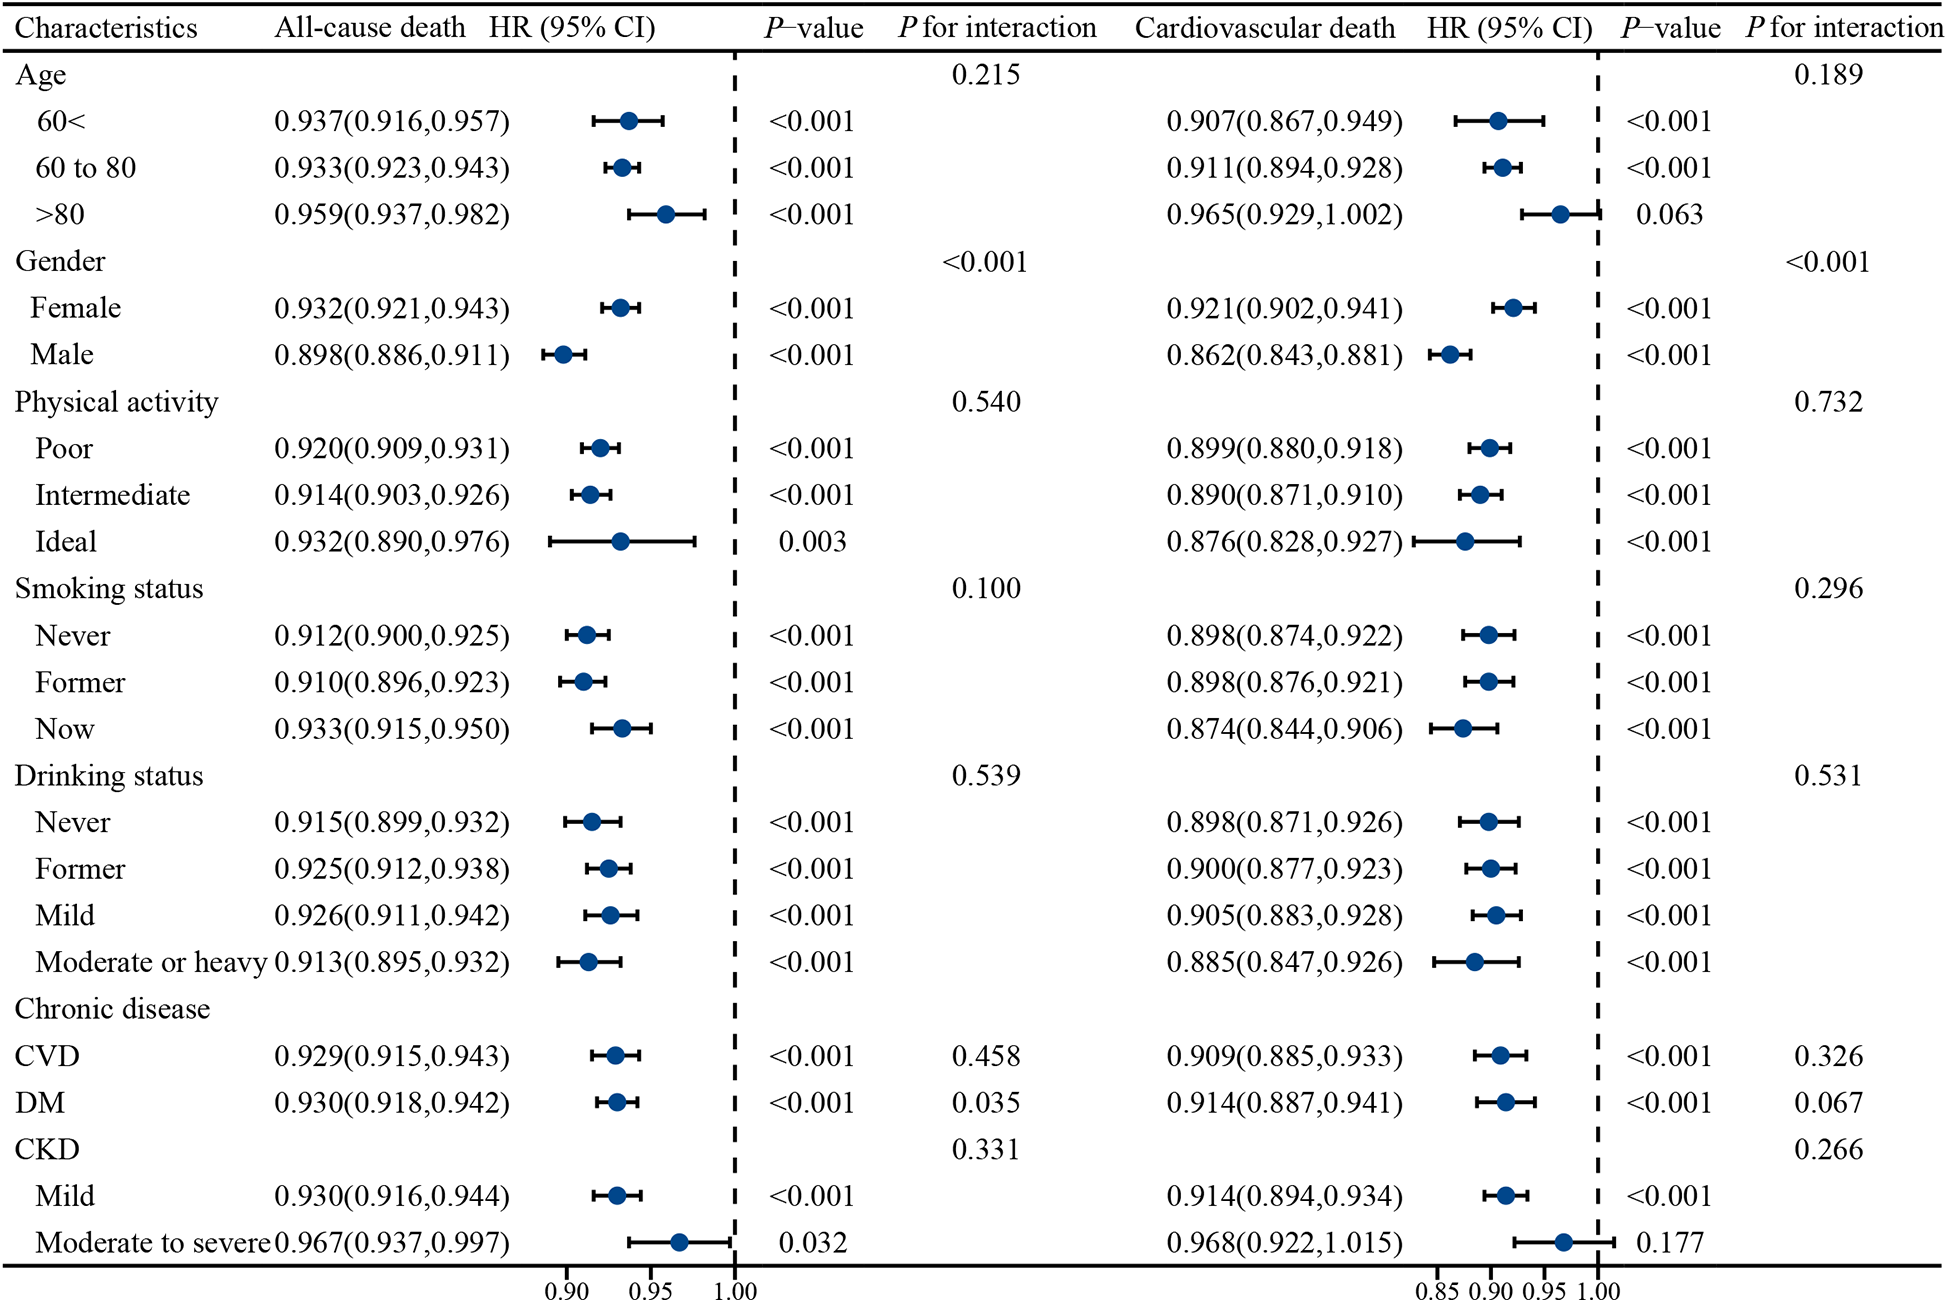
Stratified analysis of the effect of PNI on all-cause mortality and cardiovascular mortality in different populations. Adjusted for Race, marital status, education, consumption and medication (betablockers, ACEI/ARB, calcium channel blockers, diuretics, statins).
3.4 PNI outperforms other features in predicting all-cause mortality
In this study, we conducted an assessment of the predictive capabilities of various features for all-cause mortality (Figure 5). Notably, the Prognostic Nutritional Index (PNI) exhibited the highest AUC value, standing at 0.628, and the highest sensitivity, which reached 0.688. These findings unequivocally demonstrate PNI's robust performance in the prediction of all-cause mortality. Its AUC value significantly surpassed that of other features, namely lymphocyte, Albumin, CONUT, and GNRI. Moreover, the heightened sensitivity of PNI further underscores its exceptional ability to accurately identify instances of all-cause mortality (Table 3).
Figure 5
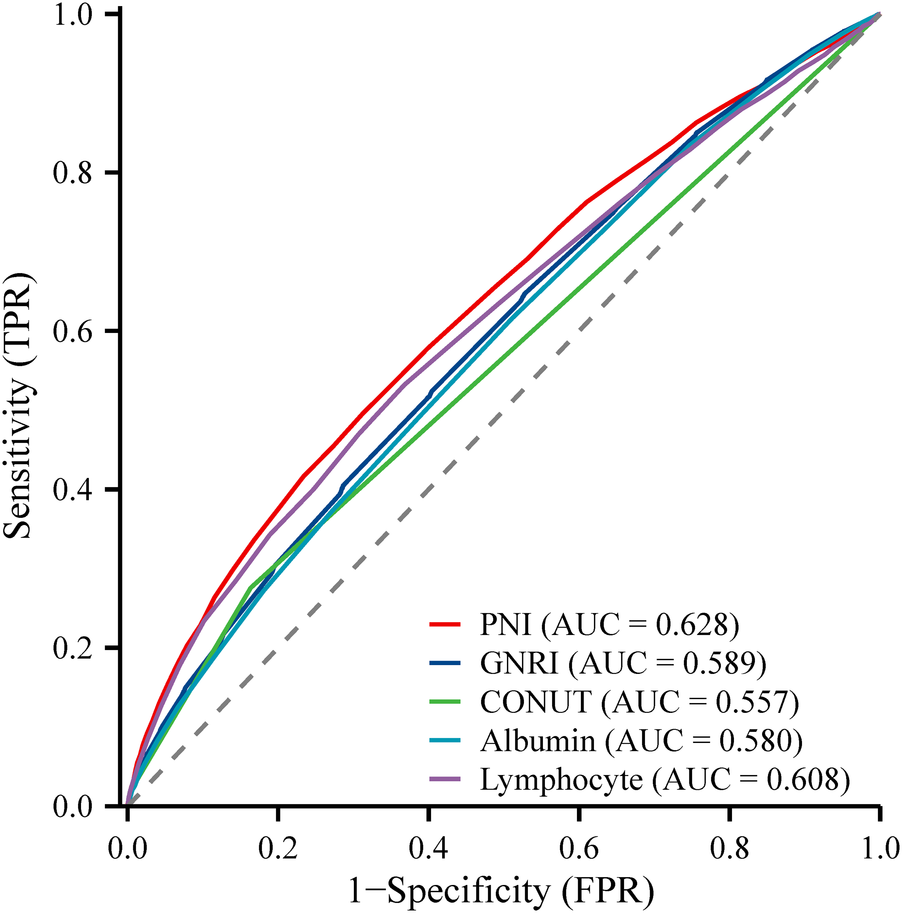
ROC plot of PNI predicting the occurrence of all-cause mortality in participants with hypertension.
Table 3
| Characteristics | AUC | Sensitivity | Specificity | Yoden's index | Cut-off value |
|---|---|---|---|---|---|
| Lymphocyte | 0.608 | 0.632 | 0.532 | 0.164 | 1.9 |
| Albumin | 0.580 | 0.489 | 0.616 | 0.105 | 43 |
| CONUT | 0.557 | 0.276 | 0.837 | 0.112 | 1.0 |
| GNRI | 0.589 | 0.596 | 0.523 | 0.12 | 104 |
| PNI | 0.628 | 0.688 | 0.495 | 0.183 | 51 |
Analysis of the efficacy of the PNI in predicting all-cause mortality.
PNI, prognostic nutritional index; GNRI, geriatric nutritional risk index; CONUT, controlled nutritional status; AUC, area under the curve.
4 Discussions
The main finding of this study was that lower levels of PNI were associated with increased all-cause and cardiovascular mortality in hypertensive patients. Meanwhile, PNI demonstrated superior predictive power compared to other nutritional indices.
Hypertension is a major modifiable risk factor for cardiovascular and cerebrovascular diseases. Identifying alterable factors is crucial for delaying or preventing hypertension-related target organ damage (27). Several comprehensive nutritional assessment methods have been reported, including Subjective Global Assessment (SGA), Mini Nutritional Assessment (MNA), Malnutrition Inflammation Score (MIS), Geriatric Nutritional Risk Index (GNRI), Controlling Nutritional Status (CONUT) score, and PNI (28). SGA, MNA, and MIS are assessed by experienced clinicians based on patients’ symptoms and physical examinations, which may introduce subjective bias. In contrast, objective nutritional indices such as GNRI, CONUT score, and PNI utilize widely available and cost-effective biomarkers for calculation. PNI includes serum albumin concentration and lymphocyte count, provides a comprehensive evaluation of nutritional, immune, and inflammatory status. The results of this study demonstrated that hypertensive patients with higher PNI levels had lower mortality rates, including both all-cause and cardiovascular mortality, across PNI quartile subgroups. These findings align with previous studies conducted in other populations. For example, lower PNI levels have been reported as independent predictors of short-term adverse outcomes in patients with severe decompensated acute heart failure (29). Cheng et al. also highlighted that PNI was negatively associated with long-term survival in patients with acute heart failure (16). Moreover, PNI has been shown to predict early mortality and complications in cardiac surgery patients (30).
The progression of hypertension is closely linked to mechanisms involving chronic inflammation and immune status. Albumin is a classic marker for assessing malnutrition; however, its concentration is influenced not only by protein intake but also by factors such as overhydration, inflammation, or other physiological disturbances (31). Studies have demonstrated that when serum albumin levels drop below 3.5 g/dl, the risk of mortality quadruples compared to individuals with higher levels, and levels below 3 g/dl indicate a critical condition (32). Nutritional status reflects a patient's overall health and protein reserves, and a decrease in PNI may indicate poor general condition and reduced protein stores. Reduced lymphocyte levels often indicate immunosuppression or heightened inflammatory responses (33). In chronic disease and malnourished states, impaired immune capacity may lead to increased risks of infection, uncontrolled inflammation, and organ damage. This study found that participants with lower PNI levels had higher serum CRP levels. Increasing evidence suggests that prolonged hyperactivation of immune cells and subsequent low-grade inflammation are significant drivers of hypertension and its fatal complications (34, 35). These findings further validate PNI's representation of the ongoing inflammatory activation process.
The results of this study demonstrate that PNI effectively predicts cardiovascular and all-cause mortality across various subgroups, highlighting its broad applicability. Furthermore, this study identified a significant sex-based interaction between PNI and mortality. Elevated PNI levels were more strongly associated with lower mortality in men than in women. This could be attributed to men's heightened sensitivity to malnutrition and immune function decline, combined with behavioral patterns and metabolic characteristics that exacerbate their vulnerability (36). Conversely, women may benefit from physiological protective mechanisms, such as higher estrogen levels, which could mitigate the adverse effects of nutrition status to some extent. Additionally, men's tendencies toward neglecting nutritional management might contribute to their higher PNI-related risks (37).
In this study, PNI exhibited a significantly higher AUC value and sensitivity compared to other nutritional indices, indicating its superior performance in assessing mortality risk among hypertensive patients. GNRI incorporates body mass index (BMI) and albumin levels, tends to overestimate nutritional status in obese individuals (38). Similarly, this study revealed that participants with lower PNI levels often had higher BMI values. The World Health Organization (WHO) has highlighted the “double burden of malnutrition,” where both malnutrition and overweight coexist, posing a serious and growing global health challenge (39). The CONUT score, which includes albumin, lymphocyte count, and total cholesterol, has demonstrated good predictive performance in certain populations. However, some patients with chronic diseases often require long-term lipid-lowering therapies, such as statins, to reduce cardiovascular risk. These medications can lead to decreased cholesterol levels, potentially compromising the accuracy of CONUT in this population (20). Although PNI has relatively lower specificity, its superior sensitivity and AUC value make it an ideal tool for screening mortality risk in hypertensive patients. High sensitivity ensures that more high-risk patients are accurately identified, which is crucial in clinical practice for implementing timely interventions. The issue of lower specificity can be addressed by optimizing application strategies, such as combining PNI with other biomarkers or adjusting its threshold in specific populations.
5 Advantages and limitations
Our study has several advantages. First, our study is the first to show an association between PNI levels and mortality in a longitudinal cohort study of a large number of persons with hypertension. Second, we explored the relationship between PNI and cardiovascular mortality and all-cause mortality, respectively. In addition, we adjusted for as many confounding factors as possible, so the results may be more convincing. There are also several limitations to this study. First and foremost, despite our rigorous adjustment for baseline clinical characteristics, our observations may be influenced by unmeasured and unknown confounders. Furthermore, because the NHANES study collected data at one point in time, nutritional data such as serum albumin, height, and weight were recorded only once for all participants, which may lead to bias in PNI calculations.
6 Conclusions
This study confirms that lower PNI scores are highly associated with the risk of all-cause mortality and cardiovascular mortality in persons with hypertension. To avoid premature death among adults with hypertension in the United States, it is recommended that they focus on a balanced nutritional intake in their daily lives. Clinical care workers should also pay attention to assessing the nutritional status of patients and give them timely and appropriate dietary guidance. This study provides a significant reference for reducing premature mortality in the hypertension population with adequate nutritional intake as a primary prevention strategy!
Statements
Data availability statement
The datasets presented in this study can be found in online repositories. The names of the repository/repositories and accession number(s) can be found below: this study is a secondary exploration of the NHANES public database. The data used in the manuscript can be accessed and downloaded from the website https://wwwn.cdc.gov/nchs/nhanes/search/default.aspx.
Ethics statement
The studies involving humans were approved by Ethics Review Board of the National Center for Health Statistics (NCHS). The studies were conducted in accordance with the local legislation and institutional requirements. The participants provided their written informed consent to participate in this study.
Author contributions
JT: Writing – original draft, Writing – review & editing, Investigation, Methodology, Software, Funding acquisition. LY: Writing – original draft, Writing – review & editing, Investigation, Methodology, Software. G-YY: Writing – original draft, Writing – review & editing, Data curation, Formal Analysis. Y-HL: Data curation, Formal Analysis, Writing – original draft, Writing – review & editing. Y-SZ: Data curation, Formal Analysis, Writing – original draft, Writing – review & editing. HL: Supervision, Validation, Writing – original draft, Writing – review & editing, Funding acquisition. X-MG: Supervision, Validation, Writing – original draft, Writing – review & editing, Funding acquisition.
Funding
The author(s) declare financial support was received for the research, authorship, and/or publication of this article. This work was supported by State Key Laboratory of Pathogenesis, Prevention and Treatment of Central Asian High Incidence Diseases Fund (SKL-HIDCA-2023-30, SKL-HIDCA-2021-44, SKL-HIDCA-2024-45), the Youth Research Launch Special Fund of the First Affiliated Hospital of Xinjiang Medical University (2022YFY-QKMS-09), and the Xinjiang Uygur Autonomous Region Graduate Student Innovation Program (XJ2024G167).
Acknowledgments
This work is supported by Extreme Smart Analysis platform (https://www.xsmartanalysis.com/).
Conflict of interest
The authors declare that the research was conducted in the absence of any commercial or financial relationships that could be construed as a potential conflict of interest.
Publisher’s note
All claims expressed in this article are solely those of the authors and do not necessarily represent those of their affiliated organizations, or those of the publisher, the editors and the reviewers. Any product that may be evaluated in this article, or claim that may be made by its manufacturer, is not guaranteed or endorsed by the publisher.
References
1.
AttardSMHerringAHZhangBDuSPopkinBMGordon-LarsenP. Associations between age, cohort, and urbanization with SBP and DBP in China. J Hypertens. (2015) 33(5):948–56. 10.1097/HJH.0000000000000522
2.
EzzatiMVander HoornSLawesCMLeachRJamesWPLopezADet alRethinking the “diseases of affluence” paradigm: global patterns of nutritional risks in relation to economic development. PLoS Med. (2005) 2(5):e133. 10.1371/journal.pmed.0020133
3.
GaćPPorębaMMazurGPorębaR. The aortic mechanical properties in patients with the essential hypertension environmentally exposed to cigaret smoke. Inhal Toxicol. (2015) 27(13):717–23. 10.3109/08958378.2015.1103337
4.
MittalBVSinghAK. Hypertension in the developing world: challenges and opportunities. Am J Kidney Dis. (2010) 55(3):590–8. 10.1053/j.ajkd.2009.06.044
5.
KearneyPMWheltonMReynoldsKMuntnerPWheltonPKHeJ. Global burden of hypertension: analysis of worldwide data. Lancet. (2005) 365(9455):217–23. 10.1016/S0140-6736(05)17741-1
6.
PioliMRde FariaAP. Pro-inflammatory cytokines and resistant hypertension: potential for novel treatments?Curr Hypertens Rep. (2019) 21(12):95. 10.1007/s11906-019-1003-2
7.
EkholmMKahanT. The impact of the renin-angiotensin-aldosterone system on inflammation, coagulation, and atherothrombotic complications, and to aggravated COVID-19. Front Pharmacol. (2021) 12:640185. 10.3389/fphar.2021.640185
8.
DasUN. Molecular biochemical aspects of salt (sodium chloride) in inflammation and immune response with reference to hypertension and type 2 diabetes mellitus. Lipids Health Dis. (2021) 20(1):83. 10.1186/s12944-021-01507-8
9.
YılmazFKeleşMBoraF. Relationship between the prognostic nutritional index and resistant hypertension in patients with essential hypertension. Clin Exp Hypertens. (2022) 44(4):326–33. 10.1080/10641963.2022.2036995
10.
RupareliaNChaiJTFisherEAChoudhuryRP. Inflammatory processes in cardiovascular disease: a route to targeted therapies. Nat Rev Cardiol. (2017) 14(3):133–44. 10.1038/nrcardio.2016.185
11.
CasasRCastro-BarqueroSEstruchRSacanellaE. Nutrition and cardiovascular health. Int J Mol Sci. (2018) 19(12):3988. 10.3390/ijms19123988
12.
CeredaEPedrolliCZagamiAVanottiAPifferSFalivaMet alNutritional risk, functional status and mortality in newly institutionalised elderly. Br J Nutr. (2013) 110(10):1903–9. 10.1017/S0007114513001062
13.
OnoderaTGosekiNKosakiG. Prognostic nutritional index in gastrointestinal surgery of malnourished cancer patients. Nihon Geka Gakkai Zasshi. (1984) 85(9):1001–5.
14.
ZhangCWangHNingZXuLZhuangLWangPet alPrognostic nutritional index serves as a predictive marker of survival and associates with systemic inflammatory response in metastatic intrahepatic cholangiocarcinoma. Onco Targets Ther. (2016) 9:6417–23. 10.2147/OTT.S112501
15.
BastaGChatzianagnostouKParadossiUBottoNDel TurcoSTaddeiAet alThe prognostic impact of objective nutritional indices in elderly patients with ST-elevation myocardial infarction undergoing primary coronary intervention. Int J Cardiol. (2016) 221:987–92. 10.1016/j.ijcard.2016.07.039
16.
ChengYLSungSHChengHMHsuPFGuoCYYuWCet alPrognostic nutritional index and the risk of mortality in patients with acute heart failure. J Am Heart Assoc. (2017) 6(6):e004876. 10.1161/JAHA.116.004876
17.
WuLDKongCHShiYZhangJXChenSL. Associations between novel anthropometric measures and the prevalence of hypertension among 45,853 adults: a cross-sectional study. Front Cardiovasc Med. (2022) 9:1050654. 10.3389/fcvm.2022.1050654
18.
ChenLBaiPKongXHuangSWangZWangXet alPrognostic nutritional Index (PNI) in patients with breast cancer treated with neoadjuvant chemotherapy as a useful prognostic indicator. Front Cell Dev Biol. (2021) 9:656741. 10.3389/fcell.2021.656741
19.
BouillanneOMorineauGDupontCCoulombelIVincentJPNicolisIet alGeriatric nutritional risk Index: a new index for evaluating at-risk elderly medical patients. Am J Clin Nutr. (2005) 82(4):777–83. 10.1093/ajcn/82.4.777
20.
AreroGAreroAGMohammedSHVasheghani-FarahaniA. Prognostic potential of the controlling nutritional Status (CONUT) score in predicting all-cause mortality and major adverse cardiovascular events in patients with coronary artery disease: a meta-analysis. Front Nutr. (2022) 9:850641. 10.3389/fnut.2022.850641
21.
Di PaloKEBaroneNJ. Hypertension and heart failure: prevention, targets, and treatment. Cardiol Clin. (2022) 40(2):237–44. 10.1016/j.ccl.2021.12.011
22.
BourdillonMTSongRJMusa YolaIXanthakisVVasanRS. Prevalence, predictors, progression, and prognosis of hypertension subtypes in the framingham heart study. J Am Heart Assoc. (2022) 11(6):e024202. 10.1161/JAHA.121.024202
23.
ZhouDYanMChengQFengXTangSFengY. Prevalence and prognosis of left ventricular diastolic dysfunction in community hypertension patients. BMC Cardiovasc Disord. (2022) 22(1):265. 10.1186/s12872-022-02709-3
24.
LeveyASStevensLASchmidCHZhangYLCastroAF3rdFeldmanHIet alA new equation to estimate glomerular filtration rate. Ann Intern Med. (2009) 150(9):604–12. 10.7326/0003-4819-150-9-200905050-00006
25.
CaoYLiPZhangYQiuMLiJMaSet alAssociation of systemic immune inflammatory index with all-cause and cause-specific mortality in hypertensive individuals: results from NHANES. Front Immunol. (2023) 14:1087345. 10.3389/fimmu.2023.1087345
26.
JohnsonCLDohrmannSMBurtVLMohadjerLK. National health and nutrition examination survey: sample design, 2011–2014. Vital Health Stat 2. (2014) (162):1–33.
27.
MillsKTStefanescuAHeJ. The global epidemiology of hypertension. Nat Rev Nephrol. (2020) 16(4):223–37. 10.1038/s41581-019-0244-2
28.
SzeSPellicoriPZhangJWestonJClarkAL. Agreement and classification performance of malnutrition tools in patients with chronic heart failure. Curr Dev Nutr. (2020) 4(6):nzaa071. 10.1093/cdn/nzaa071
29.
ShirakabeAHataNKobayashiNOkazakiHMatsushitaMShibataYet alThe prognostic impact of malnutrition in patients with severely decompensated acute heart failure, as assessed using the prognostic nutritional index (PNI) and controlling nutritional Status (CONUT) score. Heart Vessels. (2018) 33(2):134–44. 10.1007/s00380-017-1034-z
30.
LeeSIKoKPChoiCHParkCHParkKYSonKH. Does the prognostic nutritional index have a predictive role in the outcomes of adult cardiac surgery?J Thorac Cardiovasc Surg. (2020) 160(1):145–153.e3. 10.1016/j.jtcvs.2019.08.069
31.
de MutsertRGrootendorstDCIndemansFBoeschotenEWKredietRTDekkerFW. Association between serum albumin and mortality in dialysis patients is partly explained by inflammation, and not by malnutrition. J Ren Nutr. (2009) 19(2):127–35. 10.1053/j.jrn.2008.08.003
32.
StenvinkelPHeimbürgerOPaultreFDiczfalusyUWangTBerglundLet alStrong association between malnutrition, inflammation, and atherosclerosis in chronic renal failure. Kidney Int. (1999) 55(5):1899–911. 10.1046/j.1523-1755.1999.00422.x
33.
OkadomeKBabaYYagiTKiyozumiYIshimotoTIwatsukiMet alPrognostic nutritional index, tumor-infiltrating lymphocytes, and prognosis in patients with esophageal cancer. Ann Surg. (2020) 271(4):693–700. 10.1097/SLA.0000000000002985
34.
TofanoRJBarbalhoSMBecharaMDQuesadaKMendesCGOshiiwaM. Hypertension, C reactive protein and metabolic profile: what is the scenario in patients undergoing arteriography?J Clin Diagn Res. (2017) 11(8):Bc19–bc23. 10.7860/jcdr/2017/26595.10456
35.
UiterwijkRHuijtsMStaalsJRouhlRPDe LeeuwPWKroonAAet alEndothelial activation is associated with cognitive performance in patients with hypertension. Am J Hypertens. (2016) 29(4):464–9. 10.1093/ajh/hpv122
36.
TurenSMemic SancarK. Predictive value of the prognostic nutritional index for long-term mortality in patients with advanced heart failure. Acta Cardiol Sin. (2023) 39(4):599–609. 10.6515/acs.202307_39(4).20221223a
37.
ConnellyPJAziziZAlipourPDellesCPiloteLRaparelliV. The importance of gender to understand sex differences in cardiovascular disease. Can J Cardiol. (2021) 37(5):699–710. 10.1016/j.cjca.2021.02.005
38.
ChienSCChandramouliCLoCILinCFSungKTHuangWHet alAssociations of obesity and malnutrition with cardiac remodeling and cardiovascular outcomes in Asian adults: a cohort study. PLoS Med. (2021) 18(6):e1003661. 10.1371/journal.pmed.1003661
39.
BarazzoniRGortan CappellariG. Double burden of malnutrition in persons with obesity. Rev Endocr Metab Disord. (2020) 21(3):307–13. 10.1007/s11154-020-09578-1
Summary
Keywords
prognostic nutritional index, hypertension, all-cause mortality, cardiovascular mortality, cohort study
Citation
Tang J, Yang L, Yang G-Y, Li Y-H, Zhu Y-S, Li H and Gao X-M (2025) Prognostic nutritional index as a predictor of cardiovascular and all-cause mortality in American adults with hypertension: results from the NHANES database. Front. Cardiovasc. Med. 11:1465379. doi: 10.3389/fcvm.2024.1465379
Received
16 July 2024
Accepted
13 December 2024
Published
06 January 2025
Volume
11 - 2024
Edited by
Maria Marketou, University Hospital of Heraklion, Greece
Reviewed by
Sepiso Kenias Masenga, Mulungushi University, Zambia
Miriam Sandín Rollán, Hospital General Universitario de Alicante, Spain
Updates
Copyright
© 2025 Tang, Yang, Yang, Li, Zhu, Li and Gao.
This is an open-access article distributed under the terms of the Creative Commons Attribution License (CC BY). The use, distribution or reproduction in other forums is permitted, provided the original author(s) and the copyright owner(s) are credited and that the original publication in this journal is cited, in accordance with accepted academic practice. No use, distribution or reproduction is permitted which does not comply with these terms.
*Correspondence: Hui Li lh0991436@sina.com Xiao-Ming Gao xiaomingao2017@163.com
†These authors have contributed equally to this work
Disclaimer
All claims expressed in this article are solely those of the authors and do not necessarily represent those of their affiliated organizations, or those of the publisher, the editors and the reviewers. Any product that may be evaluated in this article or claim that may be made by its manufacturer is not guaranteed or endorsed by the publisher.