 Feiyu Chen
 Yunpeng Jin
- Department of Cardiology, The Fourth Affiliated Hospital of School of Medicine, and International School of Medicine, International Institutes of Medicine, Zhejiang University, Yiwu, China
Background: Although the cardiometabolic index (CMI) has gained recognition as a new tool for evaluating metabolic health, the relationship between CMI and cardiovascular disease (CVD) remains unclear. This research sought to explore the potential association between CMI and CVD.
Methods: Participants from the 2007–2018 National Health and Nutrition Examination Survey (NHANES) were selected. Multivariable logistic regression analyses and smooth curve fitting were utilized to investigate this relationship, along with subgroup evaluations and interaction analyses.
Results: This study included 12,837 subjects and the prevalence of CVD was 11.83%. After full adjustment, participants presenting with an increase of one unit in Ln-transformed CMI associated a 15% higher odds of CVD prevalence (OR = 1.15, 95% CI: 1.05–1.26). In the fully adjusted model, individuals falling into the highest CMI quartile (Quartile 4) demonstrated substantially 35% higher odds than those in the lowest CMI quartile (Quartile 1) (OR = 1.35, 95% CI: 1.11–1.66). In addition, there was no nonlinear relationship between CMI and CVD in our selected sample. This positive association was not greatly influenced by any of the stratifications.
Conclusions: Among US adults, having higher CMI levels is substantially associated with higher odds of CVD prevalence. This finding suggests that regular monitoring of CMI levels could enable physicians to initiate early interventions, potentially slowing the progression of CVD. However, in order to corroborate our findings, further prospective investigations are still required.
1 Introduction
Worldwide, cardiovascular disease (CVD) continues to be one of the primary causes of death (1). Some studies reported that approximately 17.9 million deaths worldwide occur as a result of cardiovascular disease each year, making up 31% of global mortality (2, 3). These conditions are intimately linked to hyperlipidemia, hypertension, diabetes, and obesity (4, 5). The global burden of CVD remains substantial, especially in low-income nations and middle-income nations, despite CVD-related mortality has recently declined in high-income countries (6, 7). Therefore, preventing CVD and managing disease progression is critical.
The cardiometabolic index (CMI) has gained recognition as a new tool for evaluating metabolic health and predicting CVD risk (8). It not only explains the degree of obesity, but also provides a good indication of an individual's lipid levels (8, 9). CMI is calculated using triglyceride to high-density lipoprotein cholesterol ratio (TG/HDL-C ratio) and waist-to-height ratio (WHtR), which are considered strong indicators of an individual's metabolic status (10). Compared to other complex metabolic assessment tools, CMI offers a simpler calculation method, which enhances its potential application in clinical practice (11–13). Some research has explored the clinical relevance of cardiometabolic index in several different diseases, including hypertension (14), diabetes (15), left ventricular geometry change (16), and endometriosis (17).
As far as we know, although CMI offers important insights for diagnosing and predicting the risk of various metabolism-related diseases, research on the relationship between CMI and CVD is limited. Thus, using data from the National Health and Nutrition Examination Survey (NHANES) from 2007 to 2018, our research aims to further investigate the association between CMI and CVD.
2 Methods
2.1 Study population
This research utilized data from the NHANES, a continuous program designed to evaluate the dietary habits and health status of the U.S. population (18, 19). The survey follows a sophisticated sampling technique to ensure it represents the national population and is managed by the National Center for Health Statistics (NCHS). The NCHS Institutional Review Board approved the study ethically, with each volunteer providing their informed consent (20).
The study analyzed continuous NHANES data spanning 2007 to 2018, starting with 59,842 participants. Then, we excluded 25,073 participants with incomplete CVD evaluation data, 20,427 with missing complete data about CMI, and 1,505 whose covariate data were missing. 12,837 representative volunteers in all were eventually enrolled in this research (Figure 1).
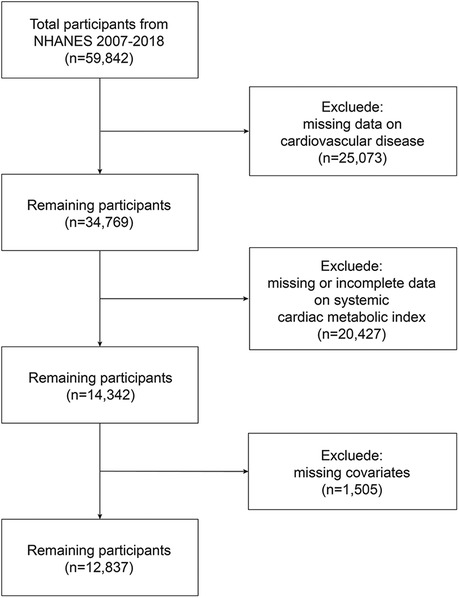
Figure 1. Flowchart of the sample selection from NHANES 2007–2018.
2.2 CMI
The CMI for each participant is determined utilizing the following formula. CMI = [TG (mmol/L)/HDL-C (mmol/L)] × [WC (cm)/height(cm)].
2.3 Outcome ascertainment
The outcome variable for this study was CVD, which encompasses stroke, angina pectoris, congestive heart failure (CHF), heart attack, and coronary heart disease (CHD), based on previous research. “Has a doctor or other healthcare professional ever told you that you have coronary heart disease/stroke/heart attack/angina pectoris/congestive heart failure?” was the question posed to each individual. If an individual responded “yes” to any of the questions, they were identified as having CVD.
2.4 Covariables
The covariates considered in this study included age, weight, height, education level, income-to-poverty ratio, race, gender, waist circumference (WC), glycosylated hemoglobin (HbA1c), High-density lipoprotein cholesterol (HDL-C), body mass index (BMI), exercise status, smoking status, serum uric acid (SUA), triglycerides (TG), fasting blood glucose (FPG), serum creatinine (Scr), total cholesterol (TC), diabetes, hypertension, hyperlipidemia, serum phosphorus, serum calcium, vitamin D. The sporting status was determined by “engaged in moderate leisure activities”, and “smoked at least 100 cigarettes in life” indicated one's smoking status. “Have you ever been told you have diabetes, hypertension, or hyperlipidemia?” was the question used to gauge a person's history of diabetes, hypertension, and hyperlipidemia. You can access all of the data about these variables at https://www.cdc.gov/nchs/nhanes/.
2.5 Statistical analysis
Since the CMI is a skewed distribution, it was Ln-transformed by us to make it close to a normal distribution. Chi-square tests were utilized for categorical data and t-tests were employed for continuous variables to assess participant demographics, which were categorized based on CMI quartiles. Multivariate logistic regression analysis was used to examine the association between LnCMI and CVD. We built four models in total. Model 1 did not include any covariate adjustments. For Model 2, we took race, gender, and age into account. We made further adjustments for education level, income-to-poverty ratio, diabetes, smoker, exercise status in Model 3. In model 4, we additionally adjusted for hypertension, hyperlipidemia, TC, serum calcium, serum phosphorus, Scr, SUA, HbA1c, vitamin D. Stratified analyses and interaction tests were also conducted by race, age (<30/≥30, <40/≥40, <50/≥50, <60/≥60, <70/≥70 years), exercise (yes/no), smoking (yes/no), gender (male/female), hypertension (yes/no), diabetes mellitus (yes/no) and hyperlipidemia (yes/no). To ascertain the nonlinear association between CMI and CVD, smoothing curve fitting was implemented additionally. All statistical analyses were conducted utilizing EmpowerStats (version 2.0) and R (version 4.3). The definition of statistical significance is p < 0.05 on both sides.
3 Results
3.1 Baseline characteristics
Table 1 displays the characteristics of the research population. In this study, 12,837 participants were enrolled, with an average age of 51.03 ± 17.25 years. Of these, 51.94% were female and 48.06% were male. The ranges of LnCMI in transform for quartiles 1‒4 were −3.61 to −1.25 (≤−1.25), −1.25 to −0.68 (≤−0.68), −0.68 to −0.11 (≤−0.11) and −0.11‒3.68 (≤3.68), respectively. Overall, 11.83% of individuals had CVD, and this frequency increased as the CMI quartiles increased (Quartile 1: 7.29%, Quartile 2: 11.28%, Quartile 3: 12.12%, Quartile 4: 16.59%; P < 0.001). The distribution of the following variables showed significant differences between quartiles: age, race, gender, income-to-poverty ratio, education, waist circumference, BMI, moderate activity, smoking habits, hyperuricemia, hypertension and diabetes, HDL-C, serum uric acid, serum creatinine, total cholesterol, HbA1c, triglycerides and Vitamin D (all P < 0.05). Individuals in the higher CMI group, compared to those in the lowest CMI group, had higher BMI, WC, SUA, TC, TG, and HbA1c levels, and lower Vitamin D and HDL-C levels, along with an increased likelihood of hyperuricemia, diabetes, and hypertension (all P < 0.05). Notably, there was a greater prevalence of CVD among individuals with high CMI values (P < 0.05).
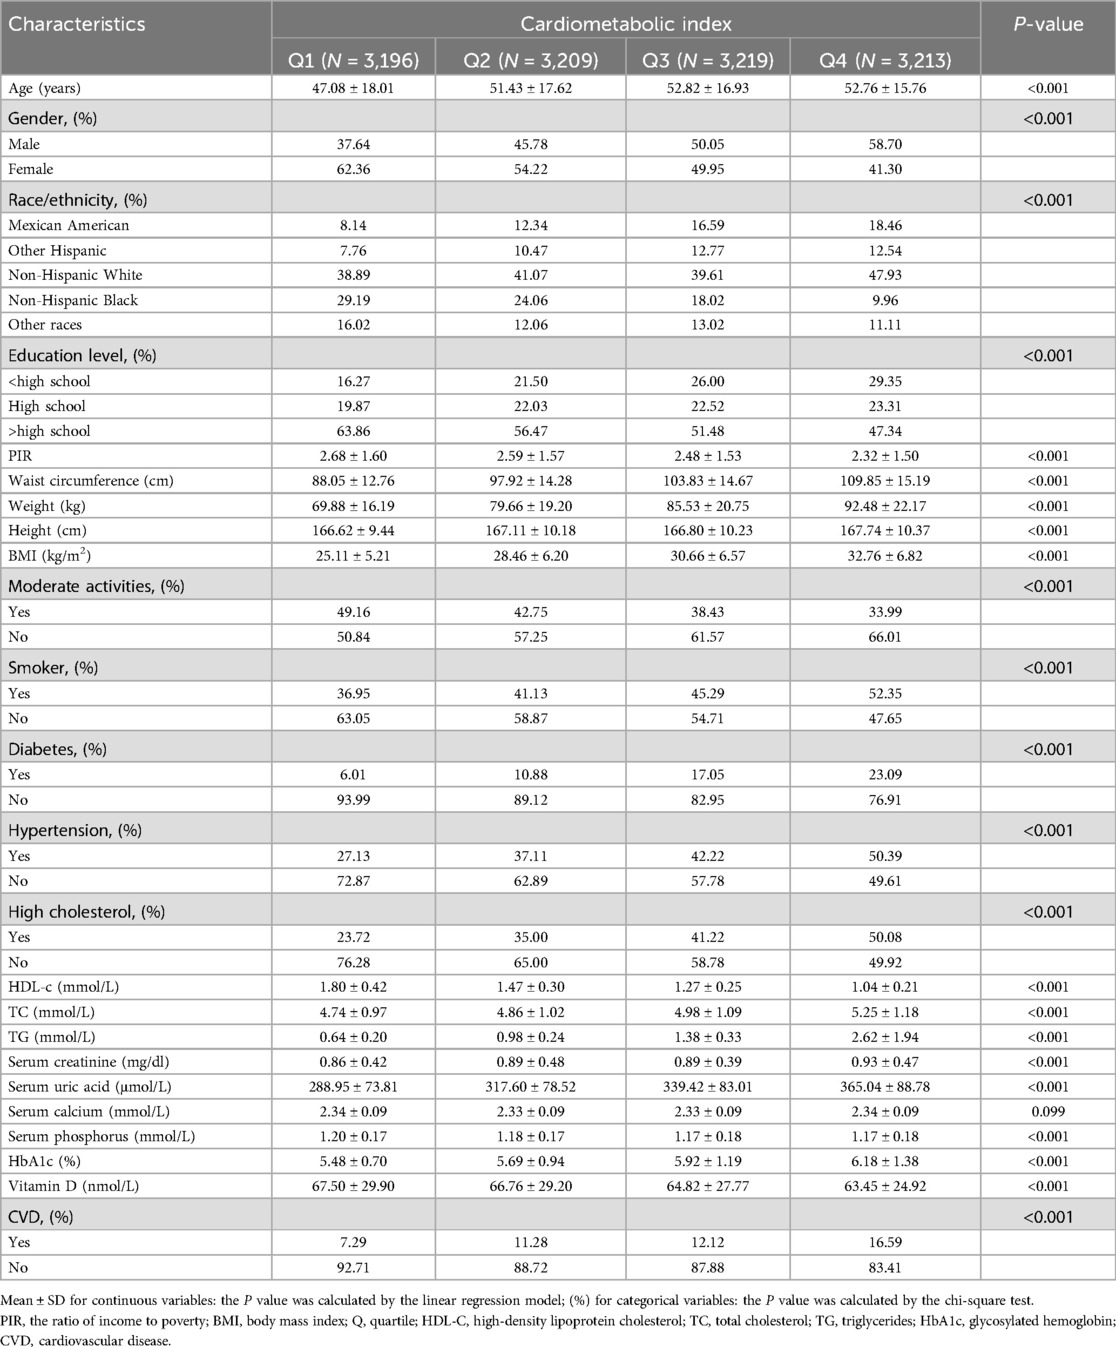
Table 1. Baseline characteristics of study population according to cardiometabolic index quartiles.
Additionally, we have plotted a Correlation Heatmap (Supplementary Figure S2) to analyze the linear relationships among six variables: CMI, WC, height, HDL-C, TG, and BMI. The results demonstrate a strong positive correlation between CMI, TG, WC, and BMI, while HDL-C exhibits a negative correlation with both CMI and TG.
3.2 Association between CMI and CVD
Table 2 shows that across all four adjusting models, CMI was positively associated with CVD. In model 1, each unit increase in Ln-transformed CMI was associated with a 45% rise in the odds of CVD prevalence (OR = 1.45, 95% CI: 1.36–1.54). After full adjustment, participants presenting with an increase of one unit in Ln-transformed CMI associated a 15% higher odds of CVD prevalence (OR = 1.15, 95% CI: 1.05–1.26). Besides, the statistical significance of this association persisted even after treating LnCMI as quartiles. Individuals falling into the highest CMI quartile (Quartile 4) demonstrated substantially 35% higher odds than those in the lowest CMI quartile (Quartile 1) (OR = 1.35, 95% CI: 1.11–1.66) (P for trend = 0.006). Additionally, The nonlinear association between CMI and CVD was further explored by employing a smooth curve fitting technique, as illustrated in Figure 2. Our findings suggest that there was no nonlinear relationship between CMI and CVD in our selected sample.
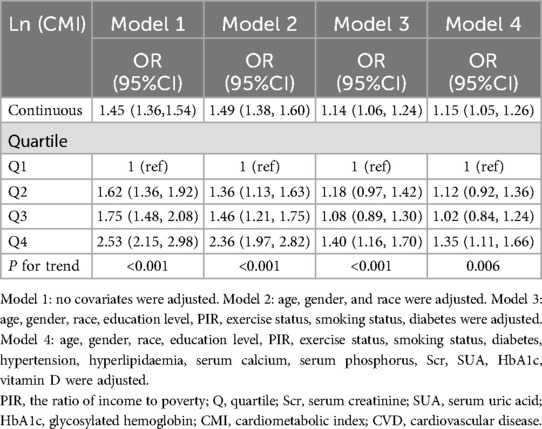
Table 2. Association of CMI with CVD in different models among all participants.
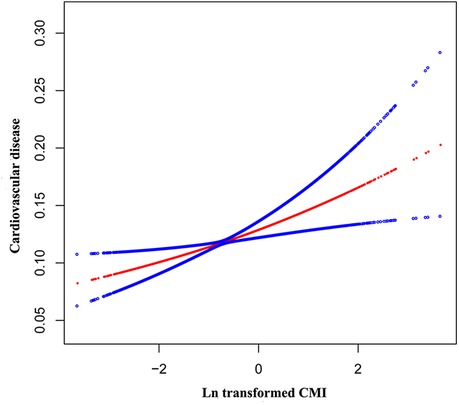
Figure 2. The nonlinear associations between Ln transformed CMI and CVD. The solid red line represents the smooth curve fit between variables. Blue bands represent the 95% of confidence interval from the fit.
Since HS CRP data in NHANES is only available for the years 2015–2018, we conducted a separate statistical analysis (Supplementary Table S1) specifically for this period.
3.3 Subgroup analyses
We investigated whether the association between LnCMI and CVD was robust in different demographic settings by performing a subgroup analysis with an interaction test. Figure 3 demonstrates that for every unit rise in LnCMI, there is a 15% higher odds of CVD prevalence in both males (OR = 1.15, 95% CI: 1.03–1.28) and females (OR = 1.15, 95% CI: 1.01–1.31). Gender had no significant effect on the relationship between LnCMI and CVD, according to the interaction analysis (P for interaction = 0.9764). Additionally, the positive association found between LnCMI and CVD was not greatly influenced by any of the stratifications, such as gender, exercise status, smoking status, diabetes, hyperlipidemia, age, or hypertension (all P for trend >0.05).
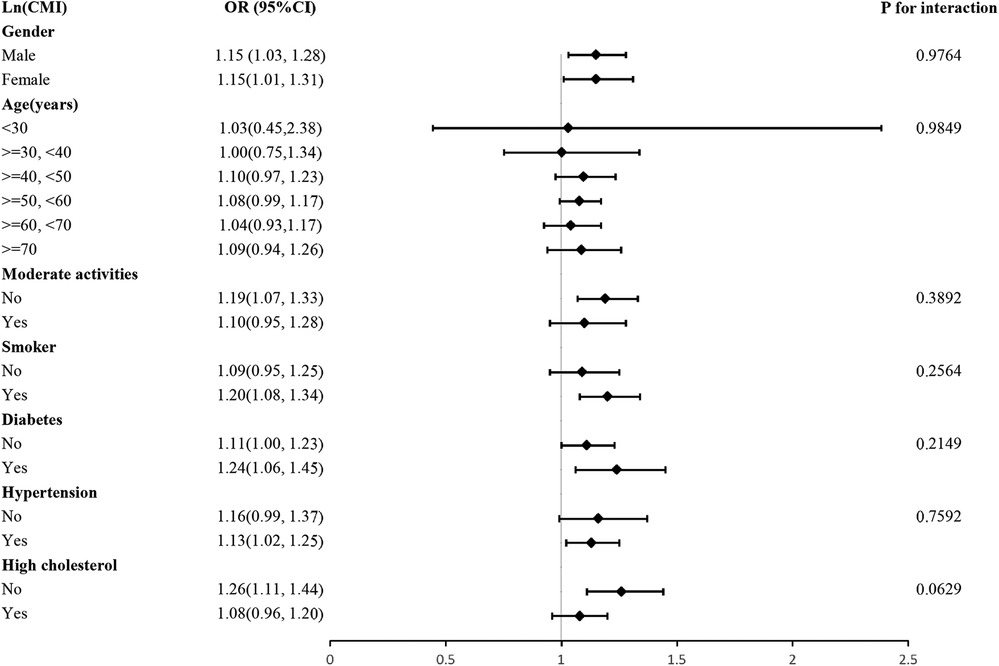
Figure 3. Subgroup and interaction analysis of LnCMI and CVD by gender, age, moderate activities, smoker, hypertension, diabetes and hyperlipidemia.
4 Discussion
We observed that individuals with higher CMI had higher odds of CVD prevalence in our cross-sectional study, which included 12,837 participants. There was shown to be a positive linear connection between CMI and CVD that remained robust when all variables were fully adjusted for. Additionally, this association remained consistent across various demographic settings. Our findings provide evidence suggesting that CMI may predict the occurrence of cardiovascular disease. Furthermore, we plotted ROC curve (Supplementary Figures S1, S3, S4) to illustrate that CMI is applicable to both diabetic and non-diabetic populations and is a better predictor of cardiovascular disease than metabolic syndrome.
Based on previous studies, obesity is a definite factor in the risk of CVD and mortality among adults (21, 22). Although prior research has indicated an association between the odds of CVD prevalence and traditional obesity-related indices like BMI (23–25), the obesity paradox implies that BMI and other general body fatness metrics are not capable of assessing the distribution of body fat or individual's metabolic health (26, 27). CMI, which includes WHtR and TG/HDL-C ratio, better reflects the interaction between body fat distribution and metabolic function than traditional obesity-related indicators (8). BMI, in comparison to CMI, is calculated solely based on weight and height and does not accurately reflect fat distribution or metabolic health status. It fails to distinguish between muscle and fat and has a weaker predictive capability for abdominal obesity and metabolic abnormalities. WC, while a direct measure of abdominal obesity, still has its limitations when used in isolation. It cannot differentiate between metabolically healthy obesity and metabolically unhealthy obesity. The diagnosis of metabolic syndrome encompasses TG, fasting blood glucose,blood pressure, WC, and HDL-C, which involves relatively cumbersome data collection and is prone to significant information gaps. CMI, on the other hand, can identify high-risk individuals earlier and more accurately, without the need to wait for the fulfillment of three metabolic abnormality criteria to assess risk. Research has shown that WHtR is a more effective indicator of the risk of stroke and CHD than BMI and WC (28, 29). Compared to other single indicators, the TG/HDL-C ratio is more closely linked to obesity, particularly with visceral fat accumulation, making it a better indicator for assessing metabolic health (30, 31). Clinicians can modify treatment plans in response to fluctuations in this ratio, aiming to lower the risk of cardiovascular events (32, 33). To our knowledge, several studies have shown a positive relationship between CMI and the odds of CVD prevalence, but these findings have thus far been validated only in East Asian populations (14, 16, 34, 35). For example, Wang et al. discovered a significant and independent relationship between female ischemic stroke and CMI, In a cross-sectional study involving 11,345 Chinese individuals. Moreover, Ichiro et al. also reported that CMI serves as a valuable indicator of how atherosclerosis is progressing in PAD patients and may even be able to predict the patient's prognosis. This research further validates the relationship between CMI and CVD among American adults.
Various underlying mechanisms might account for this relationship. First, in obese individuals, increased adipose tissue leads to a significant increase in leptin secretion (36). Leptin is a versatile adipokine. In addition to its metabolic functions, leptin exhibits potent pro-inflammatory effects that play a significant part in cardiovascular disease development. A notable function of leptin within the vascular system is its ability to enhance the interaction between endothelial cells and monocytes (37). Monocytes traverse the vascular endothelium through the action of adhesion molecules (38). These monocytes then cross the endothelial layer, transform into macrophages, and take up low-density lipoproteins (LDL) to form foam cells that eventually form atherosclerotic plaques (39). TNF-α released by macrophages also induces vascular endothelial cells to produce a substantial quantity of reactive oxygen species (ROS), and these oxidized substances damage endothelial cells and inhibit their release of nitric oxide (NO), leading to impaired vasodilatation (40, 41). Second, compared to general body fat, visceral adipose tissue (VAT) cells are relatively active and are pivotal in the development of CVD due to their release of MCP-1, IL-6, and TNF-α (42, 43). These molecules foster a persistent, low-grade inflammatory state within VAT, leading to dysfunction within the adipose tissue (44, 45). VAT accumulation elevates circulating free fatty acids, aggravating dyslipidemia and intensifying metabolic imbalances (46, 47). Elevated free fatty acids (FFA) in the liver lead to the buildup of intracellular lipid metabolites like diacylglycerol and ceramides (48). These metabolites disrupt the function of insulin receptor substrate (IRS), thereby hindering insulin's ability to suppress gluconeogenesis (49). Moreover, the inflammatory environment also disrupts glucose regulation, promoting insulin resistance and ultimately leading to type 2 diabetes (50, 51). Collectively, these factors substantially heighten the odds of cardiovascular events (52).
The key advantage of this research is that we used NHANES data, which has a large and nationally representative sample size. In addition, we accounted for potential confounding variables to enhance the reliability of our findings. Finally, we further validated our results with subgroup analyses in different populations. Nevertheless, we admit that our study has certain limitations. First, despite adjusting for numerous potential covariates, it was not possible to completely rule out the effects of unidentified or unmeasured confounders. For instance, the medication status of patients is indeed a significant covariate; however, the NHANES database presented substantial gaps in the relevant data regarding patient medication, rendering its inclusion unfeasible. Second, it is impossible for us to infer a causal relationship between CMI and CVD because of the cross-sectional design. Third, the sample for this study consisted solely of a US population.
5 Conclusion
Our research revealed that among US adults, having higher CMI levels is substantially associated with higher odds of CVD prevalence. Therefore, we propose CMI as a potential biomarker of CVD in US individuals. However, in order to corroborate our findings, further prospective investigations are still required.
Data availability statement
The raw data supporting the conclusions of this article will be made available by the authors, without undue reservation.
Ethics statement
The studies involving humans were approved by National Center for Health Statistics. The studies were conducted in accordance with the local legislation and institutional requirements. The participants provided their written informed consent to participate in this study.
Author contributions
FC: Data curation, Formal analysis, Methodology, Writing – original draft. YN: Data curation, Writing – original draft. RW: Data curation, Writing – original draft. HJ: Data curation, Writing – original draft. JZ: Data curation, Writing – original draft. CW: Data curation, Writing – original draft. XX: Data curation, Writing – original draft. YJ: Validation, Writing – review & editing.
Funding
The author(s) declare that no financial support was received for the research and/or publication of this article.
Acknowledgments
We would like to thank all participants in this study.
Conflict of interest
The authors declare that the research was conducted in the absence of any commercial or financial relationships that could be construed as a potential conflict of interest.
Generative AI statement
The author(s) declare that no Generative AI was used in the creation of this manuscript.
Publisher's note
All claims expressed in this article are solely those of the authors and do not necessarily represent those of their affiliated organizations, or those of the publisher, the editors and the reviewers. Any product that may be evaluated in this article, or claim that may be made by its manufacturer, is not guaranteed or endorsed by the publisher.
Supplementary material
The Supplementary Material for this article can be found online at: https://www.frontiersin.org/articles/10.3389/fcvm.2025.1516591/full#supplementary-material
Abbreviations
CMI, Cardiometabolic index; CVD, Cardiovascular disease; NHANES, National Health and Nutrition Examination Survey; NCHS, National Center for Health Statistics; CHD, Coronary heart disease; CHF, Congestive heart failure; TG/HDL-C ratio, Triglyceride to high-density lipoprotein cholesterol ratio; WHtR, Waist-to-height ratio; BMI, Body mass index; PIR, Income-to-Poverty Ratio; WC, Waist circumference; HbA1c, Glycosylated hemoglobin; HDL-C, High-density lipoprotein cholesterol; SUA, Serum uric acid; TG, Triglycerides; FPG, Fasting blood glucose; Scr, Serum creatinine; TC, Total cholesterol; LDL, Low-density lipoproteins; ROS, Reactive oxygen species; NO, Nitric oxide; VAT, Visceral adipose tissue; FFA, Free fatty acids; IRS, Insulin receptor substrate.
References
1. Walli-Attaei M, Joseph P, Rosengren A, Chow CK, Rangarajan S, Lear SA, et al. Variations between women and men in risk factors, treatments, cardiovascular disease incidence, and death in 27 high-income, middle-income, and low-income countries (PURE): a prospective cohort study. Lancet. (2020) 396(10244):97–109. doi: 10.1016/S0140-6736(20)30543-2
2. Tsao CW, Aday AW, Almarzooq ZI, Anderson CAM, Arora P, Avery CL, et al. Heart disease and stroke statistics—2023 update: a report from the American Heart Association. Circulation. (2023) 147(8):e93–621. doi: 10.1161/CIR.0000000000001123
3. Roth GA, Johnson C, Abajobir A, Abd-Allah F, Abera SF, Abyu G, et al. Global, regional, and national burden of cardiovascular diseases for 10 causes, 1990–2015. J Am Coll Cardiol. (2017) 70(1):1–25. doi: 10.1016/j.jacc.2017.04.052
4. Townsend N, Kazakiewicz D, Lucy Wright F, Timmis A, Huculeci R, Torbica A, et al. Epidemiology of cardiovascular disease in Europe. Nat Rev Cardiol. (2022) 19(2):133–43. doi: 10.1038/s41569-021-00607-3
5. Zhao D, Liu J, Wang M, Zhang X, Zhou M. Epidemiology of cardiovascular disease in China: current features and implications. Nat Rev Cardiol. (2019) 16(4):203–12. doi: 10.1038/s41569-018-0119-4
6. Mensah GA, Wei GS, Sorlie PD, Fine LJ, Rosenberg Y, Kaufmann PG, et al. Decline in cardiovascular mortality: possible causes and implications. Circ Res. (2017) 120(2):366–80. doi: 10.1161/CIRCRESAHA.116.309115
7. Roth GA, Mensah GA, Johnson CO, Addolorato G, Ammirati E, Baddour LM, et al. Global burden of cardiovascular diseases and risk factors, 1990–2019: update from the GBD 2019 study. J Am Coll Cardiol. (2020) 76(25):2982–3021. doi: 10.1016/j.jacc.2020.11.010
8. Wakabayashi I, Daimon T. The “cardiometabolic index” as a new marker determined by adiposity and blood lipids for discrimination of diabetes mellitus. Clin Chim Acta. (2015) 438:274–8. doi: 10.1016/j.cca.2014.08.042
9. Acosta-García E, Concepción-Páez M. Cardiometabolic index as a predictor of cardiovascular risk factors in adolescents. Rev Salud Publica (Bogota). (2018) 20(3):340–5. doi: 10.15446/rsap.v20n3.61259
10. Miao M, Deng X, Wang Z, Jiang D, Lai S, Yu S, et al. Cardiometabolic index is associated with urinary albumin excretion and renal function in aged person over 60: data from NHANES 2011–2018. Int J Cardiol. (2023) 384:76–81. doi: 10.1016/j.ijcard.2023.04.017
11. Shi WR, Wang HY, Chen S, Guo XF, Li Z, Sun YX. Estimate of prevalent diabetes from cardiometabolic index in general Chinese population: a community-based study. Lipids Health Dis. (2018) 17(1):236. doi: 10.1186/s12944-018-0886-2
12. Pasdar Y, Moradi S, Moludi J, Saiedi S, Moradinazar M, Hamzeh B, et al. Waist-to-height ratio is a better discriminator of cardiovascular disease than other anthropometric indicators in Kurdish adults. Sci Rep. (2020) 10(1):16228. doi: 10.1038/s41598-020-73224-8
13. Kammar-García A, Hernández-Hernández ME, López-Moreno P, Ortíz-Bueno AM, Martínez-Montaño ML. Relation of body composition indexes to cardiovascular disease risk factors in young adults. Semergen. (2019) 45(3):147–55. doi: 10.1016/j.semerg.2018.07.004
14. Wang H, Chen Y, Sun G, Jia P, Qian H, Sun Y. Validity of cardiometabolic index, lipid accumulation product, and body adiposity index in predicting the risk of hypertension in Chinese population. Postgrad Med. (2018) 130(3):325–33. doi: 10.1080/00325481.2018.1444901
15. Chen M, Xiong S, Zheng J, Zhang J, Ye D, Xian Y, et al. Association between cardiometabolic index and gestational diabetes mellitus: a cross-sectional study. Endocrine. (2025) 87(2):569–77.39313707
16. Wang H, Sun Y, Li Z, Guo X, Chen S, Ye N, et al. Gender-specific contribution of cardiometabolic index and lipid accumulation product to left ventricular geometry change in general population of rural China. BMC Cardiovasc Disord. (2018) 18(1):62. doi: 10.1186/s12872-018-0798-0
17. Wang J, Wang B, Liu T, Shang J, Gu X, Zhang T, et al. Association between cardiometabolic Index (CMI) and endometriosis: a cross-sectional study on NHANES. Lipids Health Dis. (2024) 23(1):328. doi: 10.1186/s12944-024-02314-7
18. Zhang Y, Xie R, Ou J. A U-shaped association between serum albumin with total triiodothyronine in adults. J Clin Lab Anal. (2022) 36(6):e24473. doi: 10.1002/jcla.24473
19. Xie R, Zhang Y. Is assessing the degree of hepatic steatosis and fibrosis based on index calculations the best choice for epidemiological studies? Environ Pollut. (2023) 317:120783. doi: 10.1016/j.envpol.2022.120783
20. Xie R, Zhang Y. Association between 19 dietary fatty acids intake and rheumatoid arthritis: results of a nationwide survey. Prostaglandins Leukot Essent Fat Acids. (2023) 188:102530. doi: 10.1016/j.plefa.2022.102530
21. Powell-Wiley TM, Poirier P, Burke LE, Després JP, Gordon-Larsen P, Lavie CJ, et al. Obesity and cardiovascular disease: a scientific statement from the American Heart Association. Circulation. (2021) 143(21):e984–e1010. doi: 10.1161/CIR.0000000000000973
22. Piché ME, Poirier P, Lemieux I, Després JP. Overview of epidemiology and contribution of obesity and body fat distribution to cardiovascular disease: an update. Prog Cardiovasc Dis. (2018) 61(2):103–13. doi: 10.1016/j.pcad.2018.06.004
23. Lv Y, Zhang Y, Li X, Gao X, Ren Y, Deng L, et al. Body mass index, waist circumference, and mortality in subjects older than 80 years: a Mendelian randomization study. Eur Heart J. (2024) 45(24):2145–54. doi: 10.1093/eurheartj/ehae206
24. Ashwell M, Gunn P, Gibson S. Waist-to-height ratio is a better screening tool than waist circumference and BMI for adult cardiometabolic risk factors: systematic review and meta-analysis. Obes Rev. (2012) 13(3):275–86. doi: 10.1111/j.1467-789X.2011.00952.x
25. Khan SS, Ning H, Wilkins JT, Allen N, Carnethon M, Berry JD, et al. Association of body mass Index with lifetime risk of cardiovascular disease and compression of morbidity. JAMA Cardiol. (2018) 3(4):280–7. doi: 10.1001/jamacardio.2018.0022
26. Akoumianakis I, Antoniades C. The interplay between adipose tissue and the cardiovascular system: is fat always bad? Cardiovasc Res. (2017) 113(9):999–1008. doi: 10.1093/cvr/cvx111
27. Fenger-Grøn M, Overvad K, Tjønneland A. Frost L: lean body mass is the predominant anthropometric risk factor for atrial fibrillation. J Am Coll Cardiol. (2017) 69(20):2488–97. doi: 10.1016/j.jacc.2017.03.558
28. Mohammadreza B, Farzad H, Davoud K, Fereidoun Prof AF. Prognostic significance of the complex “visceral adiposity Index” vs. Simple anthropometric measures: tehran lipid and glucose study. Cardiovasc Diabetol. (2012) 11:20. doi: 10.1186/1475-2840-11-20
29. Gelber RP, Gaziano JM, Orav EJ, Manson JE, Buring JE, Kurth T. Measures of obesity and cardiovascular risk among men and women. J Am Coll Cardiol. (2008) 52(8):605–15. doi: 10.1016/j.jacc.2008.03.066
30. Kim J, Shin SJ, Kim YS, Kang HT. Positive association between the ratio of triglycerides to high-density lipoprotein cholesterol and diabetes incidence in Korean adults. Cardiovasc Diabetol. (2021) 20(1):183. doi: 10.1186/s12933-021-01377-5
31. Rasouli N, Younes N, Utzschneider KM, Inzucchi SE, Balasubramanyam A, Cherrington AL, et al. Association of baseline characteristics with insulin sensitivity and β-cell function in the glycemia reduction approaches in diabetes: a comparative effectiveness (GRADE) study cohort. Diabetes Care. (2021) 44(2):340–9. doi: 10.2337/dc20-1787
32. Mirshafiei H, Darroudi S, Ghayour-Mobarhan M, Esmaeili H, AkbariRad M, Mouhebati M, et al. Altered triglyceride glucose index and fasted serum triglyceride high-density lipoprotein cholesterol ratio predict incidence of cardiovascular disease in the mashhad cohort study. Biofactors. (2022) 48(3):643–50. doi: 10.1002/biof.1816
33. Che B, Zhong C, Zhang R, Pu L, Zhao T, Zhang Y, et al. Triglyceride-glucose index and triglyceride to high-density lipoprotein cholesterol ratio as potential cardiovascular disease risk factors: an analysis of UK biobank data. Cardiovasc Diabetol. (2023) 22(1):34. doi: 10.1186/s12933-023-01762-2
34. Wang H, Chen Y, Guo X, Chang Y, Sun Y. Usefulness of cardiometabolic index for the estimation of ischemic stroke risk among general population in rural China. Postgrad Med. (2017) 129(8):834–41. doi: 10.1080/00325481.2017.1375714
35. Wakabayashi I, Sotoda Y, Hirooka S, Orita H. Association between cardiometabolic index and atherosclerotic progression in patients with peripheral arterial disease. Clin Chim Acta. (2015) 446:231–6. doi: 10.1016/j.cca.2015.04.020
36. Koh KK, Park SM, Quon MJ. Leptin and cardiovascular disease: response to therapeutic interventions. Circulation. (2008) 117(25):3238–49. doi: 10.1161/CIRCULATIONAHA.107.741645
37. Adya R, Tan BK, Randeva HS. Differential effects of leptin and adiponectin in endothelial angiogenesis. J Diabetes Res. (2015) 2015:648239. doi: 10.1155/2015/648239
38. Porreca E, Di Febbo C, Fusco L, Moretta V, Di Nisio M, Cuccurullo F. Soluble thrombomodulin and vascular adhesion molecule-1 are associated to leptin plasma levels in obese women. Atherosclerosis. (2004) 172(1):175–80. doi: 10.1016/j.atherosclerosis.2003.09.022
39. Odegaard JI, Chawla A. Mechanisms of macrophage activation in obesity-induced insulin resistance. Nat Clin Pract Endocrinol Metab. (2008) 4(11):619–26. doi: 10.1038/ncpendmet0976
40. Beltowski J, Wójcicka G, Jamroz-Wiśniewska A, Borkowska E, Marciniak A. Antioxidant treatment normalizes nitric oxide production, renal sodium handling and blood pressure in experimental hyperleptinemia. Life Sci. (2005) 77(15):1855–68. doi: 10.1016/j.lfs.2005.02.013
41. Bouloumié A, Curat CA, Sengenès C, Lolmède K, Miranville A, Busse R. Role of macrophage tissue infiltration in metabolic diseases. Curr Opin Clin Nutr Metab Care. (2005) 8(4):347–54. doi: 10.1097/01.mco.0000172571.41149.52
42. Aparecida Silveira E, Vaseghi G, de Carvalho Santos AS, Kliemann N, Masoudkabir F, Noll M, et al. Visceral obesity and its shared role in cancer and cardiovascular disease: a scoping review of the pathophysiology and pharmacological treatments. Int J Mol Sci. (2020) 21(23):9042. doi: 10.3390/ijms21239042
43. Tchernof A, Després JP. Pathophysiology of human visceral obesity: an update. Physiol Rev. (2013) 93(1):359–404. doi: 10.1152/physrev.00033.2011
44. Lumeng CN, Bodzin JL, Saltiel AR. Obesity induces a phenotypic switch in adipose tissue macrophage polarization. J Clin Invest. (2007) 117(1):175–84. doi: 10.1172/JCI29881
45. Ormazabal P, Scazzocchio B, Varì R, Santangelo C, D'Archivio M, Silecchia G, et al. Effect of protocatechuic acid on insulin responsiveness and inflammation in visceral adipose tissue from obese individuals: possible role for PTP1B. Int J Obes (Lond). (2018) 42(12):2012–21. doi: 10.1038/s41366-018-0075-4
46. Ibrahim MM. Subcutaneous and visceral adipose tissue: structural and functional differences. Obes Rev. (2010) 11(1):11–8. doi: 10.1111/j.1467-789X.2009.00623.x
47. Wajchenberg BL. Subcutaneous and visceral adipose tissue: their relation to the metabolic syndrome. Endocr Rev. (2000) 21(6):697–738. doi: 10.1210/edrv.21.6.0415
48. Samuel VT, Shulman GI. The pathogenesis of insulin resistance: integrating signaling pathways and substrate flux. J Clin Invest. (2016) 126(1):12–22. doi: 10.1172/JCI77812
49. Holland WL, Summers SA. Sphingolipids, insulin resistance, and metabolic disease: new insights from in vivo manipulation of sphingolipid metabolism. Endocr Rev. (2008) 29(4):381–402. doi: 10.1210/er.2007-0025
50. Prattichizzo F, De Nigris V, Spiga R, Mancuso E, La Sala L, Antonicelli R, et al. Inflammageing and metaflammation: the yin and yang of type 2 diabetes. Ageing Res Rev. (2018) 41:1–17. doi: 10.1016/j.arr.2017.10.003
51. Saltiel AR, Olefsky JM. Inflammatory mechanisms linking obesity and metabolic disease. J Clin Invest. (2017) 127(1):1–4. doi: 10.1172/JCI92035
52. Ballin M, Nordström P, Niklasson J, Nordström A. Associations of visceral adipose tissue and skeletal muscle density with incident stroke, myocardial infarction, and all-cause mortality in community-dwelling 70-year-old individuals: a prospective cohort study. J Am Heart Assoc. (2021) 10(9):e020065. doi: 10.1161/JAHA.120.020065
Keywords: cross-sectional study, cardiometabolic index, cardiovascular disease, NHANES, obesity
Citation: Chen F, Niu Y, Wu R, Jiang H, Zhu J, Wang C, Xia X and Jin Y (2025) Association between cardiometabolic index and cardiovascular disease: evidence From the NHANES 2007–2018. Front. Cardiovasc. Med. 12:1516591. doi: 10.3389/fcvm.2025.1516591
Received: 24 October 2024; Accepted: 28 April 2025;
Published: 12 May 2025.
Edited by:
Chiara Macchi, University of Milan, ItalyReviewed by:
Nicolas Padilla-Raygoza, Institute of Public Health of the State of Guanajuato (ISAPEG), MexicoMustafa Şahin, Ankara University, Türkiye
Copyright: © 2025 Chen, Niu, Wu, Jiang, Zhu, Wang, Xia and Jin. This is an open-access article distributed under the terms of the Creative Commons Attribution License (CC BY). The use, distribution or reproduction in other forums is permitted, provided the original author(s) and the copyright owner(s) are credited and that the original publication in this journal is cited, in accordance with accepted academic practice. No use, distribution or reproduction is permitted which does not comply with these terms.
*Correspondence: Yunpeng Jin, ODAxMzAxM0B6anUuZWR1LmNu