Abstract
Background:
Bioimpedance cardiography offers a non-invasive and time-efficient method to measure hemodynamic parameters. Previous studies only investigated its reliability under steady-state conditions and at maximum load but not at ventilatory thresholds (VTs). This is the first study that assesses the reliability of measured hemodynamic parameters at different exercise stages during cardiopulmonary exercise testing (CPET) using prespecified strict criteria to assess reliability.
Methods:
Data from 31 healthy, well-trained adults were analyzed. Each participant completed two CPETs, both following the same ramp protocol, with a 7-day interval between them. Hemodynamic parameters were measured with the PhysioFlow® (Manatec Biomedical, Poissy, France) at characteristic phases and thresholds [VT1, VT2, and peak oxygen uptake (V̇O2peak)]. To ensure comparability, the wattage (power) corresponding to the thresholds in Test 1 (PVT1, PVT2, and PV̇O2peak) was used for Test 2.
Results:
Heart rate, stroke volume, and cardiac output demonstrated good reliability on a group level (mean intraclass correlation >0.75) at both thresholds (0.91, 0.80, and 0.77 at PVT1; 0.92, 0.80, and 0.77 at PVT2) and at PV̇O2peak (0.93, 0.82, and 0.80). For stroke volume at PV̇O2peak, both individual differences (−39.0 to 36.9 mL for the women and −39.9 to 45.2 mL for the men) and mean detectable change (17.5 mL) were larger than the a priori defined acceptable ranges of agreement (−3.6 to 3.8 mL for the women and −4.5 to 3.3 mL for the men).
Conclusion:
The PhysioFlow® reliably measures heart rate, stroke volume, and cardiac output during CPET on a group level. However, as shown by the Bland–Altman plots, the reliability is too low to be used for individual comparisons.
Introduction
Cardiac output (CO) is important in clinical settings to understand cardiac function and hemodynamics. In addition to electrocardiogram, ventilation, and gas exchange, CO provides useful diagnostic information on cardiac function during exercise and helps to evaluate factors limiting exercise capacity (1–4). This information enables more precise treatment of patients in clinical settings (5, 6).
The gold standard to assess CO is the highly invasive direct Fick method, which is expensive and requires adherence to stringent conditions for accurate measurements (7). Thus, this method is less suitable for clinical routine (8). In addition to the direct Fick method, several methods are available to measure CO (9, 10). The transthoracic impedance cardiography method is one of them, which uses electrodes on the neck and chest to detect and transmit impedance changes in the thorax to calculate hemodynamic parameters (11). Impedance cardiography offers a non-invasive, economical, and fast method of measuring hemodynamic parameters during exercise (12). The Physioflow® device uses transthoracic impedance analysis to measure CO (13). Compared to the direct Fick method, it demonstrates an acceptable correlation (r = 0.85) during steady-state exercise at low workloads (10–50 watts), which were selected based on the participants’ fitness levels to remain below the ventilatory threshold (VT) and ensure steady-state conditions (14), and a high correlation (r = 0.94) at high-intensity exercise (15). However, a high correlation does not necessarily indicate good validity, as demonstrated by the mean difference and 95% confidence interval (CI95%) in the Bland–Altman comparison between the direct Fick and the transthoracic impedance method, which was 2.89 L/min (−4.04; 2.89) or, as described in a percentage, −11% (−26.94%; 21.38%).
The reliability of the PhysioFlow® impedance cardiograph has been investigated during rest (13, 16) and at low to moderate intensity under steady-state exercise (13, 14), but limited data are available at high-intensity and maximum loads (13, 17, 18). Only one study examined reliability at different stages during an incremental exercise test (15). In clinical settings, VTs are used to assess exercise and functional capacity, especially in submaximal areas (19). Thus, if CO can be reliably measured at VT and peak exercise, it could benefit diagnosis, risk stratification, and treatment strategies, especially for cardiovascular diseases (20). This study aimed to assess the reliability of the PhysioFlow® device at the VTs during cardiopulmonary exercise testing (CPET), which is still unknown.
The second innovative approach of this study is how reliability is defined. In previous studies, there was disagreement about what represents acceptable reliability for this device. While some studies considered a ±30% agreement limit acceptable (21), later studies using Bland–Altman plots considered limits of agreement with a 95% confidence interval (CI95%) of less than ±20% acceptable (15). Other studies (22) defined an intraclass correlation (ICC) coefficient of ≥0.7 as reliable. In contrast, this study is the first to set strict data-driven and a priori-defined criteria to classify reliability by using the lower limits of the CI95% of the ICC and calculate the effect of stroke volume (SV) on peak oxygen uptake (V̇O2peak). Such rigorous reliability assessment is crucial for the routine use of impedance cardiography, thus, this study assesses the reliability of the standard hemodynamic parameters provided by the PhysioFlow® [heart rate (HR), SV, and CO] at different stages (at VT1, VT2, and V̇O2peak) during CPET in healthy, well-trained adults. In addition, the reliability of all other parameters provided by the PhysioFlow® was investigated, including the SV index (SVI), cardiac index (CI), ventricular ejection time (VET), contractility index (CTI), left cardiac work index (LCWi), systemic vascular resistance index (SVRi), systemic vascular resistance (SVR), early diastolic filling ratio (EDFR), end-diastolic volume (EDV), and ejection fraction (EF).
Methods
Study population
In total, 57 healthy and well-trained adults participated in this study. The original sample size was determined based on a power analysis for a primary outcome investigated in a separate study. Since this study focused on a secondary outcome, no specific power calculation was performed. Inclusion criteria were age between 18 and 39 years, body mass index ≤ 27 kg/m2, and V̇O2peak ≥ 51 mL/kg/min for women and ≥ 55 mL/kg/min for men. The criterion for V̇O2peak was based on the 95th percentile according to the normative data of the American College of Sports Medicine references (23). V̇O2peak was measured during the first CPET and participants who did not reach the required V̇O2peak values were excluded. Exclusion criteria were a history of cardiovascular events, the presence of cardiovascular diseases, type 2 diabetes, pregnancy, or febrile infection within the last 14 days. A total of 26 participants did not meet the inclusion criteria and were excluded, resulting in 31 participants for analysis (Figure 1). The study was approved by the ethics committee “Ethikkommission Nordwest- und Zentralschweiz” (EKNZ: 2019-01697). All participants participated voluntarily and signed written informed consent.
Figure 1
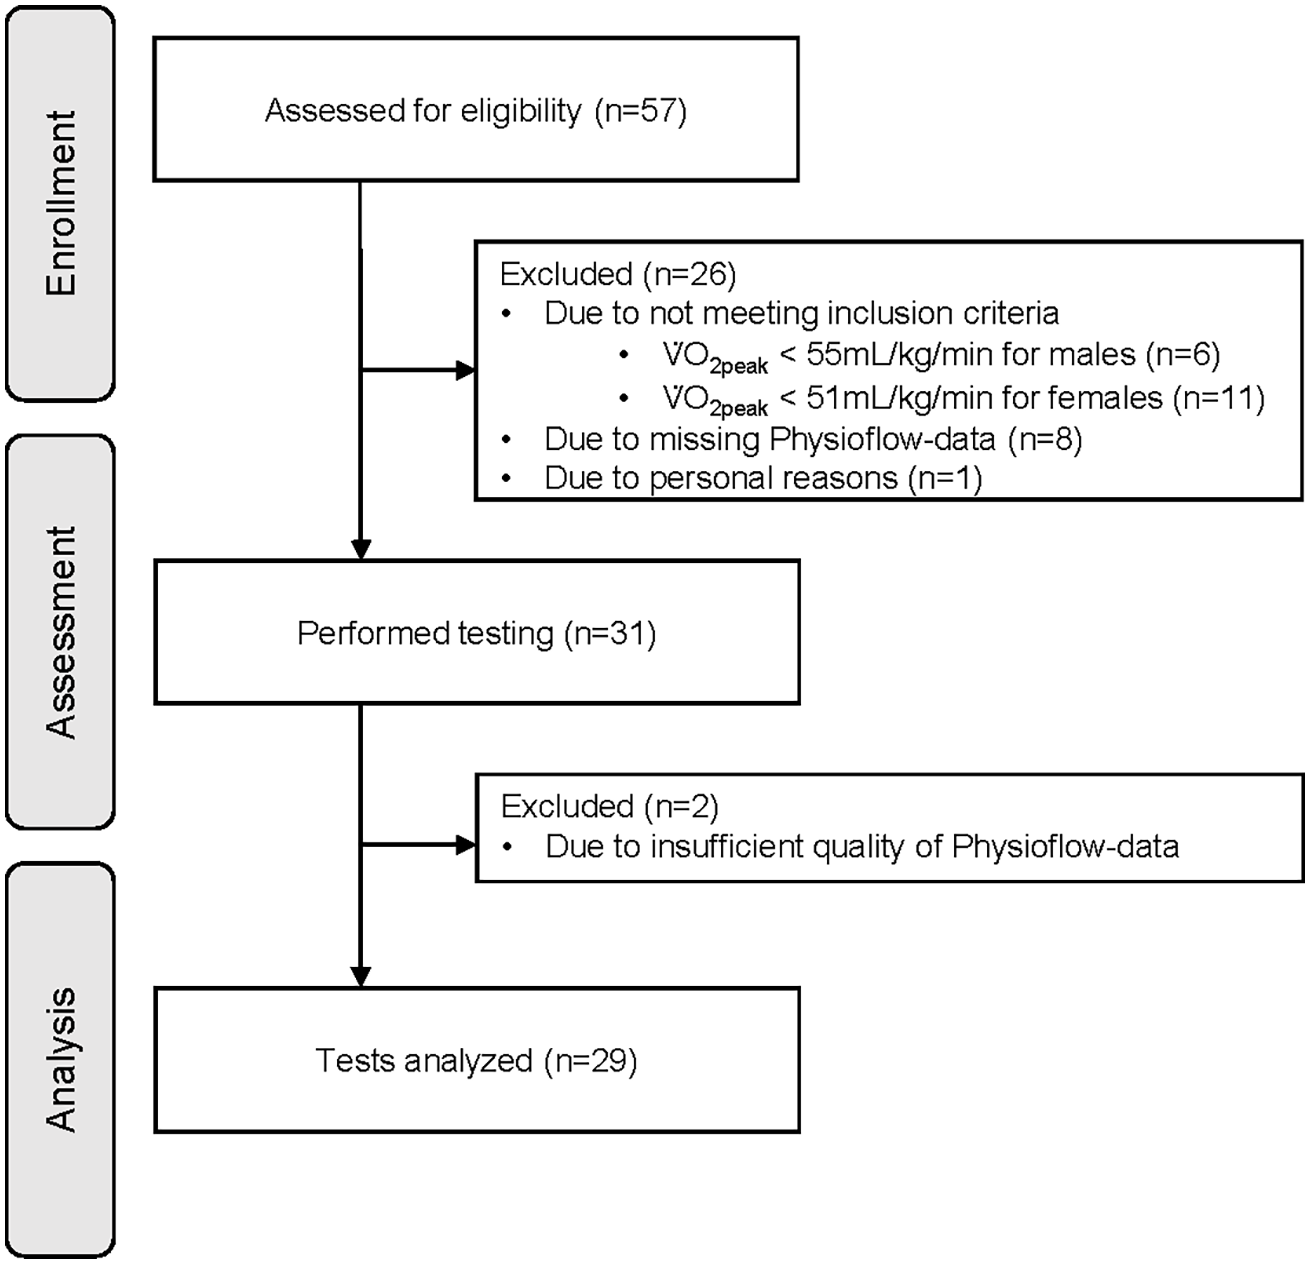
Flow diagram representing enrollment, assessment, and analysis of participants. V̇O2peak, peak oxygen consumption.
Cardiopulmonary exercise testing
Two CPETs with an identical ramp protocol were performed by the participants, with a recovery period of 7 days between tests (24). To ensure equal testing conditions, CPETs were performed at the same time of the day (25). Subjects were asked to eat and drink water adequately 72 h before each test and abstain from strenuous activity and alcohol for 24 h, caffeine for 4 h, and food for 2 h before each test (24).
The tests were performed on a cycle ergometer (Sport Excalibur, Lode Medical Technology, Groningen, The Netherlands) using a fixed ramp protocol (3 min rest, 3 min warm-up at 50 Watts, linear increase of 30 W/min until exhaustion, 3 min cool down at 50 Watt) (26). All measurements were performed under standardized conditions (temperature 20°C–22°C, air humidity 40%–55%). Saddle and handlebar positions were individually adjusted on the first day (Test 1) and set the same for the second day (Test 2). Ventilated air volume and expired gas concentrations were measured via breath-by-breath analysis (MetaMax 3B, Cortex Biophysik GmbH, Leipzig, Germany) and calibrated before each test. HR was measured with 12-channel electrocardiography (Custo med GmbH, Ottobrunn, Germany). On the first visit before the CPET, a physician monitored and controlled the electrocardiography, and all participants filled out the physical activity readiness questionnaire for safety reasons (27).
Determination of VT1, VT2, and V̇O2peak
VT1 was evaluated according to the three validated methods described by Binder et al. (28): (1) V̇-slope method [deflection point in the relationship between carbon dioxide production (V̇CO2) and V̇O2]; (2) ventilatory equivalent method [first increase in ventilatory equivalent for oxygen (V̇E/V̇O2) with remaining ventilatory equivalent for carbon dioxide (V̇E/V̇CO2)]; and (3) end-tidal oxygen pressure/workload method (increase in end-tidal oxygen pressure). VT2 was determined with three methods described by Anselmi et al. (29): (1) V̇E/V̇CO2 plot [disproportional increase of minute ventilation (V̇E) vs. V̇CO2]; (2) end-tidal CO2 pressure/workload (deflection point of end-tidal CO2 pressure); and (3) V̇E/workload relationship (lowest point of relationship). Two independent investigators determined VT1 and VT2. In cases of disagreements between the two investigators, a third investigator (RS) was involved in the process. V̇O2peak was defined as the highest consecutive 30 s of V̇O2 at any point during the test and a respiratory exchange ratio ≥1.13 (30, 31). VT1, VT2, and V̇O2peak were determined in Test 1. To analyze the reliability of the hemodynamic parameters between both tests, the wattage at VT1, VT2, and V̇O2peak in Test 1 was measured and defined as PVT1, PVT2, and PV̇O2peak. For Test 2, the same wattage at each threshold was used. This ensures that the test-retest reliability was examined under the same physiological conditions rather than the reliability of VTs and V̇O2peak.
Hemodynamic monitoring by impedance cardiograph
Hemodynamic parameters were measured with the non-invasive impedance cardiograph PhysioFlow® EndureTM (PhysioFlow®, Manatec Biomedical, Poissy, France). The operating principle has been described in detail by Charloux et al. (14). The PhysioFlow® operates with changes in transthoracic impedance during cardiac ejection to calculate the SVi. Before attaching the electrodes (PhysioFlow HTFS50PF, Manatec Biomedical, Poissy, France), the skin was prepared according to the manufacturer's recommendations (shaved, disinfected, and cleaned with abrasive gel). Two electrodes were used to measure a 1-channel-electrocardiography (position V1/V6). Another four electrodes were placed pairwise on the left side of the neck, between the earlobe and clavicula, and on the back at the xiphoid level. Signal quality was checked by a calibration over 30 heartbeats. The calibration initially determines the SVi, computed with the subject during resting conditions. The measurement is based on the following formula for CO:where body surface area is calculated according to the Haycock formula (32):SVi is calculated as follows:The largest impedance variation reached during systole (Zmax − Z0) and the largest variation rate of the impedance signal (dZ/dtmax) were used in the calculation [detailed information on the calculation can be found in Figure 1 of Charloux et al.'s publication (14)]. SVi also depends on the time of the ejection phase of the chamber described by the thoracic flow inversion time (TFIT). TFIT describes the time interval from the first zero value after the beginning of the cardiac cycle to the following minimum value after dZ/dtmax, the maximal ejection velocity. k describes a constant value, and W(TFIT) is a weighted value of the TFIT using a special algorithm that includes two parameters additional to the electrical signal: HR and blood pressure difference (33).
In addition to CO, HR, and SVi, the PhysioFlow® provides several other hemodynamic parameters, including CI, VET, CTI, LCWi, SVRi, SVR, EDFR, EDV, and EF. The methods and calculations for deriving these additional parameters have been documented in detail by Gordon et al. (13).
Hemodynamic parameters were measured continuously from the start of the CPET until the cooldown phase. During the entire test procedure, the tester continuously monitored signal strength and quality. For hemodynamic values at PVT1, PVT2, and PV̇O2peak, the average over 30 s was calculated (15 s before and after threshold) and used for further analysis. Only signal qualities of the impedance cardiograph ≥95% were accepted.
Statistical analysis
All data were analyzed using SPSS Statistics (Version 28, IBM, Armonk, NY, USA), and figures were created using GraphPad Prism (Version 9.3.1, GraphPad Software, San Diego, California, USA). No prior sample size calculation was performed for this secondary outcome, the analysis should be considered exploratory in nature, and results should be interpreted with caution. The differences in the variables between Test 1 and Test 2 were controlled for normal distribution using quartile–quartile plots (34). Values of p ≤ 0.05 were considered significant (two-sided p). Differences between Test 1 and Test 2 in hemodynamic parameters at PVT1, PVT2, and PV̇O2peak were determined using paired t-tests. Test-retest reliability was assessed using the ICC. The lower limits of the CI95% of the ICC were used to classify reproducibility: <0.50 was defined as poor reliability, 0.50–0.75 as moderate, 0.75–0.90 as good, and >0.90 as excellent reliability (35). Data are presented as mean and standard deviation (SD). Standard error of measurement (SEM) and minimal detectable change (MDC) were calculated for each parameter and threshold according to the following formulas: and (36). To evaluate the agreement or bias between Test 1 and Test 2, the Bland–Altman method (37) was used, where the difference between SV in Test 1 and Test 2 for three thresholds during incremental exercise testing (PVT1, PVT2, and PV̇O2peak) were plotted against the mean of the two tests. For the limit of agreement, the 95% tolerance interval with an 80% confidence level was chosen (38, 39).
Bland–Altman analysis can not only be used to compare a new measurement method with a gold standard but is also applicable for assessing test-retest reliability by analyzing the agreement of a single measurement method (37). It has also been utilized for this purpose in previous studies (22, 40).
The decision to focus on SV analysis was based on the CO formula: CO = HR × SV. Since HR can be reliably measured and remains relatively stable within a test-retest design (13), variations in CO are most likely attributable to differences in SV measurement. A Preiss–Fisher analysis was performed to validate the differences observed in the Bland–Altman analysis and to confirm that the measurement range was sufficiently wide (Supplementary Figure S1) (41, 42).
In addition, an a priori acceptable range for agreement was defined to account for possible variations in SV across different thresholds, while ensuring that V̇O2 variations remained within a tolerance of 4.0 mL/kg/min. This range was chosen based on the day-to-day variability of mean V̇O2peak of 2.0 mL/kg/min with an SD of 1.0 mL/kg/min (25). Assuming a normal distribution, 68% of the population falls within ±1 SD, and 95% within ±2 SD. Therefore, the tolerance range was set at 4 mL/kg/min, derived as the mean (2.0 mL/kg/min) plus 2 times the SD (1.0 mL/kg/min). For this purpose, V̇O2, body weight, HR, and CO were analyzed separately for the women and men at each characteristic phase and threshold. According to the Fick principle [V̇O2 = HR × SV × arteriovenous oxygen difference (avDO2)] and assuming constancy in HR and avDO2, the potential variation in SV was calculated in the women and men separately. This separation was necessary because the V̇O2peak values at each characteristic phase and threshold differ significantly between sexes, leading to different potential changes in SV. The acceptable range of agreement was incorporated into the Bland–Altman plots.
Results
Participants characteristics
Two participants had to be excluded due to the poor signal quality (<95%) resulting in insufficient data from the PhysioFlow® during either Test 1 or Test 2. This led to 29 participants (13 women, 16 men) with complete data for analysis (Figure 1). Participant characteristics are presented in Table 1. For assessment of reliability at different thresholds and characteristic phases, two measurements of hemodynamic parameters had to be excluded at PV̇O2peak due to poor signal quality (<95%) from the PhysioFlow® for either Test 1 or Test 2. At PVT1 and PVT2, the PhysioFlow® provided sufficient signal quality in both tests for all participants.
Table 1
| Variable | Total (n = 29) | Men (n = 16) | Women (n = 13) | |||
|---|---|---|---|---|---|---|
| Age (years) | 24 | (3) | 24 | (2) | 23 | (3) |
| Body mass index (kg/m2) | 22.1 | (2.1) | 22.7 | (1.6) | 21.4 | (2.4) |
| V̇O2peak (L/min) | 3.74 | (0.75) | 4.31 | (0.38) | 3.03 | (0.40) |
| V̇O2peak (mL/kg/min) | 57.7 | (5.2) | 61.1 | (3.9) | 53.6 | (3.1) |
| PVT1 (Watt) | 185 | (45) | 210 | (39) | 153 | (30) |
| PVT2 (Watt) | 301 | (57) | 341 | (36) | 251 | (34) |
| PV̇O2peak (Watt) | 338 | (62) | 384 | (35) | 282 | (35) |
Characteristics of the study population (n = 29).
Data are mean (standard deviation).
PVT1, wattage at ventilatory threshold 1; PVT2, wattage at ventilatory threshold 2; PV̇O2peak, wattage at peak oxygen uptake; V̇O2peak, peak oxygen uptake.
Reliability of hemodynamic parameters during incremental exercise testing
Statistical parameters (ICC, SEM, and MDC) for hemodynamic variables at PVT1, PVT2, and PV̇O2peak, are presented in Table 2. HR showed good reliability as the lower limit of the CI95% for the ICC was above 0.75 at all three exercise intensities investigated. In detail, the mean ICC at PVT1 was 0.91 (CI95%: 0.81; 0.96), at PVT2 0.92 (0.84; 0.96), and at PV̇O2peak 0.93 (0.85; 0.97). SV, CO, and EDV demonstrated good reliability for mean ICC, all of which were above 0.75 at all three time points. However, as the lower levels of the CI95% for all three were <0.75 at all three time points, the reliability was classified as moderate. All other parameters showed poor reliability (<0.50) or inconsistent reliability across the different exercise intensities, with VET and EF even showing significant differences at PV̇O2peak between Test 1 and Test 2.
Table 2
| Threshold | Parameter | Test 1 | Test 2 | Difference | ICC | SEM | MDC | ||||
|---|---|---|---|---|---|---|---|---|---|---|---|
| Mean | (SD) | Mean | (SD) | Mean | (SD) | Mean | (CI95%) | ||||
| PVT1 (n = 29) | HR (bpm) | 146 | (15) | 144 | (16) | −2 | (7) | 0.91 | (0.81, 0.96) | 2.01 | 5.56 |
| SV (mL) | 108.3 | (25.6) | 107.0 | (19.7) | −1.3 | (14.5) | 0.80 | (0.61, 0.90) | 6.53 | 18.09 | |
| CO (L/min | 15.8 | (3.8) | 15.4 | (3.0) | −0.4 | (2.3) | 0.77 | (0.57, 0.89) | 1.11 | 3.07 | |
| SVi (mL/m2) | 62.0 | (12.4) | 61.4 | (9.4) | −0.6 | (8.2) | 0.72 | (0.49, 0.86) | 4.30 | 11.92 | |
| Ci (L/min/m2) | 9.0 | (1.8) | 8.8 | (1.5) | −0.2 | (1.3) | 0.69 | (0.44, 0.84) | 0.72 | 2.00 | |
| VET (ms) | 264.7 | (41.1) | 254.7 | (42.4) | −10.0 | (48.2) | 0.33 | (−0.03, 0.62) | 39.31 | 108.97 | |
| CTI | 491.6 | (107.3) | 485.5 | (129.0) | −6.1 | (83.7) | 0.75 | (0.54, 0.88) | 41.79 | 115.83 | |
| LCWi (kg*m/m2) | 11.5 | (2.8) | 11.1 | (82.2) | −0.3 | (2.0) | 0.69 | (0.44, 0.84) | 1.10 | 3.04 | |
| SVRi (dynes s*m2/cm5) | 831.2 | (163.1) | 844.1 | (175.1) | 12.9 | (135.5) | 0.68 | (0.42, 0.84) | 76.77 | 212.81 | |
| SVR (dynes s/cm5) | 479.8 | (93.9) | 485.8 | (93.9) | 6.0 | (76.8) | 0.67 | (0.40, 0.83) | 44.46 | 123.24 | |
| EDFR (%) | 46.1 | (9.3) | 52.3 | (24.6) | 6.2 | (23.7) | 0.19 | (−0.19, 0.51) | 21.40 | 59.31 | |
| EDV (mL) | 134.3 | (28.4) | 136.2 | (24.5) | 1.9 | (18.1) | 0.77 | (0.56, 0.88) | 8.73 | 24.20 | |
| EF (%) | 80.6 | (7.2) | 79.0 | (7.5) | −1.6 | (5.0) | 0.77 | (0.56, 0.88) | 2.43 | 6.74 | |
| PVT2 (n = 29) | HR (bpm) | 179 | (9) | 178 | (9) | −1 | (3) | 0.92 | (0.84, 0.96) | 0.92 | 2.56 |
| SV (mL) | 108.6 | (27.1) | 108.2 | (21.5) | −0.4 | (15.5) | 0.80 | (0.62, 0.90) | 6.95 | 19.28 | |
| CO (L/min | 19.5 | (4.7) | 19.2 | (3.7) | −0.2 | (2.9) | 0.77 | (0.57, 0.89) | 1.38 | 3.82 | |
| SVi (mL/m2) | 62.2 | (13.4) | 62.1 | (10.6) | −0.1 | (8.7) | 0.74 | (0.51, 0.87) | 4.47 | 12.40 | |
| Ci (L/min/m2) | 11.1 | (2.3) | 11.0 | (1.8) | −0.1 | (1.6) | 0.69 | (0.43, 0.84) | 0.91 | 2.52 | |
| VET (ms) | 233.1 | (25.3) | 232.1 | (29.9) | −1.0 | (21.9) | 0.69 | (0.44, 0.84) | 12.19 | 33.78 | |
| CTI | 470.9 | (120.0) | 487.2 | (149.4) | 16.2 | (120.6) | 0.60 | (0.31, 0.79) | 75.89 | 210.34 | |
| LCWi (kg*m/m2) | 14.2 | (3.6) | 13.9 | (2.6) | −0.3 | (2.3) | 0.74 | (0.51, 0.87) | 1.17 | 3.23 | |
| SVRi (dynes s*m2/cm5) | 673.9 | (119.3) | 673.6 | (113.1) | −0.4 | (112.5) | 0.53 | (0.21, 0.75) | 76.97 | 213.35 | |
| SVR (dynes s/cm5) | 389.8 | (75.2) | 388.9 | (69.5) | −0.9 | (63.8) | 0.61 | (0.32, 0.80) | 39.73 | 110.13 | |
| EDFR (%) | 48.3 | (10.6) | 46.9 | (10.9) | −1.4 | (10.5) | 0.53 | (0.20, 0.75) | 7.24 | 20.06 | |
| EDV (mL) | 136.0 | (27.1) | 137.5 | (25.0) | 1.5 | (17.6) | 0.77 | (0.57, 0.89) | 8.37 | 23.21 | |
| EF (%) | 79.6 | (7.8) | 78.9 | (8.5) | −0.7 | (7.3) | 0.60 | (0.30, 0.79) | 4.64 | 12.87 | |
| PV̇O2peak (n = 27) | HR (bpm) | 187 | (9) | 186 | (9) | −1 | (3) | 0.93 | (0.85, 0.97) | 0.89 | 2.47 |
| SV (mL) | 109.6 | (26.1) | 108.6 | (23.3) | −1.0 | (14.9) | 0.82 | (0.64, 0.91) | 6.31 | 17.50 | |
| CO (L/min | 20.5 | (4.7) | 20.2 | (4.3) | −0.3 | (2.8) | 0.80 | (0.61, 0.91) | 1.26 | 3.51 | |
| SVi (mL/m2) | 62.9 | (12.7) | 62.2 | (11.1) | −0.6 | (8.6) | 0.74 | (0.50, 0.87) | 4.43 | 12.28 | |
| Ci (L/min/m2) | 11.7 | (2.2) | 11.6 | (2.0) | −0.2 | (1.7) | 0.69 | (0.43, 0.85) | 0.92 | 2.55 | |
| VET (ms) | 226.4 | (27.2) | 207.2 | (39.4) | −19.2 | (41.1) | 0.27 | (−0.12, 0.58) | 35.22 | 97.63 | |
| CTI | 482.5 | (119.1) | 439.7 | (132.0) | −42.8 | (122.7) | 0.52 | (0.19, 0.75) | 84.67 | 234.70 | |
| LCWi (kg*m/m2) | 14.8 | (3.5) | 14.6 | (3.0) | −0.3 | (2.4) | 0.73 | (0.50, 0.87) | 1.23 | 3.41 | |
| SVRi (dynes s*m2/cm5) | 633.4 | (96.5) | 644.4 | (105.6) | 11.0 | (99.1) | 0.52 | (0.18, 0.75) | 68.66 | 190.32 | |
| SVR (dynes s/cm5) | 367.1 | (62.9) | 374.8 | (80.5) | 7.8 | (61.4) | 0.64 | (0.35, 0.82) | 36.89 | 102.26 | |
| EDFR (%) | 48.2 | (12.2) | 54.4 | (19.2) | 6.2 | (17.8) | 0.38 | (0.01, 0.66) | 14.01 | 38.83 | |
| EDV (mL) | 136.9 | (28.1) | 141.6 | (29.1) | 4.7 | (19.9) | 0.76 | (0.54, 0.88) | 9.82 | 27.23 | |
| EF (%) | 80.0 | (6.8) | 76.8 | (7.5) | −3.1 | (5.9) | 0.66 | (0.38, 0.83) | 3.45 | 9.58 | |
Test-retest reliability of hemodynamic parameters using the PhysioFlow® at PVT1, PVT2, and PV̇O2peak during incremental exercise testing on a cycle ergometer.
Data are mean (SD).
HR, heart rate; SV, stroke volume; CO, cardiac output; SVi, stroke volume index; Ci, cardiac index; VET, ventricular ejection time; CTI, contractility index; LCWi, left cardiac work index; SVRi, systemic vascular resistance index; SVR, systemic vascular resistance; EDFR, early diastolic filling ratio; EDV, end diastolic volume; EF, ejection fraction; PVT1, wattage at ventilatory threshold 1; PVT2, wattage at ventilatory threshold 2; PV̇O2peak, wattage at peak oxygen uptake; SD, standard deviation; CI95%, 95% confidence interval; ICC, intraclass correlation coefficient; SEM, standard error of measurement; MDC, minimal detectable change.
The SV measurement values at PVT1, PVT2, and PV̇O2peak in Test 1 and Test 2 are plotted in Figures 2(A,D,G). Lin's concordance correlation coefficient showed moderate correlation at each of the three exercise intensities investigated [PVT1: 0.80 (0.63; 0.89), PVT2: 0.80 (0.63; 0.89), and PV̇O2peak: 0.82 (0.65; 0.91)].
Figure 2
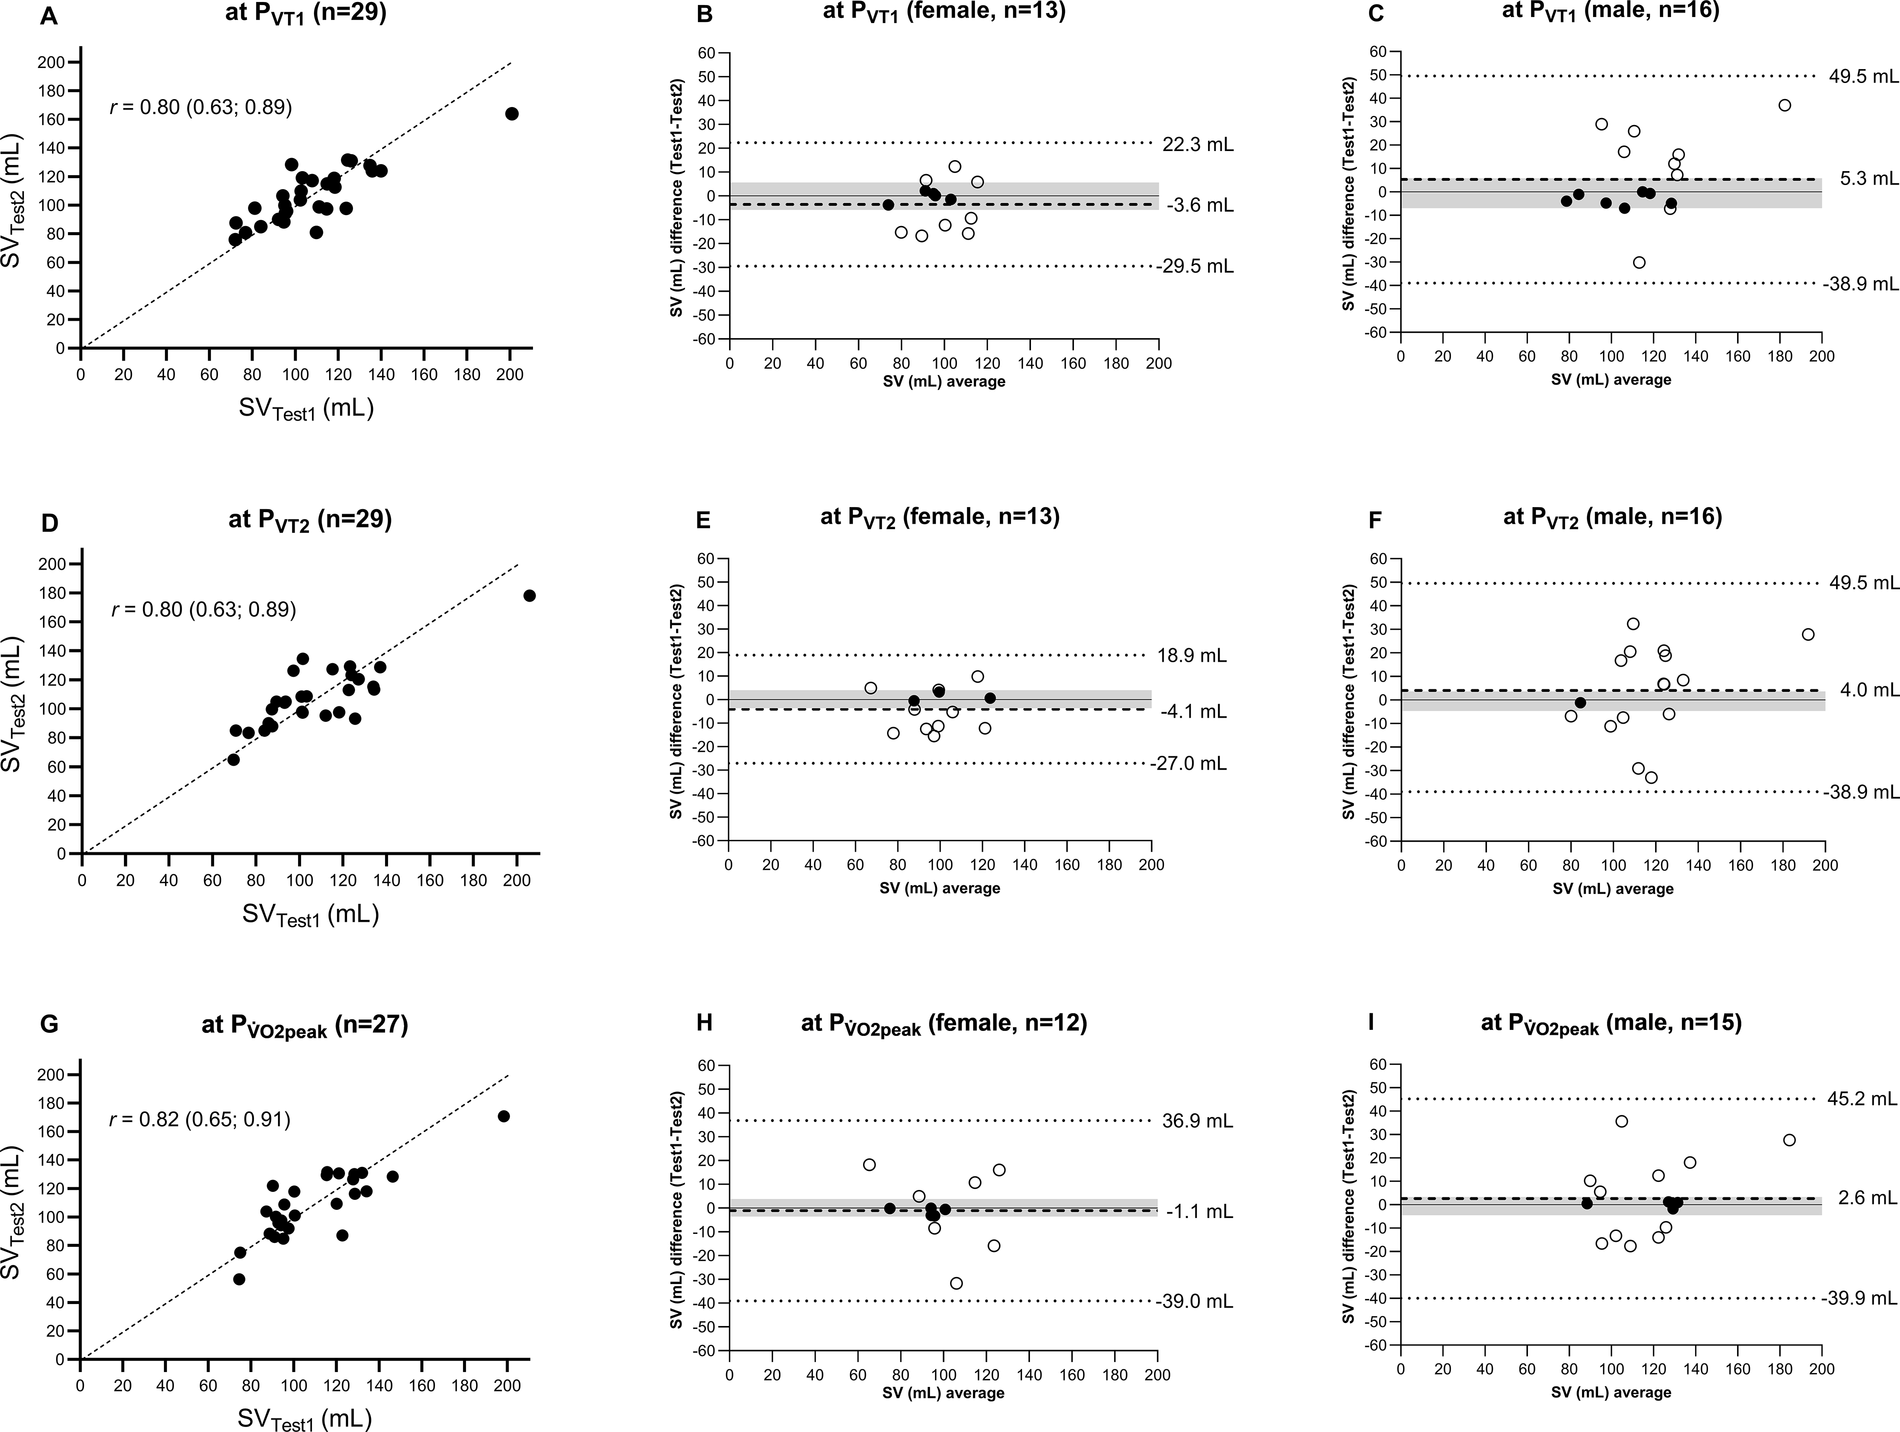
Comparison of SV measured at PVT1, PVT2, and PV̇O2peak during incremental exercise testing between Test 1 and Test 2. (A,D,G) SVTest1 vs. SVTest2 with the line of identity and Lin's concordance correlation coefficient. (B,E,H,C,F,I) Mean values and differences in mean (dashed line), 95% limits of agreement with 80% confidence interval (dotted line), and a priori-defined acceptable range of data (grey area) for female and male participants, respectively. SV, stroke volume; PVT1, wattage at ventilatory threshold 1; PVT2, wattage at ventilatory threshold 2; PV̇O2peak, wattage at peak oxygen uptake.
Figures 2(B,C,E,F,H,I) provide a Bland–Altman comparison of Test 1 and Test 2. For the female participants, the limits of agreement (95% tolerance interval with 80% confidence level) for SV at PVT1, PVT2, and PV̇O2peak were −29.5 to 22.3, −27.0 to 18.9, and −39.0 to 36.9 mL, respectively. For the male participants, the limits of agreement were wider for each threshold with −38.9 to 49.5 mL at PVT1, −38.9 to 49.5 mL at PVT2, and −39.9 to 45.2 mL at PV̇O2peak. All measurements were within the limits of agreements for all thresholds for both the women and men.
A priori defined acceptable range of agreement for SV were −5.9 to 5.6 mL at PVT1, −3.7 to 4.0 mL at PVT2, and −3.6 to 3.8 mL at PV̇O2peak for the women and −7 to 5.8 mL at PVT1, −4.7 to 3.6 mL at PVT2, and −4.5 to 3.3 mL at PV̇O2peak for the men.
For the women, 38% (n = 5 out of 13 measurements) were within the range at PVT1, 23% (n = 3) at PVT2, and 42% (n = 5) at PV̇O2peak. For the men, 44% (n = 7) at PVT1, 6% (n = 1) at PVT2, and 25% (n = 4) at PV̇O2peak.
Discussion
The major novel finding is that during an incremental ramp test, the reliability was good for HR, SV, CO, and EDV at the group level (mean ICC) at VT1, VT2, and V̇O2peak. This is in line with Gordon et al. (13), where reliability was assessed at various exercise intensities under steady-state conditions for 5 min at 50% and 70% of peak power output and 30-s intervals at 90% of peak power output. The ICC (CI95%) for SV for the 50% steady-state, 70% steady-state, and intervals were 0.85 (0.60; 0.94), 0.91 (0.78; 0.97), and 0.87 (0.83; 0.90). Similar results were obtained by Schultz et al. (22) in older participants (57 (9) years), showing an ICC for SV of 0.69 during steady-state cycling at 60% of HRmax and an ICC of 0.90 at 70% of HRmax. Legendre et al. (17) investigated the reliability of the SVI in patients with residual right outflow tract lesions after congenital heart disease repair, reporting an ICC of 0.80, also in a comparable range. In addition, a study in children reported an ICC of SV at V̇O2peak of 0.88 (CI95%: 0.76; 0.94) (18).
However, the classification of reliability based on mean ICC alone is insufficient, as illustrated in Figure 2. The analyses showed that a change in SV, for instance, at PV̇O2peak, from −3.6 to 3.8 mL in the women and −4.5 to 3.3 mL in the men, led to an alteration in V̇O2peak of approximately ±2.0 mL/kg/min. Knaier et al. (25) demonstrated that a change of 2.0 ± 1 mL/kg/min could occur due to day-to-day variations. This implies that changes exceeding this range likely indicate a “real” physiological change. The MDC of 17.5 mL (Table 2) confirms that this variation (−3.6 to 3.8 mL in the women, −4.5 to 3.3 mL in the men) lies beyond the detection capabilities of the PhysioFlow®. Therefore, despite similar findings in previous studies, the device's reliability is classified as moderately reliable.
This issue is also reflected in the limits of agreement in the Bland–Altman plots. For example, differences in measured SV at PV̇O2peak are contained within a 95% tolerance interval at an 80% confidence level, ranging from −39.0 to 36.9 mL for the women and from −39.9 to 45.2 mL for the men. This indicates that individual measurements can vary significantly upon repeated measurements. Thus, while the SV measurements are reliable at the group level (the mean difference between Test 2 and Test 1 at PV̇O2peak was −1.0 (14.9) mL), they fail to provide good reliability for individual assessments. The same conclusion also applies to the measurement of SV at PVT1 and PVT2.
All other hemodynamic parameters (SVi, Ci, VET, CTI, LCWi, SVRi, SVR, EDFR, and EF) provided by the PhysioFlow® demonstrated poor or inconsistent reliability across the thresholds and cannot be used either at the group or individual level. This result differs from that of Gordon et al. (13), as they reported a mean ICC greater than 0.75 for LCWi under steady-state exercise at various intensities.
Compared to the study of Gordon et al. (13), a similar percentage of participants had to be excluded due to insufficient signal quality during maximal exercise [7% (n = 2) vs. 5% (n = 1) at 90% peak power output during 30-s intervals], but a lower percentage than reported by Kemps et al. (43) [24% (n = 24) of all measurements during exercise]. Schultz et al. (22) also examined the reproducibility of SV during steady-state exercise using impedance cardiography. They excluded 14% (n = 7) at 40 W, 61% (n = 31) at 60% HRmax, and 47% (n = 24) at 90% HRmax due to “unavailability of data at one of the visits.” The present data demonstrated that sufficient signal quality was achieved with increasing workload up to PVT2; thus, in contrast to Schultz et al. (22) no data were lost, and at PV̇O2peak, only 7% (n = 2) had to be excluded due to insufficient signal quality. The exact reasons for the differences could not be identified. Kemps et al. (43) suspected that qualitatively insufficient measurements were caused by an irregular or oscillating breathing pattern in their study population of patients with chronic heart failure. Gordon et al. (13) provided no reasons for insufficient signal quality. In this study, it is suspected that movement and respiratory artifacts could be the reason for insufficient signal quality. Notably, Warburton et al. (9) have previously identified these factors as potential limitations in using impedance cardiography during maximal exercise. Another explanation could be increased sweat production, which can influence impedance signals (44), as they only occurred during maximum load and not before.
Limitation
Based on current knowledge, this is the first study to investigate the reliability of the PhysioFlow® at the VTs during CPET in well-trained adults. Another innovation was the a priori-defined acceptable range of agreement of SV depending on the resulting clinically relevant difference in V̇O2.
Since this study exclusively examined the test-retest reliability of a single measurement method for assessing hemodynamic parameters and did not include comparisons with the direct Fick method, any assertions concerning validity are excluded. It should be noted that participants in the current study were young, healthy, and showed high endurance performance levels. Therefore, the results of this study are not representative of other population groups.
The statistical power of this study was primarily calculated for a different primary outcome, which may limit the ability to detect clinically relevant differences in this secondary outcome. As no specific power analysis was conducted for this research question, the findings should be considered exploratory in nature and interpreted with caution.
Signal quality issues occurred in 7% of measurements, but the underlying causes could not be determined.
Conclusion
This study was the first to assess the test-retest reliability of the PhysioFlow® at characteristic phases and thresholds in healthy, well-trained adults during CPET. These findings demonstrate that the PhysioFlow® can reliably measure HR, SV, CO, and EDV at the group level during incremental exercise testing and has limited ability to capture individual differences accurately. This finding is crucial for clinical applications, highlighting that while the device effectively measures SV for broader, group-based assessments, it may not be suitable for precise individual diagnostics without considering potential variability.
Statements
Data availability statement
The raw data supporting the conclusions of this article will be made available by the authors, without undue reservation.
Ethics statement
The studies involving humans were approved by Ethikkommission Nordwest- und Zentralschweiz (EKNZ: 2019-01697). The studies were conducted in accordance with the local legislation and institutional requirements. The participants provided their written informed consent to participate in this study.
Author contributions
RS: Writing – original draft, Writing – review & editing, Data curation, Formal analysis, Investigation, Visualization. JW: Writing – review & editing, Conceptualization. MN: Writing – review & editing, Conceptualization. FB: Writing – review & editing, Investigation. DI: Writing – review & editing, Formal analysis, Visualization. JC: Writing – review & editing, Investigation. BG: Writing – review & editing, Investigation. AS-T: Writing – review & editing, Conceptualization, Formal analysis. RK: Writing – review & editing, Conceptualization, Formal analysis.
Funding
The author(s) declare that financial support was received for the research and/or publication of this article. RS is funded by the Swiss National Science Foundation (SNSF Project No. 185217), and FB and RK are funded by the SNSF, Grant No. PZ00P3_208999.
Acknowledgments
We thank all the participants who made this study possible by their participation.
Conflict of interest
The authors declare that the research was conducted in the absence of any commercial or financial relationships that could be construed as a potential conflict of interest.
Generative AI statement
The author(s) declare that no Generative AI was used in the creation of this manuscript.
Publisher’s note
All claims expressed in this article are solely those of the authors and do not necessarily represent those of their affiliated organizations, or those of the publisher, the editors and the reviewers. Any product that may be evaluated in this article, or claim that may be made by its manufacturer, is not guaranteed or endorsed by the publisher.
Supplementary material
The Supplementary Material for this article can be found online at: https://www.frontiersin.org/articles/10.3389/fcvm.2025.1531027/full#supplementary-material
Supplementary Figure S1Preiss-Fisher analysis for validation of measurement differences: confirming normal distribution in Bland–Altman method results. VT1, ventilatory threshold 1; VT2, ventilatory threshold 2; V̇O2peak, peak oxygen consumption.
References
1.
Abudiab MM Redfield MM Melenovsky V Olson TP Kass DA Johnson BD et al Cardiac output response to exercise in relation to metabolic demand in heart failure with preserved ejection fraction. Eur J Heart Fail. (2013) 15:776–85. 10.1093/eurjhf/hft026
2.
Mortensen SP Dawson EA Yoshiga CC Dalsgaard MK Damsgaard R Secher NH et al Limitations to systemic and locomotor limb muscle oxygen delivery and uptake during maximal exercise in humans. J Physiol. (2005) 566:273–85. 10.1113/jphysiol.2005.086025
3.
Mortensen SP Damsgaard R Dawson EA Secher NH González-Alonso J . Restrictions in systemic and locomotor skeletal muscle perfusion, oxygen supply and VO2 during high-intensity whole-body exercise in humans. J Physiol. (2008) 586:2621–35. 10.1113/jphysiol.2007.149401
4.
Vignati C Cattadori G . Measuring cardiac output during cardiopulmonary exercise testing. Ann Am Thorac Soc. (2017) 14:S48–52. 10.1513/AnnalsATS.201611-852FR
5.
Yazdi D Sridaran S Smith S Centen C Patel S Wilson E et al Noninvasive scale measurement of stroke volume and cardiac output compared with the direct Fick method: a feasibility study. J Am Heart Assoc. (2021) 10:e021893. 10.1161/jaha.121.021893
6.
Patel HN Miyoshi T Addetia K Henry MP Citro R Daimon M et al Normal values of cardiac output and stroke volume according to measurement technique, age, sex, and ethnicity: results of the world alliance of societies of echocardiography study. J Am Soc Echocardiogr. (2021) 34:1077–85.e1. 10.1016/j.echo.2021.05.012
7.
Tordi N Mourot L Matusheski B Hughson RL . Measurements of cardiac output during constant exercises: comparison of two non-invasive techniques. Int J Sports Med. (2004) 25:145–9. 10.1055/s-2004-819949
8.
Reiter T Kerzner J Fette G Frantz S Voelker W Ertl G et al Accuracy of VO2 estimation according to the widely used Krakau formula for the prediction of cardiac output. Herz. (2024) 49:50–9. 10.1007/s00059-023-05196-0
9.
Warburton DE Haykowsky MJ Quinney HA Humen DP Teo KK . Reliability and validity of measures of cardiac output during incremental to maximal aerobic exercise. Part II: novel techniques and new advances. Sports Med. (1999) 27:241–60. 10.2165/00007256-199927040-00004
10.
Sangkum L Liu GL Yu L Yan H Kaye AD Liu H . Minimally invasive or noninvasive cardiac output measurement: an update. J Anesth. (2016) 30:461–80. 10.1007/s00540-016-2154-9
11.
Bayram M Yancy CW . Transthoracic impedance cardiography: a noninvasive method of hemodynamic assessment. Heart Fail Clin. (2009) 5:161–8. 10.1016/j.hfc.2008.12.001
12.
Sodolski T Kutarski A . Impedance cardiography: a valuable method of evaluating haemodynamic parameters. Cardiol J. (2007) 14:115–26.
13.
Gordon N Abbis CR Maiorana AJ Marston KJ Pfeiffer JJ . Intrarater reliability and agreement of the physioflow bioimpedance cardiography device during rest, moderate and high-intensity exercise. Kinesiology. (2018) 50:140–9.
14.
Charloux A Lonsdorfer-Wolf E Richard R Lampert E Oswald-Mammosser M Mettauer B et al A new impedance cardiograph device for the non-invasive evaluation of cardiac output at rest and during exercise: comparison with the “direct” Fick method. Eur J Appl Physiol. (2000) 82:313–20. 10.1007/s004210000226
15.
Richard R Lonsdorfer-Wolf E Charloux A Doutreleau S Buchheit M Oswald-Mammosser M et al Non-invasive cardiac output evaluation during a maximal progressive exercise test, using a new impedance cardiograph device. Eur J Appl Physiol. (2001) 85:202–7. 10.1007/s004210100458
16.
Dupuis M Noel-Savina E Prévot G Tétu L Pillard F Rivière D et al Determination of cardiac output in pulmonary hypertension using impedance cardiography. Respiration. (2018) 96:500–6. 10.1159/000486423
17.
Legendre A Bonnet D Bosquet L . Reliability of peak exercise stroke volume assessment by impedance cardiography in patients with residual right outflow tract lesions after congenital heart disease repair. Pediatr Cardiol. (2018) 39:45–50. 10.1007/s00246-017-1725-3
18.
Welsman J Bywater K Farr C Welford D Armstrong N . Reliability of peak VO(2) and maximal cardiac output assessed using thoracic bioimpedance in children. Eur J Appl Physiol. (2005) 94:228–34. 10.1007/s00421-004-1300-5
19.
Arena R Myers J Williams MA Gulati M Kligfield P Balady GJ et al Assessment of functional capacity in clinical and research settings: a scientific statement from the American Heart Association Committee on Exercise, Rehabilitation, and Prevention of the Council on Clinical Cardiology and the Council on Cardiovascular Nursing. Circulation. (2007) 116:329–43. 10.1161/circulationaha.106.184461
20.
Moshkovitz Y Kaluski E Milo O Vered Z Cotter G . Recent developments in cardiac output determination by bioimpedance: comparison with invasive cardiac output and potential cardiovascular applications. Curr Opin Cardiol. (2004) 19:229–37. 10.1097/00001573-200405000-00008
21.
Critchley LA Critchley JA . A meta-analysis of studies using bias and precision statistics to compare cardiac output measurement techniques. J Clin Monit Comput. (1999) 15:85–91. 10.1023/a:1009982611386
22.
Schultz MG Climie RED Nikolic SB Ahuja KD Sharman JE . Reproducibility of cardiac output derived by impedance cardiography during postural changes and exercise. Artery Res. (2012) 6:78–84. 10.1016/j.artres.2012.02.001
23.
ACSM. ACSM’s Guidelines for Exercise Testing and Prescription. Philadelphia: Wolters Kluwer/Lippincott Williams & Wilkins Philadelphia (2010).
24.
ATS/ACCP. ATS/ACCP statement on cardiopulmonary exercise testing. Am J Respir Crit Care Med. (2003) 167:211–77. 10.1164/rccm.167.2.211
25.
Knaier R Infanger D Niemeyer M Cajochen C Schmidt-Trucksäss A . In athletes, the diurnal variations in maximum oxygen uptake are more than twice as large as the day-to-day variations. Front Physiol. (2019a) 10:219. 10.3389/fphys.2019.00219
26.
Wagner J Knaier R Infanger D Königstein K Klenk C Carrard J et al Novel CPET reference values in healthy adults: associations with physical activity. Med Sci Sports Exerc. (2021) 53:26–37. 10.1249/mss.0000000000002454
27.
Shephard RJ . PAR-Q, Canadian home fitness test and exercise screening alternatives. Sports Med. (1988) 5:185–95. 10.2165/00007256-198805030-00005
28.
Binder RK Wonisch M Corra U Cohen-Solal A Vanhees L Saner H et al Methodological approach to the first and second lactate threshold in incremental cardiopulmonary exercise testing. Eur J Cardiovasc Prev Rehabil. (2008) 15:726–34. 10.1097/HJR.0b013e328304fed4
29.
Anselmi F Cavigli L Pagliaro A Valente S Valentini F Cameli M et al The importance of ventilatory thresholds to define aerobic exercise intensity in cardiac patients and healthy subjects. Scand J Med Sci Sports. (2021) 31:1796–808. 10.1111/sms.14007
30.
Wagner J Niemeyer M Infanger D Hinrichs T Streese L Hanssen H et al New data-based cutoffs for maximal exercise criteria across the lifespan. Med Sci Sports Exerc. (2020) 52:1915–23. 10.1249/mss.0000000000002344
31.
Knaier R Niemeyer M Wagner J Infanger D Hinrichs T Klenk C et al Which cutoffs for secondary V̇O2max criteria are robust to diurnal variations? Med Sci Sports Exerc. (2019b) 51:1006–13. 10.1249/mss.0000000000001869
32.
Haycock GB Schwartz GJ Wisotsky DH . Geometric method for measuring body surface area: a height-weight formula validated in infants, children, and adults. J Pediatr. (1978) 93:62–6. 10.1016/s0022-3476(78)80601-5
33.
Gonzalez-Represas A Mourot L . Stroke volume and cardiac output measurement in cardiac patients during a rehabilitation program: comparison between tonometry, impedancemetry and echocardiography. Int J Cardiovasc Imaging. (2020) 36:447–55. 10.1007/s10554-019-01738-y
34.
Pleil JD . QQ-plots for assessing distributions of biomarker measurements and generating defensible summary statistics. J Breath Res. (2016) 10:035001. 10.1088/1752-7155/10/3/035001
35.
Portney LG Watkins MP . Foundations of Clinical Research: Applications to Practice. Upper Saddle River, NJ: Pearson/Prentice Hall (2009).
36.
Weir JP . Quantifying test–retest reliability using the intraclass correlation coefficient and the SEM. J Strength Cond Res. (2005) 19:231–40. 10.1519/15184.1
37.
Bland JM Altman DG . Statistical methods for assessing agreement between two methods of clinical measurement. Lancet. (1986) 1:307–10. 10.1016/S0140-6736(86)90837-8
38.
Francq BG Berger M Boachie C . To tolerate or to agree: a tutorial on tolerance intervals in method comparison studies with BivRegBLS R package. Stat Med. (2020) 39:4334–49. 10.1002/sim.8709
39.
Vock M . Intervals for the assessment of measurement agreement: similarities, differences, and consequences of incorrect interpretations. Biom J. (2016) 58:489–501. 10.1002/bimj.201400234
40.
Arnet J Knaier R Schoch R D'hulst G Bruggisser F Feldmann A et al Determination of ventilatory thresholds using near-infrared spectroscopy in recreational endurance and CrossFit athletes. Int J Sports Physiol Perform. (2025) 20:345–54. 10.1123/ijspp.2024-0265
41.
Preiss D Fisher J . A measure of confidence in Bland-Altman analysis for the interchangeability of two methods of measurement. J Clin Monit Comput. (2008) 22:257–9. 10.1007/s10877-008-9127-y
42.
Gerke O . Reporting standards for a Bland-Altman agreement analysis: a review of methodological reviews. Diagnostics (Basel). (2020) 10:334. 10.3390/diagnostics10050334
43.
Kemps HMC Thijssen EJM Schep G Sleutjes BTHM Vries WRD Hoogeveen AR et al Evaluation of two methods for continuous cardiac output assessment during exercise in chronic heart failure patients. J Appl Physiol. (2008) 105:1822–9. 10.1152/japplphysiol.90430.2008
44.
Kalevo L Myllymaa S Miettinen T Leino A Kainulainen S Korkalainen H et al Effect of sweating on electrode-skin contact impedances and artifacts in EEG recordings with various screen-printed Ag/Agcl electrodes. IEEE Access. (2020) 8:50934–43. 10.1109/ACCESS.2020.2977172
Summary
Keywords
hemodynamic parameters, stroke volume, impedance cardiography, reliability, peak oxygen uptake
Citation
Schoch R, Wagner J, Niemeyer M, Bruggisser F, Infanger D, Carrard J, Gasser B, Schmidt-Trucksäss A and Knaier R (2025) Reliability of hemodynamic parameters measured by bioimpedance cardiography at different intensities during incremental exercise testing. Front. Cardiovasc. Med. 12:1531027. doi: 10.3389/fcvm.2025.1531027
Received
19 November 2024
Accepted
20 March 2025
Published
10 April 2025
Volume
12 - 2025
Edited by
DeLisa Fairweather, Mayo Clinic Florida, United States
Reviewed by
Alsayed Shanb, Imam Abdulrahman Bin Faisal University, Saudi Arabia
Joaquín Martín Marzano Felisatti, Universitat de València, Spain
Updates
Copyright
© 2025 Schoch, Wagner, Niemeyer, Bruggisser, Infanger, Carrard, Gasser, Schmidt-Trucksäss and Knaier.
This is an open-access article distributed under the terms of the Creative Commons Attribution License (CC BY). The use, distribution or reproduction in other forums is permitted, provided the original author(s) and the copyright owner(s) are credited and that the original publication in this journal is cited, in accordance with accepted academic practice. No use, distribution or reproduction is permitted which does not comply with these terms.
* Correspondence: Arno Schmidt-Trucksäss arno.schmidt-trucksaess@unibas.ch
Disclaimer
All claims expressed in this article are solely those of the authors and do not necessarily represent those of their affiliated organizations, or those of the publisher, the editors and the reviewers. Any product that may be evaluated in this article or claim that may be made by its manufacturer is not guaranteed or endorsed by the publisher.