 Weipeng Gan
 Peipei Wang
 Xiangrong Xie3
 Mingquan Ye
- 1Department of Cardiovascular Medicine, The Second Affiliated Hospital of Wannan Medical College, Wuhu, Anhui, China
- 2School of Medical Information, Wannan Medical College, Wuhu, Anhui, China
- 3Department of Cardiovascular Medicine, The First Affiliated Hospital of Wannan Medical College, Wuhu, Anhui, China
Background: Chronic Coronary Disease (CCD) is a leading global cause of morbidity and mortality. Existing Pre-test Probability (PTP) models mainly rely on in-hospital data and clinician judgment. This study aims to construct machine learning (ML) models for predicting CCD by using easily accessible text data and baseline characteristics, and to evaluate the contribution of text data to the diagnostic model.
Methods: The chief complaints, present illness, past medical history and vital signs of the patients from the internal medicine departments of the First Affiliated Hospital and the Second Affiliated Hospital of Wannan Medical College were gathered. The text data of the research subjects were structured by using text mining technology. A customized “stop words” list and “custom dictionary” for cardiovascular medicine were created to optimize the processing of text data. Then, ML algorithms were employed to establish CCD prediction models. Finally, the Shapley additive explanation (SHAP) algorithm was used to interpret the models.
Results: We enrolled a total of 21,855 patients in this study, with 7,449 in the CCD group and 14,406 in the non-CCD group. Patients in the CCD group were generally older and had a higher male proportion. After conducting feature engineering, we successfully constructed a Random Forest model. The model achieved an area under the ROC curve (AUC) of 0.93 (95% CI, 0.93–0.94), demonstrating excellent performance in horizontal comparisons. Using the SHAP algorithm, valuable text features like “chest pain”, “chest tightness” and structured features such as age, which are crucial for CCD judgment, were identified. Additionally, an illustration of how these features influenced the model's decision-making process was provided.
Conclusion: Clinicians can leverage text data to construct a prediction model for CCD and apply the SHAP approach to pinpoint valuable text features and elucidate the model's decision-making mechanism.
1 Introduction
Chronic Coronary Disease (CCD) is one of the leading causes of morbidity and mortality globally (1). Accurately predicting CCD remains a significant challenge in clinical practice (2).
The assessment of Pre-test Probability (PTP) plays a pivotal role in the management of this disease, a role explicitly integrated into the entire diagnostic evaluation process by the 2023 Guideline for the Management of CCD (1). The guideline emphasizes that PTP plays a decisive role in guiding the selection of non-invasive tests and risk stratification. It is recommended to conduct a preliminary PTP assessment by comprehensively considering the patient's age, gender, typical symptoms, and cardiovascular risk factors such as diabetes and smoking history. In clinical practice, this assessment hinges on clinicians’ professional judgment, medical knowledge, and thorough symptom evaluation—and directly shapes subsequent diagnostic strategies.
In CCD prediction, prior studies have developed effective models using diverse variables. Reeh J et al. integrated basic variables (angina type, gender, age) and clinical risk factors (diabetes, family history of coronary heart disease, dyslipidemia), achieving a C-statistic of 0.88 to enhance diagnostic efficiency (3). Similarly, Mirjalili SR et al. established a machine learning model with biochemical indicators (lipids, blood glucose), successfully identifying high-risk CHD individuals with 87.5% accuracy (4). In addition, the 2019 European Society of Cardiology (ESC) guideline also proposed a coronary heart disease prediction model based on coronary computed tomography angiography (5). However, current PTP models still have certain limitations. These models predominantly rely on in-hospital imaging data, laboratory test parameters, and subjective assessments of symptom characteristics by clinicians (1, 6, 7). This restricts the application of these models in scenarios such as pre-hospital emergency care and primary healthcare.
A large amount of textual information about patients’ medical conditions and treatment experiences is generated when they seek medical treatment, which is crucial for diagnosis (8, 9). Experienced doctors can make accurate preliminary diagnoses based on patients’ symptoms and signs, and then verify these diagnoses through clinical laboratory tests and imaging results (10). However, these data are often unstructured. Due to their large volume, variable structure, difficulty in information extraction, and the lack of a unified evaluation standard, they pose many challenges to clinical research. Therefore, it is difficult for clinical researchers to fully utilize this resource to develop disease prediction models and conduct risk assessments (11).
In recent years, with the rapid development of artificial intelligence technology, the applications of text mining and machine learning (ML) in the medical field have significantly increased (12, 13).
The combination of text mining and ML technology can analyze the text data from patients’ subjective descriptions, clinical records, and medical histories, extract key information and features, and provide valuable insights for disease prediction. For example, Zhu E et al. proposed a unified framework that can efficiently annotate and extract key information from Chinese clinical texts (14). Tauscher JS et al. developed an automatic cognitive distortion detection model, which is capable of identifying potential communication problems by analyzing the text of doctor-patient conversations, thus providing objective support for the diagnosis and treatment of mental illnesses (15). Bergman E's team developed a BERT-based natural language processing system that has achieved an accuracy close to the human level in the classification of adverse drug reaction reports, leading to a significant improvement in the efficiency of drug safety monitoring (16).
Existing models rely on high-cost and hard-to-obtain data, whereas text data, with its advantages of easy accessibility and inclusion of subjective symptoms, can address this limitation. Thus, this study is committed to exploring its role in evaluating the PTP of patients with CCD. We have constructed a CCD identification model by incorporating text data and easily accessible structured data. Moreover, this study conducts an interpretive analysis to explain the model's decision-making process. The ultimate aim is to establish a cost-effective model for clinical practice, facilitating the assessment of CCD patients’ PTP.
2 Materials and methods
2.1 Study design and population
This was a dual-center, observational, and retrospective study. The subjects of this research were adult patients who sought medical treatment at the Department of Internal Medicine of the First Affiliated Hospital and the Second Affiliated Hospital of Wannan Medical College. These patients presented with symptoms related to CCD as their chief complaints from January 1, 2022, to December 31, 2024. To mitigate the potential paucity of CCD patient data, the cardiology department data were extended from January 1, 2019, to December 31, 2024. Referring to previous research findings, the symptoms related to CCD include: chest pain, dyspnea, retrosternal discomfort, fatigue, palpitations, dizziness, nausea, discomfort under the xiphoid process, upper abdominal discomfort, neck discomfort, radiating pain to the shoulder, radiating pain to the mandible, and arm pain (1). Exclusion criteria include: (1) Emergency admissions or transferred patients; (2) Cases with unclear diagnosis at discharge; (3) Cases involving heart failure or cardiac function decline, potentially resulting from various cardiovascular diseases (CVDs) and not serving as the primary diagnosis, were excluded.
This study was approved by the Ethics Committee of the Second Affiliated Hospital of Wannan Medical College (Approval: WYEFYLS2025023). Given the retrospective design of this study and the absence of intervention measures, the Ethics Committee waived the requirement for informed consent.
2.2 Data processing and feature engineering
2.2.1 Data cleaning
This research used the electronic medical record (EMR) system to extract key data, including admission route, number of hospitalizations, length of stay, and primary diagnoses. To ensure data uniqueness and consistency, patient identification numbers were used as unique identifiers. Primary diagnoses were used to determine whether a condition pertained to CCD. The modeling data included chief complaints, current medical history, past medical history, smoking and drinking histories, vital signs (weight, temperature, blood pressure, pulse), and demographic information (age, gender).
Structured data with obvious errors were manually rectified, and the K-nearest neighbors (KNN) algorithm was applied to impute missing values (k = 3). This approach accurately mirrored the actual relationships among data points and optimized model performance. Moreover, labeling information was removed from the text data to preclude interference in disease classification.
2.2.2 Feature engineering
To convert high-dimensional textual data into a numerical format suitable for modeling, we employed the Jieba Chinese segmentation tool to decompose the text into independent vocabulary units. Subsequently, the TF-IDF (Term Frequency-Inverse Document Frequency) method was adopted to vectorize the segmented features. This approach considered both the term frequency and the inverse document frequency, effectively quantifying the significance of vocabulary within the text.
During the word-segmentation phase, a custom dictionary was introduced to ensure the integrity of medical terms, and stop words were removed to reduce data noise. The custom dictionary and stop-word list were developed based on the medical specialized stop-word dictionary of Harbin Medical University and the THU Open Chinese Lexicon (THUOCL) medical term list from Tsinghua University, which are freely accessible at https://github.com/goto456/stopwords and http://thuocl.thunlp.org/ (17, 18). By integrating medical professional knowledge and regular expressions, and leveraging data from the EMR database of the Affiliated Hospital of Wannan Medical College, we extracted and summarized a unique “custom dictionary” and “stop-words” specific to the Department of Cardiology.
The calculation of TF-IDF refers to the following formula:
Where, wx,y represents the TF-IDF weight of term x within document y. tfx,y (Term Frequency): It indicates the frequency of term x appearing in document y. Usually, it is calculated as the number of times term x appears in document y divided by the total number of terms in document y. It reflects the importance of term x within a single document y. dfx (Document Frequency): It refers to the number of documents that contain term x. It measures the commonness of term x across the entire document collection. N (Total number of documents): It represents the total number of documents in the document collection.
Data were recorded in Excel 2021 and subsequently analyzed using Python 3.11.1 and scikit-learn 1.2.2.
2.3 Development of CCD prediction model
In order to mitigate the risk of overfitting and enhance the interpretability of the model, this study adopted the variance selection method in combination with expert opinions to conduct the selection of target features. Considering the medical modeling scenarios and taking into account both statistical significance and stability, the selected features all had a P-value < 0.01. For the standardized continuous features, the variance threshold was set at 0.5. The variance threshold for categorical features was chosen as 0.05. For high-dimensional and sparse text features, the variance threshold was set at 0.001. Meanwhile, referring to expert experience and the results of previous studies, the feature variables finally included in the model were determined.
Considering that the data incorporated into the model consisted of categorical features, continuous features, and text features, during the model construction phase, this study compared various machine-learning algorithms. These included linear algorithms (logistic regression), tree-based algorithms (Random Forest, RF), and clustering algorithms (K-means clustering, KNN). To evaluate the performance of the models, the Receiver Operating Characteristic (ROC) curve, precision, recall, accuracy, and F1-score were employed. Subsequently, the model that exhibited a superior area under the ROC curve (AUC) value was chosen as the final prediction model. Additionally, the performance of our model was compared with previously established models in the literature using the AUC to validate its competitive advantage (1, 2, 19, 20).
2.4 Model explanation
This study employed the game-theory-based Shapley additive explanation (SHAP) algorithm to decompose model predictions into individual feature contributions, with the formula:
Here, denotes the SHAP value for the i-th feature; S is any subset excluding feature i; and represents the model's baseline prediction using only subset S features. The weight term depends on subset size and total feature count n. Calculation involves iterating over all subsets without feature i, computing marginal prediction changes upon its inclusion, and summing these via weighted aggregation to derive each feature's contribution. Notably, the total of all SHAP values equals the gap between the model's prediction and baseline, ensuring interpretive consistency.
The TreeExplainer tool was used to compute global SHAP values. A summary plot was generated to visualize feature importance and identify key predictive factors. To further explore the model's decision-making logic for individual samples, the SHAP values were calculated using the KernelExplainer tool to provide local interpretations.
3 Result
3.1 Characteristics of the study population
In total, 21,855 patients with symptoms similar to CCD were admitted to the hospital and enrolled in this study according to the inclusion and exclusion criteria. Among them, 7,449 cases were considered to be admitted due to CCD. In the CCD group, 6,196 cases were clinically diagnosed with coronary heart disease, 401 with angina pectoris, and 337 with coronary myocardial bridges (MB). The remaining 14,406 patients were in the Non-CCD group, including 1,276 cases of pulmonary infectious diseases, 102 cases of asthma, 2,047 cases of digestive system inflammation, and 3,574 cases of arrhythmia, as presented in Figure 1.
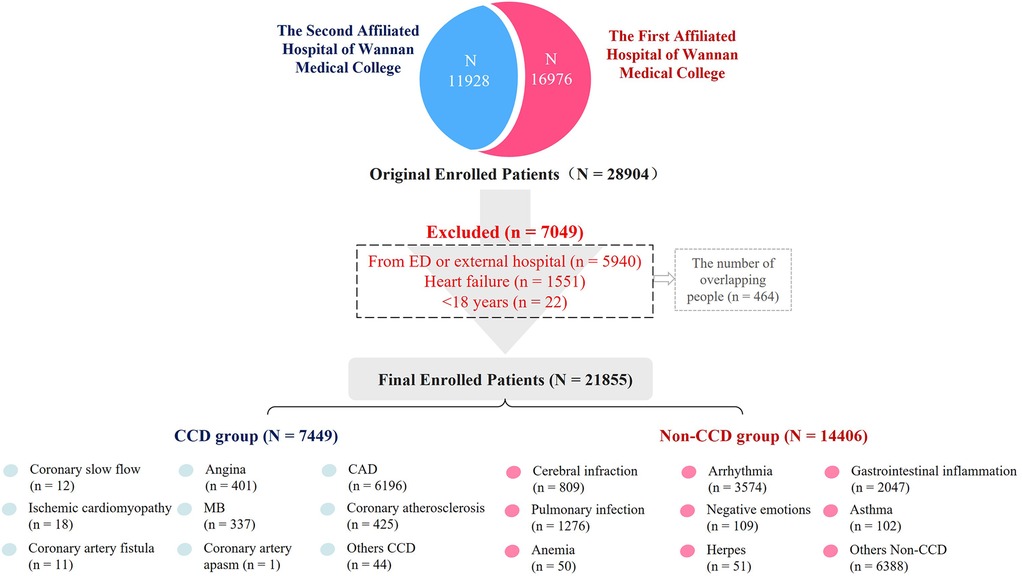
Figure 1. Study flowchart. *CAD, coronary artery disease; MB, myocardial bridge; Others CCD: subacute myocardial infarction, After stent implantation, variant angina pectoris. Others Non-CCD: Pulmonary embolism, pneumothorax, arterial dissection, diabetes mellitus, vertigo syndrome, sleep apnea, congenital heart disease, gallstones, etc.
As Table 1 shows, the CCD group generally had an older age, a higher male proportion, higher systolic blood pressure, and lower diastolic blood pressure compared to the Non-CCD group. These differences were statistically significant.
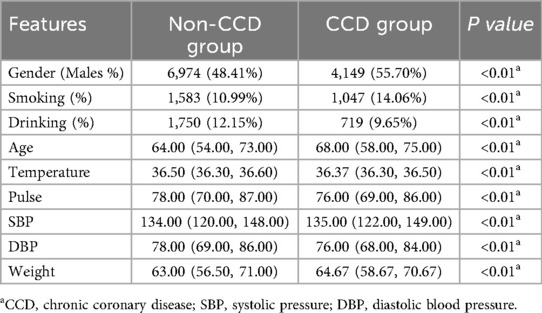
Table 1. Patient characteristics at baseline.
3.2 Feature selection and model evaluation
By integrating the variance selection method and expert opinions, this study ultimately identified seven structured features (Gender, Age, Temperature, Pulse, DBP, Smoking, Drinking) along with 129 text features. Since most of these features exhibited non—normal distribution data, we carried out normalization processing on all features. The dataset was then split into a training set (80% of samples) and a validation set (20% of samples) to ensure model training and performance evaluation were conducted on independent data subsets. After normalization, the RF, KNN, and Logistic Regression models were successfully constructed. To optimize the performance of each model, the grid search algorithm was employed in combination with five-fold cross-validation to fine-tune the hyperparameters (For the specific hyperparameter data, the screened feature structure and the data form of the finally constructed text data after TF-IDF processing, please refer to the Supplementary Materials). Subsequently, the Receiver Operating Characteristic (ROC) curves of each model and their 95% confidence intervals were plotted, shown in Figure 2.
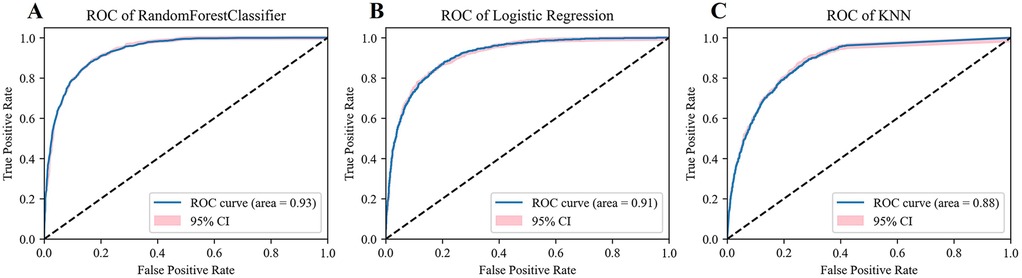
Figure 2. Model evaluation. (A) The ROC and AUC of Radom Forest. (B) The ROC and AUC of Logistic Regression. (C) The ROC and AUC of KNN.
Model evaluation results showed that the RF model performed well, achieving an AUC as high as 0.93 (95% CI, 0.93–0.94). In contrast, the AUC of the KNN model was 0.88 (95% CI, 0.87–0.89); the AUC of the Logistic Regression model was 0.91 (95% CI, 0.91–0.92), shown in Figures 2A–C. Further analysis of the classification performance metrics of the RF model revealed that its accuracy, precision, recall, and F1-score (0.86, 0.82, 0.78, 0.80) were superior to those of the Logistic Regression model (0.84, 0.80, 0.73, 0.76) and the KNN model (0.80, 0.76, 0.64, 0.70).
In conclusion, considering various evaluation metrics, the RF model significantly outperformed the KNN and Logistic Regression models in terms of prediction ability and stability, presenting the most excellent model performance. Therefore, this study selected the RF model for further interpretive analysis.
3.3 Horizontal comparison of models
A horizontal comparative analysis of multiple models was meticulously carried out in this study, and the results are shown in Table 2. The data analysis reveals that the CCD model developed in this study demonstrates remarkable diagnostic efficiency. The AUC of this model is 0.93, which is significantly higher than that of the model constructed solely based on basic data (AUC = 0.76) and the deep-learning model based on facial images (AUC = 0.73). However, it lags behind the model that combines different types of information, like clinical electrocardiogram data, imaging test results, and functional assessments like ramp test (AUC = 0.95).
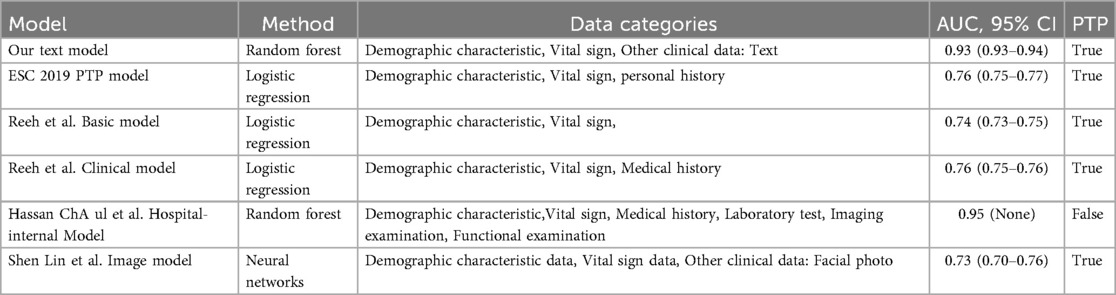
Table 2. Horizontal comparison of models.
3.4 Model interpretative analysis
After successfully constructing a classification model with the RF algorithm, we employed the SHAP algorithm to conduct an interpretive analysis of the model and evaluate the importance of the features. Figure 3A shows the top 20 important features ranked in descending order of the mean absolute SHAP values. Among them, in terms of text variables, “Deny”, “Chest pain”, “Decline”, and “Chest tightness” are among the top-ranked ones. Regarding “Chest pain” and “Chest tightness”, higher TF-IDF values have a greater value for determining the positive diagnosis of CCD. However, for variables such as “Deny” and “Decline”, higher TF-IDF values are more significant for determining the negative diagnosis of CCD. In the structured data, as the value of Age increases, its reference value for diagnosing CCD as positive becomes higher.
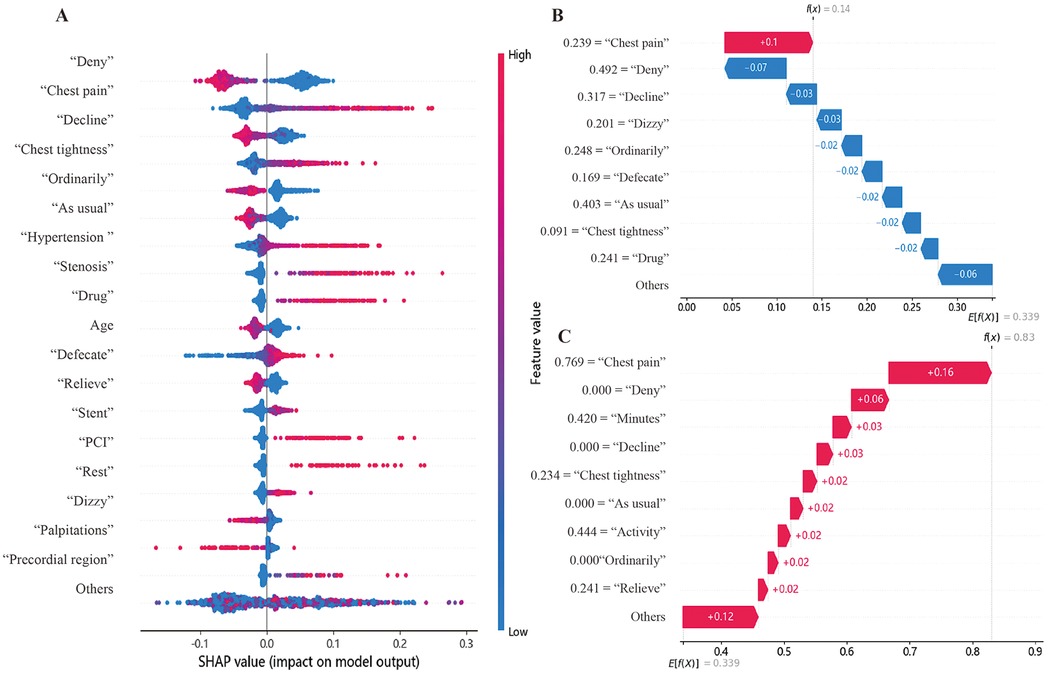
Figure 3. Model interpretative analysis. (A) Top Features in SHAP Analysis. In the graph, a point with a redder color indicates a higher value of this feature, while a point with a bluer color indicates a lower value. A point close to the right of the coordinate axis suggests that this feature is more valuable for determining whether a patient has CCD. Meanwhile, a point close to the left of the coordinate axis suggests that this feature is more valuable for determining whether a patient does not have CCD. (B,C) Example of SHAP interpretation. The x-axis represents important features along with their corresponding values. Features in red have a positive impact on the CCD judgment, while those in blue have a negative impact. f(x) is the final SHAP value for this patient, and E[f(X)] is the expected value. When f(x) > E[f(X)], a positive judgment is favored.
This study conducted an interpretation of individual cases based on the local interpretability of SHAP. Figure 3B shows a case where, despite the text information mentioning “Chest pain” (TF-IDF = 0.239), the SHAP values suggested that the risks related to the remaining features were low. This contributes to the model achieving a SHAP value of 0.14, which is lower than the expected value of 0.339. As a result, this drives the model to make a correct negative prediction. In the case shown in Figure 3C, text features like “Chest pain” (TF-IDF = 0.216), “Chest tightness” (TF-IDF = 0.494), and “Activity” (TF-IDF = 0.625) contribute to the model achieving a SHAP value of 0.64, which is higher than the expected value of 0.339. This drives the model to make a correct positive prediction.
4 Discussion
This study innovatively utilized easily accessible text data and structured data to construct a cost-effective predictive model for patients with CCD. It has been found that the AUC of this model is as high as 0.93. This model holds potential value in fields such as the identification of cardiovascular diseases in primary healthcare and pre-hospital triage, and the research further highlights the significant role of text data in disease prediction.
Previous clinical studies have also explored integrating text and structured data, focusing on extracting valuable information from complex clinical records to support decision-making. For example, Jonnagaddala J et al. proposed a rule-based risk factor extraction system to identify Framingham heart failure symptoms from clinical records and electronic health records (21). However, their approach solely relied on predefined rules, which led to information gaps beyond these rules and the necessity to reconstruct rules for different problems. In contrast, our study processed text data using algorithms, showing broader applicability. In the face of the complexity of medical texts (16) and the difficulties in processing Chinese texts (22–24), this study optimized the general stop word list and custom dictionary based on the excellent jieba Chinese word segmentation tool (25), medical expertise, and in close accordance with the writing habits of clinicians. As a result, redundant information was successfully removed, and the content valuable for disease diagnosis was retained. Finally, a predictive model was successful constructed, and the decision-making process was demonstrated through explainable machine learning.
When making model comparisons, the machine learning model constructed by Ch Anwar ul Hassa et al. using biochemical indicators, electrocardiograms, and the ramp test showed better predictive performance than our model (19). However, it should be noted that since its data foundation relies on in-hospital diagnostic data, the model outputs are closer to post-test probabilities rather than pre-test probabilities. This characteristic limited the application scenarios of this model. Our study successfully established a CCD predictive model by calculating the TF-IDF values of key words in the text, which can be applied to pre-hospital screening and early diagnosis.
In the model developed in our study, the decision-tree-based ensemble algorithm (RF model) significantly outperforms the KNN and logistic regression models in terms of performance. This advantage may stem from multiple factors. Firstly, tree-based algorithms are more robust to high-dimensional sparse features. The sparse matrices generated by TF-IDF (Term Frequency-Inverse Document Frequency) can trigger the “curse of dimensionality” in KNN. This phenomenon causes the distance metric to fail. In contrast, decision trees can effectively reduce the complexity of the feature space through a recursive feature splitting strategy (26). Secondly, the ability to recognize non-linear patterns is a crucial advantage. In medical texts, there are numerous complex semantic relationships, such as negation modifiers and symptom combinations (e.g., “exertional dyspnea + paroxysmal nocturnal dyspnea”). Decision trees naturally capture feature interactions through hierarchical splitting—unlike linear models like logistic regression, which require manual extraction and matching of such information and ensemble methods, by aggregating predictions from multiple decision trees, further enhance this advantage by resisting overfitting, a problem that plagues single models like KNN or logistic regression, especially with noisy, unevenly distributed medical text data (27).
This study has several limitations. First, the NLP algorithms used are relatively basic. While the random forest approach mitigates, to some extent, the challenge of analyzing the diagnostic value of co-occurring terms (e.g., “chest tightness” and “activity”) for CCD, result interpretation remains heavily reliant on specialists’ judgment. Due to constraints on Chinese medical data resources, there is currently no publicly available Simplified Chinese medical BERT model; however, further enhancements in result accuracy could be achieved through fine-tuning general Chinese BERT models. Moreover, machine learning algorithms have low computational requirements, retaining advantages in terms of cost-effectiveness and accessibility. Second, the professionalism, consistency, and completeness of patients’ symptom descriptions are influenced by physicians’ capabilities and recorders’ subjective judgments, directly limiting text mining accuracy and applicability. Though generative large models lack precision in disease identification, they show promise in data generation and standardization. Existing speech-to-text systems based on such models can convert verbal descriptions into standardized medical texts. Future integration of these technologies with our model to build an integrated “voice collection-text generation-disease identification” system could enable rapid, accurate CCD screening in primary care, easing medical resource pressures. Furthermore, the model was developed using data solely from tertiary hospitals in Wuhu, Anhui Province, China; its applicability across different regions and institution levels requires further validation.
5 Conclusion
Our results demonstrate the feasibility of developing a cost-effective prediction model for CCD through the integration of text and structured data. Our model accurately predicts pre-test probabilities in patients and applies the SHAP approach to interpret its decision-making mechanism. This text-based model is expected to have wide applicability.
Data availability statement
The original contributions presented in the study are included in the article/Supplementary Material, further inquiries can be directed to the corresponding author.
Ethics statement
This retrospective study was approved by the Ethics Committee of the Second Affiliated Hospital of Wannan Medical College (Approval No.: WYEFYLS2025023). Since the research involves no direct participant interaction or intervention, and all data were anonymized prior to analysis, the Ethics Committee granted a waiver of informed consent in accordance with the Declaration of Helsinki and local regulatory requirements.
Author contributions
WG: Conceptualization, Data curation, Funding acquisition, Investigation, Resources, Visualization, Writing – original draft, Writing – review & editing. PW: Funding acquisition, Methodology, Visualization, Writing – review & editing, Writing – original draft. XX: Data curation, Resources, Supervision, Writing – review & editing. LY: Data curation, Supervision, Writing – review & editing. DL: Supervision, Validation, Writing – review & editing. SY: Data curation, Supervision, Writing – review & editing. MY: Conceptualization, Data curation, Funding acquisition, Methodology, Project administration, Resources, Supervision, Writing – original draft, Writing – review & editing.
Funding
The author(s) declare that financial support was received for the research and/or publication of this article. This work was supported by the Humanities and Social Sciences Research Planning Foundation of Ministry of Education, China [NO. 22YJAZH134], the Excellent Scientific Research Innovation Team Project of Universities in Anhui Province, China [NO. 2022AH010075], the Academic Support Project for Top-notch Talents in Disciplines (Majors) of Universities in Anhui Province, China [NO. gxbjZD2022042], the Key Research and Development Plan of Anhui Province, China [NO. 2022a05020011], the University Synergy Innovation Program of Anhui Province, China [NO. GXXT-2022–044], the Key Research Project of Humanities and the Social Sciences in Higher Education Institutions in Anhui Province [NO. 2023AH051729] and the Scientific research project of Wuhu Municipal Health Commission [NO. WHWJ2023y015].
Conflict of interest
The authors declare that the research was conducted in the absence of any commercial or financial relationships that could be construed as a potential conflict of interest.
Generative AI statement
The author(s) declare that no Generative AI was used in the creation of this manuscript.
Any alternative text (alt text) provided alongside figures in this article has been generated by Frontiers with the support of artificial intelligence and reasonable efforts have been made to ensure accuracy, including review by the authors wherever possible. If you identify any issues, please contact us.
Publisher's note
All claims expressed in this article are solely those of the authors and do not necessarily represent those of their affiliated organizations, or those of the publisher, the editors and the reviewers. Any product that may be evaluated in this article, or claim that may be made by its manufacturer, is not guaranteed or endorsed by the publisher.
Supplementary material
The Supplementary Material for this article can be found online at: https://www.frontiersin.org/articles/10.3389/fcvm.2025.1559831/full#supplementary-material
References
1. Virani SS, Newby LK, Arnold SV, Bittner V, Brewer LC, Demeter SH, et al. 2023 AHA/ACC/ACCP/ASPC/NLA/PCNA guideline for the management of patients with chronic coronary disease: a report of the American Heart Association/American College of Cardiology joint committee on clinical practice guidelines. Circulation. (2023) 148(9):e9–119. doi: 10.1161/CIR.0000000000001168
2. Bjerking LH, Winther S, Hansen KW, Galatius S, Böttcher M, Prescott E. Prediction models as gatekeepers for diagnostic testing in angina patients with suspected chronic coronary syndrome. Eur Heart J Qual Care Clin Outcomes. (2022) 8(6):630–9. doi: 10.1093/ehjqcco/qcac025
3. Reeh J, Therming CB, Heitmann M, Højberg S, Sørum C, Bech J, et al. Prediction of obstructive coronary artery disease and prognosis in patients with suspected stable angina. Eur Heart J. (2019) 40(18):1426–35. doi: 10.1093/eurheartj/ehy806
4. Mirjalili SR, Soltani S, Heidari Meybodi Z, Marques-Vidal P, Kraemer A, Sarebanhassanabadi M. An innovative model for predicting coronary heart disease using triglyceride-glucose index: a machine learning-based cohort study. Cardiovasc Diabetol. (2023) 22(1):200. doi: 10.1186/s12933-023-01939-9
5. Delgado V, Popescu BA, Plein S, Achenbach S, Knuuti J, Bax JJ. The year in cardiology 2018: imaging. Eur Heart J. (2019) 40(6):508–17. doi: 10.1093/eurheartj/ehy848
6. Winchester DE, Maron DJ, Blankstein R, Chang IC, Kirtane AJ, Kwong RY, et al. ACC/AHA/ASE/ASNC/ASPC/HFSA/HRS/SCAI/SCCT/SCMR/STS 2023 multimodality appropriate use criteria for the detection and risk assessment of chronic coronary disease. J Cardiovasc Magn Reson. (2023) 25(1):58. doi: 10.1186/s12968-023-00958-5
7. Choi BG, Park JY, Rha S-W, Noh Y-K. Pre-test probability for coronary artery disease in patients with chest pain based on machine learning techniques. Int J Cardiol. (2023) 385:85–93. doi: 10.1016/j.ijcard.2023.05.041
8. Boals A, Griffith EL, Park CL. Can respondents accurately self-report posttraumatic growth when coached through the required cognitive steps? Anxiety Stress Coping. (2023) 36(2):184–98. doi: 10.1080/10615806.2022.2047949
9. Fanaroff AC, Peterson ED, Kaltenbach LA, Cannon CP, Choudhry NK, Henry TD, et al. Agreement and accuracy of medication persistence identified by patient self-report vs pharmacy fill: a secondary analysis of the cluster randomized ARTEMIS trial. JAMA Cardiol. (2020) 5(5):532–9. doi: 10.1001/jamacardio.2020.0125
10. Arnett DK, Blumenthal RS, Albert MA, Buroker AB, Goldberger ZD, Hahn EJ, et al. 2019 ACC/AHA guideline on the primary prevention of cardiovascular disease: a report of the American College of Cardiology/American Heart Association task force on clinical practice guidelines. Circulation. (2019) 140(11):e596–646. doi: 10.1161/CIR.0000000000000678
11. Yang X, Li J, Hu D, Chen J, Li Y, Huang J, et al. Predicting the 10-year risks of atherosclerotic cardiovascular disease in Chinese population: the China-PAR project (prediction for ASCVD risk in China). Circulation. (2016) 134(19):1430–40. doi: 10.1161/CIRCULATIONAHA.116.022367
12. Mekkes NJ, Groot M, Hoekstra E, Boer AD, Dagkesamanskaia E, Bouwman S, et al. Identification of clinical disease trajectories in neurodegenerative disorders with natural language processing. Nat Med. (2024) 30(4):1143–53. doi: 10.1038/s41591-024-02843-9
13. Harmsen W, Groot JD, Harkema A, Dusseldorp IV, Bruin JD, Brand SVD, et al. Machine learning to optimize literature screening in medical guideline development. Syst Rev. (2024) 13(1):1–10. doi: 10.1186/s13643-024-02590-5
14. Zhu E, Sheng Q, Yang H, Liu Y, Cai T, Li J. A unified framework of medical information annotation and extraction for Chinese clinical text. Artif Intell Med. (2023) 142:102573. doi: 10.1016/j.artmed.2023.102573
15. Tauscher JS, Lybarger K, Ding X, Chander A, Hudenko WJ, Cohen T, et al. Automated detection of cognitive distortions in text exchanges between clinicians and people with serious mental illness. Psychiatr Serv. (2023) 74(4):407–10. doi: 10.1176/appi.ps.202100692
16. Bergman E, Dürlich L, Arthurson V, Sundström A, Larsson M, Bhuiyan S, et al. BERT based natural language processing for triage of adverse drug reaction reports shows close to human-level performance. PLOS Digit Health. (2023) 2(12):e0000409. doi: 10.1371/journal.pdig.0000409
17. HIT Stop Word List. In Chinese common stop word list (n.d.). Available online at: https://github.com/goto456/stopwords (Accessed September 21, 2024).
18. Tsinghua University Natural Language Processing and Social Humanities Computing Laboratory. THUOCL: Tsinghua University Open Chinese Lexicon (2016). Available online at: http://thuocl.thunlp.org/ (Accessed September 21, 2024).
19. Hassan Cu, Iqbal J, Irfan R, Hussain S, Algarni AD, Bukhari SSH, et al. Effectively predicting the presence of coronary heart disease using machine learning classifiers. Sensors (Basel). (2022) 22(19):7227. doi: 10.3390/s22197227
20. Lin S, Li Z, Fu B, Chen S, Li X, Wang Y, et al. Feasibility of using deep learning to detect coronary artery disease based on facial photo. Eur Heart J. (2020) 41(46):4400–11. doi: 10.1093/eurheartj/ehaa640
21. Jonnagaddala J, Liaw S-T, Ray P, Kumar M, Chang N-W, Dai H-J. Coronary artery disease risk assessment from unstructured electronic health records using text mining. J Biomed Inform. (2015) 58(Suppl):S203–10. doi: 10.1016/j.jbi.2015.08.003
22. Yu Y, Li M, Liu L, Fei Z, Wu F-X, Wang J. Automatic ICD code assignment of Chinese clinical notes based on multilayer attention BiRNN. J Biomed Inform. (2019) 91:103114. doi: 10.1016/j.jbi.2019.103114
23. Zhou G, Chen Y, Feng Y, Zhou R. Processing of translation-ambiguous words by Chinese-English bilinguals in sentence context. J Psycholinguist Res. (2019) 48(6):1133–61. doi: 10.1007/s10936-019-09650-1
24. Chen T, Zhang D. Different aspects of vocabulary depth knowledge in L2 Chinese reading comprehension: comparing higher- and lower-proficiency readers. Foreign Lang Ann. (2023) 56(3):786–806. doi: 10.1111/flan.12687
25. Li D, Li J, Zhu Z, Wei YC, Pei Y. Recognition of Chinese medical named entity using multi-word segmentation method. In: Pei Y, Chang JW, Hung JC, editors. Innovative Computing. IC 2022. Lecture Notes in Electrical Engineering. Vol. 935. Singapore: Springer (2022). p. 74–85. doi: 10.1007/978-981-19-4132-0_6
26. Breiman L, Friedman JH, Olshen RA, Stone CJ. Classification and regression trees (CART). Biometrics. (1984) 40(3):358. doi: 10.2307/2530946
Keywords: chronic coronary disease, pre-test probability, text mining, machine learning, early diagnosis
Citation: Gan W, Wang P, Xie X, Yang L, Lu D, Ye S and Ye M (2025) An explainable machine learning model for predicting chronic coronary disease and identifying valuable text features. Front. Cardiovasc. Med. 12:1559831. doi: 10.3389/fcvm.2025.1559831
Received: 11 February 2025; Accepted: 29 August 2025;
Published: 22 September 2025.
Edited by:
Pietro Enea Lazzerini, University of Siena, ItalyReviewed by:
Geer Teng, University of Oxford, United KingdomBiswaranjan Acharya, Marwadi University, India
Ecir Ugur Küçüksille, Süleyman Demirel University, Türkiye
Copyright: © 2025 Gan, Wang, Xie, Yang, Lu, Ye and Ye. This is an open-access article distributed under the terms of the Creative Commons Attribution License (CC BY). The use, distribution or reproduction in other forums is permitted, provided the original author(s) and the copyright owner(s) are credited and that the original publication in this journal is cited, in accordance with accepted academic practice. No use, distribution or reproduction is permitted which does not comply with these terms.
*Correspondence: Mingquan Ye, eW1xQHdubWMuZWR1LmNu
†These authors have contributed equally to this work and share first authorship