 Shaoyan Huang1
 Qiuwang Zhang
 Jianzhong Zhang
- 1Department of Oncology, Yantaishan Hospital Affiliated to Binzhou Medical University, Yantai, Shandong, China
- 2Division of Cardiology, Keenan Research Center for Biomedical Science, St. Michael’s Hospital, Unity Health Toronto, University of Toronto, Toronto, ON, Canada
- 3Department of Anesthesiology, Yantaishan Hospital Affiliated to Binzhou Medical University, Yantai, Shandong, China
Studies examining the role of albumin-corrected anion gap (ACAG), an emerging promising prognostic biomarker for critical illnesses, in predicting mortality of ICU patients with heart failure (HF) are limited. We aimed to analyze the relationship between ACAG and short- and medium-term all-cause mortality in HF patients with a single ICU admission. Data on HF patients in the Medical Information Mart for Intensive Care-IV (MIMIC-Ⅳ) database were extracted and analyzed. The restricted cubic spline (RCS) model, Kaplan–Meier curve, univariate and multivariate Cox regression, propensity score matching, and mediation analysis were used to assess the association between ACAG concentrations at admission and 30-day and 365-day mortality. Receiver operating characteristic (ROC) curve analysis was performed to evaluate the predictive ability of ACAG for mortality. A total of 4,821 patients were included in this study. The RCS model showed a linear relationship between ACAG and mortality. Based on this result, patients were divided into two groups: ACAG ≥18 mmol/L and ACAG <18 mmol/L. The Kaplan–Meier curve and multivariate Cox regression analysis demonstrated a positive association between ACAG and mortality at both time points. Propensity score matching showed 30-day and 365-day mortality rates in the high ACAG group remained significantly higher compared to the low ACAG group. SAPS II, lactate, BUN, creatinine, and hematocrit partially mediated the association between ACAG and the risk of all-cause mortality. ACAG had an AUC value of 0.647 in predicting mortality. Lactate, the most common and clinically significant unmeasured anion, contributing to ACAG elevation in critical illnesses, was found negatively associated with SpO2 and hemoglobin but positively associated with heart rate, ALT, AST, creatinine, and blood urea nitrogen. In conclusion, there is a significant positive association between ACAG and short- and medium-term all-cause mortality in HF patients with a single ICU admission. The ACAG index should be combined with other clinical markers to ensure accurate risk stratification. Clinicians should be cautious in solely relying on ACAG for decision-making.
1 Introduction
Cardiovascular diseases are highly prevalent worldwide, with heart failure (HF) representing one of the most significant public health issues (1). HF is characterized by impaired cardiac function, leading to reduced organ perfusion and potential multi-organ damage. It is the leading cause of death and hospitalization in individuals over 60 years old (1, 2). Due to the severity of HF, a large proportion of hospitalized patients require admission to the intensive care unit (ICU) (3, 4). Identifying risk factors for mortality in ICU patients with HF is crucial for optimizing treatment, resource allocation, and a better understanding of the pathophysiology. To date, methods, such as the Acute Physiology Score III (APS III) and the Sequential Organ Failure Assessment (SOFA) score have been explored for assessing disease severity and mortality risk in critically ill ICU patients (5–7). While the SOFA score has been shown to predict long-term all-cause mortality in acute HF patients (5), specific studies focusing exclusively on the application of APS III in HF patients are limited (7). SOFA's complexity, reliance on numerous indicators, and the variability in assessors’ scores are notable shortcomings (8).
Patients with HF often exhibit acid-base and electrolyte disturbances (9, 10). The anion gap (AG), which reflects the difference between the concentrations of measured cations and anions in serum, is a widely used biomarker for acid-base disorders. Tissue hypoperfusion in HF can lead to anaerobic metabolism, increasing the production of organic acids such as lactate (10), a significant unmeasured anion that contributes to AG elevation. Moreover, renal dysfunction, which frequently coexists with HF, impairs clearance and further promotes the accumulation of unmeasured anions. Although elevated AG has been associated with poor prognosis in HF (11–13), fluctuations in albumin concentration (albumin is a major negatively charged plasma protein) can result in underestimation of AG. For every 10 g/L decrease in serum albumin, the AG decreases by approximately 2.3–2.5 mmol/L (14, 15). Given that hypoalbuminemia is common in HF, the albumin-corrected anion gap (ACAG) is particularly relevant for HF patients, as it adjusts for hypoalbuminemia and more accurately reflects the burden of unmeasured anions and acid-base disturbances. ACAG has been investigated as a potential biomarker for disease severity and mortality in various critical conditions, including HF (16–22).
To date, reports on the ACAG role in predicting mortality of ICU patients with HF are limited (21, 22). A study with a small sample size (205 patients with HF) found that ACAG levels were positively associated with mortality in hospitalized HF patients over an average follow-up period of approximately 6 years (21). Li et al. studied 7,787 ICU patients with HF and reported that patients who died at 365 days had significantly higher ACAG levels than survivors, but they did not evaluate ACAG predictive ability for mortality (22). Although both studies identified ACAG as a prognostic marker, they included patients with multiple ICU admissions, who may experience various metabolic derangements. Long-term metabolic adaptation in these cases could affect the prognostic value of ACAG. To clarify its precise role in mortality prediction, studies on HF patients with a single ICU admission are needed. Additionally, both studies examined the relationship between ACAG levels and medium- or long-term (1 year or 6 years) mortality. Since identifying biomarkers for short-term mortality enables early targeted interventions that may help reduce mortality, we aimed to investigate the role of ACAG in predicting 30-day (short-term) and 365-day (medium-term) mortality in ICU patients with HF. To this end, we extracted and analyzed data from the Medical Information Mart for Intensive Care-IV (MIMIC-IV) database. Distinct from the two published studies (21, 22), our current study only selected HF patients with a single ICU admission, and we employed propensity score matching (PSM) to minimize confounding effects and further evaluate the association between ACAG levels and mortality. Additionally, we assessed ACAG's predictive ability for mortality using receiver operating characteristic (ROC) curve analysis.
2 Methods
2.1 Database and patients
The MIMIC- IV database at the Beth Israel Deaconess Medical Center was used. Data on HF patients with a single ICU admission from 2008 to 2022 were extracted and analyzed. Since this study involved a secondary analysis of anonymized data, which cannot be used to directly or indirectly identify individuals, the requirement for informed consent and additional ethical review was waived. Jianzhong Zhang, one of the authors, obtained access to the database (certification number 66402178).
Diagnostic codes from the 9th and 10th revisions of the International Classification of Diseases (ICD-9 and ICD-10) were used. Patients were included if they had HF with a single ICU admission. Patients with any one of the following conditions were excluded: (1) multiple ICU admissions; (2) age under 18 years, (3) ICU stay of less than 24 h, and (4) absence of albumin or anion gap (AG) data.
2.2 Patient variables
The primary outcome measures were mortality at 30 and 365 days. Patient variables upon ICU admission (baseline), including demographic information, comorbidities, laboratory results, vital signs, and severity scores were extracted and analyzed. The variables are as follows: age, gender, respiratory rate, body temperature, heart rate, mean blood pressure (MBP), peripheral oxygen saturation (SpO2), comorbidities (diabetes, myocardial infarct, peripheral vascular disease, cerebrovascular disease, chronic pulmonary disease, liver disease, renal disease, and cancer), laboratory data [white blood cell (WBC) counts, hemoglobin, platelet counts, alanine aminotransferase (ALT), aspartate aminotransferase (AST), total bilirubin, albumin, creatinine, blood urea nitrogen (BUN), calcium, chloride, potassium, sodium, potential of hydrogen, lactate, AG, international normalized ratio (INR), prothrombin time (PT), partial thromboplastin time (PTT), alkaline phosphatase (ALP), creatine kinase-MB (CKMB), and lactate dehydrogenase (LDH)], disease severity scores (APS III, SAPS II, Charlson, and SOFA), and medications in the ICU (epinephrine, dopamine, phenylephrine, vasopressin, and norpinephrine). Variables with more than 20% missing values were excluded. Multiple imputation using a random forest-based approach was applied to resolve missing data.
2.3 AG and ACAG calculation
The AG was calculated using the following formula: AG = (serum sodium + serum potassium)−(serum chloride + serum bicarbonate), where all electrolytes were measured in mEq/L. ACAG was calculated using the following formula: ACAG = AG + 2.5 × (4.4—serum albumin), where serum albumin was measured in g/dl (14, 15).
2.4 Statistical analysis
Normally distributed data were expressed as Mean ± SD and analyzed by Student's t-test or one-way ANOVA with post hoc Tukey's analysis. Non-normally distributed variables were presented as median (first quartile, third quartile) and analyzed with Mann–Whitney U-test or Kruskal–Wallis test with post hoc Dunn's test. Categorical data were presented as percentages and analyzed using Chi-square test or Fisher's exact test.
Various statistical tools were employed to elucidate the relationship between ACAG levels and all-cause mortality, including hazard ratios (HR) and 95% confidence intervals (CI), restricted cubic spline (RCS) curves, PSM, Kaplan–Meier (KM) analysis, and multivariate Cox models, with adjustment for covariates. Mediation analysis was conducted to explore potential pathways through which ACAG may influence all-cause mortality. Variables (and their groupings) were selected for the Cox regression models and mediation analysis based on clinical relevance and prior studies that had evaluated the prognostic value of ACAG in critical illnesses (16–22). Additionally, multicollinearity among the variables was assessed using the variance inflation factor (VIF) analysis. Variables with a VIF greater than 10, indicating a high degree of multicollinearity (Supplementary Table S1), were excluded from RCS, Cox regression models, and mediation analysis. ROC curve analysis was used to evaluate the ability of ACAG to predict mortality. The area under the curve (AUC) value is interpreted as: 0.5 ≤ AUC < 0.6 (failed); 0.6 ≤ AUC < 0.7 (poor or low); 0.7 ≤ AUC < 0.8 (moderate or acceptable); 0.8 ≤ AUC < 0.9 (good); and AUC ≥ 0.9 (excellent) (23, 24). Furthermore, multivariate regression was used to examine factors associated with elevated lactate levels.
All analyses were performed using R Statistical Software (version 4.2.2, http://www.R-project.org, the R Foundation) and the Free Statistics Analysis Platform (version 2.0, Beijing, China, http://www.clinicalscientists.cn/freestatistics). A p-value of less than 0.05 from two-tailed tests was considered statistically significant.
3 Results
3.1 Patient screening
The patient screening chart is shown in Figure 1. The database contained 19,021 ICU patients with HF. A total of 4,821 patients met the criteria and were included in this study.
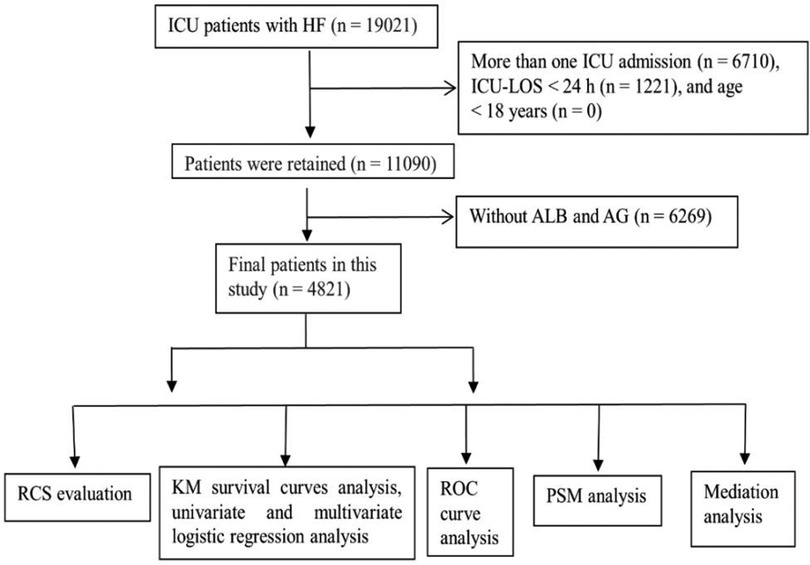
Figure 1. Patient screening flow chart. A total of 19,021 patients underwent screening and 4,821 patients met the criteria and were included in this study.
3.2 Comparisons of baseline variables
The number of patients who died at 30 and 365 days was 1,394 and 2,264, respectively (Table 1). Baseline variables were compared among survivors and patients who died at 30 and 365 days (Table 1). Sex distribution did not differ significantly among different groups of patients. Patients who died were substantially older than survivors and had significantly higher ACAG levels at both time points (Table 1). A higher percentage of patients who died at 30 and 365 days used vasoactive medications, including dopamine, phenylephrine, vasopressin, and norepinephrine, compared to survivors.
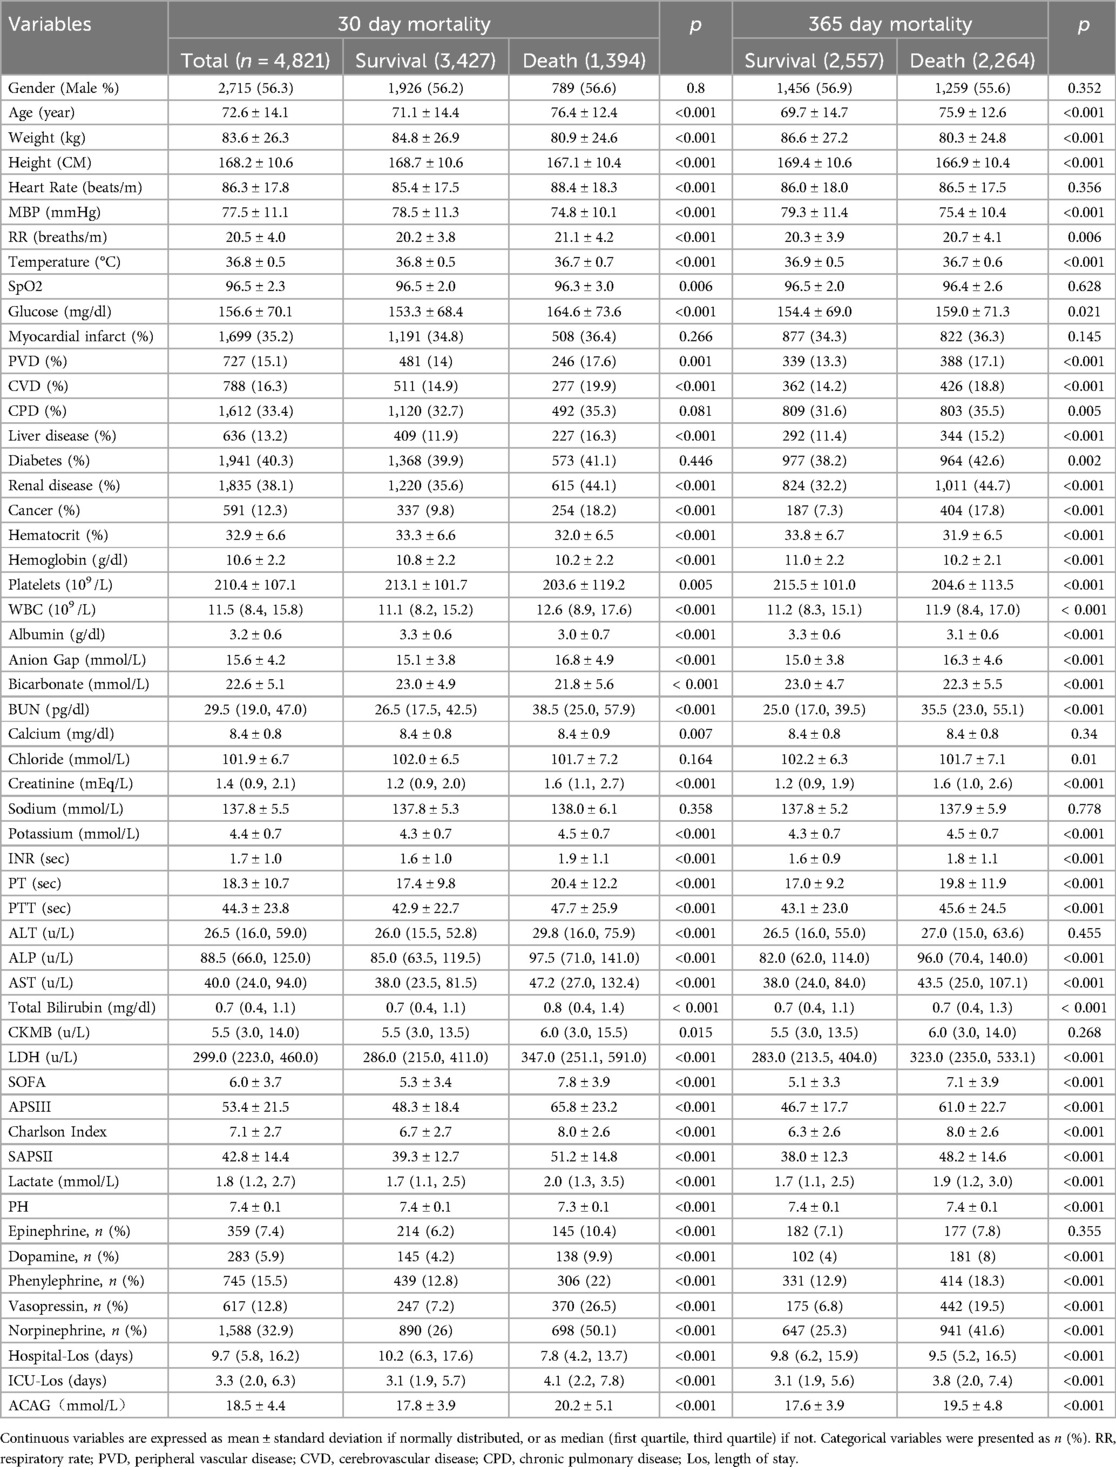
Table 1. Comparisons of baseline characteristics between survivors and non-survivors.
3.3 RCS analysis
The RCS curve revealed a linear association between ACAG and the risk of all-cause mortality in all patients (Figure 2). The model using RCS with four knots was fitted within a generalized additive model.
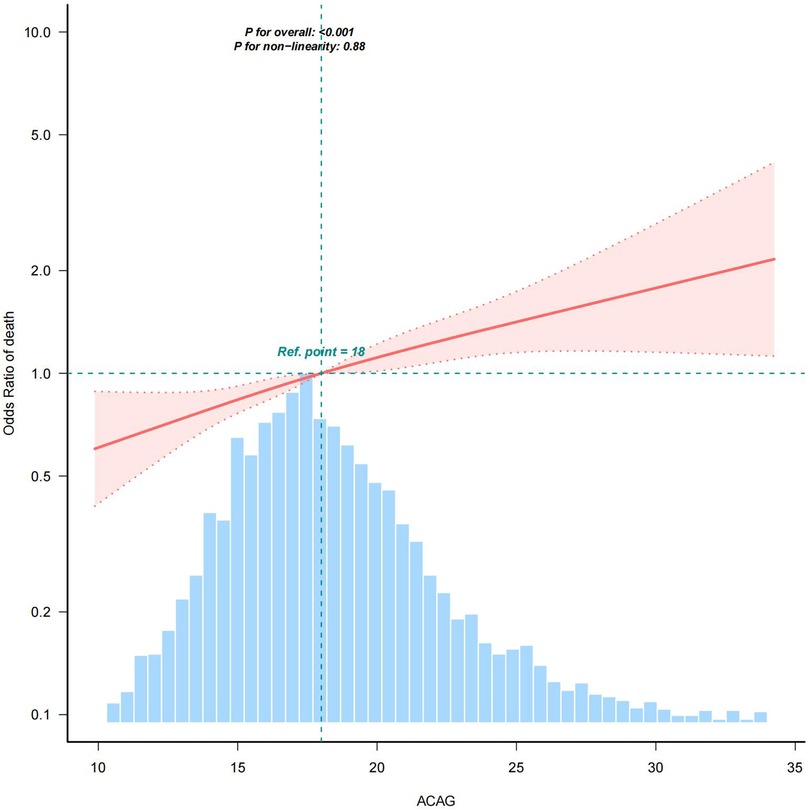
Figure 2. RCS analysis. RCS analysis was performed to assess the association between ACAG and the risk of all-cause mortality in all patients, adjusted for age, gender, heart rate, MBP, respiratory rate, body temperature, SpO2, glucose, diabetes, chronic pulmonary disease, liver disease, renal disease, platelets, hematocrit, BUN, calcium, creatinine, potassium, INR, PT, ALT, AST, CKMB, SOFA, lactate, epinephrine, dopamine, and vasopressin. As shown in this figure, there was a linear association between ACAG and the risk of all-cause mortality. Shaded areas around the red curve depict 99% confidence intervals. The blue histogram represents the distribution of all ACAG values across the study population for which the spline relationship with mortality was modeled.
3.4 Kaplan–Meier analysis and multivariate Cox regression models
Based on RCS results, ACAG levels were classified into ≥18 mmol/L and <18 mmol/L, and patients were divided into two groups accordingly: ACAGQ1 < 18 mmol/L (n = 2,402) and ACAGQ2 ≥ 18 mmol/L, n = 2,419). Kaplan–Meier and multivariate Cox regression analyses were performed to evaluate the relationship between ACAG and mortality.
As shown by the Kaplan–Meier curve in Figure 3, the survival probability is significantly lower in the ACAGQ2 group than in the ACAGQ1 group at both 30 and 365 days.
Figure 3. Km analysis. The KM survival curve showed that the 30-day (panel A) and 365-day (panel B) all-cause mortality rates were significantly higher in ACAGQ2 patients than in ACAGQ1 patients. The p-value indicated in this figure is derived from the log-rank test.
Four models were used in multivariable cox proportional hazard analysis. They are (1) the crude model (unadjusted), model I (adjusted for age, heart rate, MBP, respiratory rate, temperature, SpO2, and glucose), model II (adjusted for model I + diabetes, chronic pulmonary disease, liver disease, renal disease, platelets, hematocrit, BUN, calcium, creatinine, and potassium), and model III (adjusted for model II + INR, PT, ALT, AST, CKMB, SOFA, lactate, epinephrine, dopamine, and vasopressin). As shown in Table 2, with ACAGQ1 as the reference group, the Cox proportional hazard models showed that the HRs were increased at both 30 and 365 days in the ACAGQ2 group in each model.
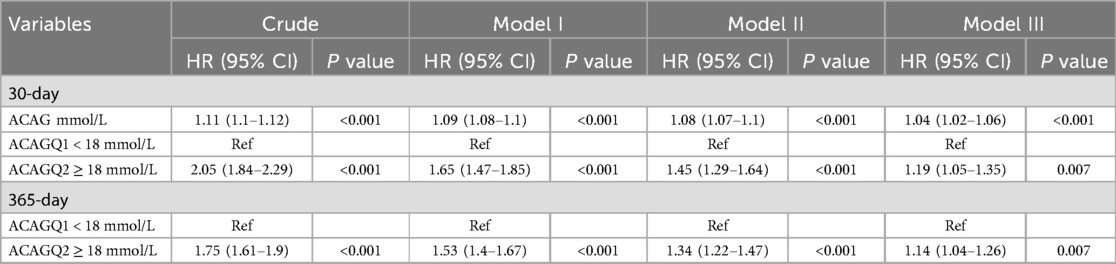
Table 2. Cox proportional hazard analysis.
3.5 Matched cohort characteristics
PSM was conducted to mitigate selection bias by balancing observed covariates. All relevant variables were included in the propensity score model, except AG, albumin, APSIII, and SAPSII. Matched cohort characteristics are shown in Table 3. After propensity score matching, 30-day and 365-day mortality rates in ACAGQ2 group remain significantly higher than those in the ACAGQ1 group (p = 0.043 for 30-day mortality and p = 0.029 for 365-day mortality).
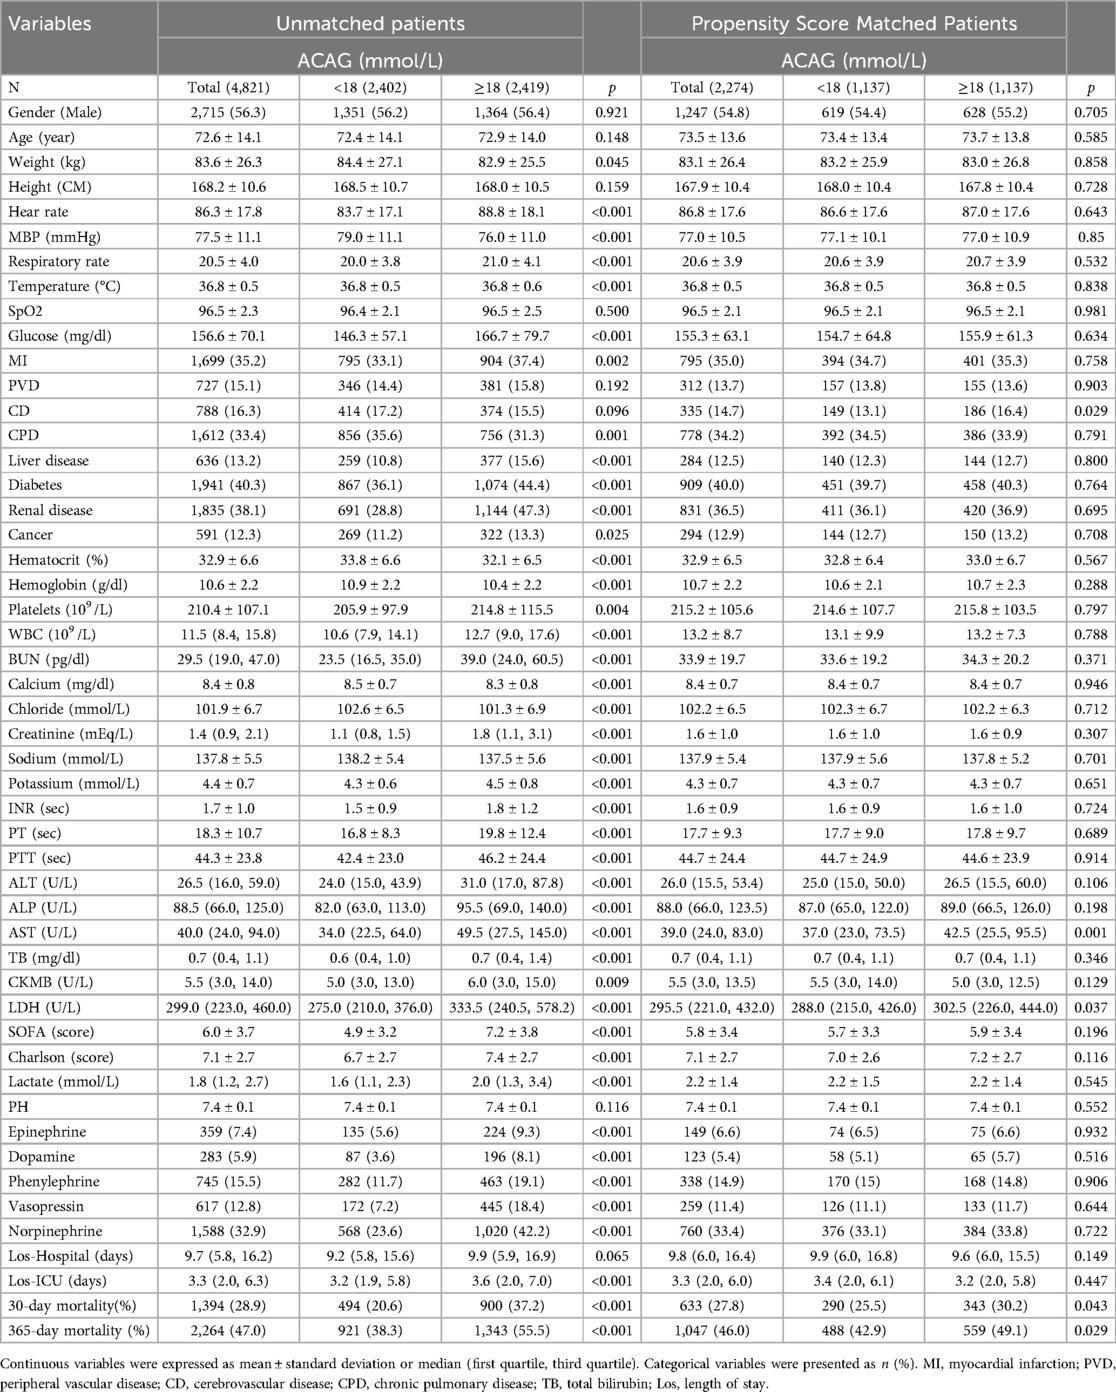
Table 3. Cohort characteristics before and after propensity score matching.
3.6 Mediation effect analysis
A mediation analysis showed that SAPS II, lactate, BUN, creatinine, and hematocrit partially mediated the association between ACAG and all-cause mortality, accounting for 33.76%, 9.65%, 22.68%, 13.39%, and 5.66% of the mediating effect, respectively (Table 4).
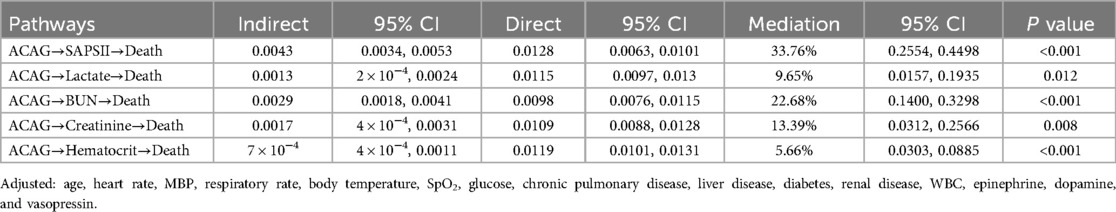
Table 4. Causal mediation analysis results.
3.7 ROC curve analysis
The predictive ability of albumin, lactate, AG, ACAG, and SOFA for mortality was assessed by ROC analysis. As shown in Figure 4, ACAG was superior to albumin, lactate, and AG but inferior to SOFA in predicting mortality.
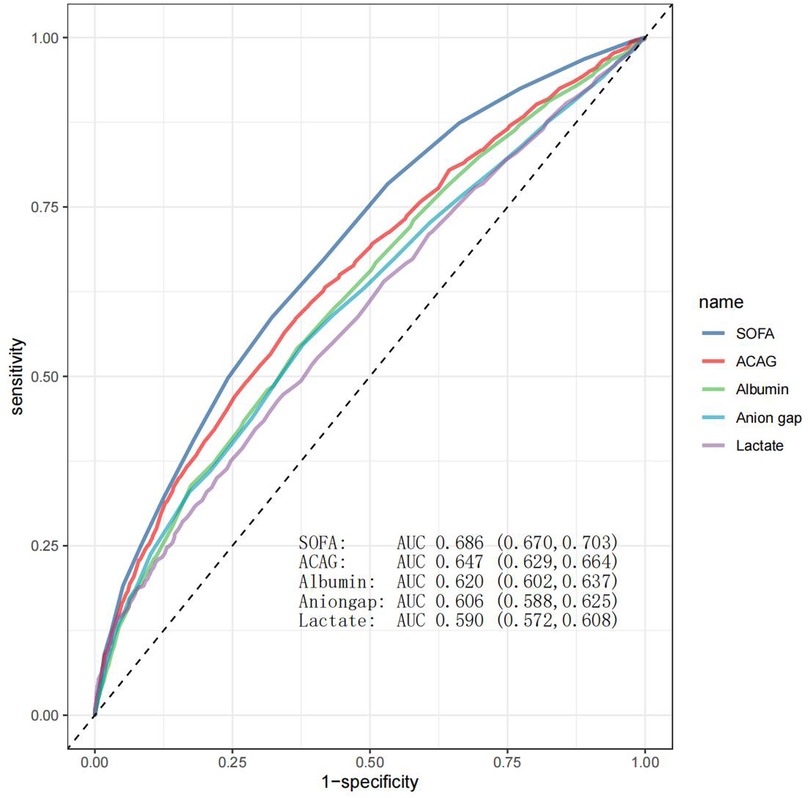
Figure 4. ROC curve analysis. As shown in this figure, SOFA, ACAG, albumin, AG, and lactate had an area under the curve (AUC) value of 0.686, 0.647, 0.620, 0.606, and 0.590, respectively.
3.8 Multivariate regression analysis
Elevated lactate is the most common and clinically significant unmeasured anion, contributing to increased ACAG levels in critical illnesses (25). Multivariate regression analysis revealed that SpO2 and hemoglobin were negatively associated with lactate levels, while heart rate, ALT, AST, creatinine, and blood urea nitrogen were positively associated (Table 5).
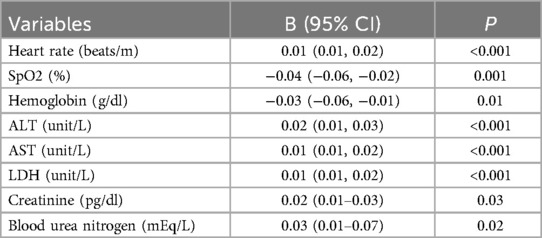
Table 5. Multivariate analysis of factors associated with elevated blood lactate levels.
4 Discussion
In this study, we focused on patients with a single ICU admission. This selection aimed to recruit a relatively homogeneous cohort to reduce confounding factors related to multiple admissions, such as varying interventions, chronic complications, and changes in clinical status over time, which could obscure the direct relationship between ACAG and outcomes. By analyzing the physiological derangements reflected by ACAG at ICU admission and their impact on prognosis, especially 30-day mortality, while minimizing confounding, we aimed to elucidate the actual role of ACAG as a prognostic biomarker in the group of patients we chose to study. We present the following findings: (1) patients who died at 30 and 365 days had significantly higher ACAG levels compared to survivors; (2) ACAG levels showed a positive association with mortality at both time points; (3) propensity score matching confirmed a positive relationship between ACAG levels and mortality; (4) SAPS II, lactate, bicarbonate, BUN, creatinine, and hematocrit indirectly mediated the association between ACAG and all-cause mortality; (5) ACAG had a higher AUC value than AG in predicting mortality; and (6) SpO₂ and hemoglobin were negatively associated with lactate levels, while heart rate, ALT, AST, creatinine, and blood urea nitrogen were positively associated.
Identifying high-risk ICU patients with HF within 30 days enables urgent interventions, such as intensive monitoring, medication adjustments, and advanced therapies, to reduce mortality. Additionally, many HF patients are readmitted to ICU within 30 days (26), and biomarkers predicting early mortality can guide post-discharge management to reduce the risk of readmission. Therefore, we first compared ACAG levels between patients who died at 30 days and survivors. Our results showed that patients who died at 30 days had significantly higher ACAG levels that were positively associated with mortality. To our knowledge, this is the first report on ACAG predicting short-term mortality in ICU patients with HF.
A few studies have investigated the relationship between ACAG levels and mortality in patients with HF (21, 22). In a retrospective, real-world study of hospitalized HF patients (whether admitted to ICU was not specified), it was found that the death group had significantly higher baseline ACAG levels than the survival group during a mean follow-up period of ∼6 years (21). Another study involving over 7,500 ICU patients with HF reported that ACAG was associated with higher 1-year all-cause mortality (22). This 1-year data, along with ours, suggest a positive association between ACAG levels and short- and medium-term mortality in ICU patients with HF. Compared to the two previous studies (21, 22), which relied solely on multivariate Cox regression, our study employed a more rigorous approach by combining propensity score matching with Cox regression to more effectively minimize confounding effects. Our results confirmed a positive association between ACAG levels and mortality after propensity score matching.
In the present study, SAPS II and BUN were found to be the most significant indirect mediators of the association between ACAG and all-cause mortality, as shown by mediation effect analysis. The SAPS II scoring system incorporates both acute physiological parameters and chronic health conditions, making it a more comprehensive tool for ICU mortality prediction (27). In contrast, the APS III scoring system exclusively evaluates acute physiological parameters to assess the severity of acute illnesses (28). Therefore, SAPS II was selected as a key variable for mediation analysis. It is well documented that comorbidities relate to all-cause mortality in HF patients (29–31). The European Heart Failure Pilot Study showed that diabetes, chronic kidney disease, and anemia were independently associated with increased mortality in HF patients (29). Another study from the UK found that diabetes, chronic kidney disease, and lung disease substantially increased the risk of mortality in HF patients (30). A recent systematic review and meta-analysis study also revealed that diabetes and chronic kidney disease were significant risk factors for mortality in HF patients (31). These previous findings align with the mediating role of SAPS II in the association between ACAG and mortality observed by our study. Therefore, identifying comorbidities in heart failure and initiating prompt, effective treatment is crucial for improving outcomes. We found that BUN, a key marker of kidney function, accounted for 22.68% of the mediated effect. Higher baseline BUN has been reported as a strong predictor of increased post-discharge mortality in patients hospitalized for HF (32), supporting our finding that BUN significantly mediated the association between ACAG and mortality.
Elevated lactate is the most common and clinically significant unmeasured anion, contributing to increased ACAG levels in critical illnesses (25). Lactate accumulation can occur due to tissue hypoperfusion in the context of HF (33). The liver and kidneys are two primary organs responsible for lactate clearance (34). Based on these considerations, heart rate, SpO2, hemoglobin, ALT, AST, creatinine, and blood urea nitrogen were included in the multivariate regression analysis to examine their associations with lactate levels. The results showed that SpO2 and hemoglobin were negatively associated with lactate levels, while heart rate, ALT, AST, creatinine, and blood urea nitrogen were positively associated. These findings suggest that tissue hypoxia caused by HF promotes anaerobic metabolism and increases lactate production, while liver and kidney dysfunction impairs lactate metabolism and excretion, ultimately leading to lactate elevation and contributing to increased ACAG levels. This is also reflected in our finding that lactate mediated the association between ACAG and the risk of all-cause mortality. Therefore, optimizing oxygen delivery through increasing hemoglobin levels, maintaining sufficient SpO2, close monitoring and support of hepatic and renal function are critical to reduce lactate levels and improve outcomes in patients with HF. In the present study, the predictive ability of lactate for mortality was found to be inferior to that of ACAG. While lactate levels were associated with lower SpO2 and hemoglobin, and higher ALT, AST, creatinine, and blood urea nitrogen, we did not analyze the extent to which lactate contributes to the observed increase in ACAG, which could be an interesting direction for future research.
A previous study assessed the ability of ACAG to predict long-term mortality (approximately 6 years) in hospitalized HF patients, and reported an AUC value of 0.773, indicating a moderate or acceptable level of performance (21). However, these authors studied a small sample size (205 patients) and did not provide details on hospitalization frequency. We found an AUC value of 0.647 for ACAG, which fell within the category of poor or low performance, although it was higher than that of AG. Our findings highlight the limited standalone predictive value of ACAG, support its use alongside other clinical markers to improve prognostic accuracy, and may alert other clinicians and researchers to avoid redundant studies.
This study has the following limitations: (1) it is observational, limiting the ability to infer causality; (2) ACAG data were missing in approximately 40% of patients, which, although likely random, may still introduce bias and reduce statistical power; (3) the data analyzed in the present study were collected from a single medical center, limiting the generalizability of the findings; and (4) as MIMIC-IV includes data only from the Beth Israel Deaconess Medical Center, prior ICU admissions at other institutions could not be accounted for and may represent a source of unmeasured confounding. Prospective studies are needed to validate our findings.
5 Conclusion
There is a significant positive association between ACAG and short- and medium-term all-cause mortality in HF patients with a single ICU admission. Notably, according to ROC analysis, ACAG had a performance that ranges from poor to, at most, moderate, in predicting mortality. The ACAG index should be combined with other clinical markers to ensure accurate risk stratification, and clinicians should be cautious in solely relying on ACAG for decision-making. Taken together, if anything, our results reaffirm that pathophysiologically uninformed composite scores, when used in isolation, are unlikely to yield strong predictive ability, and that it is questionably whether this meaningfully informs therapeutic intervention targets.
Data availability statement
The datasets presented in this study can be found in online repositories. The names of the repository/repositories and accession number(s) can be found below: https://mimic.mit.edu/.
Ethics statement
The requirement of ethical approval was waived by Yantaishan Hospital Research Ethics Committee for the studies involving humans because this study utilized data from the MIMIC-IV repository, which is a de-identified dataset. According to the guidelines set forth by our hospital's research ethics committee, the ethical review and approval were exempted. The studies were conducted in accordance with the local legislation and institutional requirements. The ethics committee/institutional review board also waived the requirement of written informed consent for participation from the participants or the participants’ legal guardians/next of kin because this study utilized data from the MIMIC-IV repository, which is a de-identified dataset. According to the guidelines set forth by our hospital's research ethics committee, written informed consent was waived.
Author contributions
SH: Formal analysis, Writing – original draft. QZ: Formal analysis, Writing – original draft, Writing – review & editing. LL: Formal analysis, Writing – original draft. MK: Conceptualization, Writing – review & editing. JZ: Conceptualization, Data curation, Funding acquisition, Writing – original draft, Writing – review & editing.
Funding
The author(s) declare that financial support was received for the research and/or publication of this article. This study was supported by the Shandong Province Natural Science Foundation (ZR2022MH320) and the Shandong Provincial Government’s Public Scholarship Program for Overseas Study.
Conflict of interest
The authors declare that the research was conducted in the absence of any commercial or financial relationships that could be construed as a potential conflict of interest.
Generative AI statement
The author(s) declare that no Generative AI was used in the creation of this manuscript.
Any alternative text (alt text) provided alongside figures in this article has been generated by Frontiers with the support of artificial intelligence and reasonable efforts have been made to ensure accuracy, including review by the authors wherever possible. If you identify any issues, please contact us.
Publisher's note
All claims expressed in this article are solely those of the authors and do not necessarily represent those of their affiliated organizations, or those of the publisher, the editors and the reviewers. Any product that may be evaluated in this article, or claim that may be made by its manufacturer, is not guaranteed or endorsed by the publisher.
Supplementary material
The Supplementary Material for this article can be found online at: https://www.frontiersin.org/articles/10.3389/fcvm.2025.1608383/full#supplementary-material
References
1. Beghini A, Sammartino AM, Papp Z, von Haehling S, Biegus J, Ponikowski P, et al. 2024 Update in heart failure. ESC Heart Fail. (2025) 12(1):8–42. doi: 10.1002/ehf2.14857
2. Bozkurt B, Ahmad T, Alexander KM, Baker WL, Bosak K, Breathett K, et al. Heart failure epidemiology and outcomes statistics: a report of the Heart Failure Society of America. J Card Fail. (2023) 29(10):1412–51. doi: 10.1016/j.cardfail.2023.07.006
3. Grupper A, Chernomordik F, Herscovici R, Mazin I, Segev A, Beigel R, et al. The burden of heart failure in cardiac intensive care unit: a prospective 7 years analysis. ESC Heart Fail. (2023) 10(3):1615–22. doi: 10.1002/ehf2.14320
4. Metkus TS, Lindsley J, Fair L, Riley S, Berry S, Sahetya S, et al. Quality of heart failure care in the intensive care unit. J Card Fail. (2021) 27(10):1111–25. doi: 10.1016/j.cardfail.2021.08.001
5. Aoyama D, Morishita T, Uzui H, Miyazaki S, Ishida K, Kaseno K, et al. Sequential organ failure assessment score on admission predicts long-term mortality in acute heart failure patients. ESC Heart Fail. (2020) 7(1):245–53. doi: 10.1002/ehf2.12563
6. Jentzer JC, Bennett C, Wiley BM, Murphree DH, Keegan MT, Gajic O, et al. Predictive value of the sequential organ failure assessment score for mortality in a contemporary cardiac intensive care unit population. J Am Heart Assoc. (2018) 7(6):e008169. doi: 10.1161/JAHA.117.008169
7. Nassar AP, Malbouisson LM, Moreno R. Evaluation of simplified acute physiology score 3 performance: a systematic review of external validation studies. Crit Care. (2014) 18(3):R117. doi: 10.1186/cc13911
8. Moreno R, Rhodes A, Piquilloud L, Hernandez G, Takala J, Gershengorn HB, et al. The sequential organ failure assessment (SOFA) score: has the time come for an update? Crit Care. (2023) 27(1):15. doi: 10.1186/s13054-022-04290-9
9. Urso C, Brucculeri S, Caimi G. Acid-base and electrolyte abnormalities in heart failure: pathophysiology and implications. Heart Fail Rev. (2015) 20(4):493–503. doi: 10.1007/s10741-015-9482-y
10. Bar O, Aronson D. Hyperlactataemia and acid-base disturbances in normotensive patients with acute heart failure. Eur Heart J Acute Cardiovasc Care. (2022) 11(3):242–51. doi: 10.1093/ehjacc/zuac005
11. Samavarchitehrani A, Norouzi M, Khalaji A, Ghondaghsaz E, Behnoush AH. Prognostic value of anion gap for patients with heart failure: a systematic review and meta-analysis. BMC Cardiovasc Disord. (2024) 24(1):727. doi: 10.1186/s12872-024-04420-x
12. Peng S, Chen Q, Ke W, Wu Y. The relationship between serum anion gap levels and short-, medium-, and long-term all-cause mortality in ICU patients with congestive heart failure: a retrospective cohort study. Acta Cardiol. (2024) 79(6):705–19. doi: 10.1080/00015385.2024.2371627
13. Xu H, Xia J, Wang A, Zong L, An X, Sun X. Serum anion gap is associated with mortality in intensive care unit patients with diastolic heart failure. Sci Rep. (2023) 13(1):16670. doi: 10.1038/s41598-023-43928-8
14. Feldman M, Soni N, Dickson B. Influence of hypoalbuminemia or hyperalbuminemia on the serum anion gap. J Lab Clin Med. (2005) 146(6):317–20. doi: 10.1016/j.lab.2005.07.008
15. Figge J, Jabor A, Kazda A, Fencl V. Anion gap and hypoalbuminemia. Crit Care Med. (1998) 26(11):1807–10. doi: 10.1097/00003246-199811000-00019
16. Wang J, Yang P, Zeng X, Chen S, Chen X, Deng L, et al. Prognostic significance of albumin corrected anion gap in patients with acute pancreatitis: a novel perspective. Sci Rep. (2025) 15(1):1318. doi: 10.1038/s41598-025-85773-x
17. Giri M, Puri A, Huang L, Guo S. Association between albumin corrected anion gap and in-hospital mortality in critically ill patients with chronic obstructive pulmonary disease. Ther Adv Respir Dis. (2025) 19:17534666251315352. doi: 10.1177/17534666251315352
18. Xu J, Wang Z, Wang Y, Chen X, Ma L, Wang X. Association of elevated albumin-corrected anion gap with all-cause mortality risk in atrial fibrillation: a retrospective study. BMC Cardiovasc Disord. (2025) 25(1):55. doi: 10.1186/s12872-025-04518-w
19. Wang Y, Zhong L, Min J, Lu J, Zhang J, Su J. Albumin corrected anion gap and clinical outcomes in elderly patients with acute kidney injury caused or accompanied by sepsis: a MIMIC-IV retrospective study. Eur J Med Res. (2025) 30(1):11. doi: 10.1186/s40001-024-02238-z
20. Wang Y, Tao Y, Yuan M, Yu P, Zhang K, Ying H, et al. Relationship between the albumin-corrected anion gap and short-term prognosis among patients with cardiogenic shock: a retrospective analysis of the MIMIC-IV and eICU databases. BMJ Open. (2024) 14(10):e081597. doi: 10.1136/bmjopen-2023-081597
21. Aydın SŞ, Aksakal E. Relationship between albumin-corrected anion gap and mortality in hospitalized heart failure patients. Cureus. (2023) 15(9):e45967. doi: 10.7759/cureus.45967
22. Li N, Li J, Wang K. Independent prognostic importance of the albumin-corrected anion gap in critically ill patients with congestive heart failure: a retrospective study from MIMIC-IV database. BMC Cardiovasc Disord. (2024) 24(1):735. doi: 10.1186/s12872-024-04422-9
23. de Hond AAH, Steyerberg EW, van Calster B. Interpreting area under the receiver operating characteristic curve. Lancet Digit Health. (2022) 4(12):e853–5. doi: 10.1016/S2589-7500(22)00188-1
24. Çorbacıoğlu ŞK, Aksel G. Receiver operating characteristic curve analysis in diagnostic accuracy studies: a guide to interpreting the area under the curve value. Turk J Emerg Med. (2023) 23(4):195–8. doi: 10.4103/tjem.tjem_182_23
25. Kotake Y. Unmeasured anions and mortality in critically ill patients in 2016. J Intensive Care. (2016) 4:45. doi: 10.1186/s40560-016-0171-2
26. Pishgar M, Theis J, Del Rios M, Ardati A, Anahideh H, Darabi H. Prediction of unplanned 30-day readmission for ICU patients with heart failure. BMC Med Inform Decis Mak. (2022) 22(1):117. doi: 10.1186/s12911-022-01857-y
27. Le Gall JR, Lemeshow S, Saulnier F. A new simplified acute physiology score (SAPS II) based on a European/north American multicenter study. JAMA. (1993) 270(24):2957–63. doi: 10.1001/jama.1993.03510240069035
28. Scheffler RM, Knaus WA, Wagner DP, Zimmerman JE. Severity of illness and the relationship between intensive care and survival. Am J Public Health. (1982) 72(5):449–54. doi: 10.2105/AJPH.72.5.449
29. van Deursen VM, Urso R, Laroche C, Damman K, Dahlström U, Tavazzi L, et al. Co-morbidities in patients with heart failure: an analysis of the European heart failure pilot survey. Eur J Heart Fail. (2014) 16(1):103–11. doi: 10.1002/ejhf.30
30. Drozd M, Relton SD, Walker AMN, Slater TA, Gierula J, Paton MF, et al. Association of heart failure and its comorbidities with loss of life expectancy. Heart. (2021) 107(17):1417–21. doi: 10.1136/heartjnl-2020-317833
31. Lee KS, Park DI, Lee J, Oh O, Kim N, Nam G. Relationship between comorbidity and health outcomes in patients with heart failure: a systematic review and meta-analysis. BMC Cardiovasc Disord. (2023) 23(1):498. doi: 10.1186/s12872-023-03527-x
32. Dobre M, Yang W, Pan Q, Appel L, Bellovich K, Chen J, et al. Persistent high serum bicarbonate and the risk of heart failure in patients with chronic kidney disease (CKD): a report from the chronic renal insufficiency cohort (CRIC) study. J Am Heart Assoc. (2015) 4(4):e001599. doi: 10.1161/JAHA.114.001599
33. Yuzefpolskaya M, Schwartz S, Ladanyi A, Abraham J, Gale CP, Grinstein J, et al. The role of lactate metabolism in heart failure and cardiogenic shock: clinical insights and therapeutic implications. J Card Fail. (2025):S1071-9164(25)00041-7. doi: 10.1016/j.cardfail.2025.01.011
Keywords: heart failure, critical care unit, mortality, albumin-corrected anion gap, prognosis
Citation: Huang S, Zhang Q, Liu L, Kutryk MJB and Zhang J (2025) Relationship between albumin-corrected anion gap and short- and medium-term all-cause mortality in heart failure patients with a single ICU admission. Front. Cardiovasc. Med. 12:1608383. doi: 10.3389/fcvm.2025.1608383
Received: 8 April 2025; Accepted: 13 August 2025;
Published: 29 August 2025.
Edited by:
Micah Liam Arthur Heldeweg, Amsterdam University Medical Center, NetherlandsReviewed by:
Martin Krbec, Charles University, CzechiaKenrick Berend, Curacao medical center, Curaçao
Copyright: © 2025 Huang, Zhang, Liu, Kutryk and Zhang. This is an open-access article distributed under the terms of the Creative Commons Attribution License (CC BY). The use, distribution or reproduction in other forums is permitted, provided the original author(s) and the copyright owner(s) are credited and that the original publication in this journal is cited, in accordance with accepted academic practice. No use, distribution or reproduction is permitted which does not comply with these terms.
*Correspondence: Michael J. B. Kutryk, bWljaGFlbC5rdXRyeWtAdW5pdHloZWFsdGgudG8=; Jianzhong Zhang, amlhbnpob25nemhhbmcuZG9jQG91dGxvb2suY29t