 Junjie Bian1,2
 Chengyu Liu
 Hua-Nong Ting
- 1Institute of Tibetan Medicine, University of Tibetan Medicine, Lhasa, China
- 2Department of Biomedical Engineering, Faculty of Engineering, Universiti Malaya, Kuala Lumpur, Malaysia
- 3Department of Medicine, Faculty of Medicine, Universiti Malaya, Kuala Lumpur, Malaysia
- 4School of Instrument Science and Engineering, Southeast University, Nanjing, Jiangsu, China
- 5Department of Cardiology, Hefei BOE Hospital, Hefei, Anhui, China
- 6Department of Infectious Disease, Shangqiu Municipal Hospital, Shangqiu, Henan, China
- 7Intensive Care Unit, The First People’s Hospital of Shangqiu City, Shangqiu, Henan, China
- 8Faculty of Medical Engineering, Jining Medical University, Jining, Shandong, China
Backgrounds: Heart failure (HF) is a major health concern associated with poor prognosis, and there is an urgent clinical need for an easy and accurate method for screening HF. This multicenter study aims to validate a novel AI-based phono-electrocardiogram algorithm (AI-PECG) in early HF detection.
Methods: A total of 1,017 individuals were grouped into a training cohort and an external validating cohort, with a ratio of 8:2. In the training cohort, data of patients were further split into training set and test set randomly with the 8:2 ratio. The least absolute shrinkage and selection operator with five-fold cross-validation was utilized for dimensionality reduction and selection of features for model construction from clinical variables, phonocardiogram (PCG) parameters and electrocardiogram (ECG) parameters. Five machine learning (ML) algorithms were then carried out to choose a classifier model with the optimal recognition of HF, including logistic regression, random forest, eXtreme Gradient Boosting, Category Boosting (CatBoost), and Naive Bayes. The importance of ranking predicted factors was calculated in the final screening model using the SHapley Additive exPlanations analysis.
Results: Among eligible participants, 302 reported HF. Totally 17 variables were selected to conduct the screening models. In the training set, the area under the curve (AUC) of the CatBoost model was 0.998 [95% confidence interval (CI): 0.996–1.000], which was higher compared to that of other ML models. The sensitivity and specificity of CatBoost model was 0.989 (95% CI: 0.978–0.996) and 0.989 (95% CI: 0.979–0.999). In the screening model, top 5 factors in terms of importance were EMAT, lymphocyte, LVST, CRP, and platelet.
Conclusion: The ML model incorporating general data alongside ECG and PCG features carried out good detection performance for HF. This had the potential to be an available tool for clinicians to screen HF patients as early as possible for further clinical interventions.
Introduction
Heart failure (HF), compounded by late diagnosis, remains a major contributor to high morbidity and mortality (1, 2). In China, nearly 12.1 million people are affected by HF, with approximately 3 million new cases each year (3). Despite new medical therapy improved clinical outcomes for patients with HF, the 5-year mortality rate is still nearly 50% (4). Early detection of HF can delay the progression and improve long-term prognosis (5). The 12-lead electrocardiogram (ECG) and phonocardiogram (PCG) are common initial screening tools for cardiac disease in clinical practice due to their rapid, simple, and non-invasive nature, providing important insights into heart structure and hemodynamic parameters (6, 7). However, the early-stage symptoms and signs of HF often show insufficient sensitivity and specificity when screened only using ECG or PCG (8, 9), leading to a limited accuracy (10). Therefore, integrating ECG and PCG signals may offer clinical value in detecting complex cardiac diseases (11), which may have potential clinical value in the detection of HF in untested populations.
Advancements in artificial intelligence (AI) technology are being utilized to detect cardiovascular diseases through biomedical signal analysis (12–14). A prospective, observational, multicenter study in the UK indicated that AI-ECG have the potential to be inexpensive, noninvasive, and workflow-adapted for earlier HF detection (14). This inspired a novel approach that combines AI algorithm with the integrated features of heart sounds and cardiac electrical activity, which enables interpreting any adequate quality ECG and PCG signals and produces a prediction model for HF diagnosis. AI-based phono-electrocardiogram algorithm (AI-PECG) is a new technique that utilizes AI algorithms to collect and analyze the signals of cardiac electrical activity and heart sounds simultaneously during routine auscultation. It can create a graph of cardiac electrical activity and heart sound murmurs by using a miniature sensor during a heart cycle, offering an earlier detection reference for complex heart diseases (15). The emergence of AI-PECG presents an opportunity to leverage the combined features of ECGs and PCGs for simultaneous initial screening of HF, while also facilitating the development of a screening tool based on machine learning (ML) models by using the combined features. Tools based on ML models for screening cardiac diseases have been developed (16, 17), but those specifically designed for HF remain limited.
Therefore, we developed ML-based HF detection models by using ECG and PCG parameters as well as conventional HF risk factors. The study aims to arrive at a final model that outperforms the existing HF screening model through different ML-based models trained and tested on cohorts and to validate the potential of AI-PECG for HF early detection.
Method
Study design and population
This is a multicenter, retrospective cohort study designed to construct and evaluate an HF detection model reliant on electronic health records and PECG data. A total of 1,017 patients received PECG examination in three hospitals in two provinces of China between January 2023 and December 2023 were recruited. Exclusion criteria based on age or diagnosed disorder were applied, meaning that patients aged ≥18 years, without HF history and other severe heart disease history that will influence the interpretation of ECG or PCG were included. Also, patients with incomplete AI-PECG features and missing important health record data were excluded because their records were not suitable for the training and test model. HF was diagnosed based on the American College of Cardiology (ACC) and American Heart Association (AHA) guidelines for the management of HF (18).
The independent reviewer extracted patients’ demographic information, medical contact details, and final diagnoses from electronic health records, and the features of both ECG and PCG were identified from the AI-PECG system. The AI-PECG features as well as health records data were merged by the unique ID of patients. Adjudications were made by independent reviewers at each local site after reviewing all available medical records, and the reviewers were blinded from all feature analyses and models’ predictions.
ECG and PCG parameters management
The parameters of ECG and PCG were acquired from patients upon their initial contact with the hospital using AI-PECG devices. Patients assumed a quiet supine position for approximately 5–10 min, maintaining stable respiration throughout. The AI-PECG devices were connected to the chest and limb leads following the conventional 12-lead ECG method, with V3 and V4 leads positioned with dual receptors for both ECG and PCG, allowing synchronous recording of signals for a duration of 2 min. Each patient had at least three consecutive records obtained. Digital PECG files were exported in.xml format and stored on a secondary server at each local site. AI-PECG images were de-identified and manually annotated by independent reviewers or research specialists. AI-PECG recordings with poor quality or missing leads were excluded. Subsequently, digital (with.xml format) files were analyzed offline.
Features selection
Participants were randomly divided into a training cohort and an external validating cohort first, with an 8:2 ratio. Then, data of patients in the training cohort were further split into training sets and test sets randomly also with the 8:2 ratio. All feature selection processes were conducted within the training set. To mitigate omitted feature bias, we adopted a data-driven approach [5-fold least absolute shrinkage and selection operator (LASSO)] for feature selection. Initially, features of conventional risk factors [including sex, age, hypertension, hypotension, coronary artery disease (CAD), heart rate (HR), hemoglobin (HB), lymphocyte, platelet, total cholesterol (TC), triglyceride (TG), C-reactive protein (CRP)], PCG parameters [electro mechanical activation time (EMAT)/left ventricular systolic time (LVST), EMAT (%, the EMAT to RR ratio), LVST, first heart sound (S1), second heart sound (S2), third heart sound (S3), and fourth heart sound (S4)], and ECG parameters [including Axes, P wave duration (PD), PR interval duration (PRD), QRS complex duration (QRSD), QT interval duration (QTD), V5 lead R-wave amplitude plus V1 lead S-wave amplitude (RV5_SV1)] were all included. S1 is the first sound in the heart sound cycle, indicating the beginning of ventricular contraction and is produced by the closure of the mitral and tricuspid valves due to the pressure difference between the atria and ventricles. S2 indicates the beginning of the ventricular diastole and is mainly generated by the vibrations when the aortic valve and pulmonary valve close. The EMAT is the time between the Q peak and the beginning of the S1 signal. The LVST indicates the time duration between the peak of the S1 sound and that of S2 sound. Subsequently, the LASSO with five-fold cross-validation was employed for dimensionality reduction and selection of these features. The final variables used for model construction were selected based on the smallest mean square error (MSE) for each penalty coefficient λ.
Prediction modeling and evaluation
Five ML algorithms were carried out to choose a classifier model with the optimal recognition of HF, including logistic regression (LR), random forest (RF), eXtreme Gradient Boosting (XGBoost), Category Boosting (CatBoost), and Naive Bayes (NB). Features for model construction were selected utilizing the five ML algorithms with the five-fold cross-validation. In the training set, data were divided into five subsets, four of which were served as the training set and the other as the validation set. Five iterations were then performed, and the means of the cross-validations and the best performance fold were taken as the final classification results to screen the optimal screening model. The screening ability of the final model was further validated by the test set. The flow chart of model development and validation is presented in Figure 1.
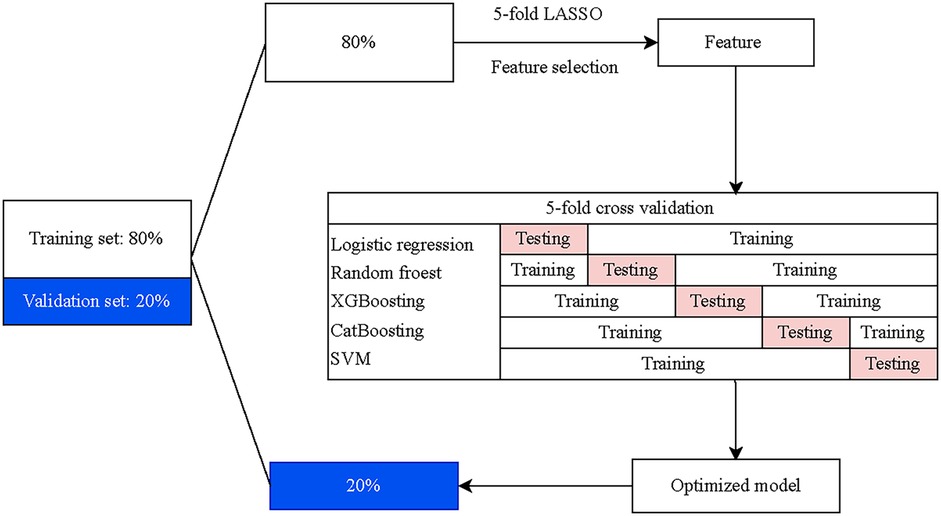
Figure 1. The flow chat of model development and validation.
Model interpretation
To evaluate the prediction value and accuracy of various ML models, we calculated and compared areas under the curve (AUC) of the receiver operating characteristic curve (ROC), sensitivity, and specificity. The SHapley Additive exPlanation (SHAP) values were used to provide consistent and locally accurate attribution values for each feature within each prediction model, which is a unified approach for explaining the outcome of any ML model. All SHAP values were computed using the training set.
Statistical analysis
All statistical analyses were performed using R software (version 4.3.3, R Foundation for Statistical Computing, Vienna, Austria). Continuous data were presented as mean ± standard deviation (SD) and categorical data were presented as numbers with percentages [n (%)]. Differences in continuous data were compared using the t-test or Wilcoxon rank-sum test, and differences in categorical data were compared using the χ2 test or Fisher's exact test. The fitting of the final model was evaluated by plotting ROC curves, calibration curve, and decision curve analysis (DCA) curves. The importance of ranking predicted factors was calculated in the final screening model using the SHAP analysis (shapviz package available on CRAN). The correlations of the detection factors with HF were further assessed. P-value < 0.05 was considered as the statistical significance.
Results
Characteristics of participants
Among 1,017 eligible patients, 302 patients reported HF (Table 1). Of the overall samples, the mean age was 68.16 (10.44) years and 523 (51.43%) were female; 326 (32.06%) had hypertension and 522 (51.33%) had CAD; 432 (42.48%) reported S3 heart sound and 88 (8.65%) reported heart sound S4. Compared to non-HF group, the HF group had higher levels of HR (74.44 vs. 71.02, P < 0.001), CRP (9.88 Mg/L vs. 7.93 Mg/L, P < 0.001), EMAT/LVST (0.40 vs. 0.30, P < 0.001), EMAT (13.97 ms vs. 10.84 ms, P < 0.001), S2 (48.36 ms vs. 41.31 ms, P < 0.001), PRD (142.51 vs. 131.57, P = 0.021), QRSD (82.87 vs. 77.45, P = 0.024) and RV5_SV1 (7.34 vs. 1.68, P < 0.001). No significant difference has been observed between these two groups in other characteristics (all P > 0.05).
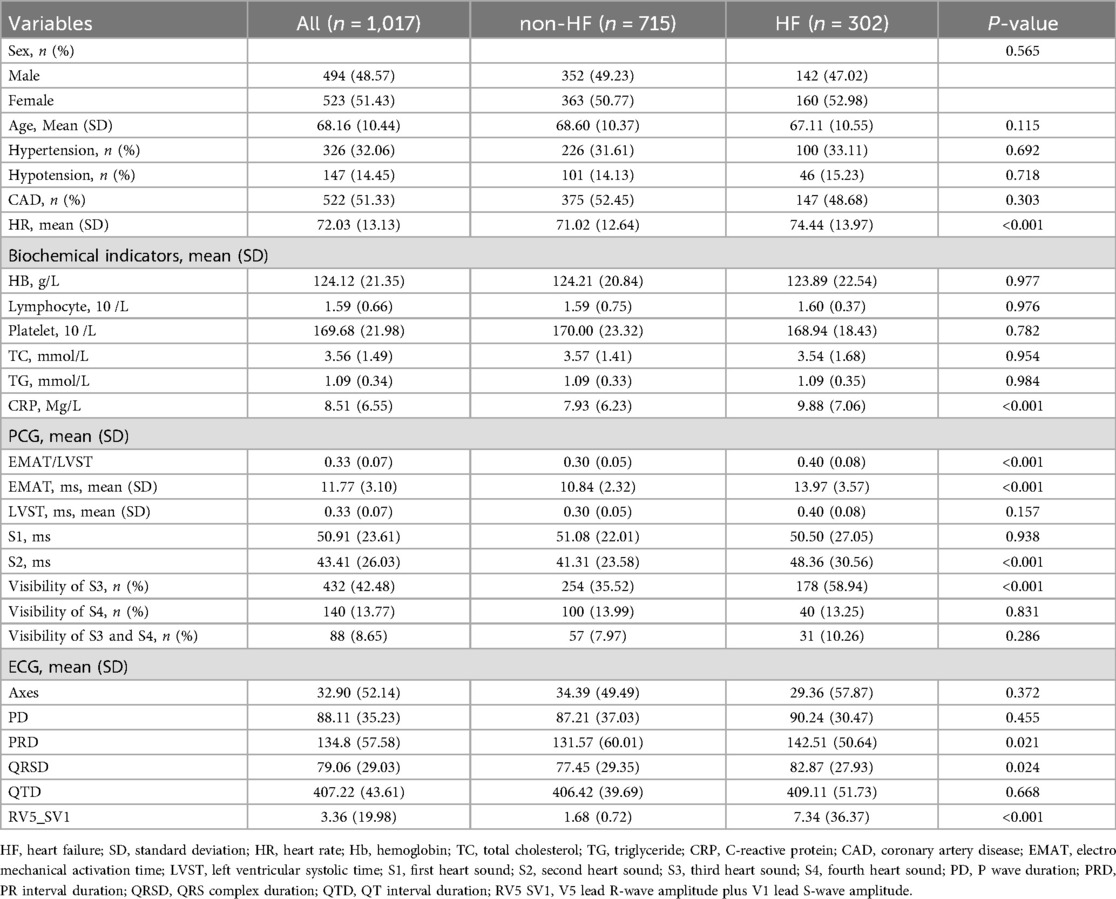
Table 1. Patients’ characteristics included in the HF screening model.
Model construction with different machine learning methods
Utilizing the Five-fold cross-validation approach, we identified 17 predictors comprising four conventional risk factors (age, CRP, HR, HB), seven PCG features (EMAT, LVST, S1 heart sound, S2 heart sound, S3 heart sound, S4 heart sound, S3 and S4 heart sound), and six ECG features (QTD, PRD, PD, RV5_SV1, QRSD, Axes) for construction of the screening models (Table 1). Figure 2 showed the performance of different ML classifiers in detection HF within the training and test datasets, respectively. According to the mean values of AUC of 5-fold cross validation, the CAT classifier exhibited the best performance, demonstrating robust generalizability to both the training set and the test set.
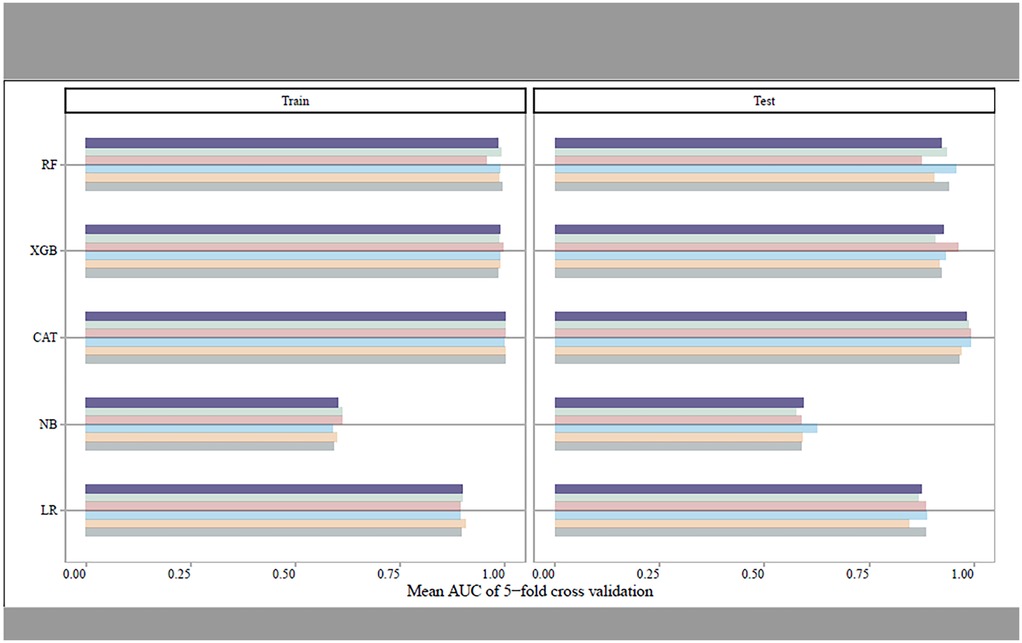
Figure 2. The mean AUCs of the five-fold cross-validation for different machine learning models in training set and test set, respectively.
Model validating and explainability
Table 2 presented the performance of the CatBoost model in screening HF across the training, test, and validating datasets. The AUCs of the CatBoost model in the training and test sets were 0.998 (95%CI: 0.996–1.000) and 0.992 (95%CI: 0.984–1.000), respectively. In the validating dataset, the AUC of the CatBoost model was 0.994 (95%CI: 0.984–1.000). The sensitivity of the model in the training set, test set and validating set was 0.989 (95%CI: 0.979–0.999), 0.958 (95%CI: 0.923–0.994) and 0.972 (95%CI: 0.945–0.999) respectively (Figure 3). The specificity of the model in the training set, test set and validating set was 0.990 (95%CI: 0.977–1.000), 0.905 (95%CI: 0.816–0.994), and 0.966 (95%CI: 0.920–1.000), respectively. The fitting of the final model was illustrated by calibration curves (Supplementary Figure S1) and DCA curves (Supplementary Figure S2). Moreover, comparation on mean AUCs between the final model and model that was constructed by ECG and PCG features showed a similar performance on HF detection (Supplementary Figure S3).
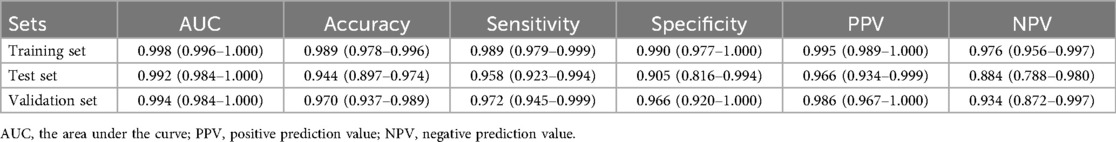
Table 2. The detection performance of the catBoots model.
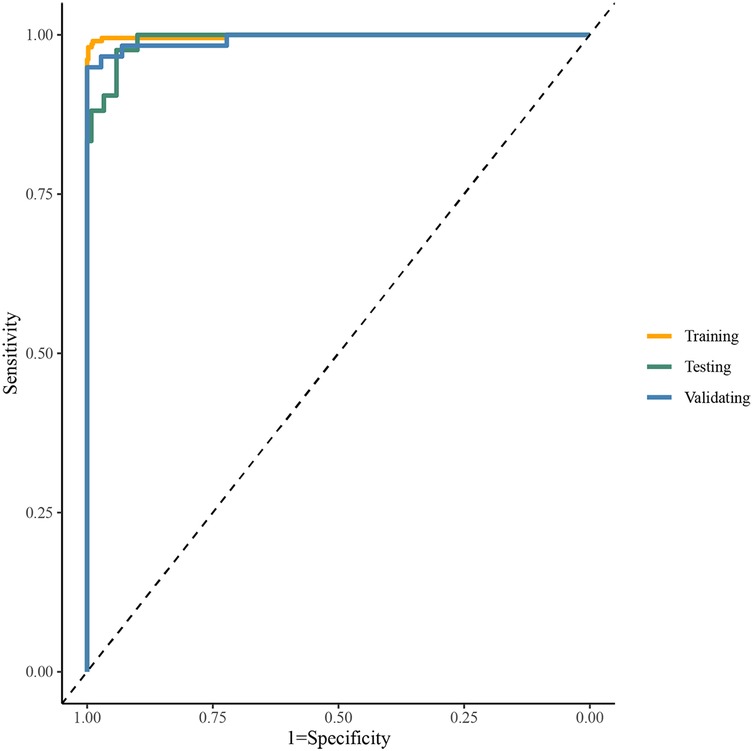
Figure 3. The ROC curve of the catBoost model.
The SHAP summary plot of CatBoost showed the most influential features in the final screening model, revealing that the top 5 important features were EMAT, lymphocyte, LVST, CRP, and platelet (Figure 4). This plot illustrated the relationship between feature values and SHAP values in the training dataset, with higher SHAP values indicating a greater likelihood of HF. Additionally, the SHAP dependence plot offered insight into how individual ECG features (Figure 5A) and PCG features (Figure 5B) impact the CatBoost model's output. This visualization demonstrated how the attributed importance of a feature changes as its value fluctuates.
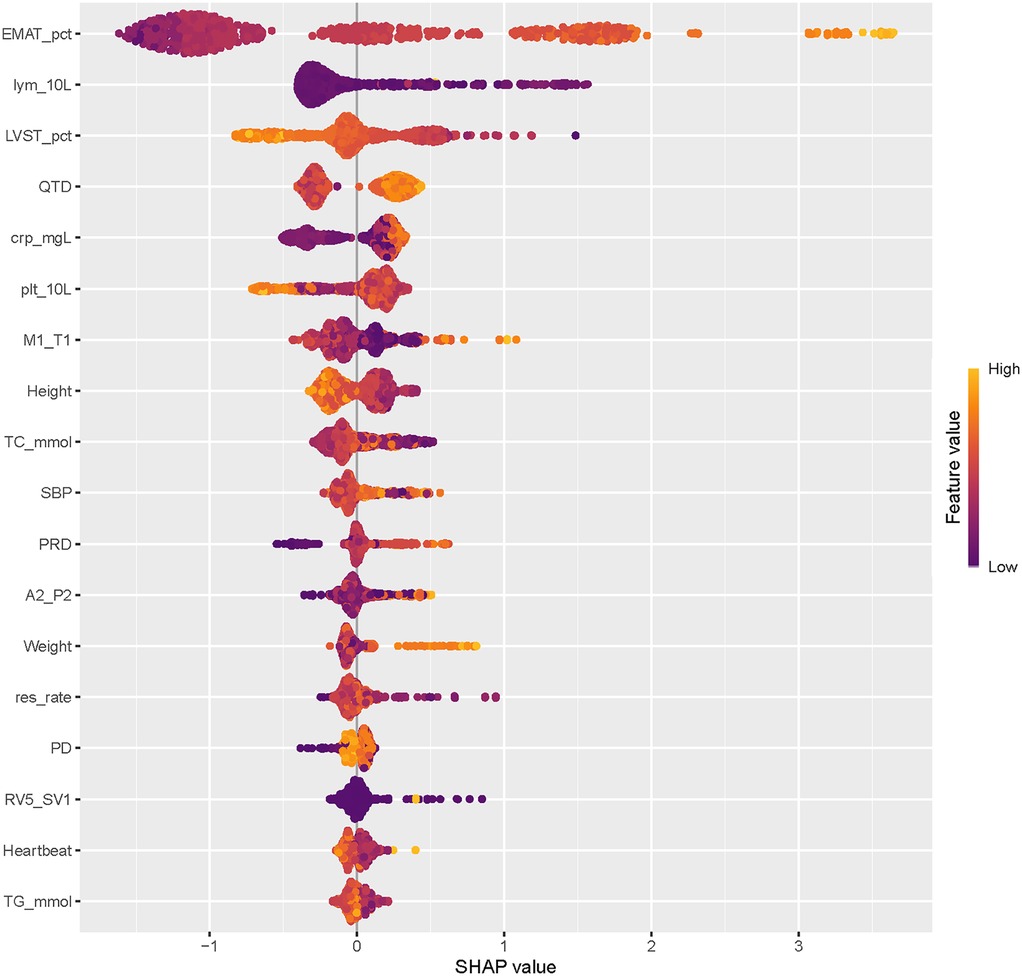
Figure 4. The rank of the importance of features in the catBoost model for HF screening.
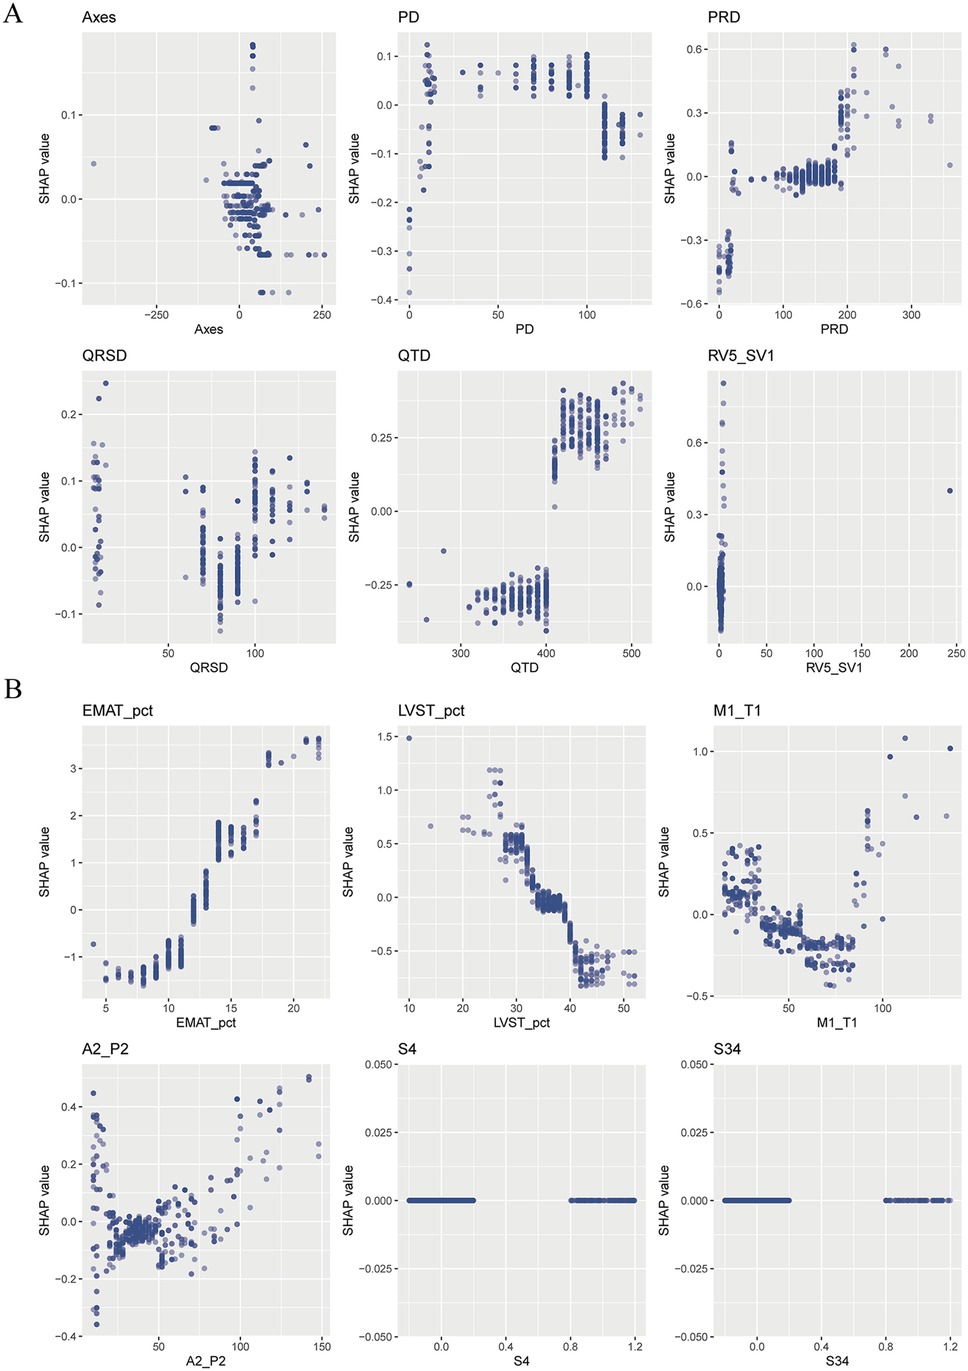
Figure 5. The SHAP dependence plot of the catBoost model. (A) ECG parameters; (B) PCG parameters.
Discussion
To our knowledge, this was the first clinical study that validated and tested the performance of ML-based models to detect HF using the simultaneous features of PCG and ECG collected from AI-PECG. The ML-based HF detection model was trained and validated on 1,017 participants from three hospitals demonstrated a strong identification performance, with an AUC of 0.998, a sensitivity of 0.989, and a specificity of 0.990. These findings indicated that this model combined features of PCG and ECG with conventional risk factors have the potential to apply in early screening of HF in clinical. Moreover, this model was dominated by relatively few predictors, making it possible to predict with very high and fast detection based on only a few predictors.
According to the study results, using a clinical detection support tool based on the simultaneous features of PCG and ECG, when combined with the conventional risk factors, could be imperative for improving the accuracy of detecting HF. This estimate was quite similar to the current literature that used the joint data of PCGs, ECGs, and conventional risk factors to predict cardiac diseases (19–22). However, the development of such models in HF is still limited due to the absence of relevant datasets for training and validation. In the existing algorithms, most of them have only used ECGs or electronic health records, and few studies have applied PCGs. The accuracy range of the existing algorithm by only using ECGs for predicting HF was about 80.0%–98.9% (23–25), while the models using electronic health record with a sensitivity of 83%–95.3% (26, 27). For the models using PCGs, the accuracy was about 82.6%–88.2% (28). Although some of these models performed well with high AUC and sensitivity, the size and nature of these databases limited their application to clinical practice. The major challenge in the clinical application of ECG or PCG to HF detection may be that the abnormal symptoms of patients are inconspicuous or even absent in some cases. As the first study to use a ML approach for HF detection, our findings indicated that joint analysis of ECG and PCG could be a good solution to the above issue since ECG and PCG signals can reflect the electrical and mechanical activities of the heart respectively, which provides more reliable and complete evidence for early detection.
Furthermore, SHAP values were used to uncover the black box of ML and to facilitate the model interpretation. In the present study, the top 5 most influential features contributing to this model were EMAT, lymphocyte, LVST, CRP, and platelet. These factors have all been proven associated with the occurrence of HF. EMAT, defined as the period from the onset of the Q wave to the first peak of S1, reflecting the timing of electrical excitation and mechanical movement in the heart. Early studies have indicated that this timing is prolonged in HF patients. Li et al. (11) have reported that the heart sound and ECG signal index EMAT contributes to the diagnosis of ejection fraction <50%. Trabelsi et al. (29) found that HF patients exhibited higher EMAT and lower LVET compared to non-HF patients. The incidence of HF is linked to chronic systemic inflammation. We observed that elevated CRP levels are associated with an increased likelihood of HF occurrence. Burger et al. (30) similarly identified CRP as an independent risk factor for HF in patients with cardiovascular diseases. In summary, this research yielded results consistent with those obtained through traditional statistical analysis and ML-model studies, providing further validation of our findings.
Our findings have significant clinical implications. The performance of our final model was robust, indicating its potential utility in detecting early signs of HF in clinical settings. This could provide valuable support for implementing early risk management among patients with HF. Compared to traditional evaluation methods, the high sensitivity of ML-based detection tool could substantially improve HF early identification by reducing unnecessary hospitalizations and examinations, leading to significant time and cost savings. Our detection model boasted real-time applicability and scalability, as it can be automated and directly integrated into AI-PECG machines without requiring additional clinical data inputs (31). This suggested its practical utility in various healthcare settings, particularly in primary healthcare organizations where access to more invasive diagnostics may be limited. Additionally, the clinical decision support function of our HF detection model had immense practical value for non-professionals with limited experience in interpreting ECGs and PCGs. In clinical practice, non-professionals often encounter challenges in swiftly and accurately interpreting complex ECGs and PCGs. Our model addressed this issue by automatically analyzing ECG and PCG characteristics, delivering accurate HF risk prediction results promptly, and aiding in quick clinical decision-making. This capability had the potential to enhance the accuracy and efficiency of early HF detection, while also mitigating the risk of misdiagnosis or missed diagnoses attributable to imprecise judgments and human error.
Several limitations should be cautious to explain the findings. First, development of the HF detection model depended on features of ECGs and PCGs extracted from manufacturer-specific software. This implied that it requires retraining because of the variations in ECG and PCG signal pre-processing among different manufacturers when utilizing alternative software for signal processing. Second, although the selected features by data-driven technique had a positive effect on our model, a mixed strategy for feature selection needs to be future assessed. Third, despite analyzing data from three hospitals, our study encompassed only 1,017 patients, and the ML algorithm's performance could differ when applied to larger datasets with varying distributions of patient characteristics and across different institutions.
Conclusion
In this study, we used the capabilities of ML to create a novel screening tool with high performance for HF, intended for clinicians’ use. Our findings indicated that integrating the analysis of PCG and ECG features markedly enhances the accuracy of HF screening, may surpassing traditional evaluation tools that rely solely on ECG or PCG features. Moreover, since this model aided early HF detection, it may further provide effective information on risk management strategies in HF patients.
Data availability statement
The raw data supporting the conclusions of this article will be made available by the authors, without undue reservation.
Ethics statement
The studies involving humans were approved by the Medical Ethics Committees of Shangqiu Municipal Hospital (2023-KY-01-002), the First People's Hospital of Shangqiu city (HS2023059), and Hefei Boe hospital (BOE-IRB-SOP006-1.0-FJ01). The studies were conducted in accordance with the local legislation and institutional requirements. Written informed consent for participation was not required from the participants or the participants’ legal guardians/next of kin in accordance with the national legislation and institutional requirements.
Author contributions
JB: Conceptualization, Data curation, Investigation, Methodology, Writing – original draft. K-HC: Formal analysis, Software, Writing – review & editing. CL: Writing – review & editing, Project administration, Validation. HS: Validation, Writing – review & editing, Formal analysis. SZ: Validation, Writing – review & editing, Data curation. PC: Writing – review & editing, Project administration, Resources. H-NT: Project administration, Writing – review & editing, Conceptualization, Supervision.
Funding
The author(s) declare that no financial support was received for the research and/or publication of this article.
Conflict of interest
The authors declare that the research was conducted in the absence of any commercial or financial relationships that could be construed as a potential conflict of interest.
Generative AI statement
The author(s) declare that no Generative AI was used in the creation of this manuscript.
Any alternative text (alt text) provided alongside figures in this article has been generated by Frontiers with the support of artificial intelligence and reasonable efforts have been made to ensure accuracy, including review by the authors wherever possible. If you identify any issues, please contact us.
Publisher's note
All claims expressed in this article are solely those of the authors and do not necessarily represent those of their affiliated organizations, or those of the publisher, the editors and the reviewers. Any product that may be evaluated in this article, or claim that may be made by its manufacturer, is not guaranteed or endorsed by the publisher.
Supplementary material
The Supplementary Material for this article can be found online at: https://www.frontiersin.org/articles/10.3389/fcvm.2025.1613577/full#supplementary-material
Supplementary Figure S1 | The calibration curve of the CatBoost model. (A) In the training set; (B) in the test set; (C) in the validation set.
Supplementary Figure S2 | The DCA curves of the CatBoost model. (A) In the training set; (B) in the test set; (C) in the validation set.
Supplementary Figure S3 | The mean AUCs of the five-fold cross-validation for different machine learning models in training set and test set of full-feature model and ECG + PCG model.
References
2. Savarese G, Becher PM, Lund LH, Seferovic P, Rosano GMC, Coats AJS. Global burden of heart failure: a comprehensive and updated review of epidemiology. Cardiovasc Res. (2023) 118(17):3272–87. doi: 10.1093/cvr/cvac013
3. Wang Z, Ma L, Liu M, Fan J, Hu S, Writing Committee of the Report on Cardiovascular, H., & Diseases in, C. Summary of the 2022 report on cardiovascular health and diseases in China. Chin Med J (Engl). (2023) 136(24):2899–908. doi: 10.1097/CM9.0000000000002927
4. Conrad N, Judge A, Canoy D, Tran J, Pinho-Gomes AC, Millett ERC, et al. Temporal trends and patterns in mortality after incident heart failure: a longitudinal analysis of 86 000 individuals. JAMA Cardiol. (2019) 4(11):1102–11. doi: 10.1001/jamacardio.2019.3593
5. Hawkins NM, Virani SA, Sperrin M, Buchan IE, McMurray JJ, Krahn AD. Predicting heart failure decompensation using cardiac implantable electronic devices: a review of practices and challenges. Eur J Heart Fail. (2016) 18(8):977–86. doi: 10.1002/ejhf.458
6. Ghosh SK, Ponnalagu RN, Tripathy RK, Acharya UR. Automated detection of heart valve diseases using chirplet transform and multiclass composite classifier with PCG signals. Comput Biol Med. (2020) 118:103632. doi: 10.1016/j.compbiomed.2020.103632
7. McDonagh TA, Metra M, Adamo M, Gardner RS, Baumbach A, Bohm M, et al. Corrigendum to: 2021 ESC guidelines for the diagnosis and treatment of acute and chronic heart failure: developed by the task force for the diagnosis and treatment of acute and chronic heart failure of the European Society of Cardiology (ESC) with the special contribution of the heart failure association (HFA) of the ESC. Eur Heart J. (2021) 42(48):4901. doi: 10.1093/eurheartj/ehab670
8. Ammar KA, Jacobsen SJ, Mahoney DW, Kors JA, Redfield MM, Burnett JC Jr, et al. Prevalence and prognostic significance of heart failure stages: application of the American College of Cardiology/American Heart Association Heart Failure staging criteria in the community. Circulation. (2007) 115(12):1563–70. doi: 10.1161/CIRCULATIONAHA.106.666818
9. Goldberg LR, Jessup M. Stage B heart failure: management of asymptomatic left ventricular systolic dysfunction. Circulation. (2006) 113(24):2851–60. doi: 10.1161/CIRCULATIONAHA.105.600437
10. Jahmunah V, Oh SL, Wei JKE, Ciaccio EJ, Chua K, San TR, et al. Computer-aided diagnosis of congestive heart failure using ECG signals—a review. Phys Med. (2019) 62:95–104. doi: 10.1016/j.ejmp.2019.05.004
11. Li XC, Liu XH, Liu LB, Li SM, Wang YQ, Mead RH. Evaluation of left ventricular systolic function using synchronized analysis of heart sounds and the electrocardiogram. Heart Rhythm. (2020) 17(5 Pt B):876–80. doi: 10.1016/j.hrthm.2020.01.025
12. Adedinsewo D, Carter RE, Attia Z, Johnson P, Kashou AH, Dugan JL, et al. Artificial intelligence-enabled ECG algorithm to identify patients with left ventricular systolic dysfunction presenting to the emergency department with dyspnea. Circ Arrhythm Electrophysiol. (2020) 13(8):e008437. doi: 10.1161/CIRCEP.120.008437
13. Attia ZI, Kapa S, Lopez-Jimenez F, McKie PM, Ladewig DJ, Satam G, et al. Screening for cardiac contractile dysfunction using an artificial intelligence-enabled electrocardiogram. Nat Med. (2019) 25(1):70–4. doi: 10.1038/s41591-018-0240-2
14. Bachtiger P, Petri CF, Scott FE, Ri Park S, Kelshiker MA, Sahemey HK, et al. Point-of-care screening for heart failure with reduced ejection fraction using artificial intelligence during ECG-enabled stethoscope examination in London, UK: a prospective, observational, multicentre study. Lancet Digit Health. (2022) 4(2):e117–25. doi: 10.1016/S2589-7500(21)00256-9
15. Wang W, Hao H, Fan T, Yue J, Wang M, Chen M, et al. Predictive value of acoustic cardiography for post-PCI early ventricular remodeling in acute myocardial infarction. Sci Rep. (2023) 13(1):7192. doi: 10.1038/s41598-023-34370-x
16. Kagiyama N, Piccirilli M, Yanamala N, Shrestha S, Farjo PD, Casaclang-Verzosa G, et al. Machine learning assessment of left ventricular diastolic function based on electrocardiographic features. J Am Coll Cardiol. (2020) 76(8):930–41. doi: 10.1016/j.jacc.2020.06.061
17. Potter EL, Rodrigues CHM, Ascher DB, Abhayaratna WP, Sengupta PP, Marwick TH. Machine learning of ECG waveforms to improve selection for testing for asymptomatic left ventricular dysfunction. JACC Cardiovasc Imaging. (2021) 14(10):1904–15. doi: 10.1016/j.jcmg.2021.04.020
18. Yancy CW, Jessup M, Bozkurt B, Butler J, Casey DE Jr, Colvin MM, et al. 2017 ACC/AHA/HFSA focused update of the 2013 ACCF/AHA guideline for the management of heart failure: a report of the American College of Cardiology/American Heart Association task force on clinical practice guidelines and the Heart Failure Society of America. Circulation. (2017) 136(6):e137–61. doi: 10.1161/CIR.0000000000000509
19. Chakir F, Jilbab A, Nacir C, Hammouch A. Recognition of cardiac abnormalities from synchronized ECG and PCG signals. Phys Eng Sci Med. (2020) 43(2):673–7. doi: 10.1007/s13246-020-00875-2
20. Lee SY, Huang PW, Chiou JR, Tsou C, Liao YY, Chen JY. Electrocardiogram and phonocardiogram monitoring system for cardiac auscultation. IEEE Trans Biomed Circuits Syst. (2019) 13(6):1471–82. doi: 10.1109/TBCAS.2019.2947694
21. Li H, Wang X, Liu C, Li P, Jiao Y. Integrating multi-domain deep features of electrocardiogram and phonocardiogram for coronary artery disease detection. Comput Biol Med. (2021) 138:104914. doi: 10.1016/j.compbiomed.2021.104914
22. Zeng Y, Yang S, Yu X, Lin W, Wang W, Tong J, et al. A multimodal parallel method for left ventricular dysfunction identification based on phonocardiogram and electrocardiogram signals synchronous analysis. Math Biosci Eng. (2022) 19(9):9612–35. doi: 10.3934/mbe.2022447
23. Chen W, Zheng L, Li K, Wang Q, Liu G, Jiang Q. A novel and effective method for congestive heart failure detection and quantification using dynamic heart rate variability measurement. PLoS One. (2016) 11(11):e0165304. doi: 10.1371/journal.pone.0165304
24. Wang L, Zhou X. Detection of congestive heart failure based on LSTM-based deep network via short-term RR intervals. Sensors (Basel). (2019) 19(7):1502. doi: 10.3390/s19071502
25. Wenhui C, Guanzheng L, Su S, Qing J, Hung N. A CHF detection method based on deep learning with RR intervals. Annu Int Conf IEEE Eng Med Biol Soc. (2017) 2017:3369–72. doi: 10.1109/EMBC.2017.8037578
26. Blecker S, Katz SD, Horwitz LI, Kuperman G, Park H, Gold A, et al. Comparison of approaches for heart failure case identification from electronic health record data. JAMA Cardiol. (2016) 1(9):1014–20. doi: 10.1001/jamacardio.2016.3236
27. Evans RS, Benuzillo J, Horne BD, Lloyd JF, Bradshaw A, Budge D, et al. Automated identification and predictive tools to help identify high-risk heart failure patients: pilot evaluation. J Am Med Inform Assoc. (2016) 23(5):872–8. doi: 10.1093/jamia/ocv197
28. Zheng Y, Guo X, Yang Y, Wang H, Liao K, Qin J. Phonocardiogram transfer learning-based CatBoost model for diastolic dysfunction identification using multiple domain-specific deep feature fusion. Comput Biol Med. (2023) 156:106707. doi: 10.1016/j.compbiomed.2023.106707
29. Trabelsi I, Msolli MA, Sekma A, Fredj N, Dridi Z, Bzeouich N, et al. Value of systolic time intervals in the diagnosis of heart failure in emergency department patients with undifferentiated dyspnea. Int J Clin Pract. (2020) 74(10):e13572. doi: 10.1111/ijcp.13572
30. Burger PM, Koudstaal S, Mosterd A, Fiolet ATL, Teraa M, van der Meer MG, et al. C-reactive protein and risk of incident heart failure in patients with cardiovascular disease. J Am Coll Cardiol. (2023) 82(5):414–26. doi: 10.1016/j.jacc.2023.05.035
Keywords: heart failure, phonocardiogram, electrocardiogram, machine learning, prediction model
Citation: Bian J, Chee K-H, Liu C, Sun H, Zhang S, Chen P and Ting H-N (2025) Machine learning-based screening of heart failure using the integrated features of electrocardiogram and phonocardiogram: a multicenter study in China. Front. Cardiovasc. Med. 12:1613577. doi: 10.3389/fcvm.2025.1613577
Received: 17 April 2025; Accepted: 21 October 2025;
Published: 21 November 2025.
Edited by:
Takatoshi Kasai, Juntendo University, JapanReviewed by:
Jun Shitara, Juntendo University, JapanVishwanath Shervegar, Moodlakatte Institute of Technology Kundapura, India
Copyright: © 2025 Bian, Chee, Liu, Sun, Zhang, Chen and Ting. This is an open-access article distributed under the terms of the Creative Commons Attribution License (CC BY). The use, distribution or reproduction in other forums is permitted, provided the original author(s) and the copyright owner(s) are credited and that the original publication in this journal is cited, in accordance with accepted academic practice. No use, distribution or reproduction is permitted which does not comply with these terms.
*Correspondence: Hua-Nong Ting, dGluZ2huQG91dGxvb2suY29t